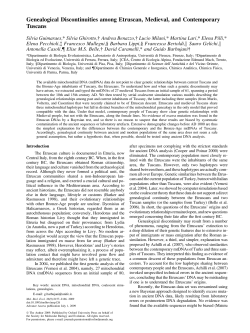
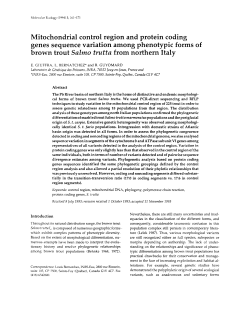
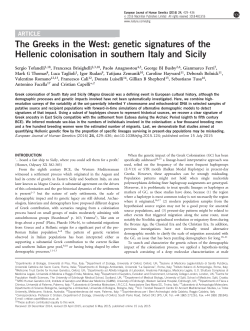
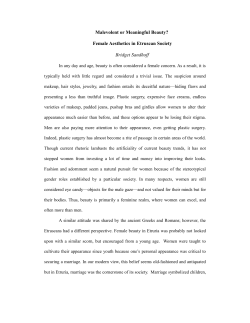
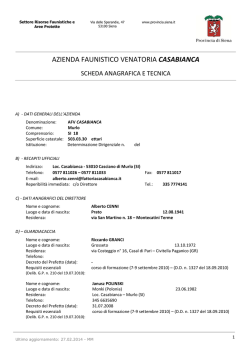
REPORT
Mitochondrial DNA Variation of Modern Tuscans Supports
the Near Eastern Origin of Etruscans
Alessandro Achilli, Anna Olivieri, Maria Pala, Ene Metspalu, Simona Fornarino, Vincenza Battaglia,
Matteo Accetturo, Ildus Kutuev, Elsa Khusnutdinova, Erwan Pennarun, Nicoletta Cerutti,
Cornelia Di Gaetano, Francesca Crobu, Domenico Palli, Giuseppe Matullo,
A. Silvana Santachiara-Benerecetti, L. Luca Cavalli-Sforza, Ornella Semino, Richard Villems,
Hans-Jürgen Bandelt, Alberto Piazza, and Antonio Torroni
The origin of the Etruscan people has been a source of major controversy for the past 2,500 years, and several hypotheses
have been proposed to explain their language and sophisticated culture, including an Aegean/Anatolian origin. To address
this issue, we analyzed the mitochondrial DNA (mtDNA) of 322 subjects from three well-defined areas of Tuscany and
compared their sequence variation with that of 55 western Eurasian populations. Interpopulation comparisons reveal
that the modern population of Murlo, a small town of Etruscan origin, is characterized by an unusually high frequency
(17.5%) of Near Eastern mtDNA haplogroups. Each of these haplogroups is represented by different haplotypes, thus
dismissing the possibility that the genetic allocation of the Murlo people is due to drift. Other Tuscan populations do
not show the same striking feature; however, overall, ∼5% of mtDNA haplotypes in Tuscany are shared exclusively
between Tuscans and Near Easterners and occupy terminal positions in the phylogeny. These findings support a direct
and rather recent genetic input from the Near East—a scenario in agreement with the Lydian origin of Etruscans. Such
a genetic contribution has been extensively diluted by admixture, but it appears that there are still locations in Tuscany,
such as Murlo, where traces of its arrival are easily detectable.
The Etruscan culture developed and prospered in the 9th
century B.C. over a region in central Italy named “Etruria”—usually referred to in Greek and Latin sources as
“Tyrrhenia.” Etruria encompassed what is now known as
“Tuscany,” “northern Latium,” and “western Umbria.” The
culture of the Etruscan people was not only extremely
advanced but also distinctively different from the cultures
of the surrounding populations of Italy. Because of this,
the origin of the Etruscan people has been a source of
controversy for the past 2,500 years, with two major scenarios being disputed. The first is that the Etruscans were
an autochthonous population of Italy; the alternative hypothesis is that they were direct descendants of an immigrant group of Aegean/Anatolian ancestry.1
Etruria was dominant in the Italian peninsula after 650
B.C., when Etruscans began to expand toward both the
north (the Po River Valley) and the south. Etruscan kings
conquered and ruled Rome for 100 years, until 509 B.C.,
when the last Etruscan king, Lucius Tarquinius Superbus,
was removed from power and the Roman Republic was
established. From that moment, the expansion period of
the Etruscans ended and was followed by a slow process
of conquest and assimilation by the Romans, which cul-
minated at the time of the “Social War” (90–88 B.C.), with
the attribution of Roman citizenship to all Etruscans. Rapidly, the Etruscan culture and language disappeared,2,3 possibly also because, in the following decades, Etrurian lands
were often distributed to Roman veterans and were partially repopulated by poor Roman citizens. However, despite a potentially extensive dilution of the ancestral Etruscan gene pool with that from surrounding Italic populations, there is no evidence that such a gene pool had been
completely replaced.4 In addition, part of the process of
initial assimilation might have been mainly male mediated, since incoming Roman veterans often married women from local communities. Thus, some populations of
modern Tuscany should have retained at least a fraction of
such an ancestral gene pool—particularly the exclusively
maternally inherited mtDNA pool—possibly at a variable
extent, given the differential degree of geographical and
genetic isolation of the different Tuscan communities during the past 25 centuries.
To evaluate the nature and extent of mtDNA variation
in modern Tuscans, the mtDNA from 322 subjects from
three areas of Tuscany was analyzed: 86 from Murlo, a
rather isolated town of Etruscan origin in the Siena prov-
From the Dipartimento di Genetica e Microbiologia, Università di Pavia, Pavia, Italy (A.A.; A.O.; M.P.; S.F.; V.B.; M.A.; A.S.S.-B.; O.S.; A.T.); Department
of Evolutionary Biology, University of Tartu and Estonian Biocentre, Tartu, Estonia (E.M.; I.K.; E.P.; R.V.); Institute of Biochemistry and Genetics, Ufa
Science Center of Russian Academy of Sciences, Ufa, Russia (I.K.; E.K.); Dipartimento di Genetica, Biologia e Biochimica, Università di Torino, Torino,
Italy (N.C.; C.D.G.; F.C.; G.M.; A.P.); Molecular and Nutritional Epidemiology Unit, Center for the Study and Prevention of Cancer–Scientific Institute
of Tuscany Region, Firenze, Italy (D.P.); Department of Genetics, Stanford University School of Medicine, Stanford (L.L.C.-S.); and Department of
Mathematics, University of Hamburg, Hamburg (H.-J.B.)
Received October 25, 2006; accepted for publication January 10, 2007; electronically published February 6, 2007.
Address for correspondence and reprints: Dr. Antonio Torroni, Dipartimento di Genetica e Microbiologia, Università di Pavia, Via Ferrata 1, 27100
Pavia, Italy. E-mail: [email protected]
Am. J. Hum. Genet. 2007;80:759–768. 䉷 2007 by The American Society of Human Genetics. All rights reserved. 0002-9297/2007/8004-0017$15.00
DOI: 10.1086/512822
www.ajhg.org
The American Journal of Human Genetics Volume 80 April 2007
759
Table 1. Frequencies of mtDNA Haplogroups in the Three Tuscan
Populations
No. (%) of Subjects by Population
Haplogroupa
H:
H*
H1
H3
H5
H6
H11
H14
H15
H19
HV0:
HV0*
HV0a
V
HV (without H/HV0):
HV*
HV1
R0:
R0a
R2:
R2*
J:
J1
J2
T:
T1
T2
U:
U1
U2e
U3
U4
U5a
U5b
U6a
U7
K1
N1:
N1b1
N1c
I
N2:
N2a
W
X:
X2
M:
M1
D4g1
Sub-Saharan L:
L3d
L1b
Murlo
(N p 86)
Volterra
(N p 114)
Casentino Valley
(N p 122)
27
14
4
5
3
1
53 (46.5)
31 (27.2)
13 (11.4)
…
3 (2.6)
1 (.9)
2 (1.8)
1 (.9)
…
2 (1.8)
7 (6.1)
3 (2.6)
1 (.9)
3 (2.6)
3 (2.6)
3 (2.6)
…
5 (4.4)
5 (4.4)
1 (.9)
1 (.9)
7 (6.1)
5 (4.4)
2 (1.8)
15 (13.2)
3 (2.6)
12 (10.5)
14 (12.3)
1 (.9)
1 (.9)
1 (.9)
4 (3.5)
2 (1.8)
…
…
1 (.9)
4 (3.5)
4 (3.5)
…
1 (.9)
3 (2.6)
…
…
…
2 (1.8)
2 (1.8)
…
…
…
3 (2.6)
3 (2.6)
…
46 (37.7)
15 (12.3)
19 (15.6)
…
8 (6.6)
…
1 (.8)
…
2 (1.6)
1 (.8)
5 (4.1)
1 (.8)
…
4 (3.3)
7 (5.7)
6 (4.9)
1 (.8)
2 (1.6)
2 (1.6)
…
…
4 (3.3)
2 (1.6)
2 (1.6)
13 (10.7)
4 (3.3)
9 (7.4)
29 (23.8)
…
1 (.8)
3 (2.5)
1 (.8)
2 (1.6)
6 (4.9)
1 (.8)
3 (2.5)
12 (9.8)
2 (1.6)
1 (.8)
1 (.8)
…
7 (5.7)
1 (.8)
6 (4.9)
3 (2.5)
3 (2.5)
2 (1.6)
2 (1.6)
…
2 (1.6)
1 (.8)
1 (.8)
5
1
1
3
6
5
1
1
1
7
6
1
8
1
7
26
1
5
5
1
3
1
4
6
1
1
3
3
1
1
1
1
(31.4)
(16.3)
(4.7)
(5.8)
(3.5)
(1.2)
…
…
…
…
(5.8)
(1.2)
(1.2)
(3.5)
(7.0)
(5.8)
(1.2)
(1.2)
(1.2)
…
…
(8.1)
(7.0)
(1.2)
(9.3)
(1.2)
(8.1)
(30.2)
(1.2)
(5.8)
(5.8)
(1.2)
(3.5)
…
(1.2)
(4.7)
(7.0)
…
…
…
…
(1.2)
…
(1.2)
(3.5)
(3.5)
(1.2)
…
(1.2)
(1.2)
(1.2)
…
Total
(N p 322)
126
60
36
5
14
2
3
1
2
3
17
5
2
10
16
14
2
8
8
1
1
18
13
5
36
8
28
69
2
7
9
6
7
6
2
8
22
6
1
2
3
8
1
7
8
8
3
2
1
6
5
1
(39.1)
(18.6)
(11.2)
(1.6)
(4.3)
(.6)
(.9)
(.3)
(.6)
(.9)
(5.3)
(1.6)
(.6)
(3.1)
(5.0)
(4.3)
(.6)
(2.5)
(2.5)
(.3)
(.3)
(5.6)
(4.0)
(1.6)
(11.2)
(2.5)
(8.7)
(21.4)
(.6)
(2.2)
(2.8)
(1.9)
(2.2)
(1.9)
(.6)
(2.5)
(6.8)
(1.9)
(.3)
(.6)
(.9)
(2.5)
(.3)
(2.2)
(2.5)
(2.5)
(.9)
(.6)
(.3)
(1.9)
(1.6)
(.3)
a
HV0, HV0*, HV0a, R0, and R0a replace pre-V, pre*V1, pre*V2, pre-HV, and (preHV)1, respectively.
Table 2. Absolute Frequencies of mtDNA
Haplogroups and Subhaplogroups in the 58
Populations Included in the PCA
The table is available in its entirety in the online
edition of The American Journal of Human Genetics.
ince; 114 from Volterra, a former major Etruscan city in
the province of Pisa; and 122 from the Casentino Valley
in the province of Arezzo, which was part of historical
Etruria.
mtDNA profiles in the three populations were determined by sequencing ∼750 bp from the control region
for each subject (from nucleotide position [np] 16024 to
np 210, thus including the entire hypervariable segment
[HVS]–I [nps 16024–16383] and part of the HVS-II [nps
57–372]). This was followed by a hierarchical survey of
haplogroup and subhaplogroup diagnostic markers in the
coding region,5 which allowed the classification of mtDNAs
into 39 haplogroups (table 1). Most haplogroups that are
typical of modern European populations are present,6–8
and a few East Asian (D4g1)9 and sub-Saharan African (L3d
and L1b)10 mtDNAs were also detected. This latter finding
is not unexpected, since low frequencies of African and
even East Asian mtDNAs are not uncommon in populations of southern Europe. However, what was not anticipated was the relatively high frequency, especially in the
Murlo sample, of haplogroup HV lineages that are non-H
and non-HV0, as well as haplogroups R0a (formerly known
as “(pre-HV)1”)11 and U7 and U3, which are typical of Near
Eastern populations.
To determine whether the overall haplogroup frequencies in the Tuscan population samples were indeed different from those of other Italian or European populations,
we compared haplogroup distributions in the three Tuscan
populations (table 1) with those of 55 western Eurasian
populations (including 7 from other Italian regions) (table
2), by using principal-component analysis (PCA)—a dimension-reduction method that seeks to explain the variance of multivariate data by a smaller number of variables
(the principal components [PCs]), which are linear func-
Figure 1. Four-dimensional region-based PCA of mtDNA haplogroup profiles in Europe and the Near East. Haplogroups and subhaplogroups included in the PCA are as follows: H (excluding H5), H5, HV0 (including HV0*, HV0a, and V), HV (including HV1 but excluding
H and HV0), R0a, U1, U2, U3, U4, U5a, U5b, U6, U7, U8, K, U* (represented mainly by U9), J, T1, T2, X, N1 (represented mainly by
I), N2 (represented mainly by W), M, and sub-Saharan L. The size of the circles represents the remaining axes (4–24) and is inversely
proportional to the error associated with the projection of each population on the first three PCs.13 The numbers of subjects and
haplogroup frequencies for each population are provided in table 2.
www.ajhg.org
The American Journal of Human Genetics Volume 80 April 2007
761
tions of the original variables—in this case, the haplogroup frequencies.12 After reducing the variables (haplogroups) to PCs, we reported the coordinates of the observations for the 58 populations in a four-dimensional
graphic representing the genetic landscape of western Eurasia (fig. 1). We observed that the first PC is primarily eastwest, separating Europeans from Near Easterners, and it
accounts for 22% of the variation. The Basque country
falls at one pole, Iran at the other. Such a strong geographical pattern, with the Near Easterners forming a well-defined group and the eastern and central Mediterranean
populations of Europe as their most closely related neighbors, is in perfect agreement with the patterns reported
elsewhere for both classical12 and mtDNA and Y-chromosome markers.14 The second PC accounts for 12% of the
variation and appears to be determined mainly by the
variation within the Near East and the Caucasus on one
side, whereas, on the European side, it reveals a southwestnortheast pattern, with Iberian populations at one end
and northeastern Europe at the other.
As for the population samples from Tuscany, both the
first and second PC place Volterra and the Casentino Valley
in the central Mediterranean area, together with most of
the other Italian samples. In contrast, Murlo is placed relatively close to the Near Eastern populations. This peculiar
location of Murlo is also maintained overall by including
additional PCs (fig. 1). Interestingly, the third PC indicates
that the modern population of Lemnos is an outlier in
the genetic landscape, with particular features distinguish-
ing it from both modern European and Near Eastern populations. It is worth mentioning (1) that Lemnos is the
island in the northern Aegean Sea that was indicated
by Hellanicus of Lesbos (5th century B.C.) as a possible
homeland of a group of Pelasgians who arrived in Italy
and gave rise to the Tyrrhenians and (2) that a stele—
dated ∼600 B.C.—found on Lemnos contains inscriptions
in a language similar to Etruscan.15 However, like many
small islands, Lemnos must have undergone much more
drift than did villages like Murlo that are located in a
densely populated region, as well as many more warring
events.
The contribution of each haplogroup to the first and
second PC, in the analysis shown in figure 1, is illustrated
in figure 2. Haplogroups H (in western Europe, comprising
mainly H1 and H3), HV0 (formerly known as “pre-V”),
and U5b are concentrated at the European pole, which
confirms the major role played by the Franco-Cantabrian
refuge area in the recolonization of Europe after the Last
Glacial Maximum.16 At the other pole—the one where
Murlo is located, with the populations from the Near
East—the remainder (HV* plus HV1) of haplogroup HV
and haplogroups R0a, U7, and U3 are the major contributors, and the absolute frequencies of three of these (HV
without H and HV0, R0a, and U7) differ significantly (P !
.01) when Tuscans, Europeans (not including Tuscans), and
non-Europeans are compared (table 3). Moreover, in contrast to in Europeans (not including Tuscans), the frequencies of these three haplogroups in Tuscans and non-
Figure 2. Plot of the contribution of each haplogroup to the first and second PC (projections of the axes of the original variables)
in the analysis of figure 1.
762
The American Journal of Human Genetics Volume 80 April 2007
www.ajhg.org
Figure 3. Geographical locations of populations surveyed for R0a, HV (without H and HV0), U7, and U3 mtDNAs and their spatial
frequency distributions. Frequency maps of haplogroups were obtained using Surfer version 6.04 (Golden Software), with the Kriging
procedure, and estimates at each grid node were inferred by considering the entire data set. Etruria and the island of Lemnos (top)
are indicated in yellow and red, respectively. Frequency values for populations 1–58 are from table 2, whereas those for populations
59–69 are as follows: 59 from the present study and the work of Plaza et al.17; 60 and 64 from the work of Quintana-Murci et al.18; 61
from the present study and the work of Richards et al.7; 62, 65–67, and 69 from the present study; 63 from the present study and the
work of Plaza et al.17; and 68 from the work of Fadhlaoui-Zid et al.19
764
Figure 4. Tree of the 209 mtDNA haplotypes observed among the 322 Tuscans (GenBank accession numbers EF026248–EF026569), subdivided according to their origin. This tree
was constructed manually by comparison with the available mtDNA data sets and the basal Eurasian mtDNA classification trees.8–11,16 Haplotypes (from np 16024 to np 210) are 53
from Murlo, 59 from Volterra, 78 from the Casentino Valley, and 19 that are shared by at least two of the Tuscan groups. Haplogroups and subhaplogroups are indicated in red. The
numbers on the connecting branches refer to the revised reference sequence (rCRS)20 and indicate either mutations from the sequence range or haplogroup diagnostic sites (red)
outside that range. Mutations are transitions unless the base change is explicitly indicated. Insertions are suffixed with a plus sign (⫹) and the inserted nucleotide, and deletions
have a “d” suffix. Heteroplasmic positions are indicated by an “h” after the nucleotide position.
765
Figure 5. Haplotypes found in Tuscany and shared exclusively with Near Eastern populations. Shared haplotypes are shown in different colors. Near East areas where the matching
haplotypes were detected are illustrated on the map (inset) by colored circles. A group of six related R0a mtDNAs with the basic motif 16126-16230-16362, as well as two HV
mtDNAs with the motif 16172-16311-16352, were found only in Tuscans (black). For additional information, see the legend of figure 4.
Table 3. x2 Analysis of Absolute Frequencies
in Tuscans, Europeans (without Tuscans), and
Non-Europeans
Comparison
Tuscans and Europeans
Europeans and non-Europeans
All three groups
x2 Value (df)
Pa
144 (24)
2,070 (24)
2,144 (48)
!.01
K.01
K.01
a
Statistical significance was established at a ⭐ .05;
the P values were adjusted for multiple tests by use of
the (conservative) Bonferroni correction.
Europeans are both higher than expected (table 4). The
spatial distribution of haplogroups HV without H and
HV0, R0a, U7, and U3 in an overall frequency map that
encompasses western Eurasia and North Africa is illustrated in figure 3. This figure reveals that, for all of these
haplogroups, there is a frequency peak in the Near East,
thus explaining the major contributing role of these four
haplogroups in the PCA. However, in all cases, Tuscany
was found to harbor a secondary frequency peak, which
often neatly distinguishes this Italian region not only from
the rest of Europe but also from the surrounding regions
of the Italian peninsula. Haplotype diversity (fig. 4) indicates that these peaks—in contrast to those observed,
for instance, in northeastern Spain for U3 or in Ireland
and Wales for HV (fig. 3)—cannot be attributed to genetic
drift and/or founder events.
After evaluating interpopulation relationships at the haplogroup level, we moved to a different level of resolution—
that of haplotypes. We compared the 209 control-region
haplotypes found in the three Tuscan groups, whose phylogenetic relationships are illustrated in the trees of figures
4 and 5, with a data set of 15,328 control-region sequences
that are representative of a wide range of western Eurasian
populations (table 2). This survey revealed 11 haplotypes/
motifs (∼5%) (in color in the tree of fig. 5) that belong to
different haplogroups (H, R0a, U1b, U7, J1d, and T1a) that
are shared between Tuscans and Near Eastern populations
but are absent in a total of 10,589 mtDNAs from Europe,
including 2,311 mtDNAs from Italy. All others, except two
related R0a haplotypes and one HV haplotype that were
seen only in Tuscans (fig. 5), were shared either with at
least one European population or with both European and
Near Eastern populations. One of the H motifs (16145–
16227), shared exclusively between Tuscans (two from Volterra and one from the Casentino Valley) and Near Easterners (one Turk, one Jordanian, and one Syrian), appears
to define a novel subhaplogroup, named “H19.” The corresponding six HVS-I sequences sharing this motif are
identical. This suggests that, if the motif 16145–16227
arose in the Near East, its arrival in Tuscany is recent.
Similarly, ages of the other 10 shared haplotypes cannot
be reasonably estimated. However, all occupy terminal positions in the tree of figure 5, indicating a rather recent
occurrence among Tuscans.
It is worth noting that such an extent of exclusive haplotype sharing between Tuscans and Near Eastern popula-
766
tions is more than threefold higher than that observed in
a total of 314 HVS-I haplotypes from the Marche region—
a neighboring region of central Italy located just across
the Apennines—which, however, was never inhabited or
conquered by the Etruscans.
The extensive haplotype sharing between Tuscans and
other western Eurasian populations—including a detectable amount with only Levantine populations—strongly
contrasts with the results obtained by comparing the
haplotypes found in Tuscans with the 23 haplotypes detected in the skeletal remains of 28 Etruscans.21 The latter
comparison reveals only three matches (CRS, 16261, and
16311). When the Etruscan haplotypes are instead compared with 2,311 Italian mtDNAs, seven matches are observed (CRS, 16126, 16129, 16223, 16261, 16311, and
16189–16356), apparently reaching a plateau, since they
remain the same when the counterpart is represented by
15,328 western Eurasian mtDNAs. Thus, ∼70% of the recorded Etruscan haplotypes do not fit anywhere in the
mtDNA landscape of western Eurasia—a result that is difficult to explain. Given the fact that the matched haplotypes are the simplest in terms of number of mutations
(generally one nucleotide difference from the reference
sequence), a likely explanation is that postmortem DNA
modifications and/or technical problems22,23 affected the
Etruscan mtDNA sequences.24,25 Such a scenario not only
makes it unlikely that models and simulations based on
such data26 will provide new clues on the origin of Etruscans, but it also raises the possibility that ancient mtDNA
data, unless associated with clear-cut phylogeographic signals,27 may be more misleading than clarifying in studies
concerning the prehistory of regional populations.
Analysis of the maternally inherited mtDNA, which,
in the case of Etruria, is probably the most appropriate
tool for evaluation of genetic continuity between Etruscans and modern Tuscans, places Murlo close to Near Eastern populations because of an unusually high frequency
(17.5%) of Near Eastern haplogroups (HV, R0a, U7, and
Table 4. Results of “x2 by Cell” Test
Comparing All Three Groups
Haplogroup
Population
HV
R0a
U7
Tuscans
Europeans (without Tuscans)
Non-Europeans
⫹
⫺
⫹
⫹
⫺
⫹
⫹
⫺
⫹
NOTE.—The “x2 by Cell” test was performed using
Xlstat software. It is a x2 test calculated on a table
with four cells: one cell represents cell [i,j] in the
original contingency table, the other cells represent frequencies for row i minus cell [i,j], for column j minus cell [i,j], and for the rest of the table.
Significance was established at a ⭐ .05, with use
of the Bonferroni correction for multiple testing.
A plus sign (⫹) indicates that the observed frequency was higher than the expected frequency; a
minus sign (⫺) indicates that the observed frequency was less than the expected frequency.
The American Journal of Human Genetics Volume 80 April 2007
www.ajhg.org
U3). Moreover, this allocation cannot be explained by genetic drift, since each of these haplogroups is represented
by several different haplotypes. Finally, 5.3% of the haplotypes observed in Tuscany—all occupying terminal positions in the phylogeny—are found elsewhere only in
Levantine populations. This distribution suggests a recent
and direct link between Tuscany and the Near East—a link
not mediated by either geographically intermediate European populations or surrounding Italian populations.
Overall, these mtDNA data and others from different
organisms28 support the scenario of a post-Neolithic genetic input from the Near East to the present-day popwulation of Tuscany, a scenario that is in agreement with
an Anatolian origin of Etruscans.2 Traces of this relatively
recent arrival from the Near East are still detectable in
Tuscany, despite extensive dilution by admixture with
both native and surrounding Italic populations and later
immigration.
Acknowledgments
This research received support from Estonian Science Foundation
grant 5807 (to E.M.), the European Commission grant QLG2_CT2002-90455 (to R.V.), Progetti Ricerca Interesse Nazionale 2003
and 2005 (Italian Ministry of the University) (to A.P. and A.T.),
Ministero degli Affari Esteri (to O.S.), Compagnia di San Paolo
(to O.S. and A.T.), and Fondazione Cariplo (to A.T.). We are grateful to all the donors for providing blood samples and to the people
who contributed to their collection. In particular, we are grateful
to the people of Murlo for their enthusiastic participation, to
Agnese Brega, and to the local staff of Associazione Volontari
Italiani Sangue for the collection of the Volterra sample.
Web Resource
Accession numbers and the URL for data presented herein are
as follows:
GenBank, http://www.ncbi.nlm.nih.gov/Genbank/ (for the
Tuscan mtDNA control-region sequences [accession numbers
EF026248–EF026569])
References
1. Beekes RSP (2003) The origins of the Etruscans. Nederlandse
Akademie van Wetenschappen, Amsterdam
2. Barker G, Rasmussen T (1998) The Etruscans. Blackwell, Oxford, United Kingdom
3. Rasmussen T (2004) Urbanization in Etruria. In: Osborne R,
Cunliffe B (eds) Mediterranean urbanization 800–600 BC. Oxford University Press, Oxford, United Kingdom
4. Piazza A, Cappello N, Olivetti E, Rendine S (1988) A genetic
history of Italy. Ann Hum Genet 52:203–213
5. Carelli V, Achilli A, Valentino ML, Rengo C, Semino O, Pala
M, Olivieri A, Mattiazzi M, Pallotti F, Carrara F, et al (2006)
Haplogroup effect and recombination of mitochondrial DNA:
novel clues from the analysis of Leber hereditary optic neuropathy pedigrees. Am J Hum Genet 78:564–574
6. Torroni A, Huoponen K, Francalacci P, Petrozzi M, Morelli L,
Scozzari R, Obinu D, Savontaus M-L, Wallace DC (1996) Classification of European mtDNAs from an analysis of three European populations. Genetics 144:1835–1850
www.ajhg.org
7. Richards M, Macaulay V, Hickey E, Vega E, Sykes B, Guida V,
Rengo C, Sellitto D, Cruciani F, Kivisild T, et al (2000) Tracing
European founder lineages in the Near Eastern mtDNA pool.
Am J Hum Genet 67:1251–1276
8. Palanichamy Mg, Sun C, Agrawal S, Bandelt H-J, Kong Q-P,
Khan F, Wang C-Y, Chaudhuri TK, Palla V, Zhang Y-P (2004)
Phylogeny of mitochondrial DNA macrohaplogroup N in India, based on complete sequencing: implications for the peopling of South Asia. Am J Hum Genet 75:966–978
9. Kong Q-P, Bandelt H-J, Sun C, Yao Y-G, Salas A, Achilli A,
Wang C-Y, Zhong L, Zhu CL, Wu S-F, et al (2006) Updating
the East Asian mtDNA phylogeny: a prerequisite for the identification of pathogenic mutations. Hum Mol Genet 15:2076–
2086
10. Kivisild T, Shen P, Wall DP, Do B, Sung R, Davis K, Passarino
G, Underhill PA, Scharfe C, Torroni A, et al (2006) The role
of selection in the evolution of human mitochondrial genomes. Genetics 172:373–387
11. Torroni A, Achilli A, Macaulay V, Richards M, Bandelt H-J
(2006) Harvesting the fruit of the human mtDNA tree. Trends
Genet 22:339–345
12. Cavalli-Sforza LL, Piazza A, Menozzi P (1994) The history and
geography of human genes. Princeton University Press, Princeton, NJ
13. Guglielmino CR, Piazza A, Menozzi P, Cavalli-Sforza LL (1990)
Uralic genes in Europe. Am J Phys Anthropol 83:57–68
14. Richards M, Macaulay V, Torroni A, Bandelt H-J (2002) In
search of geographical patterns in European mitochondrial
DNA. Am J Hum Genet 71:1168–1174
15. Bonfante G, Bonfante L (2002) The Etruscan language: an introduction. Manchester University Press, Manchester, United
Kingdom
16. Achilli A, Rengo C, Magri C, Battaglia V, Olivieri A, Scozzari
R, Cruciani F, Zeviani M, Briem E, Carelli V, et al (2004) The
molecular dissection of mtDNA haplogroup H confirms that
the Franco-Cantabrian glacial refuge was a major source for
the European gene pool. Am J Hum Genet 75:910–918
17. Plaza S, Calafell F, Helal A, Bouzerna N, Lefranc G, Bertranpetit J, Comas D (2003) Joining the pillars of Hercules:
mtDNA sequences show multidirectional gene flow in the
western Mediterranean. Ann Hum Genet 67:312–328
18. Quintana-Murci L, Chaix R, Wells RS, Behar DM, Sayar H,
Scozzari R, Rengo C, Al-Zahery N, Semino O, SantachiaraBenerecetti AS, et al (2004) Where west meets east: the complex mtDNA landscape of the southwest and Central Asian
corridor. Am J Hum Genet 74:827–845
19. Fadhlaoui-Zid K, Plaza S, Calafell F, Ben Amor M, Comas D,
Bennamar El gaaied A (2004) Mitochondrial DNA heterogeneity in Tunisian Berbers. Ann Hum Genet 68:222–233
20. Andrews RM, Kubacka I, Chinnery PF, Lightowlers RN, Turnbull DM, Howell N (1999) Reanalysis and revision of the Cambridge reference sequence for human mitochondrial DNA.
Nat Genet 23:147
21. Vernesi C, Caramelli D, Dupanloup I, Bertorelle G, Lari M,
Cappellini E, Moggi-Cecchi J, Chiarelli B, Castri L, Casoli A,
et al (2004) The Etruscans: a population-genetic study. Am J
Hum Genet 74:694–704
22. Bandelt H-J (2005) Mosaics of ancient mitochondrial DNA:
positive indicators of non-authenticity. Eur J Hum Genet 13:
1106–1112
23. Bandelt H-J, Kivisild T, Parik J, Villems R, Bravi C, Yao Y-G,
Brandstätter A, Parson W (2006) Lab-specific mutation pro-
The American Journal of Human Genetics Volume 80 April 2007
767
cesses. In: Bandelt H-J, Macaulay V, Richards M (eds) Human
mitochondrial DNA and the evolution of Homo sapiens.
Springer-Verlag, Berlin-Heidelberg, pp 117–140
24. Bandelt H-J (2004) Etruscan artifacts. Am J Hum Genet 75:
919–920
25. Malyarchuk BA, Rogozin IB (2004) On the Etruscan mitochondrial DNA contribution to modern humans. Am J Hum
Genet 75:920–923
26. Belle EM, Ramakrishnan U, Mountain JL, Barbujani G (2006)
Serial coalescent simulations suggest a weak genealogical re-
768
lationship between Etruscans and modern Tuscans. Proc Natl
Acad Sci USA 103:8012–8017
27. Haak W, Forster P, Bramanti B, Matsumura S, Brandt G, Tanzer
M, Villems R, Renfrew C, Gronenborn D, Alt KW, et al (2005)
Ancient DNA from the first European farmers in 7500-yearold Neolithic sites. Science 310:1016–1018
28. Pellecchia M, Negrini R, Colli L, Patrini M, Milanesi E, Achilli
A, Bertorelle G, Cavalli-Sforza LL, Piazza A, Torroni A, et al.
The mystery of Etruscan origin: novel clues from Bos taurus
mitochondrial DNA. Proc Biol Sci (in press)
The American Journal of Human Genetics Volume 80 April 2007
www.ajhg.org
© Copyright 2026 Paperzz