MŰHELYTANULMÁNYOK
DISCUSSION PAPERS
MT-DP – 2009/19
Firms and Products in International Trade:
Data and Patterns for Hungary
GÁBOR BÉKÉS - PÉTER HARASZTOSI - BALÁZS MURAKÖZY
INSTITUTE OF ECONOMICS, HUNGARIAN ACADEMY OF SCIENCES
BUDAPEST, 2009
Discussion papers
MT-DP – 2009/19
Institute of Economics, Hungarian Academy of Sciences
KTI/IE Discussion Papers are circulated to promote discussion and provoque comments.
Any references to discussion papers should clearly state that the paper is preliminary.
Materials published in this series may subject to further publication.
Firms and Products in International Trade:
Data and Patterns for Hungary
Authors:
Gábor Békés
research fellow
Institute of Economics - Hungarian Academy of Sciences
E-mail: [email protected]
Péter Harasztosi
Phd Student
Central Europan University
[email protected]
Balázs Muraközy
research fellow
Institute of Economics - Hungarian Academy of Sciences
E-mail: [email protected]
October 2009
ISBN 978 963 9796 77 5
ISSN 1785 377X
Firms and Products in International Trade:
Data and Patterns for Hungary
Gábor Békés – Péter Harasztosi – Balázs Muraközy
Abstract
This paper provides a detailed description of Hungarian trade data and key patters
drawn at the firm and product level. The IEHAS-CEFiG Hungary dataset is an almost
universal panel of balance sheet information (1992-2006) merged with firmproductcountry level customs data (1992-2003) taken until the 2004 EU accession.
In the Bernard et al. (2007) tradition, statistics describe the prevalence of trading
activity, typology of firms by internationalisation, concentration of trade volume
within and across sectors as well as geographical features of activities. The aim of this
paper is both to offer background statistics to existing studies and to stimulate future
research on firms and trade by offering a great deal of descriptive statistics.
After describing datasets, the prevalence of trading activity across sectors,
concentration of trading volume across and within sectors, spatial distribution on
trade and principal trading partners are described. Stylised facts show that trading
activity is heavily concentrated, both exporters and importers show better
performance than non-traders, and multi-product and multi-county firms are
responsible for the bulk of trade volume.
Keywords: international trade, exporting, firm-product level data
JEL: F23, F14, D21, R12, R30
Vállalatok és termékek a nemzetközi
kereskedelemben: hazai minták és adatok
Békés Gábor – Harasztosi Péter – Muraközy Balázs
Összefoglaló
A tanulmány a KTI-CEFIG magyarországi cég- és termékszintű adatbázisa alapján
mutatja be a magyar külkereskedelem legfontosabb szerkezeti jellemzőit. Az adatbázis
alapja az 1992 és 2006 közötti éves APEH-mérlegekre épülő majdnem teljes körű
vállalati panel adatbázis, és a vállalat-termék-ország felbontású vámstasztika, amely az
EU-csatlakozás előtti évekre érhető el. Bernard és szerzőtársai tradícióját követve a
leíró statisztikák bemutatják a vállalatok és a külkereskedelmi aktivitás jellemzőit, az
export- és az importteljesítmény iparági és iparágakon belüli koncentrációját, illetve a
kereskedelmi tevékenység földrajzi megoszlását. Célja, hogy a meglévő tanulmányok
mellé részletes leíró statisztikákat biztosítson, illetve empirikus mintákat, ötleteket
adjon jövőbeni kutatási tervekhez. A tanulmány bemutatja az adatbázis összeállítását, a
külkereskedelemben aktív cégek jellemzőit, a külkereskedelem iparági és területi
koncentrációját, illetve a termékek és a partnerországok megoszlását. A magyarországi
adatok alapján elmondható például, hogy a külkereskedelmi tevékenyég jelentős részét
viszonylag
kis
számú
cég
végzi,
az
exportáló
és
az
importáló
vállalatok
termelékenyebbek a külkereskedelemben inaktív cégekhez képest, és a kivitel jelentős
részét több terméket több országba exportáló cégek adják.
Tárgyszavak: külkereskedelem, export, cég- és termékszintű adatbázis
JEL: F23, F14, D21, R12, R30
1
Introduction
In the past decade, the appearance of firm level datasets allowed micro-level
statistical examination of international trade. Datasets from the US (Bernard
et al. 2007), France (Eaton et al. 2005), Italy (Castellani et al. 2008), Belgium
(Muûls & Pisu 2007) or Columbia (Eaton et al. 2007) all described the patterns
of international trade at the firm level. Empirical trade research based on
firm level data point towards the importance of firm heterogeneity and the
exceptional performance of the exporting and importing firms, see e.g. Mayer
& Ottaviano (2008).
Hungarian data have also been used recently, and this paper is aimed at introducing the key features of the data as well as basic description of the most
important patterns of international trade and establishing stylised facts on
heterogenous trading firms in Hungary.
The IEHAS-CEFiG Hungary dataset 2 is compiled with the purpose of investigating international trade at the firm level. Balance sheet and customs
information for the period 1992-2003 are merged with a firm-product-country
panel of manufacturing trade observations. This note is to provide descriptive
statistics on this comprehensive dataset focusing on international trade related phenomena: prevalence of trading activity, concentration of trade volume
within and across sectors and over space. Furthermore, we give basic inference
about the variety of trading partner countries and product categories.
Two datasets from different sources are merged. The first dataset is from the
Hungarian Tax Authority (APEH) containing an almost universal sample of
firms with double-entry bookkeeping. Data include common balance sheet and
income statement information such as output, labour, capital or ownership.
Balance sheet data are available for the whole economy. The customs data
cover complete set of transactions from 1992-2003 taken until Hungary’s EU
accession in 2004.The observation is an aggregate of shipments at economic
entity-destination-product level of export or import naming the country of
destination or origin, the value and its physical quantity and product category.
Customs data are available for goods (and not services). Importantly, the
customs data allowed creating firm-level descriptive variables of trade volume,
diversity of trading partners and that of products. These aggregate firm level
variables were than directly merged with the balance sheet data.
Manufacturing plays a dominant role in both import and export activity
by volume, therefore this discussion focuses on the manufacturing sector.
2 The
dataset is used for example in Halpern et al. (2005), Altomonte & Békés
(2009), Békés & Muraközy (2008), Csillag & Koren (2009), Békés & Harasztosi
(2009), Görg et al. (2008)
3
Throughout the paper, we use the following approach to Tables and Statistics.
The year 1999 is picked as reference point to describe cross-sectoral distribution of any phenomena; while these tables for 1999 are displayed in the text,
time-series of the descriptive statistics will be available in the Appendix.
The rest of the paper is structured as follows. In Section 2, first we describe
the two datasets separately and the procedure of merging. Section 3 gives a
portrait of trading firms: in 3.1 the prevalence of trading activity across sectors is discussed, part 3.2 investigates how trading firms are different from
non-trading firms in terms of key characteristics. Part 3.3 describes the concentration of trading volume across and within sectors. Further, the basic
picture on the spatial distribution on trade volume is described. In Section
4 the distribution of the number of traded products are discussed. Using the
customs data part 4.2 presents a broader picture on the Hungarian trade regarding products principal trading partners. Finally, some key stylised facts
are summarised.
2
Constructing the Dataset
In this section we explain in detail how the IEHAS-CEFiG Hungary dataset
was constructed: describing both the source dataset and the procedure of
merging.
2.1 The source datasets
The balance sheet database is based on information collected by the Hungarian Tax authority (APEH). It contains information on double entry book
keeping firms from 1992 to 2006. The list of key variables include: annual average employment, net value of sales and export sales, fixed assets, wage bill,
financial assets, costs of goods and materials. Also, we have information on
ownership, as the equity share of the public sector, domestic private sector
and foreign owners are given. Firms’ sectoral categorisation is identified at
four-digit NACE categories (of 1996). The location of the headquarter of the
firm is available at municipal level along with its post code, and this allows to
describe data spatially at any level of NUTS classification.
The firm level custom dataset is collected by the Hungarian Statistical Office. The dataset is assembled from the customs declarations that economic
agents fill out in case they export or import. These account for all transactions
entering or leaving Hungary with the special trade approach which excludes
4
goods stored unaltered in bounded warehouse and duty free zones. 3 In the
database yearly trade volumes are reported at destination-firm-product-level.
The goods are categorised by the Hungarian Nomenclature of product of 9
digits, which is up-to six digits is equivalent with the Harmonised System categories. As this information is not fully available for us in every year, in this
study we will regard each HS6 category as separate product.
The destination or origin of the transaction is labelled by two-letter UN country classification, taking the geopolitical changes of the sample period into
account. The values of export are calculated as free on board and the imports
are accounted for on cost, insurance freight value in both USD and HUF
terms. We are also have information on the physical quantity of an observational unit and its unit of measurement given by the guidelines of Combined
Nomenclature. Each observation entails an entity identifier, which is congruent with that of the balance sheet database and which facilitates the merger
of the data.
We have no information regarding either the actual APEH id or the name of
firms.
2.2 Data Cleaning
Some basic cleaning of the APEH dataset was carried out to clean the data
of obvious errors. Typos and outliers (such as the use of million instead of
thousands, lack of commas, etc.) in wage and employment data were corrected
for by looking for abnormally higher than sectoral average changes.
One or two consecutive years of missing information about the sectoral classification of the firm at 4 digit NACE level was corrected for the following way.
Gaps were filled with classification of the pre-gap and after-gap classification
if those were congruent. Other single gaps were filled with pre-gap observations, unless they were the first observations of a firm. In that case post-gap
information was used.
One or two consecutive year gaps of sales, employment, fixed assets, average
wage , material cost and foreign share information were filled in with the linear
increment suggested by the difference of the pre and post-gap existing information. In case of these variable only single or double gaps were filled where
both adjacent information were available. Other gaps were left unaltered.
Of course, users of the data may have added further cleaning depending on
3 Further
exclusions are: currency, monetary gold, temporarily used machinery,
goods shipped for repairs, international aids, military shipments. From 1997 on
only the shipments from duty free zones to abroad were accounted for, those to
within Hungary not.
5
particular usage.
2.3 Merger
In order to merge datasets at the firm level, firm-year level aggregates were
created such as value of trade in millions of HUF, the number of trading
partner countries and the number of traded varieties both for importing and
exporting for a given firm. Given the transformation of the customs data, it
can be merged to the balance-sheet panel by year and the identifier.
In sum, 26 percent of the export observations (entity-year) and 32 percent
of the import observations were not matched for two reasons. First, after the
merger firm-year observations that were not originally available in the APEH
dataset were dropped. In case of exports this implied on average yearly 5000
observations, showing stability over time. The share of export value dropped
in 1992 and 1993 constitute 19% and 14% of the customs export, while in
the later years this share is only 3-5%. In case of imports on average 10000
observations are dropped yearly. Similarly to imports in 1992 and 1993 the
share of unmatched volume was higher than in later years, being 23 and 19
percent respectively, but only 3 to 5 percents afterwards.
The second discrepancy stems form exporter and importer entities that were
not obliged to have double book-keeping by the Act on Accounting in effect
of the period. This also implies, that by keeping observations present in the
APEH data only, we can be more certain, that observations about export and
import remaining in IEHAS-CEFiG refer to proper firms.
In this study we use trade information obtained from the customs statistics.
Therefore we implicitly assume, that firm that show positive exports in the
APEH dataset, but do not appear in the customs data do not trade. That
is, we will evaluate exporter status and export volume as suggested by the
customs data. This way exporting and importing is handled with the same
methodology.
2.4 The scope of the IEHAS-CEFiG dataset
Having merged the datasets, a panel ranging from 1992 to 2006 containing
1,246,925 firm-year observations with trade related information until 2003 was
obtained. The number of observations ranges from 54 to 136 thousand yearly,
as represented by Figure 1.
The sharp drop observed after 1999 is due to the change in the sampling rules
used by the data collector. The change affects the sampling of the firms with
6
less than 5 employee, who thus become underrepresented. The average firm
size in terms of employment doubles from 1999 to 2000, from 15 to 30, also
total employment in the sample drops only with 7 percent from 1999 to 2000
in the data. The effect of the gap on the trade related inference is minuscule as
almost all trading firms are accounted for. Firms with less than million dollars
of export are missing after 1999. As less than one percent of 1999 exporters are
such firms, this discrepancy can be regarded a minor one. However, it might
affect the time-series nature of the data.
54848
60939
66770
64285
67102
64825
136092
64413
132916
123013
108486
93580
81688
70105
0
50000
57863
num. obs.
100000
150000
Fig. 1. Number of firms by years
1991
1993
1995
1997
1999
Year
2001
2003
2005
2007
The graph shows the yearly number of observations in the IEHASCEFiG dataset. The red line represents the change in the sampling
procedure from 1999 to 2000.
The cross sectoral distribution of observations shows that more than 70% of
firms are in NACE chapters of Manufacturing, Wholesale and retail trade and
in Real estate & renting and business activities. These sectors represent on
average 63% of total employment. The relative shares of chapters are stable
over time as Table 12 (in the appendix) summarising the employment shares
of the NACE chapters over the years confirms. However, one can witness the
decline in the relative importance of Agriculture, Mining and quarrying and
the increase in services such as Health and Social work, Wholesale and retail
trade and Education.
The customs data allow us to evaluate the distribution of trade activity over
the sectors. Not surprisingly, the largest share of product exports are performed by the manufacturing firms. Over time their share of export volume
increases from 73 percent to 90 percent, as shown by Tables 13 and 14 for the
shares of export and import volumes of the various NACE 1 chapters in the
Appendix. The largest part of the remaining trade activity is performed by
the Wholesale and retail sector, though its share is decreasing over time from
17 to 5 percent. Contrary to export volume distribution imports show a bit
different picture. While, Manufacturing sector is responsible for the majority
7
Table 1
Number of observations by NACE chapters
NACE
A
B
C
D
E
F
G
H
I
J
K
L
M
N
O
Q
Agriculture, Hunting and Forestry
Fishing
Mining and quarrying
Manufacturing
Electricity, gas and water supply
Construction
Wholesale and retail trade
Hotels and restaurants
Transport, storage and communication
Financial intermediation
Real estate, renting and business activities
Public administration and defence
Education
Health and social work
Other community service activities
Extra-territorial organisations and bodies
No info
TOTAL
Observations
74300
2400
2956
225316
5335
100096
422198
39075
49220
11407
241213
12
7553
12938
40657
22
12227
1246925
share
(%)
5.96
0.19
0.24
18.07
0.43
8.03
33.86
3.13
3.95
0.91
19.34
0.00
0.61
1.04
3.26
0.00
0.98
100
share of import volume (50-60 percent) a considerable share of product import (30-40 percent) is carried out through the Wholesale and retail sector.
While most of this latter import volume consists of products that are sold to
consumers directly, some will become inputs to manufacturing firms. The distinction between Manufacturing and Wholesale and Retail trade is important
for example when assessing role of imported inputs of performance of firm or
on income distribution of workers.
Given the relative high intensity of trade in the manufacturing sector, the rest
of this paper (from Section 3 on) will concentrate on manufacturing firms.
2.5 Source discrepancies and representative power of data
This section discusses the representative power of IEHAS-CEFiG dataset regarding the volume of trade. First, we compare the firm level export information from the customs and APEH sources in the merged dataset. Second we
compare the customs trade data to the official trade volume aggregate figures
published by the Hungarian Statistical Office (KSH).
8
2.5.1 Two sources of export
The IEHAS-CEFiG dataset has two sources of exports. One is the balance
sheet information from APEH, which contains the volume of export activity
that is accounted in the books for a given year. The other source is the merged
customs data, which captures all actual transactions. The actual figures from
the two sources may be different, because APEH documents only those transactions where change in the ownership occurs, while customs data records
transactions irrespective of the ownership status. 4
A comparison of the two dataset finds a correlation of 0.95 between the export volumes, implying an acceptable difference. However, as shown in Tables
15 and 16 (in the Appendix) the discrepancy varies considerably across sectors and over time. Manufacturing sectors show the highest and most stable
correlation with an average of 0.93. The other sectors, with the exception of
Agriculture and Forestry demonstrate low correlation. If sectors of manufacturing are examined separately, the correlations of the two sources of export
data appear strong on average. However sectors, such as Textiles, Printing and
Publishing and Radio, television and communication equipment show average
correlation lower than 0.8.
While correlation describes strength of the relationship of the variables it
does not assess scale issues. Therefore, in Table 17 the differences in the sums
of volumes for a given sector in the given year are examined. The figures
express the share volume by which customs data exceeds the book report. 5
While on average, differences are acceptable, in several sectors, especially in
Tobacco products, Wearing apparel and Tanning and dressing of leather larger
discrepancies are present.
2.5.2 Representativeness of volume data
To show the representative power of IEHAS-CEFiG in Table 2 the sums of
all export and import values in the data are compared to the official annual
product trade volumes published by Hungarian Statistical Office (KSH) . We
find that data sums up to 95 - 97 percent of the trade volume thus published.
The discrepancy stems from methodological differences. The official figure incorporates some financial services 6 as product trade, while we do not find
that in IEHAS-CEFiG.
Also, as indicated by second row for 1996 in Table 2 a methodological change
4 The
discrepancy is also influenced by accounting techniques: the accounting and
actual exports appear in different years.
5 If e.g. the figure is 85.7, it suggest that 85 percent of the customs data should be
added to the APEH data to make the two sources of data equal.
6 e.g. such as leasing
9
Table 2
Comparison of KSH and IEHAS-CEFiG trade volume data in hundred Bn. HUFs.
1992
1993
1994
1995
1996
1997
1998
1999
2000
2001
2002
2003
KSH
import export
8.8
8.4
11.6
8.2
15.4
11.3
19.4
16.2
27.6
23.9
39.6
35.7
55.1
49.3
66.5
59.4
90.6
79.4
96.7
87.5
97.0
88.7
107.0
96.4
IEHAS-CEFiG
import export
6.7
6.8
9.4
7.0
14.0
10.3
18.2
15.4
37.9
53.7
64.7
86.2
95.1
94.3
104.1
34.6
48.4
58.5
73.0
86.2
87.1
93.5
The trade volumes are in current prices. The second
official KSH figures for 1996 (in italics) are calculated
retrospectively by new method introduced from 1997
on.
occurs at the KSH which broadens ’special trade’ category of custom-free areas. Furthermore, the difference also comes from the fact that customs data
and KSH treats arm’s length and non-arm’s length transaction differently. Despite the aforementioned differences, IEHAS-CEFiG created from raw customs
transaction level data seems to be able to grasp the majority of Hungarian
product trade.
3
The Prevalence of Trading Activity at firm level
The key interest in examining firm level datasets on trade activity is that
it gives a more detailed picture about what is behind aggregate trade flows
and allows us to see whether findings are consistent with trade theories. This
section looks at trading firms
3.1 Concentration
Recent stylised facts suggest that trading firms are fairly scarce and there is
a very strong concentration of exporting and importing activity at the firm
level (see eg. Bernard et al. (2007), Bernard & Jensen (1999)).
To illustrate the propensity to trade of Hungarian manufacturing firms, Table
3 presents the key statics and compares it with results from other countries.
10
In Hungary, less than third of the firms were exporters and about third were
importers in 1999, and the distribution of export and import volumes were
both more concentrated than that of sales.
Table 3
Participation Rate and Concentration: International comparison
Hungary
Italy
U.S.
Sweden
% Exporters
27.7
70.6
27
71
% Importers
33.2
69.3
14
60
Gini Exports
0.936
0.825
0.972
.
Gini Imports
0.945
0.965
0.965
.
Gini Sales
0.922
0.807
0.916
.
our paper
Firms, 1999
all
manufacturing
Castellani
et al. (2008)
Firms, 1997
empl. > 20
manufacturing
Bernard et al.
(2007)
Plants, 2002
all
manufacturing
Andersson
et al. (2007)
Firms, 2004
empl. > 10
manufacturing
Belgium
41.2
43.2
0.959
0.956
0.873 (VA)
Muûls & Pisu
(2007)
Firms, 1996
all
manufacturing
Compared to results computed for other countries, Hungary is slightly less
open than Belgium, but more open than the U.S. At first glance, Hungarian
data may look different to some other countries such as Italy or Sweden.
However, this is due to different sampling restrictions used. Knowing from
Mayer & Ottaviano (2008) that traders are on average larger in size in Europe,
exclusion of small firms results in the overestimation of openness. To be able
to compare to Sweden and Italy size adjustment has to be made on our data.
For Hungary, the result are as follows. When excluding less than 10 employee
firms 55% of the firms export and 59% import. When excluding the less than
20 employee firms results change to 66 and 70 percent respectively. Given these
estimates, Hungary seems less open then Sweden, but seems comparable to
Italy.
Next, the underlying sectoral distribution of the average 27% export and 33%
import participation rate of the manufacturing sector is investigated. Figure
2 shows the share of firms that export in each manufacturing sector plotted
against the share that import in 1999. Most open sectors in terms of exports
are 34 - Motor vehicles (51%), 28 - Basic and Fabricated metals (48-30%)
and 25 - Rubber and Plastic products sector and 24 - Chemicals sector both
with (41%). The least open sectors in terms of export are the 22 - Printing
and publishing sector (10%) and 30 - Office Machinery sector (16%).
Tables 18 and 19 (in the Appendix) show the export and import participation
rate within sectors for all the years of the sample. Remember, that there is a
break in the data from 1999 to 2000, the share of traders are systematically
higher in the late periods across all sectors due to the lack of small firms.
Otherwise trading propensity shows stability over time across sectors.
Sectors with high share of exporters tend to have high share of importers. The
11
.6
Fig. 2. Share of exporters and importers by sector in 1999
34
Share of importers in given sector
.3
.4
.5
24
19
25
23
31 35
32
29
21
33
17
18
27
26
36
30
28
20
37
.2
15
22
.1
.2
.3
.4
Share of exporters in given sector
.5
The graph plots the share of exporting firms against the share of
importing firms in manufacturing sectors. Each ball represents an industry with the corresponding NACE code indicated on it. Sector 16
of Tobacco products is excluded due to the small number of firms, who
are all traders.
high correlation of the within sector participation rates is also apparent in
Figure 2. This is due to the fact, that most firms perform both exporting and
importing activity. Thus for more precise examination of trading activity, four
trade status categories have been created. These are the non-trading firms, the
firms that import only, firms that export only, and firms that import as well
as export (two-way traders). Table 4 shows the share of firms in each status
for 1999. It shows, that 38.5% of the firms engage in trading activity, either
exporting, importing or both. Five and half percent of the firms on average
engage in exporting activity only, on average 11 percent of the firms import
only and on average 22.2 percent of the firms engage in both activities. This
suggest, that most of the trading manufacturers in the Hungarian economy are
two-way traders. There are only some sectors, where share of exporters-only
is relatively high e.g. Wood and Basic Metals.
3.2 How different are traders?
Firms engaged in international trade look different along a number of dimension. Since Bernard & Jensen (1999)’s seminal empirical paper on U.S.
exporters, several works have documented that firms involved in international
trade are different from non-trading firms in many aspects. These firms employ
more and better skilled workers, pay higher wages and are more productive
than firms selling within borders only. Many of these differences related to the
operation of the firms were found and documented both for the U.S. and European countries for example in Bernard et al. (2007) or in Mayer & Ottaviano
(2008). These phenomena is also documented for Hungary by Altomonte &
12
Table 4
Share of firms in different trade status in sectors of manufacturing 1999, (%)
15
16
17
18
19
20
21
22
23
24
25
26
27
28
29
30
31
32
33
34
35
36
37
industry
Num.
Obs.
Food products and beverages
Tobacco products
Textiles
Wearing apparel
Tanning and dressing of leather
Wood
Pulp, paper
Publishing, printing
Coke, refined petroleum
Chemicals, and chemical products
Rubber and plastic products
Other non-metallic mineral products
Basic metals
Fabricated metal products
Machinery
Office machinery and computers
Electrical machinery
Radio, television and comm. equip.
Medical, precision and optical instr.
Motor vehicles
Other transport equipment
Furniture
Recycling
All manufacturing
2705
7
764
1158
366
1244
243
2625
8
523
1059
764
233
2724
1997
164
708
520
796
241
127
1059
107
20142
share of
non- exp. imp.
trader only only
71.2
0.0
51.3
55.0
45.4
61.9
57.2
80.1
62.5
41.7
47.1
59.0
45.9
61.1
56.1
67.1
55.6
55.6
58.0
38.6
55.9
61.9
65.4
61.3
6.5
0.0
5.1
3.5
3.6
10.9
3.7
3.5
0.0
5.2
7.0
5.2
14.6
7.5
4.1
0.6
2.4
3.7
3.5
4.1
1.6
4.8
9.3
5.5
8.0
14.3
13.5
7.5
8.7
9.8
13.2
10.2
12.5
17.2
12.3
13.9
6.4
8.7
14.7
17.1
14.1
12.7
15.2
10.0
11.8
11.4
6.5
11.0
twoway
trader
14.3
85.7
30.1
33.9
42.3
17.4
25.9
6.2
25.0
35.9
33.6
21.9
33.0
22.7
25.1
15.2
27.8
28.1
23.2
47.3
30.7
21.9
18.7
22.2
Békés (2009).
These differences calculated for the IEHAS-CEFiG dataset are summarised
in Table 5. Each row displays the average difference between exporter and
non-exporters and importers and non-importers in a firm characteristic. The
first and the third columns represent ordinary least squares regressions with
log of employment, value added per worker, average wage and capital per
worker as dependent variables on exporter and importer dummies respectively.
The second and fourth columns include employment and sectoral dummies as
controls. When employment is the dependent variable employment control is
omitted.
As dependent variables are in logs the coefficients can be interpreted as per13
Table 5
Exporting and importing premia across manufacturers
log
log
log
log
log
of
of
of
of
of
exporter
(1)
1.525
0.388
0.850
0.395
0.346
employment
value added per worker
TFP 7
average wage
capital per worker
additional covariates
none
premia
(2)
1.467
0.398
0.374
0.255
0.477
sector
empl.
importer premia
(3)
(4)
1.313 1.276
0.533 0.524
0.947 0.478
0.456 0.312
0.357
0.5
none
sector
empl.
centage differences. That is, coefficient 1.46 with the log of employment implies: exp(1.46)-1 = 330% higher employment on average in exporter firms.
Analogously, other coefficients imply that exporters produce 39 percent more
value added per worker, are on average 44 percent more productive, pay 28
percent higher wages and own 47 percent more capital per worker than nonexporting firms. The differences are similar when comparing importers to nonimporters, with minor differences: importers have 120% more employment,
produce 52% more value added per worker and 47% higher TFP, pay 31%
more average wage, are 50% more capital intensive. The performance premium of the traders, either exporters or importers is general, is not caused
by outliers. In Figure 3 the cumulative density of log of TFP of non-trading
firms is compared to that of exporters and importers. The picture shows that
in both cases traders on average outperform non-traders in all deciles of the
productivity distribution.
Fig. 3. Cumulative distribution of FTP comparing traders and non-traders
.8
fraction
.4
.6
.2
0
0
.2
fraction
.4
.6
.8
1
Non−traders vs. importers
1
Non−traders vs. exporters
−4
−2
0
TFP − LP
Non−traders
2
4
−4
Exporters
−2
0
TFP − LP
Non−traders
(a) Exporters premia
2
Importers
(b) Importers premia
14
4
3.3 Distribution of trade volume
International research on traders reveals that only a few firms are responsible for most of the trade volume, see e.g. Bernard et al. (2007) or Mayer &
Ottaviano (2008). That is, trade volume is highly concentrated. This section
describes the distribution of the volume of trade in the Hungarian manufacturing sectors. To provide a general picture, first the evolution of the real trade
volume over time is displayed in Figure 4. Both volumes show steady increase
in real terms: the average yearly growth of export volume is 19.1 percent, while
the corresponding import figure is 23 percent.
0
1,000
Billion HUFs
2,000
3,000
Fig. 4. Manufacturing firms direct export and import volume 1992-2003
1992 1993 1994 1995 1996 1997 1998 1999 2000 2001 2002 2003
Exports in 1992 prices
Imports in 1992 prices
The graph shows the yearly volume of exports and imports. Both are
deflated to 1992 prices and are expressed in billions of HUFs.
The cross sector distribution of manufacturing trade volume is rather unequal.
Table 6 summarises the share of each NACE-2 sectors from the volume of
export and import in 1999. The major contributor to both import and export
volume is the sector 34 of Motor vehicles, which is responsible for 23 and 21
percent of the export and import volume respectively. Other main contributing
sectors are the Radio, television and communication sector with 15 and 18,
the Office machinery and computers sector with 11 and 11, and the Electrical
machinery sector with 9 and 8 and percentages shares from the export and
import volumes of manufacturing. While other sectors hold only a small share
from the volumes, we find that export and import volume shares across sectors
are highly correlated. In Figure 5 we plot the share of export volume in a given
sector against the share of import volume in the same sector.
In most sectors the bulk of the trading in volume is carried out by a few
firms only, and thus trading activity is very concentrated. In 1999 the largest
5 percent of exporters were responsible for 81.5 percent of the total trade,
while in case of imports the figure is 84.4%. To further illustrate the extent
15
Table 6
Volume shares of manufacturing sectors of exporting and importing in 1999, in (%)
industry
15
16
17
18
19
20
21
22
23
24
25
26
27
28
29
30
31
32
33
34
35
36
37
obs.
Food products and beverages
Tobacco products
Textiles
Wearing apparel
Tanning and dressing of leather
Wood
Pulp, paper
Publishing, printing
Coke, refined petroleum
Chemicals, and chemical products
Rubber and plastic products
Other non-metallic mineral products
Basic metals
Fabricated metal products
Machinery
Office machinery and computers
Electrical machinery
Radio, TV and communication equip.
Medical, precision and optical instruments
Motor vehicles
Other transport equipment
Furniture
Recycling
TOTALS
2705
7
764
1158
366
1244
243
2625
8
523
1059
764
233
2724
1997
164
708
520
796
241
127
1059
107
20142
share of
export
volume
5.8
0.2
2.7
5.0
1.8
1.1
1.3
0.1
1.6
5.4
2.9
1.5
2.9
2.7
4.2
11.0
9.3
15.3
0.8
22.9
0.3
1.0
0.1
100.0
share of
import
volume
3.5
0.6
3.3
4.7
1.7
0.7
1.8
0.9
5.3
4.8
3.4
1.0
2.5
1.8
3.6
10.6
8.3
18.3
0.8
21.2
0.3
0.8
0.0
100.0
of this concentration Table 7 presents the share of the largest exporters and
importers. Both the export and import block consists of two columns. The
first shows the share of the largest 5 percent traders in sectoral trade volume,
while the second shows the corresponding figure for the largest 10 percent.
The sectors, where trading volume is most concentrated across exporters are
the Motor vehicles, Basic Metals, and Pulp and Paper and Radio and television sectors where the top 5 percent are responsible for more than 70 percent
of the sectoral trade volume. In case of imports the picture is similar, though
Wood and Office Machinery sectors also appear rather concentrated.
While examining the share of the top exporters and importers in each sector
is very illustrative, also Herfindahl indices of concentration were calculated for
the better cross section comparison. Tables 22 and 23 present concentration
indices in the Appendix confirm previous findings. Patterns of concentration
16
Fig. 5. Export and import share of volume by sector in 1999
less than 5 pc. exp. share
more than 5 pc. exp. share
.2
34
.15
Share of Import volume
32
.1
30
0
.05
31
23
22
16
3735
0
21 19
3336
20 26
18
1725
27
28
29
24
15
.05 .05
.1
.15
.2
.25
Share of Export volume
.
The graph plots the share of sectors of total manufacturing export
volume of 1999 against the share of corresponding import volume.
Each ball represents an industry with the corresponding NACE code
indicated on them. For better visibility sectors below and above 5
percent of share of total export volume are graphed separately.
Table 7
Share of top traders in sectoral trade volume in 1999, (%)
15
17
18
19
20
21
22
24
25
26
27
28
29
30
31
32
33
34
35
36
industry
Food products and beverages
Textiles
Wearing apparel
Tanning and dressing of leather
Wood
Pulp, paper
Publishing, printing
Chemicals, and chemical products
Rubber and plastic products
Other non-metallic mineral products
Basic metals
Fabricated metal products
Machinery
Office machinery and computers
Electrical machinery
Radio, TV and communication equip.
Medical, precision and optical instruments
Motor vehicles
Other transport equipment
Furniture
top exporters
5%
10%
56.6
74.3
58.2
70.6
49.4
65.3
44.8
60.7
65.3
80.2
73.7
89.3
58.3
78.0
75.3
88.6
65.0
80.7
63.4
79.8
74.9
88.8
57.4
71.7
66.5
80.5
54.8
76.8
60.2
76.2
81.6
92.4
60.8
81.0
83.2
89.9
55.9
72.7
52.6
70.3
top importers
5%
10%
67.2
81.0
63.9
75.9
50.7
66.0
48.4
63.5
75.4
87.3
60.7
82.4
69.2
83.3
70.4
84.6
61.0
78.4
50.0
70.3
79.0
90.3
60.5
76.8
68.2
80.6
76.1
98.5
60.1
77.8
77.3
91.6
62.3
77.5
87.5
92.8
49.7
72.2
60.2
75.2
The table shows the percentage share of sectoral export/import volume of the 5 and 10 percent of
the biggest exporters/importers. Sectors with less than 50 firms are not considered in this listing
17
are rather stable over time for sectors with low concentration, while a considerable noise is detectable for concentrated sectors. Two key manufacturing
industries, Motor and vehicle and Office machinery show increasing within
sector concentration over time, both in terms of export and import volumes.
The only sector, that shows considerable decrease in concentration is Electrical
machinery, where the within sector export Herfindahl index drops from 0.2 to
0.08, suggesting that much more firms got involved in international activities.
3.4 Spatial distribution of trade
Though Hungary is a small country both population and economic activity
are rather concentrated is space. Almost 40 percent of economic activity takes
place in the capital Budapest, which holds about twenty percent of the population and twenty-four percent of the manufacturing employment. The most
productive and economically prospering regions are those close to the capital
and those in north-west Hungary.
The distribution of economic activity and trade is jointly shaped by that of
population, the heritage of communist economic spatial planning and location
choice of the incoming FDI in the early-mid 1990’s 8
In Figures 6 spatial distribution of trade volumes per capita are summarised
over NUTS-3 level spatial entities of Hungary, which contain the 19 counties
(megye) and the capital Budapest.
Vas, Győr-Moson-Sopron, Fejér are found to be the leading export and import
regions with per capita exports more than 2 million HUFs and per capita
imports one and half million. The figures clearly illustrate the west and north
bound nature of trading locations. The export volume distribution and also
that most importing activity is concentrated towards the western, Austrian
border.
While aforementioned geography is driven by volume considerations, another
picture can be drawn by looking at the average trade involvement of firms.
In Figure 7 the average shares of exports in sales are plotted. Though, the
east-west division still dominates, some eastern and southern regions appear
rather active in trade such as Baranya and Szolnok counties.
8 As
Brulhart & Koenig (2005) find in their examination of post-communist European countries, transition favours regions that are proximate to the large incumbent EU market, both in terms of wages and employment.
18
Fig. 6. Export and Import per capita by counties in mill. HUFs in 1999
Borsod−Abaúj−Zemplén
.23
Szabolcs−Szatmár−Bereg
.21
Nógrád
.27
Komárom−Esztergom
Gyõr−Moson−Sopron
.44
2.44
.22
Budapest
.44
Hajdú−Bihar
.17
Pest
Veszprém
Vas
Jász−Nagykun−Szolnok
.28
.33
Fejér
.32
2.06
Heves
2.47
Békés
.14
Zala
.19
Bács−Kiskun
.23
Tolna
.24
Somogy
Csongrád
.19
.45
Baranya
.26
Borsod−Abaúj−Zemplén
.17
Szabolcs−Szatmár−Bereg
.15
Nógrád
.21
Komárom−Esztergom
Gyõr−Moson−Sopron
.39
1.87
1.58
.19
Budapest
.48
Hajdú−Bihar
.07
Pest
Veszprém
Vas
Heves
Fejér
.2
Jász−Nagykun−Szolnok
.21
.33
1.84
Békés
.06
Zala
.1
Bács−Kiskun
Tolna
.16
Somogy
.14
Csongrád
.09
.52
Baranya
.19
The graphs show the distribution of export (above) and import (below) value per
capita in each county in million HUFs for year 1999. The colours deepen towards red
with the higher place a region takes in the quintile of the distribution
4
Distribution of Products and Countries
Along with the relative scarcity and concentration of trading volume, recent
empirical works on international trade see e.g. Bernard et al. (2007), find
19
Fig. 7. Firms’ average export per sales by counties in 1999
Borsod−Abaúj−Zemplén
40
Szabolcs−Szatmár−Bereg
47.1
Nógrád
46.7
Komárom−Esztergom
Gyõr−Moson−Sopron
42.2
56
43.9
Budapest
29.9
Hajdú−Bihar
39.7
Pest
Veszprém
Vas
65.2
Heves
Fejér
48.7
34.2
Jász−Nagykun−Szolnok
50.1
48
Békés
47.3
Zala
56.7
Bács−Kiskun
Tolna
52.3
Somogy
46.7
Csongrád
41.1
52.4
Baranya
56.5
The graph shows the distribution of average share of export in firms’ sales in each
county in million HUFs for year 1999. The colours deepen towards red with the higher
place a region takes in the quintile of the distribution
that there is also a considerable heterogeneity across firms in terms of traded
number of products and trading partner countries.
4.1 Products
Many firms trade only one product and with one country, however the larger
share of trade in volume is carried out by firms trading many products with
many countries. The importance of this observation is at least twofold. Once, it
sheds more light on the nature of firm-level concentration of aggregate trade
flows. Second, as e.g. Chaney (2008) argues, introducing firm heterogeneity
and destination specific fixed-costs to gravity modelling, shows that contrary
to the prediction of Krugman-type new trade models adjustments in reaction
to increase in trade cost or distance does not all occur on the intensive margin
but on the extensive one.
To portrait the characteristics of firms regarding the extensive margin, the
number of traded varieties will be defined as the number of HS 6-digit level
categories the firm is engaged in foreign trade with. Number of export destinations are the markets served by the firm, while the variety of source countries
is used for imports.
20
Table 8
Distribution of exporters and Export value by Number of Products and Export
Destination 1999
Share of Exporting firms (%)
Number of
countries
1
2-5
6-10
11-20
21-50
50+
All
Number of products
2-5
6-10
11-20
21-50
1
20.3
4.0
0.3
0.0
0.0
24.7
15.0
18.1
2.2
0.6
0.1
0.0
36.1
50+
All
1.6
3.2
1.4
1.3
1.0
0.1
8.6
0.2
0.8
0.6
0.5
0.7
0.1
2.8
44.3
38.1
8.7
5.5
3.2
0.2
100.0
Number of products
6-10
11-20
21-50
50+
All
0.1
1.2
3.3
6.6
40.4
5.3
56.8
4.9
10.8
9.1
15.9
52.0
7.3
100.0
50+
All
0.2
1.5
2.9
3.6
9.0
5.3
22.5
13.5
26.4
14.4
15.9
22.6
7.3
100.0
4.3
7.5
1.8
1.3
0.4
15.3
2.8
4.4
2.5
1.8
0.9
0.1
12.5
Share of Export value (%)
Number of
countries
1
2-5
6-10
11-20
21-50
50+
All
1
2-5
0.3
0.2
0.0
0.0
0.0
1.1
1.4
0.7
0.6
0.2
0.0
4.1
0.6
0.8
1.6
0.9
1.4
0.7
5.3
1.3
2.7
2.0
2.7
3.5
0.1
12.4
1.2
3.6
2.2
4.5
7.3
1.9
20.8
Share of Exporting employment (%)
Number of products
Number of
1
2-5
6-10
11-20
21-50
countries
1
4.4
4.3
1.5
1.8
1.4
2-5
1.2
8.3
5.5
4.6
5.3
6-10
0.1
2.0
2.5
4.0
3.0
11-20
0.0
0.9
2.4
4.1
4.7
21-50
0.0
0.2
1.4
4.9
7.0
50+
0.0
0.5
1.5
All
5.7
15.7
13.3
19.9
22.9
On average firms export 7 types of products, while import 17 product categories, while they export on average to 3 countries and import from 4. However,
looking at the distribution of these varieties reveals that only a few international traders can afford complex trade patterns. The most complex traders in
21
Table 9
Distribution of importers and Import value by Number of Products and Import
Origin 1999
Share of Importing firms (%)
Number of
countries
1
2-5
6-10
11-20
21-50
50+
All
Number of products
6-10
11-20
21-50
1
2-5
50+
All
16.2
1.0
0.0
10.2
13.5
0.4
2.6
7.9
1.5
0.1
2.6
6.5
3.0
0.5
0.0
2.3
6.3
5.6
3.7
0.2
18.1
0.7
2.2
3.2
6.3
3.2
0.0
15.8
34.6
37.4
13.8
10.7
3.4
0.0
100.0
17.2
24.1
12.2
12.6
Number of products
2-5
6-10
11-20
21-50
50+
All
0.2
2.0
4.2
13.1
68.6
0.9
89.0
1.4
5.4
7.6
16.0
68.8
0.9
100.0
50+
All
0.6
2.4
5.1
19.1
28.8
1.7
57.6
8.8
18.6
15.4
26.4
29.1
1.7
100.0
Share of Import value (%)
Number of
countries
1
2-5
6-10
11-20
21-50
50+
All
1
0.1
0.0
0.0
0.2
0.4
0.1
0.1
0.5
0.2
0.0
0.2
0.6
0.8
0.2
0.0
0.5
1.9
2.3
2.7
0.1
0.1
0.7
0.9
1.9
7.4
Share of Importing employment (%)
Number of products
Number of
1
2-5
6-10
11-20
21-50
countries
1
3.8
2.4
0.6
0.6
0.8
2-5
0.2
5.5
3.6
3.1
3.9
6-10
0.0
0.3
1.0
2.9
6.2
11-20
0.1
0.5
6.8
21-50
0.0
0.3
50+
0.0
All
3.9
8.1
5.2
7.1
18.0
Hungarian manufacturing, export over 60 different products, to over 50 countries, while the most complex importers buy over 200 products types, from
over 50 countries. Note that at least 100 firms satisfy each criteria.
In Table 8 the distribution of firms, export volume and employment over
22
categories of number of products traded and number of countries served is
displayed. The table is constructed in the manner of Table 4 in Bernard et al.
(2007), however we use wider categories for better description of the underlying distribution. The first block shows, that most firms export only to a
single country (44%), furthermore only a single product. The number of firms
gradually decrease with an increase in the number of countries or products.
Though the single country, single product firms are numerous, their share of
export volume and employment is negligible. Multi-product and multi county
exporters employ the majority of the exporting workforce and carry out the
bulk of the exporting in volume.
Similar exercise is conducted for the analysis of importing activity in Table 9.
Firms are more likely to trade with many countries and many product when
they import than when they export. Multi county and product importers are
responsible for the overwhelming majority of import value (94%) and about
three quarters of the employment of all importing firms. These statistics shed
light on the importance of export and import platforms of multinational firms
that shape Hungarian foreign trade.
When Hungarian result are compared to those obtained for the US in Bernard
et al. (2007), one finds that though the share of single-product exporters is
similar, share of Hungarian single-country exporters is less. This result may
be the consequence of different country sizes and greater set of neighbouring countries. The distribution of employment and export value shows less
concentration in Hungary, though the pattern is rather similar.
However examining the extensive margin of trade might not tell us that much
about economic decision-making as e.g. Bernard et al. (2007) and many others
suggest.
4.2 Countries
The IEHAS-CEFiG Hungary dataset ranges over a relatively long period of
time including periods when fundamental changes took place in the economy.
Between 1992 and 2003, Hungarian firms entered a great number of new export markets and a large shift also took place in the direction of exporting
from former socialist economies to competitive EU-markets. As for the import
origins the top supplier have undergone only a minor change in their order
of importance. However, the share of east-asian countries is steadily increasing towards the end of the period. Thanks to liberalisation, increased foreign
competition and the collapse of former communist markets, important changes
took place in the destination of Hungarian exports and origin of imports.
Hungarian foreign trade involves over hundred countries. If we take a look at
23
0
log of trade volume Bn. HuF.
2
4
6
8
Fig. 8. Partner countries sorted according trade volume in 1999
0
10
20
Ranking by trade volume
Export Partner
Export linear trend
30
Import Partner
Import linear trend
The figure plots the export and import value traded with partner
countries on a log scale. The countries are sorted in a decreasing order
with respect to volume from left to right.
the Figure 8 we not only see the largest trading partners, but on the x-axis also
a fairly full range export and import partner countries and their corresponding
trade volumes. Interestingly, sorted the partners according to trade volume of
both export and imports resembles a linear decay on an exponential scale.
Focusing currently on the left side of this distribution, Table 27 and Table 28
collect the top 15 trading partners (both in Appendix).
The top export partners are quite stable over time: Germany is in the lead with
over 30% of manufacturing export share, followed by Austria and Italy. Indeed,
the composition of top 15 export destination has hardly changed overtime.
The collapse of Soviet Union diminishes the importance of the eastward trade.
However, the neighbouring former planned economies remain important: these
countries play an important role in case of first-time exporters, which may be
explained by the lower fixed costs of these markets. To see a more clear picture
on the foreign trade with former socialist and communist countries, in Table
31 we display the top exporting partners keeping the pre-transition geopolitical entities. Tables include Soviet Union, Yugoslavia and Czechoslovakia in
quotation marks, implying that they were artificially created for comparison
purposes as collection of former members.
Using these artificial countries on panel (a) of Figure 9 shows, how the relative
importance of important export partners changed from 1992 to 1999. The
blue line corresponds to the countries share in trade volume in 1992, the red
shows the corresponding 1996 value. The graphs contains countries by their
1992 importance. Due to illustration purposes, Germany is excluded from the
graphs. The picture indicates, that Austria, Italy and ”Soviet Union” has
lost from their former relative importance by 1999, while Netherlands, UK
24
Fig. 9. Changes in manufacturing trade partner countries 1992 - 1999 and 1999-2003
Austria
Austria
12%
Turkey
Japan
Italy
10%
Finland
8%
Switzerland
"Soviet Union"
6%
Sweden
4%
2%
Netherlands
U.S.A.
0%
16%
14%
12%
10%
8%
6%
4%
2%
0%
"Soviet Union"
Italy
"Czechoslovakia"
"Yugoslavia"
"Czechoslovakia"
Poland
France
Benelux
France
"Yugoslavia"
1999
1992
(a) Early Export changes
10%
Austria
Poland
Czech Republic
USA
8%
Slovakia
Italy
12%
4%
Slovakia
France
2%
UK
0%
Japan
6%
Netherlands
2%
Switzerland
Russia
8%
Spain
4%
Italy
10%
6%
Ireland
1999
(b) Early Import changes
Austria
Sweden
Switzerland
Benelux
U.S.A.
United Kingdom
1992
Netherlands
United Kingdom
0%
Korea
Russia
USA
France
Switzerland
Czech
Benelux
Romania
Benelux
Taiwan
Singapore
Poland
Spain
1999
UK
Netherlands
China
2003
1999
(c) Late Export changes
2003
(d) Late Import changes
and USA show an increased share of exports. On panel (c) the export changes
occurred from 1999 to 2003 are plotted. 9 The relative importance of USA and
Austria is shown to have been decreasing, while the graphs shows an increase
in that of Sweden, Slovakia and France. Changes in the relative position of
top export partners are more moderate in the 1999-2003 period.
On the import side Germany is the leading partner also, with around 30% of
the manufacturing imports. It is followed by Austria, Russia and Italy with
half, third and less of the German share in 1992 and 1999. By 2003 eastasian import becomes dominant, China becomes one of the most prominent
suppliers and several other Asian countries (Korea, Malaysia and Taiwan)
appear among the top import sources, as Table 28 shows.
Just as in the case of exports, the examination of early period import changes
also need to take geopolitical changes into account. On panel (b) of Figure
9 import changes from 1992 to 1999 are plotted. The relative position loss
of Austria and ”Soviet Union” is visible. Changes in the position of ”Soviet
Union” and its successor countries means share drop from 13 to 7 percent.
9 in
the later years we do not use the artificial countries
25
Despite the sharp drop, Russia remains still an important import partner,
through oil and gas mainly.
Concerning smaller partners the figure shows a decrease in the relative importance of Switzerland and the Netherlands, and shows a considerable increase
in the position of Asian countries. In the later years of our sample the increasing importance of Asia in general and China in particular as global supplier
is quite clearly visible in the Hungarian data.
By the end of our sample period former communist countries become important suppliers once again, e.g. an increase in the relative importance of
Slovakia, Czech Republic and Poland is indicated by panel (d) of Figure 9.
5
Summary
This note gave a basic overview of Hungarian international trade from the
point of view of the firms through basic descriptive statistics from a specially
compiled database: IEHAS-CEFiG Hungary. Focusing on the manufacturing
sector a number of stylised facts has been pointed out about the Hungarian
trading firms. These findings are in line with the recent international evidence.
1. Hungary is an open economy where about third of the manufacturing firms
export and also about a third of them import, suggesting that in Hungary
more firms participate in international trade than in the US or France.
2. Trade volume is very concentrated. The largest five percent of traders in
are responsible for more than eighty percent of the export and import volume.
3. Like found in most countries, Hungarian trading firms are different than non
trading firms along a number of dimensions. Traders are more productive,
employ more than three times as many workers as nontraders, pay higher
wager and are more capital intensive.
4. There is a great deal of trade related heterogeneity across firms both regarding exporting and importing activities.
5. Though, a large number of firms sell only a single product or just to a
single country, most of Hungarian trade is carried out by multi-product firms
trading with many countries.
6. Hungarian trade is concentrated spatially around the capital Budapest and
some north-western regions.
26
References
Altomonte, C. & Békés, G. (2009), ‘Trade complexity and productivity’, IE-HAS
Working Papers.
Andersson, M., Johansson, S. & Lööf, H. (2007), Firm performance and international
trade - evidence from a small open economy, Electronic Working Paper Series
2007/99, CESIS.
Békés, G. & Harasztosi, P. (2009), Agglomeration premium and trading activity of
firms, mimeo.
Békés, G. & Muraközy, B. (2008), Dissecting exporters: Evidence from hungary,
Technical report, Institute of Economics, HAS and CeFiG.
Bernard, A. B., Jensen, J. B., Redding, S. J. & Schott, P. K. (2007), ‘Firms in
international trade’, Journal of Economic Perspectives 21(3), 105–130.
Bernard, A. & Jensen, B. (1999), ‘Exceptional exporter performance: cause, effect,
or both?’, Journal of International Economics 47(1), 1–25.
Brulhart, M. & Koenig, P. (2005), New economic geography meets comecon: Regional wages and industry location in central europe, Cahiers de Recherches
Economiques du Dpartement d’Economtrie et d’Economie politique (DEEP)
05.01, Universit de Lausanne, Facult des HEC, DEEP.
Castellani, D., Serti, F. & Tomasi, C. (2008), Firms in international trade: Importers
and exporters heterogeneity in the italian manufacturing industry, LEM Papers
Series 2008/04, Laboratory of Economics and Management (LEM), Sant’Anna
School of Advanced Studies, Pisa, Italy.
Chaney, T. (2008), ‘Distorted gravity: The intensive and extensive margins of international trade’, American Economic Review 98(4), 1707–21.
Csillag, M. & Koren, M. (2009), ‘Machines and machinist’, mimeo.
Eaton, J., Eslava, M., Kugler, M. & Tybout, J. (2007), Export dynamics in colombia:
Firm-level evidence, Technical Report 13531, NBER.
Eaton, J., Kortum, S. & Kramarz, F. (2005), An anatomy of international trade:
Evidence from french firms.
Görg, H., Kneller, R. & Muraközy, B. (2008), What makes a successful export?,
Kiel Working Papers 1399, Kiel Institute for the World Economy.
Halpern, L., Koren, M. & Szeidl, A. (2005), Imports and productivity, Cepr discussion papers, C.E.P.R. Discussion Papers.
Levinsohn, J. & Petrin, A. (2000), Estimating production functions using inputs
to control for unobservables, NBER Working Papers 7819, National Bureau of
Economic Research, Inc.
Mayer, T. & Ottaviano, G. (2008), ‘The happy few: The internationalisation of european firms’, Intereconomics: Review of European Economic Policy 43(3), 135–
148.
Muûls, M. & Pisu, M. (2007), Imports and exports at the level of the firm: Evidence
from belgium, CEP Discussion Papers dp0801, Centre for Economic Performance,
LSE.
27
6
TABLES
Table 10
A listing of main variables
Variable
Description
id
year
nace
firm ID
Year
NACE 4 digit
sales
labor
capital
VA
Sales*
Employment, average annual
Fixed assets
Value added**
nomcapt
forsh
psh
Subscribed capital
Share of foreign ownership
Share of private ownership
materials
wagebill
Materials costs
Total wagebill paid in a given year
pt
pe
ph
PPI deflator, 1992==1
Export price deflator, 1992==1
Domestic price deflator, 1992==1
totexp
totimp
numdest
numorigin
expvarhs6
impvarhs6
Total exports
Total imports
Number of countries firm exports to
Number of countries firm imports from
Export variety in terms different HS6 categories firm exports
Import variety in terms different HS6 categories firm imports
city
kist150
county
Location of headquarters, city or settlement
NUTS-4 (150 stratification)
NUTS-3 (20)
*Annual, in Million HUFs, current price as all nominal variables unless otherwise indicated
**Value added is calculated the following way: Before 2001,
VA equals Sales plus Capitalised value of self-manufactured
assets minus Materials, Cost of goods sold and Other costs.
After 2001, Other costs are not subtracted
28
Table 11
Number of observations by year and NACE chapters
A
B
C
D
E
F
G
H
I
J
K
L
M
N
O
Q
A
B
C
D
E
F
G
H
I
J
K
L
M
N
O
Q
Agriculture, Hunting and Forestry
Fishing
Mining and quarrying
Manufacturing
Electricity, gas and water supply
Construction
Wholesale and retail trade
Hotels and restaurants
Transport, storage and communication
Financial intermediation
Real estate, renting and business activities
Public administration and defence
Education
Health and social work
Other community service activities
Extra-territorial organizations and bodies
No data
TOTAL
1992
1993
1994
1995
1996
1997
1998
1999
3136
46
126
11146
185
5446
19160
1801
2196
555
11276
4025
53
165
12932
252
6178
23477
2220
2567
648
13889
4543
65
182
14175
306
6950
27873
2688
3012
751
16687
5108
70
206
15511
340
7764
32017
3084
3448
862
19571
8689
428
233
16855
359
8709
35312
3500
4017
978
22979
8940
546
258
18892
415
10073
39451
4100
4627
1120
27186
6594
102
291
20142
439
10804
41871
4558
5288
1333
31325
354
352
2022
429
469
2423
1
377
70105
498
578
2836
1
543
81688
579
766
3513
1
740
93580
677
1038
3807
1
904
108486
804
1391
4338
2
870
123013
9951
670
282
20037
430
10880
41818
4483
5100
1272
30083
1
887
1599
4955
2
466
132916
941
1717
5074
3
5610
136092
2000
2001
2002
2003
2004
2005
2006
3589
55
171
14039
332
4760
23494
1727
2724
566
9686
3544
55
172
13945
341
4904
23700
1816
2767
570
9763
3545
60
180
14437
353
5021
24613
1892
2886
579
10191
313
590
1666
1
700
64413
315
654
1667
1
611
64825
332
717
1738
2
556
67102
3394
63
180
14321
391
5050
24422
1920
2883
577
10553
1
355
762
1752
2
144
66770
3322
64
186
13798
410
4802
23430
1856
2732
556
10046
2
367
781
1715
2
216
64285
3098
63
168
13028
400
4616
22022
1796
2587
538
9384
2
371
776
1666
2
422
60939
2822
60
156
12058
382
4139
19538
1634
2386
502
8594
6
331
748
1485
1
6
54848
62
57863
Agriculture, Hunting and Forestry
Fishing
Mining and quarrying
Manufacturing
Electricity, gas and water supply
Construction
Wholesale and retail trade
Hotels and restaurants
Transport, storage and communication
Financial intermediation
Real estate, renting and business activities
Public administration and defence
Education
Health and social work
Other community service activities
Extra-territorial organizations and bodies
No data
TOTAL
29
30
Agriculture, Hunting and Forestry
Fishing
Mining and quarrying
Manufacturing
Electricity, gas and water supply
Construction
Wholesale and retail trade
Hotels and restaurants
Transport, storage and communication
Financial intermediation
Real estate, renting and business activities
Public administration and defence
Education
Health and social work
Other community service activities
Extra-territorial organizations and bodies
No data
TOTAL
A
B
C
D
E
F
G
H
I
J
K
L
M
N
O
Q
NACE Chapters
11.8
0.1
0.6
36.0
4.6
6.6
13.6
2.0
12.1
2.3
7.9
0.0
0.2
0.1
2.0
0.0
0.1
100.0
1992
10.3
0.1
0.7
35.3
4.7
6.6
13.3
2.4
12.2
3.0
7.6
0.0
0.2
0.1
3.3
0.0
0.2
100.0
1993
9.4
0.1
0.7
35.3
5.2
6.6
14.7
2.3
12.5
3.3
7.2
0.0
0.2
0.2
2.2
0.0
0.0
100.0
1994
8.8
0.1
0.6
36.0
5.1
6.1
14.1
2.3
13.3
3.4
7.0
0.0
0.2
0.2
2.2
0.0
0.7
100.0
1995
9.2
0.3
0.6
36.0
4.8
5.7
15.2
2.3
11.9
3.2
8.0
0.0
0.2
0.3
2.0
0.0
0.3
100.0
1996
8.5
0.4
0.5
37.4
5.0
5.9
14.3
2.4
11.4
3.2
7.8
0.0
0.2
0.4
2.1
0.0
0.5
100.0
1997
8.3
0.4
0.5
37.9
4.2
5.9
15.0
2.5
11.2
3.0
8.2
0.0
0.2
0.5
2.0
0.0
0.1
100.0
1998
7.0
0.1
0.4
37.5
3.9
6.0
15.7
2.5
11.2
2.9
8.5
0.0
0.2
0.6
2.0
0.0
1.4
100.0
1999
6.6
0.1
0.4
40.8
3.8
5.5
15.2
2.3
11.8
2.8
7.5
0.0
0.2
0.6
2.1
0.0
0.2
100.0
2000
6.1
0.1
0.3
40.4
3.7
5.6
15.9
2.4
12.0
2.7
7.8
0.0
0.2
0.7
2.1
0.0
0.1
100.0
2001
Table 12: Employment share of NACE chapters over years, in %
5.7
0.1
0.3
39.5
3.5
5.5
16.1
2.3
12.2
2.9
8.5
0.0
0.2
0.8
2.2
0.0
0.1
100.0
2002
5.4
0.1
0.3
39.1
3.5
5.5
16.7
2.4
12.1
2.9
8.3
0.0
0.2
1.0
2.2
0.0
0.3
100.0
2003
5.0
0.1
0.3
37.8
3.3
5.4
17.3
2.3
12.0
2.9
9.4
0.0
0.3
1.2
2.3
0.0
0.4
100.0
2004
4.8
0.1
0.3
36.4
3.3
5.4
17.1
2.4
11.7
3.2
9.4
0.0
0.3
1.1
2.5
0.0
2.2
100.0
2005
4.7
0.1
0.3
37.1
3.2
5.3
17.5
2.4
12.0
3.5
9.6
0.0
0.3
1.3
2.6
0.0
0.0
100.0
2006
31
Agriculture, Hunting and Forestry
Fishing
Mining and quarrying
Manufacturing
Electricity, gas and water supply
Construction
Wholesale and retail trade
Hotels and restaurants
Transport, storage and communication
Financial intermediation
Real estate, renting and business activities
Public administration and defence
Education
Health and social work
Other community service activities
Extra-territorial organizations and bodies
No data
TOTAL
A
B
C
D
E
F
G
H
I
J
K
L
M
N
O
Q
NACE Chapters
3.6
0.0
0.1
73.3
0.3
0.5
17.6
0.0
0.4
0.0
4.0
0.0
0.0
0.0
0.3
0.0
0.0
100.0
1992
1.7
0.0
0.1
75.7
0.4
0.3
17.6
0.1
0.4
0.0
3.0
0.0
0.0
0.0
0.1
0.0
0.5
100.0
1993
2.2
0.0
0.1
77.8
0.3
0.3
14.4
0.3
1.9
0.0
2.5
0.0
0.0
0.0
0.2
0.0
0.0
100.0
1994
2.1
0.0
0.0
79.6
0.1
0.3
14.5
0.2
0.2
0.0
2.6
0.0
0.0
0.0
0.1
0.0
0.0
100.0
1995
1.8
0.0
0.0
85.4
0.6
0.2
9.2
0.1
0.2
0.0
2.2
0.0
0.0
0.0
0.1
0.0
0.1
100.0
1996
1.4
0.0
0.0
88.2
0.5
0.2
8.3
0.0
0.1
0.0
1.1
0.0
0.0
0.0
0.1
0.0
0.0
100.0
1997
1.2
0.0
0.0
89.8
0.5
0.2
7.2
0.0
0.1
0.0
0.8
0.0
0.0
0.0
0.0
0.0
0.0
100.0
1998
0.9
0.0
0.0
91.3
0.4
0.1
6.0
0.0
0.1
0.0
0.7
0.0
0.0
0.0
0.0
0.0
0.3
100.0
1999
0.9
0.0
0.0
91.2
0.3
0.2
6.2
0.0
0.3
0.0
0.8
0.0
0.0
0.0
0.1
0.0
0.0
100.0
2000
Table 13: Product export share of NACE chapters and years, in %
0.8
0.0
0.0
91.5
0.3
0.2
6.1
0.0
0.2
0.0
0.8
0.0
0.0
0.0
0.1
0.0
0.0
100.0
2001
0.7
0.0
0.0
89.8
0.1
0.1
5.6
0.0
0.2
0.0
0.6
0.0
0.0
0.0
0.1
0.0
2.6
100.0
2002
0.6
0.0
0.0
88.6
0.1
0.1
5.4
0.0
0.2
0.0
0.6
0.0
0.0
0.0
0.0
0.0
4.2
100.0
2003
32
Agriculture, Hunting and Forestry
Fishing
Mining and quarrying
Manufacturing
Electricity, gas and water supply
Construction
Wholesale and retail trade
Hotels and restaurants
Transport, storage and communication
Financial intermediation
Real estate, renting and business activities
Public administration and defence
Education
Health and social work
Other community service activities
Extra-territorial organizations and bodies
No data
TOTAL
A
B
C
D
E
F
G
H
I
J
K
L
M
N
O
Q
NACE Chapters
0.8
0.0
0.3
49.0
1.4
1.4
37.3
0.5
1.8
0.3
6.6
0.0
0.0
0.1
0.5
0.0
0.0
100.0
1992
0.5
0.0
0.3
43.4
1.2
1.0
42.3
0.3
3.8
0.6
5.3
0.0
0.0
0.1
0.5
0.0
0.4
100.0
1993
0.7
0.0
0.2
45.6
1.4
1.1
40.9
0.2
4.3
0.2
4.7
0.0
0.0
0.1
0.5
0.0
0.1
100.0
1994
0.6
0.0
0.2
54.2
1.5
0.9
34.7
0.2
3.4
0.2
3.4
0.0
0.0
0.1
0.3
0.0
0.3
100.0
1995
0.8
0.0
0.1
60.4
1.0
0.8
31.0
0.2
2.2
0.1
3.1
0.0
0.0
0.1
0.1
0.0
0.1
100.0
1996
0.7
0.0
0.1
63.1
1.2
0.7
30.3
0.1
1.4
0.1
2.1
0.0
0.0
0.1
0.2
0.0
0.1
100.0
1997
0.7
0.0
0.1
65.1
0.9
0.6
29.2
0.0
1.2
0.1
1.7
0.0
0.0
0.0
0.2
0.0
0.1
100.0
1998
0.3
0.0
0.1
67.4
0.9
0.7
27.2
0.0
1.3
0.1
1.5
0.0
0.0
0.0
0.1
0.0
0.4
100.0
1999
0.3
0.0
0.0
68.6
1.1
0.6
26.0
0.1
1.6
0.1
1.4
0.0
0.0
0.0
0.1
0.0
0.0
100.0
2000
Table 14: Product import volume share of NACE chapters and years, in %
0.3
0.0
0.1
68.6
0.7
0.5
26.7
0.0
1.2
0.1
1.5
0.0
0.0
0.0
0.1
0.0
0.0
100.0
2001
0.3
0.0
0.1
63.9
0.8
0.6
28.9
0.1
1.1
0.1
1.6
0.0
0.0
0.0
0.1
0.0
2.3
100.0
2002
0.2
0.0
0.1
61.7
1.0
0.5
30.1
0.0
1.0
0.1
1.3
0.0
0.0
0.0
0.1
0.0
3.7
100.0
2003
33
A
B
C
D
E
F
G
H
I
J
K
L
M
N
O
Q
Agriculture, Hunting and Forestry
Fishing
Mining and quarrying
Manufacturing
Electricity, gas and water supply
Construction
Wholesale and retail trade
Hotels and restaurants
Transport, storage and communication
Financial intermediation
Real estate, renting and business activities
Public administration and defence
Education
Health and social work
Other community service activities
Extra-territorial organizations and bodies
No data
NACE Chapters
0.86
0.61
0.56
0.94
0.12
0.70
0.82
0.15
0.53
0.00
0.66
.
0.90
0.48
0.18
.
.
1992
0.65
0.87
0.34
0.96
0.09
0.35
0.89
0.71
0.78
0.16
0.57
.
0.69
0.01
0.16
.
.
1993
0.92
0.98
0.25
0.90
0.64
0.47
0.70
0.85
0.83
0.02
0.51
.
0.56
0.78
0.10
.
.
1994
0.97
1.00
0.29
0.70
0.76
0.59
0.56
0.94
0.78
0.10
0.75
.
0.79
0.57
0.05
.
.
1995
0.95
1.00
0.22
0.93
1.00
0.71
0.36
0.14
0.47
0.01
0.23
.
0.52
0.21
0.06
.
.
1996
0.95
0.97
0.38
0.98
1.00
0.32
0.37
0.51
0.20
0.04
0.17
.
0.65
0.40
0.18
.
.
1997
0.95
0.69
0.45
0.97
1.00
0.38
0.39
0.51
0.09
0.01
0.24
.
0.63
0.58
0.17
.
.
1998
0.96
1.00
0.33
0.96
1.00
0.26
0.22
0.32
0.09
0.13
0.28
.
0.33
0.74
0.06
.
.
1999
0.97
0.99
0.37
0.92
1.00
0.27
0.44
0.13
0.12
0.04
0.40
.
0.05
0.82
0.16
.
.
2000
0.98
0.98
0.33
0.98
1.00
0.40
0.34
0.21
0.15
0.00
0.46
.
0.15
0.92
0.50
.
.
2001
0.71
0.99
0.50
0.99
1.00
0.49
0.53
0.27
0.91
0.00
0.24
.
0.06
0.19
0.02
.
.
2002
Table 15: Firm level correlation of APEH and customs export volumes by year and NACE chapter
0.95
1.00
0.51
0.98
0.77
0.34
0.13
0.48
0.89
0.00
0.11
.
0.08
0.25
0.02
.
.
2003
34
15
16
17
18
19
20
21
22
23
24
25
26
27
28
29
30
31
32
33
34
35
36
37
Food products and beverages
Tobacco products
Textiles
Wearing apparel
Tanning and dressing of leather
Wood
Pulp, paper
Publishing, printing
Coke, refined petroleum
Chemicals, and chemical products
Rubber and plastic products
Other non-metallic mineral products
Basic metals
Fabricated metal products
Machinery
Office machinery and computers
Electrical machinery
Radio, television and communication
Medical, precision and optical instruments
Motor vehicles
Other transport equipment
Furniture
Recycling
1992
0.92
0.82
0.68
0.88
0.80
0.76
0.99
0.85
1.00
0.89
1.00
0.95
1.00
0.89
0.90
0.88
0.99
0.35
0.92
0.98
0.81
0.80
0.71
1993
0.94
0.78
0.81
0.90
0.82
0.76
0.90
0.37
1.00
0.98
0.76
0.99
0.98
0.81
0.94
0.37
0.98
0.47
0.99
0.93
0.59
0.87
1.00
1994
0.99
0.73
0.81
0.85
0.87
0.89
0.99
0.55
1.00
1.00
0.93
0.99
1.00
0.85
0.96
0.47
0.97
0.59
0.99
0.44
0.92
0.90
1.00
1995
0.97
0.77
0.71
0.86
0.91
0.67
0.99
0.58
1.00
1.00
0.95
1.00
0.99
0.81
0.96
0.26
0.95
0.70
0.98
0.16
0.66
0.87
0.97
1996
0.99
0.81
0.60
0.84
0.86
0.84
0.95
0.81
1.00
1.00
0.93
0.96
0.99
0.95
0.96
0.99
0.73
0.91
0.96
1.00
0.59
0.93
0.97
1997
0.99
1.00
0.67
0.86
0.92
0.92
0.96
0.90
1.00
1.00
0.78
1.00
0.99
0.96
0.97
1.00
0.97
0.94
0.98
1.00
0.87
0.95
0.99
1998
0.98
0.99
0.71
0.88
0.85
0.95
0.98
0.93
1.00
1.00
0.68
1.00
0.99
0.98
0.97
0.97
0.99
0.88
0.97
1.00
0.96
0.97
0.99
1999
0.98
0.98
0.70
0.95
0.82
0.91
0.95
0.78
1.00
1.00
0.82
0.99
0.98
0.96
0.98
0.93
0.98
0.90
0.95
1.00
0.98
0.95
0.98
2000
0.97
0.96
0.94
0.97
0.81
0.96
1.00
0.81
1.00
1.00
0.78
0.99
1.00
0.92
0.98
0.94
0.95
0.66
0.92
1.00
0.90
0.98
1.00
2001
1.00
0.96
0.62
0.99
0.79
0.98
1.00
0.87
1.00
1.00
0.93
0.99
1.00
0.64
0.99
0.99
1.00
0.96
0.95
1.00
0.85
0.99
0.91
2002
0.99
0.99
0.90
0.99
0.77
0.98
0.98
0.62
1.00
0.99
0.94
0.99
1.00
0.95
0.99
0.96
0.99
1.00
0.97
1.00
0.94
0.98
0.97
Table 16: Firm level correlation of APEH and customs export volumes by year in manufacturing
2003
1.00
0.99
0.92
0.99
0.78
0.99
0.94
0.80
1.00
0.99
0.80
0.94
1.00
0.92
0.96
0.99
0.95
0.99
0.97
1.00
0.91
0.97
0.98
35
Food products and beverages
Tobacco products
Textiles
Wearing apparel
Tanning and dressing of leather
Wood
Pulp, paper
Publishing, printing
Coke, refined petroleum
Chemicals, and chemical products
Rubber and plastic products
Other non-metallic mineral products
Basic metals
Fabricated metal products
Machinery
Office machinery and computers
Electrical machinery
Radio, TV and communication equip.
Medical, precision and optical instruments
Motor vehicles
Other transport equipment
Furniture
Recycling
15
16
17
18
19
20
21
22
23
24
25
26
27
28
29
30
31
32
33
34
35
36
37
-8.5
85.7
35.4
75.9
76.9
22.2
37.0
-54.5
8.7
-16.4
7.4
5.0
11.5
-20.2
-20.7
0.0
17.0
60.8
21.1
-11.1
-25.0
-2.9
0.0
1992
-8.0
68.4
33.3
62.8
60.4
31.4
-8.3
-150.0
5.1
-11.0
-40.8
4.4
-1.8
-41.6
-16.0
-562.5
-6.1
60.6
-7.7
-8.2
18.2
-33.3
0.0
1993
1.2
51.5
43.8
70.2
66.5
11.8
4.3
-275.0
-0.7
4.9
20.3
4.6
5.1
-16.0
5.2
-200.0
-1.3
67.5
5.4
-66.2
23.5
5.6
-3.2
1994
-1.9
41.0
37.4
68.1
62.3
0.0
-7.5
-126.7
6.2
-0.2
12.3
-3.2
13.4
-18.2
0.1
-125.0
2.0
60.0
5.8
-202.2
16.3
-2.5
-28.3
1995
0.8
38.2
50.0
67.9
66.4
3.7
24.2
-33.3
5.1
2.4
19.7
-1.1
10.5
3.8
7.4
-25.8
-13.6
45.5
9.1
2.7
34.4
9.3
-26.7
1996
-2.8
70.9
43.6
66.7
64.6
9.2
16.3
-15.6
6.3
-0.9
22.2
3.0
4.5
4.5
8.8
-25.9
16.7
41.2
1.1
-9.0
25.2
3.8
-30.0
1997
Figures show the percentage difference of the APEH and CUSTOMS export data as: (CUSTOMS-APEH)/CUSTOMS*100
industry
NACE
Table 17: Discrepancy in the sources of exports volumes
0.9
66.0
47.7
64.4
57.2
12.7
22.8
-2.1
10.9
-1.3
24.2
4.0
-1.7
6.5
9.9
-4.9
24.2
30.6
8.1
-2.1
-24.8
8.5
-8.0
1998
4.4
75.0
54.5
58.7
57.4
16.0
25.5
-36.7
-10.8
-0.4
15.3
8.5
-9.9
7.0
8.2
-14.8
20.8
29.3
14.3
1.4
-9.6
12.7
-11.9
1999
2.4
69.8
33.9
55.0
55.9
10.5
7.9
-18.4
-13.0
-1.0
11.1
4.1
-1.9
9.4
9.6
-43.5
-1.7
46.2
20.0
-1.4
14.2
5.3
-4.5
2000
-0.6
44.0
48.3
52.9
53.7
4.0
6.6
-10.9
2.9
3.5
11.2
6.1
-0.3
-7.5
6.7
-2.8
2.1
5.8
15.0
12.0
20.5
5.0
18.3
2001
-4.6
23.2
34.3
49.5
53.1
9.8
9.9
-51.7
-1.5
0.1
9.5
3.6
1.4
4.8
4.4
19.8
-8.1
7.1
15.6
10.7
13.8
11.4
-15.2
2002
-4.1
31.6
34.5
50.0
56.3
7.1
2.7
-53.7
-4.4
1.6
-12.5
8.0
-3.9
2.7
-2.3
26.4
-19.5
-7.1
11.8
5.4
21.1
6.4
-6.0
2003
36
Industry
Food products and beverages
Tobacco products
Textiles
Wearing apparel
Tanning and dressing of leather
Wood
Pulp, paper
Publishing, printing
Coke, refined petroleum
Chemicals, and chemical products
Rubber and plastic products
Other non-metallic mineral products
Basic metals
Fabricated metal products
Machinery
Office machinery and computers
Electrical machinery
Radio, TV and communication equip.
Medical, precision and optical instruments
Motor vehicles
Other transport equipment
Furniture
Recycling
NACE
15
16
17
18
19
20
21
22
23
24
25
26
27
28
29
30
31
32
33
34
35
36
37
2252
7
625
932
319
977
201
1938
7
452
881
600
197
2126
1671
119
557
417
628
203
107
847
78
avg.
Obs
25.0
100.0
42.2
48.1
50.4
30.4
36.7
13.0
50.0
39.8
32.5
32.9
50.7
32.0
29.2
32.2
33.2
31.4
30.3
46.2
31.9
34.3
28.1
1992
21.1
66.7
40.8
47.5
49.2
29.5
33.6
11.4
75.0
41.3
34.6
30.3
46.9
30.2
28.4
33.0
34.7
33.1
29.7
48.7
37.1
32.3
31.6
1993
20.4
100.0
37.0
47.3
52.7
31.1
35.4
11.4
42.9
44.6
37.4
29.5
49.7
29.7
27.5
28.6
34.3
36.5
30.1
49.7
39.0
32.4
21.6
1994
22.4
83.3
33.1
44.0
49.4
31.3
27.9
10.6
18.2
41.2
37.0
31.9
45.4
29.5
28.3
28.0
34.1
35.1
29.1
46.4
43.7
31.0
26.3
1995
22.7
85.7
33.0
42.7
50.6
27.4
34.0
10.2
25.0
40.7
36.8
30.1
44.4
28.9
27.7
22.8
32.2
32.1
26.1
50.3
42.9
29.9
22.9
1996
22.5
85.7
30.3
40.0
49.6
27.7
28.8
9.8
22.2
38.2
39.7
28.6
44.4
29.8
26.6
16.1
31.0
28.1
26.7
55.1
35.8
26.9
26.4
1997
22.3
85.7
32.5
36.9
48.2
28.6
31.1
9.9
22.2
42.0
40.7
28.3
44.7
30.4
28.8
15.7
32.2
26.8
27.3
50.4
40.0
28.6
26.2
1998
Table 18: Share of exporting manufacturers per sector, in %
20.8
85.7
35.2
37.5
45.9
28.3
29.6
9.7
25.0
41.1
40.6
27.1
47.6
30.2
29.2
15.9
30.2
31.7
26.8
51.5
32.3
26.7
28.0
1999
32.8
100.0
49.6
47.9
56.4
39.4
41.3
22.8
75.0
51.8
53.1
38.8
61.0
46.1
43.1
30.0
47.3
46.4
41.9
62.7
45.5
38.5
41.9
2000
34.6
85.7
52.6
53.3
57.5
42.7
48.0
26.3
75.0
56.5
57.2
42.6
65.7
49.6
48.3
47.2
52.0
55.0
44.8
68.1
49.0
41.1
45.3
2001
33.6
71.4
52.2
52.2
56.5
37.8
40.7
25.6
80.0
58.2
59.6
38.3
69.7
48.0
51.0
36.8
53.7
50.4
44.8
70.6
55.9
42.4
44.7
2002
34.7
83.3
52.9
50.0
56.3
37.6
46.6
26.4
66.7
55.3
58.3
42.8
71.6
47.2
49.9
33.7
54.7
52.4
42.7
71.2
49.6
39.5
37.1
2003
37
industry
Food products and beverages
Tobacco products
Textiles
Wearing apparel
Tanning and dressing of leather
Wood
Pulp, paper
Publishing, printing
Coke, refined petroleum
Chemicals, and chemical products
Rubber and plastic products
Other non-metallic mineral products
Basic metals
Fabricated metal products
Machinery
Office machinery and computers
Electrical machinery
Radio, TV and communication equip.
Medical, precision and optical instruments
Motor vehicles
Other transport equipment
Furniture
Recycling
NACE
15
16
17
18
19
20
21
22
23
24
25
26
27
28
29
30
31
32
33
34
35
36
37
2252
7
625
932
319
977
201
1938
7
452
881
600
197
2126
1671
119
557
417
628
203
107
847
78
avg.
Obs
34.2
100.0
53.1
54.9
59.3
30.2
46.8
23.2
100.0
57.3
42.9
44.6
45.9
35.3
40.7
52.9
43.6
44.6
48.1
55.4
46.4
40.5
34.4
1992
28.1
100.0
50.9
54.6
56.9
28.2
47.7
22.3
75.0
57.2
40.9
40.6
41.7
34.5
38.6
51.5
43.8
43.2
42.5
50.0
47.1
40.5
36.8
1993
27.4
100.0
47.8
52.8
56.4
29.6
46.2
22.8
57.1
56.7
45.6
37.1
38.9
34.1
38.4
46.9
45.1
43.7
43.1
58.0
51.9
38.6
33.3
1994
25.7
83.3
41.6
49.1
52.2
27.2
40.2
20.2
36.4
52.7
40.3
37.3
40.0
32.1
38.3
45.8
44.9
44.9
39.3
54.7
56.3
35.1
28.1
1995
23.0
85.7
42.3
46.7
56.7
25.1
44.8
17.8
25.0
53.4
41.3
37.5
38.8
30.5
37.3
39.0
44.4
38.3
40.0
56.3
49.5
33.1
22.9
1996
22.3
100.0
39.8
44.7
54.9
23.5
39.6
17.5
22.2
49.6
43.3
33.4
37.0
30.0
38.2
34.2
39.6
33.7
38.6
58.8
45.5
31.9
26.4
1997
22.4
100.0
40.6
42.1
50.9
25.3
39.5
18.9
22.2
53.2
45.7
33.3
40.1
32.6
38.9
28.9
41.4
36.5
38.6
57.4
41.5
31.8
26.2
1998
Table 19: Share of importing manufacturers per sector, in %
22.3
100.0
43.6
41.5
51.1
27.2
39.1
16.4
37.5
53.2
45.9
35.7
39.5
31.4
39.8
32.3
41.9
40.8
38.4
57.3
42.5
33.3
25.2
1999
34.2
100.0
59.4
55.6
63.8
38.8
52.7
36.1
75.0
66.4
59.1
50.0
52.2
47.8
58.5
54.4
60.1
64.1
60.0
73.0
56.4
43.2
43.5
2000
37.4
100.0
61.8
56.1
63.6
40.2
58.8
37.5
75.0
69.0
66.6
52.7
61.7
52.3
62.0
65.2
62.3
65.3
55.9
76.5
61.0
47.7
53.1
2001
38.6
100.0
60.6
57.9
60.5
39.5
59.7
38.8
80.0
68.2
65.4
54.0
58.9
52.9
61.6
62.1
65.5
63.3
59.7
73.4
66.7
50.0
42.1
2002
40.3
83.3
63.0
57.2
59.6
44.3
64.3
40.4
66.7
70.7
66.3
58.7
63.9
52.3
61.9
56.5
66.0
69.0
61.0
77.2
58.4
49.3
46.1
2003
38
industry
Food products and beverages
Tobacco products
Textiles
Wearing apparel
Tanning and dressing of leather
Wood
Pulp, paper
Publishing, printing
Coke, refined petroleum
Chemicals, and chemical products
Rubber and plastic products
Other non-metallic mineral products
Basic metals
Fabricated metal products
Machinery
Office machinery and computers
Electrical machinery
Radio, TV and communication equipment
Medical, precision and optical instruments
Motor vehicles
Other transport equipment
Furniture
Recycling
TOTAL
NACE
15
16
17
18
19
20
21
22
23
24
25
26
27
28
29
30
31
32
33
34
35
36
37
14.8
0.5
4.0
12.2
5.4
1.1
1.2
0.5
5.8
12.4
2.4
2.1
8.2
3.8
5.9
0.4
6.7
3.0
1.4
6.4
0.4
1.4
0.1
100.0
1992
14.7
0.4
3.8
9.5
4.1
1.7
1.1
0.3
7.1
13.9
2.0
2.7
6.6
3.4
6.4
0.2
6.5
3.7
1.3
8.5
0.5
1.5
0.2
100.0
1993
14.1
0.5
3.8
10.1
3.7
1.6
1.3
0.3
5.7
13.0
3.3
2.3
7.6
3.6
6.1
0.2
8.3
5.3
1.3
5.5
0.5
1.5
0.4
100.0
1994
14.6
0.5
3.2
8.6
3.0
1.6
1.4
0.3
5.1
12.4
3.7
2.1
8.6
3.5
6.5
0.2
9.0
6.7
1.4
5.5
0.4
1.4
0.4
100.0
1995
12.1
0.7
3.6
7.1
2.7
1.4
1.6
0.2
3.8
9.0
3.4
2.0
5.1
3.2
5.7
3.5
11.2
6.1
1.1
14.3
0.5
1.3
0.3
100.0
1996
9.8
0.5
2.9
5.7
2.2
1.2
1.4
0.2
2.9
8.1
3.5
1.8
4.2
2.9
4.9
9.5
9.6
10.4
1.0
15.6
0.5
1.0
0.2
100.0
1997
7.7
0.4
2.6
5.3
2.0
1.1
1.4
0.2
2.0
6.2
3.2
1.6
3.5
2.8
4.5
10.9
8.8
12.6
1.0
20.6
0.4
1.0
0.2
100.0
1998
5.8
0.2
2.7
5.0
1.8
1.1
1.3
0.1
1.6
5.4
2.9
1.5
2.9
2.7
4.2
11.0
9.3
15.3
0.8
22.9
0.3
1.0
0.1
100.0
1999
Table 20: Manufacturing sectors share in export volume, in %
5.8
0.1
2.1
4.4
1.6
1.1
1.3
0.2
2.1
6.2
3.3
1.4
2.6
2.8
4.3
6.8
11.3
18.0
0.8
22.3
0.4
0.9
0.2
100.0
2000
5.5
0.1
2.1
4.3
1.4
0.9
1.3
0.2
2.1
5.7
3.3
1.2
2.6
2.6
4.0
7.3
14.3
17.7
0.8
21.3
0.5
0.8
0.2
100.0
2001
5.4
0.1
1.5
3.6
1.3
1.0
1.3
0.1
1.9
5.4
3.6
1.1
2.6
2.6
4.8
5.5
14.0
21.3
0.7
21.0
0.4
0.9
0.1
100.0
2002
5.5
0.1
1.4
3.5
1.0
0.9
1.4
0.1
2.0
5.9
3.5
1.2
2.6
2.7
4.9
2.9
9.5
26.5
0.8
22.2
0.5
0.9
0.1
100.0
2003
39
industry
Food products and beverages
Tobacco products
Textiles
Wearing apparel
Tanning and dressing of leather
Wood
Pulp, paper
Publishing, printing
Coke, refined petroleum
Chemicals, and chemical products
Rubber and plastic products
Other non-metallic mineral products
Basic metals
Fabricated metal products
Machinery
Office machinery and computers
Electrical machinery
Radio, TV and communication equipment
Medical, precision and optical instruments
Motor vehicles
Other transport equipment
Furniture
Recycling
TOTAL
NACE
15
16
17
18
19
20
21
22
23
24
25
26
27
28
29
30
31
32
33
34
35
36
37
8.9
2.0
4.1
12.3
4.8
1.3
4.9
1.8
12.5
10.4
3.8
1.7
7.0
2.8
4.5
1.1
5.6
3.7
1.6
3.6
0.5
1.0
0.0
100.0
1992
10.8
2.2
4.3
10.6
4.2
1.5
3.5
1.4
12.4
10.8
4.0
1.9
3.9
3.1
5.2
1.0
6.4
4.7
1.7
4.1
0.8
1.4
0.0
100.0
1993
12.3
1.7
4.0
9.1
3.6
1.4
3.9
1.5
9.1
10.5
3.8
1.7
6.4
3.0
4.8
0.7
7.4
7.2
1.4
4.6
0.7
1.2
0.1
100.0
1994
10.1
1.3
3.7
8.7
3.3
1.5
3.9
1.4
11.9
10.1
4.3
1.6
7.9
2.9
5.1
0.6
8.3
6.3
1.3
4.2
0.6
1.0
0.0
100.0
1995
6.6
1.1
4.1
7.1
2.7
1.0
3.1
1.1
11.1
7.3
3.3
1.5
4.4
2.5
4.2
3.7
9.3
9.3
1.1
14.0
0.6
0.8
0.0
100.0
1996
5.6
1.0
3.8
5.9
2.4
0.9
2.6
1.1
8.1
6.2
3.4
1.2
4.5
2.3
3.9
8.5
7.9
13.6
0.9
15.1
0.5
0.7
0.0
100.0
1997
4.8
0.8
3.3
5.3
2.1
0.8
2.3
1.1
5.5
5.1
3.6
1.2
3.0
2.3
3.8
9.7
7.8
15.4
0.9
20.0
0.5
0.7
0.0
100.0
1998
3.5
0.6
3.3
4.7
1.7
0.7
1.8
0.9
5.3
4.8
3.4
1.0
2.5
1.8
3.6
10.6
8.3
18.3
0.8
21.2
0.3
0.8
0.0
100.0
1999
Table 21: Manufacturing sectors share in import volume, in %
3.3
0.3
2.2
3.9
1.4
0.8
1.7
0.8
8.2
4.2
3.3
0.8
2.4
2.0
3.4
7.0
9.0
24.7
0.7
18.8
0.4
0.7
0.0
100.0
2000
3.3
0.4
2.2
4.1
1.5
0.7
1.6
0.8
6.8
3.7
3.1
0.9
2.1
2.1
3.4
9.3
11.9
21.7
0.7
18.7
0.4
0.7
0.1
100.0
2001
3.6
0.3
1.5
3.7
1.4
0.8
1.7
0.6
6.7
3.5
3.6
0.9
2.2
2.3
4.4
6.4
12.1
22.8
0.7
19.6
0.4
0.9
0.0
100.0
2002
3.6
0.3
1.4
3.6
1.1
0.8
1.8
0.6
6.8
4.5
3.7
1.1
2.0
2.2
4.6
2.4
8.6
27.8
0.7
20.9
0.5
0.9
0.0
100.0
2003
40
industry
Food products and beverages
Tobacco products
Textiles
Wearing apparel
Tanning and dressing of leather
Wood
Pulp, paper
Publishing, printing
Coke, refined petroleum
Chemicals, and chemical products
Rubber and plastic products
Other non-metallic mineral products
Basic metals
Fabricated metal products
Machinery
Office machinery and computers
Electrical machinery
Radio, television and comm. equip.
Medical, precision and optical instruments
Motor vehicles
Other transport equipment
Furniture
Recycling
NACE
15
16
17
18
19
20
21
22
23
24
25
26
27
28
29
30
31
32
33
34
35
36
37
0.01
0.52
0.03
0.01
0.05
0.03
0.30
0.08
1.00
0.08
0.35
0.12
0.17
0.03
0.06
0.41
0.21
0.21
0.11
0.28
0.16
0.03
0.35
1992
0.03
0.54
0.03
0.02
0.04
0.03
0.15
0.05
0.98
0.11
0.03
0.09
0.17
0.03
0.04
0.31
0.31
0.19
0.12
0.29
0.22
0.02
0.37
1993
0.02
0.58
0.03
0.01
0.03
0.03
0.17
0.05
0.93
0.10
0.04
0.07
0.16
0.02
0.04
0.37
0.22
0.14
0.07
0.15
0.28
0.02
0.36
1994
0.02
0.54
0.03
0.01
0.03
0.03
0.15
0.05
0.90
0.10
0.04
0.07
0.14
0.02
0.04
0.15
0.17
0.12
0.06
0.09
0.17
0.03
0.44
1995
0.02
0.50
0.05
0.01
0.03
0.04
0.16
0.05
0.91
0.09
0.04
0.06
0.18
0.02
0.04
0.45
0.10
0.13
0.05
0.20
0.18
0.02
0.32
1996
0.02
0.67
0.04
0.01
0.03
0.04
0.14
0.05
0.90
0.09
0.05
0.06
0.21
0.02
0.05
0.54
0.09
0.17
0.05
0.17
0.17
0.03
0.24
1997
0.02
0.77
0.05
0.01
0.03
0.04
0.17
0.05
0.95
0.09
0.05
0.06
0.19
0.02
0.04
0.41
0.08
0.15
0.04
0.30
0.21
0.03
0.20
1998
0.02
0.80
0.07
0.03
0.04
0.05
0.20
0.04
0.99
0.08
0.04
0.06
0.20
0.01
0.05
0.37
0.07
0.13
0.05
0.36
0.21
0.03
0.16
1999
0.02
0.65
0.03
0.04
0.04
0.05
0.20
0.04
0.92
0.09
0.04
0.06
0.28
0.01
0.06
0.54
0.08
0.11
0.05
0.34
0.22
0.03
0.20
2000
Table 22: Herfindahl indices of within sector export volume distribution
0.02
0.31
0.06
0.07
0.03
0.05
0.22
0.04
0.95
0.09
0.03
0.05
0.23
0.01
0.06
0.62
0.15
0.15
0.05
0.35
0.20
0.04
0.19
2001
0.02
0.28
0.02
0.09
0.04
0.07
0.19
0.03
0.96
0.10
0.04
0.05
0.23
0.01
0.06
0.61
0.15
0.26
0.04
0.35
0.19
0.04
0.14
2002
0.02
0.38
0.02
0.13
0.05
0.09
0.19
0.04
0.94
0.10
0.04
0.04
0.26
0.01
0.05
0.57
0.08
0.17
0.05
0.31
0.19
0.04
0.17
2003
41
industry
Food products and beverages
Tobacco products
Textiles
Wearing apparel
Tanning and dressing of leather
Wood
Pulp, paper
Publishing, printing
Coke, refined petroleum
Chemicals, and chemical products
Rubber and plastic products
Other non-metallic mineral products
Basic metals
Fabricated metal products
Machinery
Office machinery and computers
Electrical machinery
Radio, television and comm. equip.
Medical, precision and optical instruments
Motor vehicles
Other transport equipment
Furniture
Recycling
NACE
15
16
17
18
19
20
21
22
23
24
25
26
27
28
29
30
31
32
33
34
35
36
37
0.02
0.36
0.04
0.02
0.04
0.16
0.12
0.03
1.00
0.05
0.10
0.03
0.28
0.02
0.05
0.15
0.11
0.08
0.05
0.13
0.17
0.03
0.30
1992
0.02
0.30
0.03
0.02
0.04
0.09
0.10
0.03
0.89
0.06
0.03
0.03
0.28
0.02
0.06
0.22
0.09
0.07
0.06
0.15
0.25
0.04
0.33
1993
0.02
0.38
0.03
0.01
0.03
0.08
0.08
0.04
0.77
0.05
0.03
0.02
0.31
0.02
0.05
0.35
0.09
0.09
0.04
0.13
0.18
0.03
0.55
1994
0.02
0.38
0.05
0.01
0.04
0.09
0.08
0.04
0.85
0.05
0.03
0.02
0.21
0.03
0.05
0.18
0.07
0.06
0.05
0.08
0.17
0.05
0.38
1995
0.02
0.39
0.06
0.01
0.04
0.08
0.08
0.04
0.87
0.04
0.03
0.03
0.31
0.04
0.05
0.40
0.05
0.11
0.04
0.25
0.12
0.03
0.36
1996
0.03
0.44
0.06
0.01
0.04
0.10
0.10
0.05
0.90
0.05
0.06
0.03
0.27
0.02
0.06
0.42
0.05
0.13
0.04
0.27
0.15
0.03
0.16
1997
0.03
0.48
0.05
0.01
0.03
0.11
0.11
0.05
1.00
0.05
0.05
0.03
0.23
0.02
0.04
0.34
0.05
0.11
0.03
0.38
0.15
0.03
0.14
1998
0.03
0.44
0.08
0.03
0.04
0.09
0.11
0.05
1.00
0.06
0.04
0.03
0.25
0.02
0.05
0.34
0.04
0.10
0.05
0.44
0.15
0.03
0.12
1999
0.03
0.36
0.04
0.04
0.04
0.11
0.13
0.04
0.91
0.06
0.03
0.03
0.38
0.02
0.05
0.49
0.05
0.10
0.05
0.41
0.16
0.04
0.14
2000
Table 23: Herfindahl indices of within sector import volume distribution
0.03
0.31
0.07
0.08
0.04
0.12
0.11
0.05
0.90
0.05
0.02
0.03
0.33
0.02
0.05
0.59
0.13
0.13
0.05
0.37
0.18
0.04
0.61
2001
0.03
0.32
0.02
0.09
0.05
0.13
0.12
0.03
0.90
0.06
0.03
0.03
0.32
0.01
0.06
0.62
0.10
0.21
0.03
0.36
0.12
0.03
0.09
2002
0.03
0.42
0.02
0.14
0.05
0.13
0.12
0.02
0.91
0.08
0.03
0.03
0.29
0.01
0.06
0.51
0.04
0.15
0.04
0.32
0.14
0.04
0.10
2003
42
1
2
3
4
5
6
7
8
9
10
11
12
13
14
15
16
17
18
19
20
Budapest
Baranya
Bács-Kiskun
Békés
Borsod-Abaűj-Zemplén
Csongrád
Fejér
Győr-Moson-Sopron
Hajdű-Bihar
Heves
Komárom-Esztergom
Nógrád
Pest
Somogy
Szabolcs-Szatmár-Bereg
Jász-Nagykun-Szolnok
Tolna
Vas
Veszprém
Zala
County
34.6
2.2
3.6
3.8
4.9
3.0
9.0
5.8
4.1
1.8
1.5
1.4
2.6
1.6
2.9
3.5
2.9
4.2
3.2
2.1
1992
32.6
1.5
4.1
3.4
6.5
2.5
9.4
7.7
3.5
1.8
1.6
1.4
3.3
1.3
3.0
3.0
2.0
4.9
3.0
2.4
1993
28.8
1.5
4.5
3.2
6.6
2.7
11.3
6.8
3.7
1.4
1.8
1.6
3.8
2.0
3.2
3.1
2.0
5.2
3.7
2.1
1994
27.4
1.6
4.2
2.7
7.1
2.6
12.6
6.3
3.2
1.5
2.1
1.4
3.8
2.9
2.6
3.2
1.9
5.6
4.3
2.0
1995
23.5
1.9
3.3
2.3
4.9
2.2
13.0
8.1
2.4
1.5
3.9
1.3
4.2
2.4
2.2
2.8
1.6
12.9
2.9
1.6
1996
20.8
2.3
2.6
1.8
4.4
1.8
19.6
10.3
2.3
1.5
3.7
1.0
4.7
3.0
1.9
2.6
1.2
9.9
2.5
1.2
1997
17.0
2.3
2.6
1.4
3.6
1.7
19.3
15.5
2.2
1.5
3.2
0.9
6.1
2.8
2.0
2.1
1.1
10.4
2.2
1.1
1998
15.3
1.9
2.3
1.0
3.2
1.4
19.6
19.4
1.8
1.3
2.6
1.1
6.3
2.8
2.3
2.2
1.1
10.3
2.2
1.1
1999
18.6
0.9
2.3
1.0
3.7
1.4
14.8
17.3
1.7
1.5
5.5
1.3
9.0
3.2
2.6
2.2
0.9
7.7
2.3
1.0
2000
18.4
0.9
2.3
0.9
3.7
1.3
16.9
16.8
1.8
1.6
7.9
1.0
4.3
5.2
2.7
2.2
0.8
7.1
2.2
0.9
2001
Table 24: Spatial distribution of export volume, share of NUTS-3 level entities, in %
16.7
0.9
2.3
0.9
3.6
1.2
14.6
16.6
2.0
1.8
8.1
1.0
4.7
10.1
2.7
2.1
0.8
5.8
2.2
0.8
2002
17.4
0.9
2.3
0.8
3.6
1.2
10.1
16.9
2.1
1.8
10.4
1.0
7.7
7.8
2.9
2.1
0.6
6.0
2.6
0.8
2003
43
1
2
3
4
5
6
7
8
9
10
11
12
13
14
15
16
17
18
19
20
Budapest
Baranya
Bács-Kiskun
Békés
Borsod-Abaűj-Zemplén
Csongrád
Fejér
Győr-Moson-Sopron
Hajdű-Bihar
Heves
Komárom-Esztergom
Nógrád
Pest
Somogy
Szabolcs-Szatmár-Bereg
Jász-Nagykun-Szolnok
Tolna
Vas
Veszprém
Zala
County
34.6
2.2
3.6
3.8
4.9
3.0
9.0
5.8
4.1
1.8
1.5
1.4
2.6
1.6
2.9
3.5
2.9
4.2
3.2
2.1
1992
32.6
1.5
4.1
3.4
6.5
2.5
9.4
7.7
3.5
1.8
1.6
1.4
3.3
1.3
3.0
3.0
2.0
4.9
3.0
2.4
1993
28.8
1.5
4.5
3.2
6.6
2.7
11.3
6.8
3.7
1.4
1.8
1.6
3.8
2.0
3.2
3.1
2.0
5.2
3.7
2.1
1994
27.4
1.6
4.2
2.7
7.1
2.6
12.6
6.3
3.2
1.5
2.1
1.4
3.8
2.9
2.6
3.2
1.9
5.6
4.3
2.0
1995
23.5
1.9
3.3
2.3
4.9
2.2
13.0
8.1
2.4
1.5
3.9
1.3
4.2
2.4
2.2
2.8
1.6
12.9
2.9
1.6
1996
20.8
2.3
2.6
1.8
4.4
1.8
19.6
10.3
2.3
1.5
3.7
1.0
4.7
3.0
1.9
2.6
1.2
9.9
2.5
1.2
1997
17.0
2.3
2.6
1.4
3.6
1.7
19.3
15.5
2.2
1.5
3.2
0.9
6.1
2.8
2.0
2.1
1.1
10.4
2.2
1.1
1998
15.3
1.9
2.3
1.0
3.2
1.4
19.6
19.4
1.8
1.3
2.6
1.1
6.3
2.8
2.3
2.2
1.1
10.3
2.2
1.1
1999
18.6
0.9
2.3
1.0
3.7
1.4
14.8
17.3
1.7
1.5
5.5
1.3
9.0
3.2
2.6
2.2
0.9
7.7
2.3
1.0
2000
18.4
0.9
2.3
0.9
3.7
1.3
16.9
16.8
1.8
1.6
7.9
1.0
4.3
5.2
2.7
2.2
0.8
7.1
2.2
0.9
2001
Table 25: Spatial distribution of import volume, share of NUTS-3 level entities, in %
16.7
0.9
2.3
0.9
3.6
1.2
14.6
16.6
2.0
1.8
8.1
1.0
4.7
10.1
2.7
2.1
0.8
5.8
2.2
0.8
2002
17.4
0.9
2.3
0.8
3.6
1.2
10.1
16.9
2.1
1.8
10.4
1.0
7.7
7.8
2.9
2.1
0.6
6.0
2.6
0.8
2003
Table 26
Average number of export markets served and imports served by
Year
Average number of export
markets served
1992
1993
1994
1995
1996
1997
1998
1999
2000
2001
2002
2003
3.38
3.36
3.41
3.45
3.54
3.58
3.61
3.65
3.76
3.79
3.83
3.98
unweighted average
44
Average Number of import
market served
by
3.12
3.27
3.41
3.63
3.87
4.34
4.66
4.85
4.98
5.04
5.08
5.25
Table 27
Top 15 Export partners by volume of trade in 1992, 1999 and 2003
year
country
exports
(Bn.
HUF)
shipments
firms
products
share %
Germany
Austria
Italy
United States of America
France
Soviet Union
Russian Federation
United Kingdom
Belgium and Luxembourg
Czechoslovakia
Netherlands
Switzerland
Turkey
Spain
Poland
154.3
55.4
44.4
19.7
19.3
19.1
14.3
12.8
11.6
11.5
10.6
9.1
8.9
7.2
6.7
10983
5015
2235
1118
1672
905
894
960
810
2243
1277
1374
243
328
729
1974
1326
711
359
453
282
254
373
291
716
431
470
106
159
297
2217
1734
1028
633
772
548
469
624
516
1111
713
747
200
252
469
30.8
11.0
8.8
3.9
3.9
3.8
2.9
2.5
2.3
2.3
2.1
1.8
1.8
1.4
1.3
Germany
Austria
United States of America
Italy
Netherlands
United Kingdom
France
Belgium and Luxembourg
Poland
Spain
Romania
Czech Republic
Russian Federation
Switzerland
Ireland
2157.7
480.6
301.6
290.7
289.0
254.6
250.3
170.0
101.7
88.6
77.4
75.3
66.1
61.4
58.7
25032
10567
2126
5783
2696
2720
4141
2143
2631
955
7532
2681
1815
2620
294
2942
1917
577
1122
694
631
780
493
720
343
1320
775
400
714
122
2792
2160
977
1662
1131
1109
1275
977
1136
536
2116
1163
762
1081
218
40.4
9.0
5.6
5.4
5.4
4.8
4.7
3.2
1.9
1.7
1.4
1.4
1.2
1.2
1.1
Germany
Austria
France
Italy
United Kingdom
Netherlands
Sweden
United States of America
Spain
Belgium and Luxembourg
Poland
Czech Republic
Slovakia
Romania
Russian Federation
2972.2
567.5
493.6
467.8
396.6
328.0
295.9
274.7
249.1
202.4
188.0
165.3
161.8
161.4
118.6
27227
11790
5409
6614
4146
3510
1981
3351
1729
2644
2972
3894
5639
11065
1976
3291
2080
981
1262
835
840
557
714
467
612
799
1038
1409
1657
416
2815
2241
1427
1772
1289
1278
853
1197
789
1044
1250
1409
1790
2448
870
35.9
6.9
6.0
5.6
4.8
4.0
3.6
3.3
3.0
2.4
2.3
2.0
2.0
1.9
1.4
1992
1999
2003
45
Table 28
Top 15 Import partners by volume of trade in 1992, 1999 and 2003
year
country
imports
(Bn.
HUF)
shipments
firms
products
share %
Germany
Austria
Russian Federation
Italy
Soviet Union
Czechoslovakia
France
Netherlands
Switzerland
Belgium and Luxembourg
United States of America
United Kingdom
Poland
Sweden
Ukraine
93.8
47.4
25.7
24.3
14.7
12.0
10.8
9.8
9.3
8.8
8.6
8.5
6.3
4.8
4.4
45233
25086
265
9703
478
2452
5211
3818
5598
2577
3191
3377
396
2449
256
2759
2092
115
1287
173
780
718
590
723
407
545
677
179
415
120
3501
2967
193
2005
334
1075
1595
1463
1663
1139
1230
1329
278
1014
189
28.4
14.3
7.8
7.4
4.5
3.6
3.3
3.0
2.8
2.7
2.6
2.6
1.9
1.4
1.3
Germany
Austria
Italy
Russian Federation
Japan
France
United States of America
Belgium and Luxembourg
United Kingdom
Netherlands
China
Singapore
Taiwan
Switzerland
Korea
1500.7
461.4
303.2
249.9
193.8
167.1
127.8
105.3
102.0
95.5
91.0
89.1
61.1
56.9
55.1
103134
31590
33467
746
9086
15408
16164
7201
11871
9343
3769
1120
3214
9785
1529
4189
2521
2729
257
1085
1655
1638
1022
1559
1281
773
205
697
1413
417
3822
2872
2932
467
1514
2491
2171
1800
2083
2036
1143
352
826
1827
603
34.4
10.6
7.0
5.7
4.4
3.8
2.9
2.4
2.3
2.2
2.1
2.0
1.4
1.3
1.3
Germany
China
Austria
Italy
Russian Federation
Japan
France
United States of America
Korea
Poland
United Kingdom
Czech Republic
Malaysia
Taiwan
Netherlands
1846.1
485.2
422.2
405.9
358.0
339.0
265.0
203.8
178.8
151.0
135.9
118.1
114.2
112.3
106.4
105438
8483
30345
36719
675
11268
16928
17534
2603
3959
12752
6198
1790
4891
10115
4945
1345
2749
3247
274
1242
1962
1787
568
1113
1706
1519
351
968
1508
3849
1650
2812
3070
397
1544
2528
2106
889
1303
2094
1626
424
951
2036
28.8
7.6
6.6
6.3
5.6
5.3
4.1
3.2
2.8
2.4
2.1
1.8
1.8
1.8
1.7
1992
1999
2003
46
Table 29
Top 15 Export partners by number of trading firms in 1992, 1999 and 2003
year
country
exports
(Bn.
HUF)
shipments
firms
products
share %
Germany
Austria
Czechoslovakia
Italy
Switzerland
France
Romania
Netherlands
Sweden
United Kingdom
United States of America
Poland
Belgium and Luxembourg
Soviet Union
Russian Federation
154.3
55.4
11.5
44.4
9.1
19.3
6.4
10.6
6.3
12.8
19.7
6.7
11.6
19.1
14.3
10983
5015
2243
2235
1374
1672
1915
1277
1008
960
1118
729
810
905
894
1974
1326
716
711
470
453
438
431
386
373
359
297
291
282
254
2217
1734
1111
1028
747
772
916
713
582
624
633
469
516
548
469
30.8
11.0
2.3
8.8
1.8
3.9
1.3
2.1
1.3
2.5
3.9
1.3
2.3
3.8
2.9
Germany
Austria
Romania
Italy
Slovakia
France
Czech Republic
Poland
Switzerland
Netherlands
United Kingdom
United States of America
Slovenia
Belgium and Luxembourg
Croatia
2157.7
480.6
77.4
290.7
49.8
250.3
75.3
101.7
61.4
289.0
254.6
301.6
39.8
170.0
22.0
25032
10567
7532
5783
3552
4141
2681
2631
2620
2696
2720
2126
1588
2143
1755
2942
1917
1320
1122
1026
780
775
720
714
694
631
577
525
493
493
2792
2160
2116
1662
1413
1275
1163
1136
1081
1131
1109
977
853
977
959
40.4
9.0
1.4
5.4
0.9
4.7
1.4
1.9
1.2
5.4
4.8
5.6
0.7
3.2
0.4
Germany
Austria
Romania
Slovakia
Italy
Czech Republic
France
Switzerland
Netherlands
United Kingdom
Poland
Serbia and Montenegro
United States of America
Croatia
Belgium and Luxembourg
2972.2
567.5
161.4
161.8
467.8
165.3
493.6
101.2
328.0
396.6
188.0
45.3
274.7
63.6
202.4
27227
11790
11065
5639
6614
3894
5409
3646
3510
4146
2972
3452
3351
2923
2644
3291
2080
1657
1409
1262
1038
981
864
840
835
799
746
714
703
612
2815
2241
2448
1790
1772
1409
1427
1306
1278
1289
1250
1543
1197
1315
1044
35.9
6.9
1.9
2.0
5.6
2.0
6.0
1.2
4.0
4.8
2.3
0.5
3.3
0.8
2.4
1992
1999
2003
47
Table 30
Top 15 Import partners by number of trading firms in 1992, 1999 and 2003
year
country
imports
(Bn.
HUF)
shipments
firms
products
share %
Germany
Austria
Russian Federation
Italy
Soviet Union
Czechoslovakia
France
Netherlands
Switzerland
Belgium and Luxembourg
United States of America
United Kingdom
Poland
Sweden
Ukraine
93.8
47.4
25.7
24.3
14.7
12.0
10.8
9.8
9.3
8.8
8.6
8.5
6.3
4.8
4.4
45233
25086
265
9703
478
2452
5211
3818
5598
2577
3191
3377
396
2449
256
2759
2092
115
1287
173
780
718
590
723
407
545
677
179
415
120
3501
2967
193
2005
334
1075
1595
1463
1663
1139
1230
1329
278
1014
189
28.4
14.3
7.8
7.4
4.5
3.6
3.3
3.0
2.8
2.7
2.6
2.6
1.9
1.4
1.3
Germany
Italy
Austria
France
United States of America
United Kingdom
Switzerland
Netherlands
Czech Republic
Japan
Belgium and Luxembourg
Slovakia
Spain
China
Poland
1500.7
303.2
461.4
167.1
127.8
102.0
56.9
95.5
48.4
193.8
105.3
52.8
51.7
91.0
45.6
103134
33467
31590
15408
16164
11871
9785
9343
4136
9086
7201
2557
3719
3769
2210
4189
2729
2521
1655
1638
1559
1413
1281
1225
1085
1022
928
854
773
754
3822
2932
2872
2491
2171
2083
1827
2036
1393
1514
1800
1005
1310
1143
985
34.4
7.0
10.6
3.8
2.9
2.3
1.3
2.2
1.1
4.4
2.4
1.2
1.2
2.1
1.0
Germany
Italy
Austria
France
United States of America
United Kingdom
Switzerland
Czech Republic
Netherlands
China
Japan
Belgium and Luxembourg
Slovakia
Spain
Poland
1846.1
405.9
422.2
265.0
203.8
135.9
77.7
118.1
106.4
485.2
339.0
82.8
99.6
88.7
151.0
105438
36719
30345
16928
17534
12752
10966
6198
10115
8483
11268
7283
3540
5225
3959
4945
3247
2749
1962
1787
1706
1591
1519
1508
1345
1242
1225
1198
1154
1113
3849
3070
2812
2528
2106
2094
1796
1626
2036
1650
1544
1725
1169
1557
1303
28.8
6.3
6.6
4.1
3.2
2.1
1.2
1.8
1.7
7.6
5.3
1.3
1.6
1.4
2.4
1992
1999
2003
48
Table 31
Top 15 Export partners by volume with pre-transition geopolitical entities 1992,
1999 and 2003
year
country
exports
(Bn.
HUF)
shipments
firms
products
share %
Germany
Austria
Italy
”Soviet Union”
United States of America
France
”Yugoslavia”
United Kingdom
Belgium and Luxembourg
”Czechoslovakia”
Netherlands
Switzerland
Turkey
Spain
Poland
154.3
55.4
44.4
41.8
19.7
19.3
14.2
12.8
11.6
11.5
10.6
9.1
8.9
7.2
6.7
10983
5015
2235
3213
1118
1672
1479
960
810
2243
1277
1374
243
328
729
1974
1326
711
520
359
453
388
373
291
716
431
470
106
159
297
2217
1734
1028
1089
633
772
699
624
516
1111
713
747
200
252
469
30.8
11.0
8.8
8.3
3.9
3.9
2.8
2.5
2.3
2.3
2.1
1.8
1.8
1.4
1.3
Germany
Austria
United States of America
Italy
Netherlands
United Kingdom
France
Belgium and Luxembourg
”Soviet Union”
”Czechoslovakia”
”Yugoslavia”
Poland
Spain
Romania
Switzerland
2157.7
480.6
301.6
290.7
289.0
254.6
250.3
170.0
125.3
125.1
104.3
101.7
88.6
77.4
61.4
25032
10567
2126
5783
2696
2720
4141
2143
6249
6233
6594
2631
955
7532
2620
2942
1917
577
1122
694
631
780
493
766
1361
1076
720
343
1320
714
2792
2160
977
1662
1131
1109
1275
977
1452
1762
1842
1136
536
2116
1081
40.4
9.0
5.6
5.4
5.4
4.8
4.7
3.2
2.3
2.3
2.0
1.9
1.7
1.4
1.2
Germany
Austria
France
Italy
United Kingdom
Netherlands
”Czechoslovakia”
Sweden
United States of America
Spain
”Soviet Union”
”Yugoslavia”
Belgium and Luxembourg
Poland
Romania
2972.2
567.5
493.6
467.8
396.6
328.0
327.1
295.9
274.7
249.1
222.7
216.1
202.4
188.0
161.4
27227
11790
5409
6614
4146
3510
9533
1981
3351
1729
7442
10125
2644
2972
11065
3291
2080
981
1262
835
840
1863
557
714
467
850
1418
612
799
1657
2815
2241
1427
1772
1289
1278
2110
853
1197
789
1666
2252
1044
1250
2448
35.9
6.9
6.0
5.6
4.8
4.0
3.9
3.6
3.3
3.0
2.7
2.6
2.4
2.3
1.9
1992
1999
2003
49
Table 32
Top 15 Import partners by volume with pre-transition geopolitical entities 1992,
1999 and 2003
year
country
imports
(Bn.
HUF)
shipments
firms
products
share %
Germany
Austria
”Soviet Union”
Italy
”Czechoslovakia”
France
Netherlands
Switzerland
Belgium and Luxembourg
United States of America
United Kingdom
Poland
”Yugoslavia”
Sweden
Finland
93.8
47.4
45.7
24.3
12.0
10.8
9.8
9.3
8.8
8.6
8.5
6.3
5.2
4.8
4.2
45233
25086
1077
9703
2452
5211
3818
5598
2577
3191
3377
396
713
2449
776
2759
2092
288
1287
780
718
590
723
407
545
677
179
263
415
240
3501
2967
535
2005
1075
1595
1463
1663
1139
1230
1329
278
422
1014
415
28.4
14.3
13.8
7.4
3.6
3.3
3.0
2.8
2.7
2.6
2.6
1.9
1.6
1.4
1.3
Germany
Austria
Italy
”Soviet Union”
Japan
France
United States of America
Belgium and Luxembourg
United Kingdom
”Czechoslovakia”
Netherlands
China
Singapore
Taiwan
Switzerland
1500.7
461.4
303.2
291.5
193.8
167.1
127.8
105.3
102.0
101.3
95.5
91.0
89.1
61.1
56.9
103134
31590
33467
1617
9086
15408
16164
7201
11871
6693
9343
3769
1120
3214
9785
4189
2521
2729
529
1085
1655
1638
1022
1559
1729
1281
773
205
697
1413
3822
2872
2932
760
1514
2491
2171
1800
2083
1756
2036
1143
352
826
1827
34.4
10.6
7.0
6.7
4.4
3.8
2.9
2.4
2.3
2.3
2.2
2.1
2.0
1.4
1.3
Germany
”Soviet Union”
China
Austria
Italy
Japan
France
”Czechoslovakia”
United States of America
Korea
Poland
United Kingdom
Malaysia
Taiwan
Netherlands
1846.1
503.0
485.2
422.2
405.9
339.0
265.0
217.7
203.8
178.8
151.0
135.9
114.2
112.3
106.4
105438
2013
8483
30345
36719
11268
16928
9738
17534
2603
3959
12752
1790
4891
10115
4945
659
1345
2749
3247
1242
1962
2145
1787
568
1113
1706
351
968
1508
3849
821
1650
2812
3070
1544
2528
2000
2106
889
1303
2094
424
951
2036
28.8
7.8
7.6
6.6
6.3
5.3
4.1
3.4
3.2
2.8
2.4
2.1
1.8
1.8
1.7
1992
1999
2003
50
Table 33
Description of the Wholesale and Resale sectors
NACE
50
51
52
1992
1993
1994
1995
1996
1997
1998
1999
2000
2001
2002
2003
Sale, maintenance and repair of motor vehicles; retail sale of automotive fuel
Wholesale trade and commission trade
Retail trade, repair of personal and household goods
Number of firms
50
2036
51
10927
52
6197
2620
13362
7495
3296
15774
8803
3934
17678
10405
4393
19150
11769
5007
21013
13431
5337
21854
14627
5323
21572
14976
3233
13025
7236
3271
12972
7457
3587
13434
7592
3700
13230
7492
Share of exporters (%)
50
16.1
13.4
51
27.3
24.4
52
11.2
9.3
11.1
23.2
8.6
12.3
22.6
8.2
11.1
20.2
7.3
10.5
19.4
6.5
10.7
19.8
6.8
9.5
19.2
6.3
15.6
33.6
14.0
18.4
39.8
16.4
16.5
37.8
15.1
17.5
38.1
14.0
Share of total export volume (%)
50
1.4
1.7
1.6
51
15.2
13.7
11.7
52
1.1
2.2
1.2
1.4
12.6
0.6
0.5
8.2
0.5
0.3
7.7
0.3
0.3
6.6
0.3
0.3
5.5
0.3
0.3
5.6
0.4
0.3
5.5
0.4
0.2
5.1
0.4
0.2
4.8
0.4
Average number of Destinations
50
1.7
1.8
2.2
51
2.4
2.4
2.3
52
2.0
2.0
1.9
2.3
2.3
1.8
2.3
2.4
1.9
2.2
2.4
1.9
2.3
2.4
1.9
2.2
2.5
2.0
2.2
2.5
2.0
2.3
2.5
2.0
2.3
2.6
2.0
2.3
2.6
1.9
Average number of product categories
50
6.8
7.4
10.2
51
6.1
5.9
6.1
52
5.3
4.6
5.0
exported
9.5
11.2
5.9
6.1
4.8
6.0
13.1
6.1
6.4
15.1
6.6
6.5
15.7
6.8
6.4
16.2
7.0
6.8
15.3
7.3
6.7
17.3
7.4
8.2
14.0
7.2
7.8
Share of importers (%)
50
45.0
41.4
51
46.3
44.3
52
28.8
25.3
37.4
41.7
23.0
30.2
37.9
19.4
24.2
35.1
16.9
21.4
33.3
15.9
20.6
33.9
15.6
20.4
34.1
15.6
36.3
58.0
32.6
44.3
61.3
34.5
45.7
62.9
35.7
47.6
66.0
37.3
Share of total import volume (%)
50
5.4
7.4
7.0
51
27.6
30.5
29.8
52
4.3
4.4
4.0
5.6
25.8
3.3
4.5
23.9
2.5
5.0
22.8
2.5
5.3
21.3
2.6
5.4
19.4
2.4
4.9
18.9
2.2
5.3
19.3
2.2
6.2
20.4
2.4
6.5
21.3
2.3
3.3
3.4
3.1
3.6
3.7
3.3
4.5
4.1
3.7
4.7
4.4
4.0
4.7
4.6
4.2
5.0
4.7
4.5
5.0
4.8
4.5
5.0
4.9
4.5
5.2
5.0
4.5
categories imported
26.4
25.7
27.1
14.6
14.4
15.5
13.2
13.1
14.4
31.2
16.7
15.6
32.4
18.1
17.0
31.6
19.3
17.9
31.6
19.3
18.7
26.9
19.5
18.4
25.3
20.1
19.1
26.1
20.1
19.2
Average number of origins
50
3.0
2.8
51
3.1
3.2
52
2.5
2.7
Average number of product
50
24.7
23.7
51
14.7
14.2
52
12.8
13.3
3.0
3.2
2.7
51
Discussion Papers published since 2008
2008
CSERES-GERGELY Zsombor - MOLNÁR György: Háztartási fogyasztói magatartás és
jólét Magyarországon. Kísérlet egy modell adaptációjára. MT-DP.2008/1
JUHÁSZ Anikó – KÜRTI Andrea – SERES Antal – STAUDER Márta:
A kereskedelem koncentrációjának hatása a kisárutermelésre és a zöldség-gyümölcs
kisárutermelők alkalmazkodása. Helyzetelemzés. MT-DP. 2008/2
Ákos VALENTINYI – Berthold HERRENDORF: Measuring Factor Income Shares at the
Sectoral Level. MT-DP.2008/3
Pál VALENTINY: Energy services at local and national level in the transition period in
Hungary. MT-DP.2008/4
András
SIMONOVITS:
Underreported
Earnings
and
Old-Age
Pension:
An Elementary Model. MT-DP.2008/5
Max GILLMAN – Michal KEJAK: Tax Evasion and Growth: a Banking Approach. MTDP.2008/6
LACKÓ Mária – SEMJÉN András: Rejtett gazdaság, rejtett foglalkoztatás és a
csökkentésükre irányuló kormányzati politikák - irodalmi áttekintés. MT-DP. 2008/7
LACKÓ Mária: Az adóráták és a korrupció hatása az adóbevételekre - nemzetközi
összehasonlítás (OECD országok, 2000-2004). MT-DP. 2008/8
SEMJÉN András – TÓTH István János – FAZEKAS Mihály: Az EVA tapasztalatai
vállalkozói interjúk alapján. MT-DP. 2008/9
SEMJÉN András – TÓTH István János – FAZEKAS Mihály: Alkalmi munkavállalói
könyves foglalkoztatás munkaadói és munkavállói interjúk tükrében. MT-DP. 2008/10
SEMJÉN András – TÓTH István János – MAKÓ Ágnes: Az alkalmi munkavállalói
könyvvel történő foglalkoztatás jellemzői. Egy 2008. áprilisi kérdőíves munkavállalói
adatfelvétel eredményei. MT-DP. 2008/11
FAZEKAS
Mihály:
A
rejtett
gazdaságból
való
kilépés
dilemmái
Esettanulmány - budapesti futárszolgálatok, 2006-2008. MT-DP. 2008/12
SEMJÉN András – TÓTH István János – MEDGYESI Márton – CZIBIK Ágnes:
Adócsalás és korrupció: lakossági érintettség és elfogadottság. MT-DP. 2008/13
BÍRÓ Anikó - VINCZE János: A gazdaság fehérítése: büntetés és ösztönzés.
Költségek és hasznok egy modellszámítás tükrében. MT-DP. 2008/14
Imre FERTŐ - Károly Attila SOÓS: Marginal Intra-Industry Trade and Adjustment Costs
- A Hungarian-Polish Comparison. MT-DP. 2008/15
Imre FERTŐ - Károly Attila SOÓS: Duration of trade of former communist countries at
the EU. MT-DP. 2008/16
FERTŐ Imre: A magyar agrárexport kereskedelmi előnyei és versenyképessége az EU
piacán. MT-DP. 2008/17
Zsolt BEDŐ - Éva OZSVALD: Codes of Good Governance in Hungary. MT-DP. 2008/18
DARVAS Zsolt - SZAPÁRY György: Az euróövezet bővítése és euróbevezetési stratégiák.
MT-DP. 2008/19
László Á. KÓCZY: Strategic Power Indices: Quarrelling in Coalitions. MT-DP. 2008/20
Sarolta LACZÓ: Riskiness, Risk Aversion, and Risk Sharing: Cooperation in a Dynamic
Insurance Game. MT-DP. 2008/21
Zsolt DARVAS: Leveraged Carry Trade Portfolios. MT-DP. 2008/22
KARSAI Judit: "Az aranykor vége" - A kockázati- és magántőke-ágazat fejlődése Középés Kelet-Európában. MT-DP. 2008/23
Zsolt DARVAS - György SZAPÁRY: Euro Area Enlargement and Euro Adoption
Strategies. MT-DP. 2008/24
Helmuts ĀZACIS - Max GILLMAN: Flat Tax Reform: The Baltics 2000 – 2007.
MT-DP. 2008/25
Ádám SZENTPÉTERI - Álmos TELEGDY: Political Selection of Firms into Privatization
Programs.
Evidence
from
Romanian
Comprehensive
Data.
MT-DP. 2008/26
DARVAS Zsolt - SZAPÁRY György: Az új EU-tagországok megfelelése az optimális
valutaövezet kritériumainak. MT-DP. 2008/27
CSATÓ Katalin: Megjegyzések Navratil Ákos elmélettörténetéhez. MT-DP. 2008/28
2009
Judit KARSAI: The End of the Golden Age - The Developments of the Venture Capital
and Private Equity Industry in Central and Eastern Europe. MT-DP. 2009/1
András SIMONOVITS: When and How to Subsidize Tax-Favored Retirement Accounts?
MT-DP.2009/2
Mária CSANÁDI: The "Chinese Style Reforms" and the Hungarian "Goulash
Communism". MT-DP. 2009/3
Mária
CSANÁDI:
The
Metamorphosis
of
the
Communist
Party:
from Entity to System and from System towards an Entity. MT-DP. 2009/4
Mária CSANÁDI – Hairong LAI – Ferenc GYURIS: Global Crisis and its Implications on
the Political Transformation in China. MT-DP. 2009/5
DARVAS Zsolt - SZAPÁRY György: Árszínvonal-konvergencia az új EU tagországokban:
egy panel-regressziós modell eredményei. MT-DP. 2009/6
KÜRTI Andrea - KOZAK Anita - SERES Antal - SZABÓ Márton: Mezőgazdasági
kisárutermelők nagy kereskedelmi láncooknak történő beszállítása a nagyvevői igények
alapján a zöldség-gyümölcs ágazatban. MT-DP.2009/7
András SIMONOVITS: Hungarian Pension System and its Reform. MT-DP.2009/8
Balázs MURAKÖZY - Gábor BÉKÉS: Temporary Trade. MT-DP. 2009/9
Alan AHEARNE - Herbert BRÜCKER - Zsolt DARVAS - Jakob von WEIZSÄCKER:
Cyclical Dimensions of Labour Mobility after EU Enlargement. MT-DP. 2009/10
Max GILLMAN - Michal KEJAK: Inflation, Investment and Growth: a Money and
Banking Approach. MT-DP. 2009/11
Max GILLMAN - Mark N. HARRIS: The Effect of Inflation on Growth: Evidence from a
Panel of Transition Countries. MT-DP. 2009/12
Zsolt DARVAS: Monetary Transmission in Three Central European Economies:
Evidence from Time-Varying Coefficient Vector Autoregressions. MT-DP. 2009/13
Carlo ALTOMONTE - Gábor BÉKÉS: Trade Complexity and Productivity. MT-DP.
2009/14
András SIMONOVITS: A Simple Model of Tax-Favored Retirement Accounts. MT-DP.
2009/15
Ádám SZENTPÉTERI - Álmos TELEGDY: Political Selection of Firms into Privatization
Programs. Evidence from Romanian Comprehensive Data. MT-DP. 2009/16
András SIMONOVITS: Pension Reforms in an Aging Society: A Fully Displayed Cohort
Model. MT-DP. 2009/17
VALENTINY Pál-KISS Károly Miklós: A nélkülözhetetlen eszközök értelmezése és a
postai szolgáltatások. MT-DP. 2009/18
Discussion Papers are available at the website of Institute of Economics
Hungarian Academy of Sciences: http://econ.core.hu
© Copyright 2026 Paperzz

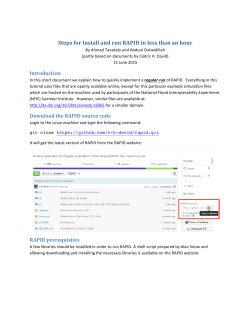

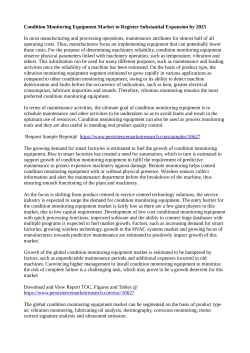


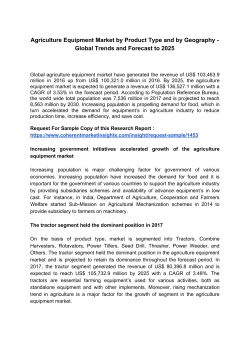
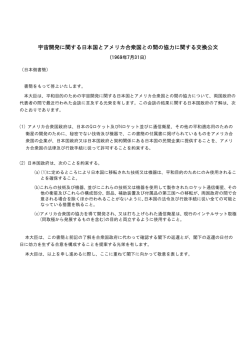
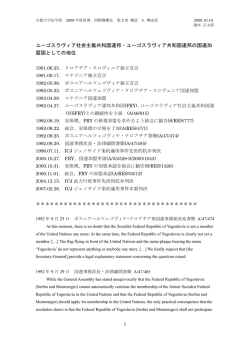

![[pdf]](http://s3.paperzz.com/store/data/007389782_1-e4eaa3b0c1e26281c38f0744e1baba79-250x500.png)