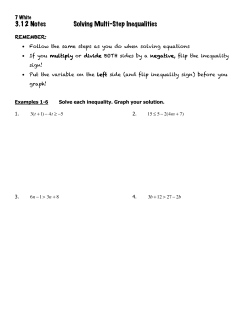
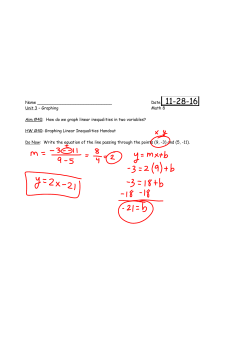
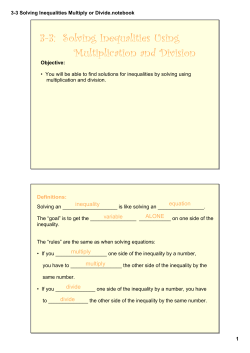
Inequality
Joseph E. Stiglitz
Virginia Festival of the Book
March 24, 2017
US: bottom 90% have seen little increase in
income over last third of a century
1800000
1400000
1200000
1000000
800000
Top 1% Average Income
(incl. capital gains)
600000
Bottom 90% average
income (incl. capital gains)
400000
200000
0
1973
1976
1979
1982
1985
1988
1991
1994
1997
2000
2003
2006
2009
2012
Real 2014 US Dollars
1600000
Year
Source: The World Wealth and Income Database (latest data available at http://www.wid.
world/).
2
Median income of a full time male worker at the
level that it was more than 4 decades ago
(constant 2015 $)
60,000
55,000
50,000
45,000
40,000
35,000
30,000
1965
1970
1975
1980
1985
1990
1995
2000
2005
2010
2015
3
Source: U.S. Census Bureau
Note: Data is adjusted for the methodological change of 2013.
Real wages at the bottom are at the level that
they were roughly sixty years ago
US Minimum wage in 2016 Dollars
$12
$10
$8
$6
$4
$2
$0
1938 1943 1948 1953 1958 1963 1968 1973 1978 1983 1988 1993 1998 2003 2008 2013
4
Source: Federal Reserve. https://www.quandl.com/data/FRED?keyword=
Levels of opportunity correlated with income
Income inequality and intergenerational earnings mobility, mid-2000s
Source: “United States, Tackling High Inequalities Creating Opportunities for All”,
June 2014, OECD.
5
Even health and life expectancy is in decline
Source: Anne Case and Angus Deaton of Princeton University, charts published in Wall Street Journal.
6
The Walton Family and The Koch Brothers’ net worth = $230 billion
That’s the net worth of 150 million Americans or 44% of the country.
The Walton Family
The Koch Brothers
7
Global inequality:
income growth by percentile, 1988-2008
8
Source: Branko Milanovic, http://glineq.blogspot.co.ke/2015/02/trends-in-global-income-inequality-and.html
Globally, matters are even worse
Oxfam reports on wealth concentration at the top: how many of the
richest people have as much wealth as bottom 50% (bottom 3.6
billion!)
• In 2014: 85
• In 2017: just 8 men
Big winners during last quarter century
• Global 1% and global middle class (middle class in China and
India)
Big losers during last quarter century (not sharing in gains)
• Those at the bottom and the middle class in advanced countries
9
© Copyright 2026 Paperzz