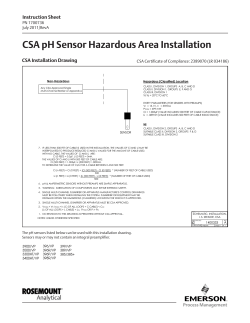
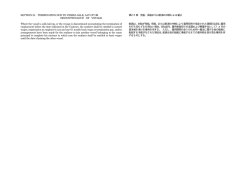
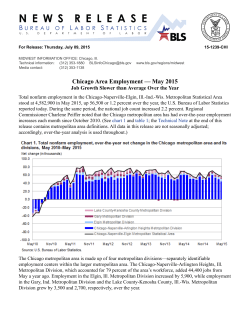
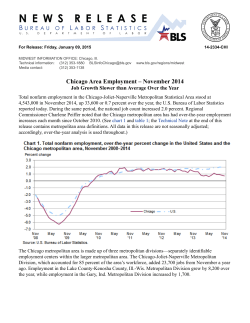
For Release: Tuesday, May 05, 2015
NEW ENGLAND INFORMATION OFFICE: Boston, Mass.
Technical information: (617) 565-2327 [email protected]
Media contact:
(617) 565-2326 [email protected]
15-836-BOS
www.bls.gov/regions/new-england
Changing Compensation Costs in the Boston Metropolitan Area-March 2015
Total compensation costs for private industry workers increased 3.6 percent in the Boston-WorcesterManchester, Mass.-N.H. metropolitan area for the 12-month period ending March 2015, the U.S. Bureau of
Labor Statistics reported today. Regional Commissioner Deborah A. Brown noted that the over-the-year
increase in total compensation in the Boston area for March 2015(3.6 percent) was the highest first quarter
increase since the series began in 2007. Locally, wages and salaries, the largest component of total
compensation costs, advanced at a 3.9-percent pace for the 12-month period ended March 2015. Nationwide
total compensation costs rose 2.8 percent, while wages and salaries also increased 2.8 percent over the same
period. (See chart 1 and table 1.)
Boston is 1 of 15 metropolitan areas in the United States, and 1 of 3 areas in the Northeast region of the
country, for which locality compensation cost data are available. Among these 15-largest areas, Boston was
one of three metropolitan areas that had both total compensation growth and wage and salary growth that
exceeded the U.S. average from March 2014 to March 2015. Over-the-year growth rates in the cost of total
compensation ranged from 4.4 percent in Seattle to -0.1 percent in Detroit during March 2015. Wage and
salary annual growth rates ranged from 3.9 percent in Boston to 0.2 percent in Detroit. (See chart 2.)
In comparison to the other metropolitan areas in the Northeast, the annual increase in total compensation
costs in Boston (3.6 percent) was above that of Philadelphia (2.5 percent) and New York (2.6 percent).
Boston’s 3.9-percent gain in wages and salaries during March 2015 was above that in Philadelphia (2.3
percent) and New York (2.5 percent).
Locality compensation costs are part of the national Employment Cost Index (ECI) which measures
quarterly changes in total compensation costs, which include wages, salaries and employer costs for
employee benefits. In addition to the 15 locality estimates provided in this release, ECI data for the nation,
4 geographical regions, and 9 geographical divisions are available. (Geographic definitions for the
metropolitan areas mentioned in this release are included in the Technical Note.)
In addition to the geographic data, a comprehensive national report is available that provides data by
industry, occupational group and union status, as well as for both private and state and local government
employees. The report on the ECI and further technical information may be obtained from the U.S. Bureau
of Labor Statistics, New England Information Office by calling 617-565-2327. The report is also available
on the Internet at www.bls.gov/news.release/eci.toc.htm. Current and historical information for the Bureau
programs may be accessed via our regional homepage at https://www.bls.gov/regions/new-england/
home.htm. Information from the Employment Cost Index program is available to sensory impaired
individuals upon request. Voice phone: (202) 691-5200; TDD message referral phone number:
1-800-877-8339.
The ECI for June 2015 is scheduled to be released on Friday, July 31, 2015 at 8:30 a.m. (ET).
Technical Note
The Employment Cost Index (ECI) is a measure of the change in the cost of labor, free from the influence of
employment shifts among occupations and industries. The total compensation series includes changes in
wages and salaries and employer costs for employee benefits.
2
Wages and salaries are defined as straight-time average hourly earnings or, for workers not paid on an
hourly basis, straight-time earnings divided by the corresponding hours. Straight-time wage and salary rates
are total earnings before payroll deductions, excluding premium pay for overtime, work on weekends and
holidays, and shift differentials. Production bonuses, incentive earnings, commission payments, and cost-ofliving adjustments are included in straight-time earnings, whereas nonproduction bonuses (such as
Christmas or year-end bonuses) are excluded.
Selection of areas
Based on available resources and the existing ECI sample, it was determined that estimates would be
published for 14 metropolitan areas. Since the ECI sample sizes by area are directly related to area
employment, the areas with the largest private industry employment as of the year 2000 were selected. For
each of these areas, 12-month percent changes and associated standard errors were computed for the periods
since December 2006. (Note: The Seattle-Tacoma-Olympia area was added to the list in September 2009 to
make a total of 15 metropolitan areas.)
The metropolitan area definitions of the 15 published localities are listed below.
Atlanta-Sandy Springs-Gainesville, Ga.-Ala. Combined Statistical Area (CSA) includes Barrow,
Bartow, Butts, Carroll, Cherokee, Clayton, Cobb, Coweta, Dawson, DeKalb, Douglas, Fayette, Forsyth,
Fulton, Gwinnett, Hall, Haralson, Heard, Henry, Jasper, Lamar, Meriwether, Newton, Paulding, Pickens,
Pike, Polk, Rockdale, Spalding, Troup, Upson, and Walton Counties in Georgia and Chambers County in
Alabama.
Boston-Worcester-Manchester, Mass.-N.H. CSA includes Essex, Middlesex, Norfolk, Plymouth, Suffolk,
and Worcester Counties in Massachusetts and Belknap, Hillsborough, Merrimack, Rockingham, and
Strafford Counties in New Hampshire.
Chicago-Naperville-Michigan City, Ill.-Ind.-Wis. CSA includes Cook, DeKalb, DuPage, Grundy, Kane,
Kankakee, Kendall, Lake, McHenry, and Will Counties in Illinois; Jasper, Lake, LaPorte, Newton, and
Porter Counties in Indiana; and Kenosha County in Wisconsin.
Dallas-Fort Worth, Texas CSA includes Collin, Cooke, Dallas, Delta, Denton, Ellis, Henderson, Hood,
Hunt, Johnson, Kaufman, Palo Pinto, Parker, Rockwall, Somervell, Tarrant, and Wise Counties in Texas.
Detroit-Warren-Flint, Mich. CSA includes Genesee, Lapeer, Livingston, Macomb, Monroe, Oakland, St.
Clair, Washtenaw, and Wayne Counties in Michigan.
Houston-Baytown-Huntsville, Texas CSA includes Austin, Brazoria, Chambers, Fort Bend, Galveston,
Harris, Liberty, Matagorda, Montgomery, San Jacinto, Walker, and Waller Counties in Texas.
Los Angeles-Long Beach-Riverside, Calif. CSA includes Los Angeles, Orange, Riverside, San
Bernardino, and Ventura Counties in California.
Miami-Fort Lauderdale-Pompano Beach, Fla. Metropolitan Statistical Area (MSA) includes Broward,
Miami-Dade, and Palm Beach Counties in Florida.
3
Minneapolis-St. Paul-St. Cloud, Minn.-Wis. CSA includes Anoka, Benton, Carver, Chisago, Dakota,
Goodhue, Hennepin, Isanti, McLeod, Ramsey, Rice, Scott, Sherburne, Stearns, Washington, and Wright
Counties in Minnesota and Pierce and St. Croix Counties in Wisconsin.
New York-Newark-Bridgeport, N.Y.-N.J.-Conn.-Pa. CSA includes Bronx, Dutchess, Kings, Nassau,
New York, Orange, Putnam, Queens, Richmond, Rockland, Suffolk, Ulster, and Westchester Counties in
New York; Bergen, Essex, Hudson, Hunterdon, Mercer, Middlesex, Monmouth, Morris, Ocean, Passaic,
Somerset, Sussex, and Union Counties in New Jersey; Fairfield, Litchfield, and New Haven Counties in
Connecticut; and Pike County in Pennsylvania.
Philadelphia-Camden-Vineland, Pa.-N.J.-Del.-Md. CSA includes Bucks, Chester, Delaware,
Montgomery, and Philadelphia Counties in Pennsylvania; Burlington, Camden, Cumberland, Gloucester,
and Salem Counties in New Jersey; New Castle County in Delaware; and Cecil County in Maryland.
Phoenix-Mesa-Scottsdale, Ariz. MSA includes Maricopa and Pinal Counties in Arizona.
San Jose-San Francisco-Oakland, Calif. CSA includes Alameda, Contra Costa, Marin, Napa, San Benito,
San Francisco, San Mateo, Santa Clara, Santa Cruz, Sonoma, and Solano Counties in California.
Seattle-Tacoma-Olympia, Wash. CSA includes Island, King, Kitsap, Mason, Pierce, Snohomish, and
Thurston Counties in Washington.
Washington-Baltimore-Northern Virginia, D.C.-Md.-Va.-W.Va. CSA includes the District of Columbia;
Baltimore City and Anne Arundel, Baltimore, Calvert, Carroll, Charles, Frederick, Harford, Howard,
Montgomery, Prince George’s, Queen Anne’s, and St. Mary’s Counties in Maryland; Alexandria, Fairfax,
Falls Church, Fredericksburg, Manassas, Manassas Park, and Winchester Cities and Arlington, Clarke,
Fairfax, Fauquier, Frederick, Loudoun, Prince William, Spotsylvania, Stafford, and Warren Counties in
Virginia; and Hampshire and Jefferson Counties in West Virginia.
Definitions of the four geographic regions of the country are noted below.
Northeast: Connecticut, Maine, Massachusetts, New Hampshire, New Jersey, New York, Pennsylvania,
Rhode Island, and Vermont.
South: Alabama, Arkansas, Delaware, the District of Columbia, Florida, Georgia, Kentucky, Louisiana,
Maryland, Mississippi, North Carolina, Oklahoma, South Carolina, Tennessee, Texas, Virginia, and West
Virginia.
Midwest: Illinois, Indiana, Iowa, Kansas, Michigan, Minnesota, Missouri, Nebraska, North Dakota, Ohio,
South Dakota, and Wisconsin.
West: Alaska, Arizona, California, Colorado, Hawaii, Idaho, Montana, Nevada, New Mexico, Oregon,
Utah, Washington, and Wyoming.
4
Table 1. Employment Cost Index for total compensation and for wages and salaries, private industry
workers, United States, Northeast region, and the Boston area, not seasonally adjusted
Total compensation
Area
United States
2011.....................................................
2012 ....................................................
2013 ....................................................
2014 ....................................................
2015 ....................................................
Northeast
2011.....................................................
2012 ....................................................
2013 ....................................................
2014 ....................................................
2015 ....................................................
Boston-Worcester-Manchester
2011.....................................................
2012 ....................................................
2013 ....................................................
2014 ....................................................
2015 ....................................................
Wages and salaries
12-month percent changes for period ended-
12-month percent changes for period ended-
March
March
June
Sep.
Dec.
June
Sep.
Dec.
2.0
2.1
1.9
1.7
2.8
2.3
1.8
1.9
2.0
2.1
1.9
1.9
2.3
2.2
1.8
2.0
2.3
1.6
1.9
1.7
1.7
2.8
1.7
1.8
1.9
1.9
1.7
1.8
1.8
2.3
1.6
1.7
2.1
2.2
2.3
1.8
1.9
1.5
4.0
2.3
1.6
2.0
2.0
2.3
1.6
1.8
2.5
2.2
1.5
2.0
2.6
1.8
1.8
1.6
1.5
4.4
1.8
1.6
1.7
1.9
1.8
1.6
1.7
2.5
1.7
1.5
1.8
2.6
2.8
1.9
1.6
2.0
3.6
3.1
1.2
2.3
2.5
2.9
1.5
1.9
2.5
2.5
1.6
2.0
3.2
2.3
1.6
1.5
2.2
3.9
2.7
0.8
2.3
2.8
2.4
1.1
2.2
2.6
2.0
1.3
2.2
3.5
5
Table 2. Employment Cost Index for total compensation and for wages and salaries, private industry
workers, United States, geographical regions, and localities, not seasonally adjusted
Total compensation
Area
12-month percent changes for period endedMar. 2014
United States...................................................
Northeast......................................................
Boston-Worcester-Manchester.................
New York-Newark-Bridgeport ...................
Philadelphia-Camden-Vineland................
South ............................................................
Atlanta-Sandy Springs-Gainesville...........
Dallas-Fort Worth .....................................
Houston-Baytown-Huntsville ....................
Miami-Fort Lauderdale-Pompano Beach .
Washington-Baltimore-Northern Virginia ..
Midwest ........................................................
Chicago-Naperville-Michigan City ............
Detroit-Warren-Flint ..................................
Minneapolis-St. Paul-St. Cloud ................
West .............................................................
Los Angeles-Long Beach-Riverside .........
Phoenix-Mesa-Scottsdale ........................
San Jose-San Francisco-Oakland............
Seattle-Tacoma-Olympia ..........................
Wages and salaries
Dec. 2014
1.7
1.5
2.0
1.4
1.6
1.7
1.2
2.2
1.8
1.7
1.5
1.7
1.6
1.8
1.6
2.1
1.3
1.4
3.6
1.7
2.3
2.6
3.2
2.8
2.0
2.2
3.2
2.5
1.7
2.1
1.4
2.1
3.3
1.0
2.3
2.4
2.8
1.3
4.8
4.8
6
Mar. 2015
2.8
4.0
3.6
2.6
2.5
2.2
3.9
2.3
1.9
2.1
1.1
2.4
3.3
-0.1
2.3
2.5
3.3
2.2
2.9
4.4
12-month percent changes for period endedMar. 2014
1.7
1.5
2.2
1.2
1.4
1.7
0.7
2.7
2.4
2.3
1.4
1.6
1.8
1.1
1.4
2.0
1.1
1.2
3.4
1.7
Dec. 2014
2.2
2.6
3.5
2.6
2.0
2.2
1.6
2.3
2.1
2.5
1.2
1.7
1.9
0.2
2.6
2.5
2.4
1.4
4.9
2.7
Mar. 2015
2.8
4.4
3.9
2.5
2.3
2.2
1.8
2.3
2.1
1.9
0.7
2.0
2.4
0.2
2.3
2.6
3.4
2.4
2.5
2.9
© Copyright 2026 Paperzz