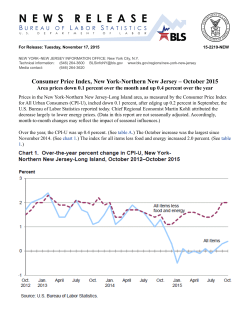
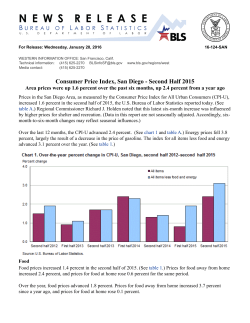
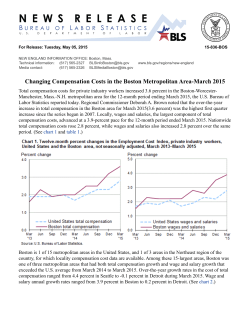
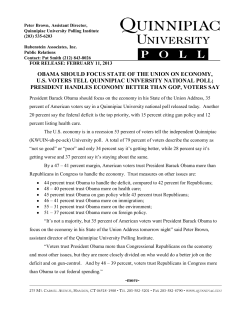
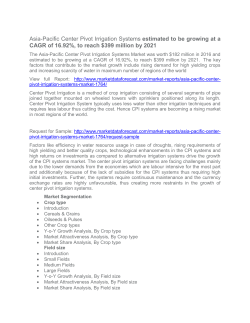
Three Questions
About Consumer Spending
and the Middle Class
June 22, 2010
This information is for research purposes only and does not reflect the policy or views of the Obama administration
Jared Bernstein
Office of the Vice President
Disclaimer
• This
This information is for research purposes only information is for research purposes only
and does not reflect the policy or views of the Obama administration
Obama administration.
Three Questions:
Three Questions:
1. How do we define the middle class, and how do we measure their progress? This calls for differentiating their measure their progress?
This calls for differentiating their
actual consumption (and saving) against a more prescriptive assessment.
2. If we give up on prescription, we still should be interested If we give up on prescription, we still should be interested
in relative consumption differences across income classes. What is the trend in consumption inequality (and how does it relate to income inequality)?
q
y)
3. Underlying both absolute and relative consumption challenges facing the middle class is the growing gap between productivity and compensation.
p
y
p
A significant g
share of the growth in the gap (about a third) since 1979 is due to the difference in growth rates between product and consumer deflators. How can we better understand the implications of this divergence?
h
l
f h d
?
Source: Department of Commerce, “Middle Class in America.” Underlying data from various sources.
Growth in Real Income and Consumption
by Income Quintile, 2000‐2007
8.0%
Top Fifth
7.0%
6.0%
Pe
ercent growth, 2
2000‐2007
4 0%
4.0%
2.0%
Middle Fifth
1.5%
0.0%
Middle Fifth
Middle
Fifth
‐1.7%
Top Fifth
‐1.9%
‐2.0%
‐4.0%
Bottom Fifth
‐5.6%
Bottom Fifth
‐5.2%
‐6.0%
Income Growth
Source: Current Expenditure Survey, CPS ASEC.
Consumption Growth
Decomposition of Wage‐Productivity Disparity, 1979‐2009
200%
Productivity
180%
Change in Factor Shares
Real Average Compensation,
Implicit Price Deflator
Perce
ent change from
m 1979
160%
CPI/IPD Difference
Real Average
Compensation
140%
Productivity
Average/Non‐Manager Difference
Real Non‐Managerial
Compensation
120%
Wage/Compensation Difference
Real Non‐Managerial Wages
100%
Real Non‐Managerial Wages
80%
1979
1982
1985
Source: Bureau of Labor Statistics.
1988
1991
1994
1997
2000
2003
2006
2009
1%
1973‐2009
Source: Bureau of Labor Statistics.
1979‐89
2.7%
1989‐2000
CPI‐‐U‐RS
2%
Imp
plicit Price Deflator
CPI‐‐U‐RS
Imp
plicit Price Deflator
5%
CPI‐‐U‐RS
Imp
plicit Price Deflator
4%
CPI‐‐U‐RS
Imp
plicit Price Deflator
Annualized rate of growth du
uring time perio
od
6%
Consumer Prices Outpace Product Deflators
5.1%
4 5%
4.5%
4.1%
3.6%
3%
2.7%
2.2%
2.0%
0%
2000‐07
© Copyright 2026 Paperzz