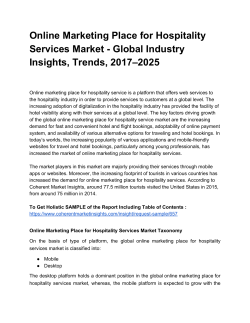
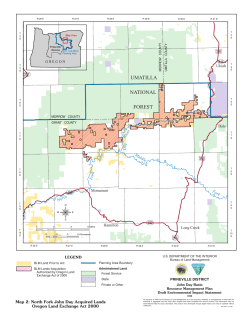
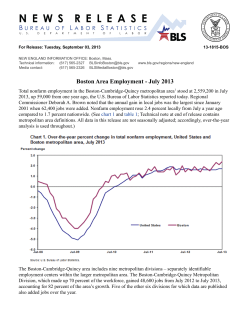
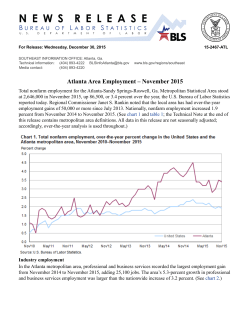
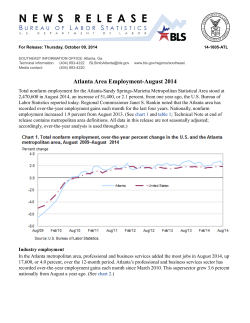
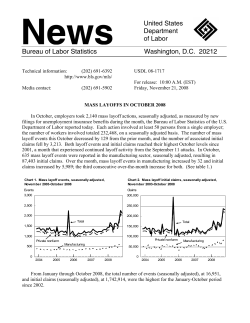
Current Employment Statistics Highlights
Detailed Industry Employment Analysis
Contents
Summary
Mining & Logging
Current Employment Statistics
Highlights
Construction
Manufacturing
Wholesale Trade
Retail Trade
Transportation, Warehousing, & Utilities
Information
Financial Activities
Professional & Business Services
Private Education & Health Services
Leisure & Hospitality
Other Services
Government
July 2015
Release Date: August 7, 2015
Prepared by Staff of the National Estimates Branch
Current Employment Statistics Survey
U.S. Bureau of Labor Statistics
202-691-6555
Email CES
CES Highlights
Release Date: August 7, 2015
Current Employment Statistics Survey Summary, July 2015
Nonfarm payroll employment increased by
215,000 in July. Retail trade, health care,
professional and technical services, and
financial activities added jobs.
The employment change for June revised
up from +223,000 to +231,000, and the
change for May revised up from +254,000 to
+260,000. Incorporating revisions, monthly job
gains averaged 235,000 over the past 3
months
Average hourly earnings of all privatesector employees increased by 5 cents
(0.2 percent) over the month following little
change in June (-1 cent). Over the year, hourly
earnings are up 2.1 percent. In July, average
weekly hours edged up 0.1 hour to 34.6 hours.
+37,000 Education and Health Services
Health care employment continued to rise
in July with an increase of 28,000. Hospitals
boosted employment by 16,000, accounting
for more than half of the payroll gain. Over the
Summary
Mining &
Logging
Construction
Manufacturing
Over-the-month change, January 2012 - July 2015
Seasonally adjusted, in thousands
380
329
317
314
187
201
215
231
260
266
250
221
249
213
225
188
166
150
164
119
109
87
100
127
113
115
150
225
219
164
187
188
144
177
200
205
213
216
247
256
286
293
300
250
330
350
236
400
423
450
50
35
+36,000 Retail Trade
Retail trade added 36,000 jobs in July.
Motor vehicle and parts dealers contributed
13,000 jobs to the overall gain. Over the year,
employment in retail trade has risen by
322,000. Motor vehicle and parts dealers
added 75,000 jobs over the same time span.
Employment in total nonfarm
0
Jan-12
Jul-12
Jan-13
Jul-13
Jan-14
Jul-14
Jan-15
Jul-15
Bureau of Labor Statistics, Current Employment Statistics, August 07, 2015.
Most recent 2 months of data are preliminary.
past year, health care providers have added
436,000 jobs.
+40,000 Professional and Business Services
Employment in professional and technical
services rose by 27,000 in July. Within this
industry, computer systems design and related
Trade:
Wholesale
Retail
Transp.,
Warehousing
& Utilities
Information
Financial
Activities
services added 9,000 jobs, while architectural
and engineering services added 6,000 jobs
over the month.
Management of companies and enterprises
also added jobs over the month (+14,000),
while employment in administrative and waste
services was essentially unchanged.
Professional
& Business
Services
Private
Education
& Health
Services
Leisure &
Hospitality
Other
Services
Government
CES Highlights
Release Date: August 7, 2015
Current Employment Statistics Survey Summary, July 2015
+30,000 Leisure and Hospitality
Employment continued to trend up in food
services and drinking places in July (+29,000).
Over the year, this industry added 376,000
jobs.
Employment in total nonfarm
Over-the-month change, July 2015
Total nonfarm:
215*
Seasonally adjusted, in thousands
Mining and logging
-4
Construction
6
Manufacturing
15
+17,000 Financial Activities
Financial activities added 17,000 payroll
jobs in July. Insurance carriers and related
services accounted for 10,000 of the increase.
Over the year, employment in financial
activities increased by 156,000, compared to
79,000 jobs added in the prior 12 months.
Wholesale trade
6
Retail trade*
36
Transportation and warehousing
14
3
Utilities
2
Information
Financial activities*
17
Professional and business services
40
Education and health services*
37
+14,000 Transportation and Warehousing
Employment continued to trend up in
transportation and warehousing in July. Over
the year, the industry added 146,000 jobs.
Summary
Mining &
Logging
Construction
Manufacturing
Leisure and hospitality
30
+15,000 Manufacturing
In manufacturing, nondurable goods
employment rose by 23,000 in July. Food
manufacturing (+9,000), plastics and rubber
products (+6,000), and paper and paper
products (+3,000) contributed to job growth.
Other services
7
Government
5
-20
-10
0
10
20
30
40
50
Bureau of Labor Statistics, Current Employment Statistics survey, August 07, 2015.
Data are preliminary.
* denotes significance.
-4,000 Mining and Logging
Employment in mining continued to trend
down in July (-5,000). Since December, the
industry lost 78,000 jobs.
Trade:
Wholesale
Retail
Transp.,
Warehousing
& Utilities
Information
Financial
Activities
Professional
& Business
Services
Private
Education
& Health
Services
Leisure &
Hospitality
Other
Services
Government
Release Date: August 7, 2015
CES Highlights
Mining and Logging
Employment in mining and logging
For the second consecutive month
employment in mining and logging
edged down by 4,000. Since December,
the industry has lost 77,000 jobs.
Over-the-month change, January 2012–July 2015
Seasonally adjusted, in thousands
Support activities for mining is
responsible for most of the employment
change in mining and logging, losing
5,000 jobs in July and 63,000 jobs year
to date.
6
5
5
2
3
3
3
2
1
1
1
1
0
-10
-4
-4
-7
-7
-5
-5
-3
-2
-2
-1
0
0
0
1
1
2
2
3
3
3
4
4
5
7
8
9
6
6
10
9
15
-14
-14
-14
-15
-20
-20
-25
-30
Jan-12
Jul-12
Jan-13
Jul-13
Jan-14
Jul-14
Jan-15
Jul-15
Bureau of Labor Statistics, Current Employment Statistics survey, August 07, 2015.
Most recent 2 months of data are preliminary.
Summary
Mining &
Logging
Construction
Manufacturing
Trade:
Wholesale
Retail
Transp.,
Warehousing
& Utilities
Information
Financial
Activities
Professional
& Business
Services
Private
Education
& Health
Services
Leisure &
Hospitality
Other
Services
Government
Release Date: August 7, 2015
CES Highlights
Construction
Employment in construction changed
little (+6,000) in July and has shown little
movement over the last 3 months.
Summary
Mining &
Logging
Construction
Manufacturing
Trade:
Wholesale
Retail
Transp.,
Warehousing
& Utilities
Information
Financial
Activities
Professional
& Business
Services
Private
Education
& Health
Services
Leisure &
Hospitality
Other
Services
Government
Release Date: August 7, 2015
CES Highlights
Manufacturing
Employment in manufacturing
Employment in manufacturing edged up in July (+15,000), due to a 23,000-job
gain in nondurable goods.
The one-month diffusion index increased to 57.5 in July from 52.5 in June. The
diffusion index measures the dispersion of employment change in
manufacturing, with a value above 50 indicating that more manufacturing
industries are adding jobs than losing.
Average weekly hours in manufacturing edged up by 0.1 hour for all
employees, and was unchanged for production employees at 41.8 hours.
Over-the-month change, January 2012–July 2015
Seasonally adjusted, in thousands
32
6
2
3
-2
-4
-4
0
0
0
1
3
4
6
9
15
19
17
23
23
14
14
20
9
11
12
14
16
18
11
14
17
14
11
20
19
22
23
24
28
40
35
42
45
60
Nondurable Goods Manufacturing
-13
-22
-20
Nondurable goods manufacturing employment increased 23,000 in July, the
largest 1-month job gain since August 1991. Job gains were spread throughout
the industry, led by food manufacturing.
Employment in food manufacturing rose by 9,000, following a 6,000 gain in
June. The growth in July was concentrated in fruit and vegetable preserving and
in seafood product preparation and packaging.
In July, employment in plastics and rubber products grew by 6,000 with nearly
all the growth in plastics manufacturing. Paper products employment rose by
3,000, offsetting a decline in June. The return from a strike at several refineries
brought employment up by about 1,000 in petroleum and coal products.
-40
Jan-12
Jul-12
Jan-13
Jul-13
Jan-14
Jul-14
Jan-15
Jul-15
Bureau of Labor Statistics, Current Employment Statistics survey, August 07, 2015.
Most recent 2 months of data are preliminary.
Employment in nondurable goods
Nondurable
goods:
23*
Over-the-month change, July 2015
Seasonally adjusted, in thousands
9
Food manufacturing*
0
Textile mills
1
Textile product mills
0
Apparel
3
Paper products*
1
Printing
1
Petroleum and coal products*
1
Chemicals
6
Plastics and rubber*
2
-4
-2
0
2
Miscellaneous nondurable goods manufacturing
4
6
July 2015
8
10
12
Prior 6-month average
Bureau of Labor Statistics, Current Employment Statistics survey, August 07, 2015.
Data are preliminary.
* denotes significance.
Summary
Mining &
Logging
Construction
Manufacturing
Trade:
Wholesale
Retail
Transp.,
Warehousing
& Utilities
Information
Financial
Activities
Professional
& Business
Services
Private
Education
& Health
Services
Leisure &
Hospitality
Other
Services
Government
Release Date: August 7, 2015
CES Highlights
Wholesale Trade
Employment in wholesale trade
continued to trend up in July (+6,000).
Employment in the industry increased by
31,000 over the past 6 month s.
Employment in wholesale trade
January 2005–July 2015
Seasonally adjusted, in thousands
6,200
July 2015 Level: 5,919
OTM Change: 6
6,000
5,800
5,600
5,400
5,200
Jan-05
Jan-07
Jan-09
Jan-11
Jan-13
Jan-15
Bureau of Labor Statistics, Current Employment Statistics survey, August 07, 2015.
Shaded area represents recession as denoted by the National Bureau of Economic Research.
Most recent 2 months of data are preliminary.
* denotes significance.
Summary
Mining &
Logging
Construction
Manufacturing
Trade:
Wholesale
Retail
Transp.,
Warehousing
& Utilities
Information
Financial
Activities
Professional
& Business
Services
Private
Education
& Health
Services
Leisure &
Hospitality
Other
Services
Government
Release Date: August 7, 2015
CES Highlights
Retail Trade
Employment in retail trade
Employment in retail trade
Over-the-month change, January 2012–July 2015
Seasonally adjusted, in thousands
Seasonally adjusted, in thousands
13
100
Motor vehicle and parts dealers*
0
73
80
57
33
37
36
35
23
32
26
32
43
39
Gasoline stations
11
25
Health and personal care stores
0
7
2
Clothing and clothing accessories stores
-6
-4
-2
0
-60
Jul-12
Jan-13
Jul-13
Jan-14
Jul-14
Jan-15
Construction
Manufacturing
Transp.,
Warehousing
& Utilities
Nonstore retailers
4
6
8
10
12
14
16
Prior 6-month average
Bureau of Labor Statistics, Current Employment Statistics survey, August 07, 2015.
Data are preliminary.
* denotes significance.
Employment in retail trade increased by 36,000 in July, following an
increase of 37,000 in June. Over the past 3 months, the industry added
105,000 jobs, compared to only 66,000 jobs added in the previous 3month period.
Trade:
Wholesale
Retail
2
July 2015
Jul-15
Bureau of Labor Statistics, Current Employment Statistics survey, August 07, 2015.
Most recent 2 months of data are preliminary.
Mining &
Logging
Miscellaneous store retailers
1
-8
Jan-12
General merchandise stores
2
-17
-19
-23
-11
-18
-13
-12
-6
-3
0
Sporting goods, hobby, book, and music stores
6
-40
Summary
Food and beverage stores
-2
3
0
-20
Building material and garden supply stores
7
27
30
35
32
3
11
17
22
39
41
36
32
31
31
23
25
10
20
Electronics and appliance stores
61
65
40
Furniture and home furnishings stores
2
60
Retail trade:
36*
Over-the-month change, July 2015
NAICS 441 – Motor Vehicle and Parts Dealers
In July, employment in motor vehicle and parts dealers increased by
13,000. Most of this increase was concentrated in automobile dealers,
which added 8,000 jobs in July. The employment increase in July
coincides with continued strength in light vehicle sales, which have
been above 17 million for the past 3 months (Source: Motor
Intelligence).
Information
Financial
Activities
Professional
& Business
Services
Private
Education
& Health
Services
Leisure &
Hospitality
Other
Services
Government
Release Date: August 7, 2015
CES Highlights
Transportation and Warehousing
Employment in transportation and
warehousing continued its upward trend
in July (+14,000). In the last 12 months,
transportation and warehousing added
146,000 jobs, an increase of 3.1 percent.
Employment in transportation and warehousing
January 2005–July 2015
Seasonally adjusted, in thousands
5,000
July 2015 Level: 4,790
OTM Change: 14
4,800
NAICS 492 – Couriers and messengers
Couriers and messengers added 3,000
jobs in July, bringing the over-the-year
gain to 30,000.
4,600
4,400
4,200
4,000
3,800
Jan-05
Jan-07
Jan-09
Jan-11
Jan-13
Jan-15
Bureau of Labor Statistics, Current Employment Statistics survey, August 07, 2015.
Shaded area represents recession as denoted by the National Bureau of Economic Research.
Most recent 2 months of data are preliminary.
* denotes significance.
Summary
Mining &
Logging
Construction
Manufacturing
Trade:
Wholesale
Retail
Transp.,
Warehousing
& Utilities
Information
Financial
Activities
Professional
& Business
Services
Private
Education
& Health
Services
Leisure &
Hospitality
Other
Services
Government
Release Date: August 7, 2015
CES Highlights
Utilities
Utilities employment edged up
(+3,000) in July.
Employment in utilities
Over-the-month change, January 2012–July 2015
Seasonally adjusted, in thousands
12
8
10
8
6
3
0
0
0
0
1
1
1
2
2
2
2
0
-1
-3
-2
-2
-2
-1
-2
0
0
0
-1
-2
-1
0
0
0
1
1
1
0
0
0
1
0
1
1
2
2
2
2
3
4
-4
-6
-8
-8
-10
-12
Jan-12
Jul-12
Jan-13
Jul-13
Jan-14
Jul-14
Jan-15
Jul-15
Bureau of Labor Statistics, Current Employment Statistics survey, August 07, 2015.
Most recent 2 months of data are preliminary.
Summary
Mining &
Logging
Construction
Manufacturing
Trade:
Wholesale
Retail
Transp.,
Warehousing
& Utilities
Information
Financial
Activities
Professional
& Business
Services
Private
Education
& Health
Services
Leisure &
Hospitality
Other
Services
Government
Release Date: August 7, 2015
CES Highlights
Information
Employment in information was
essentially unchanged in July (+2,000).
This industry has gained 123,000 jobs
since its January 2012 trough. Of those
jobs, 43 percent were added over the
past 12 months.
Employment in information
January 2005–July 2015
Seasonally adjusted, in thousands
3,200
July 2015 Level: 2,793
OTM Change: 2
3,100
3,000
2,900
2,800
2,700
2,600
2,500
Jan-05
Jan-07
Jan-09
Jan-11
Jan-13
Jan-15
Bureau of Labor Statistics, Current Employment Statistics survey, August 07, 2015.
Shaded area represents recession as denoted by the National Bureau of Economic Research.
Most recent 2 months of data are preliminary.
* denotes significance.
Summary
Mining &
Logging
Construction
Manufacturing
Trade:
Wholesale
Retail
Transp.,
Warehousing
& Utilities
Information
Financial
Activities
Professional
& Business
Services
Private
Education
& Health
Services
Leisure &
Hospitality
Other
Services
Government
Release Date: August 7, 2015
CES Highlights
Financial Activities
Employment in financial activities
Financial activities added 17,000 jobs in July. Over the past 12 months,
financial activities added 156,000 jobs, compared to 79,000 jobs added in
the previous 12-month period.
Over-the-month change, January 2012–July 2015
Seasonally adjusted, in thousands
35
24
28
30
17
17
13
9
10
9
9
9
2
7
7
1
2
3
4
6
6
6
7
8
8
3
3
5
-1
0
-1
NAICS 524 – Insurance carriers and related activities
Insurance carriers and related activities added 10,000 jobs in July. Over
the past 12 months, insurance carriers and related activities added 85,000
jobs.
9
13
13
12
13
10
10
10
10
12
15
12
13
17
20
17
16
19
25
-4
-5
-10
-15
Jan-12
Jul-12
Jan-13
Jul-13
Jan-14
Jul-14
Jan-15
Jul-15
Bureau of Labor Statistics, Current Employment Statistics survey, August 07, 2015.
Most recent 2 months of data are preliminary.
Employment in insurance carriers and related activities
Over-the-month change, January 2012–July 2015
Seasonally adjusted, in thousands
18
10
12
10
10
13
14
14
16
7
8
7
7
7
5
5
3
3
3
4
4
4
-4
-1
-1
-3
-3
-1
-1
0
0
-2
0
0
1
2
2
3
4
4
6
5
5
6
6
2
6
7
7
8
8
8
8
9
10
-6
-8
Jan-12
Jul-12
Jan-13
Jul-13
Jan-14
Jul-14
Jan-15
Jul-15
Bureau of Labor Statistics, Current Employment Statistics survey, August 07, 2015.
Most recent 2 months of data are preliminary.
Summary
Mining &
Logging
Construction
Manufacturing
Trade:
Wholesale
Retail
Transp.,
Warehousing
& Utilities
Information
Financial
Activities
Professional
& Business
Services
Private
Education
& Health
Services
Leisure &
Hospitality
Other
Services
Government
Release Date: August 07, 2015
CES Highlights
Professional and Business Services
Employment in selected professional and business services
Over-the-month change, July 2015
Seasonally adjusted, in thousands
27
Professional and technical°*
2
- Accounting and bookkeeping
6
- Architectural and engineering*
9
- Computer systems design*
3
- Management and technical consulting
14
Management of companies*
0
Administrative and waste services°
-7
-15
-10
-5
0
5
10
- Services to buildings
15
July 2015
20
25
30
35
Prior 12-month average
In July, employment in administrative
and waste services was unchanged over
the month. Small, offsetting movements
accounted for the flatness in July.
Bureau of Labor Statistics, Current Employment Statistics survey, August 07, 2015.
Data are preliminary.
˚Includes additional component industries not shown separately.
* denotes significance.
Summary
Mining &
Logging
Construction
Manufacturing
Trade:
Wholesale
Retail
In July, professional and technical
services added 27,000 jobs. Architectural
and engineering services (+6,000) and
computer systems design and related
services (+9,000) accounted for 57
percent of the employment increase,
while other component industries
continued their upward trends.
Management of companies and
enterprises added 14,000 jobs in July—
the largest over-the-month change since
January 2006.
- Employment services
7
-20
Professional and
business services:
40
Employment in professional and
business services continued to trend up
in July (+40,000). Professional and
technical services and management of
companies and enterprises accounted
for all of the employment gain in July.
Transp.,
Warehousing
& Utilities
Information
Financial
Activities
Professional
& Business
Services
Private
Education
& Health
Services
Leisure &
Hospitality
Other
Services
Government
Release Date: August 7, 2015
CES Highlights
Private Education and Health Services
Employment in selected health care industries
Over-the-month change, July 2015
Seasonally adjusted, in thousands
Employment in hospitals
Health care
industries:
28*
Over-the-month change, January 2012–July 2015
Seasonally adjusted, in thousands
25
9
Ambulatory health care services°
9
7
-20
July 2015
15
20
25
30
-25
Prior 6-month average
Jan-12
Bureau of Labor Statistics, Current Employment Statistics survey, August 07, 2015.
Data are preliminary.
˚Includes additional component industries not shown separately.
* denotes significance.
Summary
gain
Construction
Manufacturing
Trade:
Wholesale
Retail
Jul-12
Jan-13
Jul-13
Jan-14
Jul-14
Jan-15
Jul-15
Bureau of Labor Statistics, Current Employment Statistics survey, August 07, 2015.
Most recent 2 months of data are preliminary.
Employment in education and health services increased by 37,000 in
July, following a gain of 58,000 in June. Over the past 12 months, the
industry expanded by 572,000 jobs.
Within education and health services, health care added 28,000 jobs
in July, while employment in educational services and social assistance
changed little.
Mining &
Logging
3
-6
-5
-16
-15
Nursing and residential care*
10
-2
-3
-10
3
5
-1
0
Hospitals*
0
-3
-2
-1
-5
16
-5
16
5
0
- Home health care services
-10
2
3
3
1
1
1
3
3
1
2
0
1
1
1
3
4
5
5
3
7
8
7
- Outpatient care centers
11
10
10
10
2
11
13
15
- Offices of physicians
14
15
16
20
5
Transp.,
Warehousing
& Utilities
NAICS 622—Hospitals
Hospitals added 16,000 jobs in July. Over the past 12 months,
employment in the industry increased by 123,000, accounting for
28 percent of the employment gain in health care over the same period.
Information
Financial
Activities
Professional
& Business
Services
Private
Education
& Health
Services
Leisure &
Hospitality
Other
Services
Government
Release Date: August 7, 2015
CES Highlights
Leisure and Hospitality
Employment in leisure and hospitality
January 2005–July 2015
Employment in leisure and hospitality edged up in July (+30,000). Over
the last 12 months, this industry added 436,000 jobs, an increase of 3.0
percent. Food services and drinking places employment continued to trend
up in July (+29,000). Food services accounted for 86 percent of the 12month gain in leisure and hospitality.
Seasonally adjusted, in thousands
16,000
July 2015 Level: 15,157
OTM Change: 30
15,500
15,000
14,500
14,000
13,500
13,000
12,500
12,000
Jan-05
Jan-07
Jan-09
Jan-11
Jan-13
Jan-15
Bureau of Labor Statistics, Current Employment Statistics survey, August 07, 2015.
Shaded area represents recession as denoted by the National Bureau of Economic Research.
Most recent 2 months of data are preliminary.
* denotes significance.
Employment in leisure and hospitality
Over-the-month change, July 2015
Seasonally adjusted, in thousands
Leisure and
hospitality:
30
-4
Arts, entertainment, and recreation
4
Accommodation
29
Food services and drinking places
-15
-10
-5
0
5
10
15
July 2015
20
25
30
35
40
Prior 6-month average
Bureau of Labor Statistics, Current Employment Statistics survey, August 07, 2015.
Data are preliminary.
* denotes significance.
Summary
Mining &
Logging
Construction
Manufacturing
Trade:
Wholesale
Retail
Transp.,
Warehousing
& Utilities
Information
Financial
Activities
Professional
& Business
Services
Private
Education
& Health
Services
Leisure &
Hospitality
Other
Services
Government
Release Date: August 7, 2015
CES Highlights
Other Services
Employment in other services
continued to trend up (+7,000) in July.
The industry added 80,000 jobs over the
past 12 months.
Employment in other services
January 2005–July 2015
Seasonally adjusted, in thousands
5,750
5,700
July 2015 Level: 5,653
OTM Change: 7
5,650
5,600
5,550
5,500
5,450
5,400
5,350
5,300
5,250
5,200
Jan-05
Jan-07
Jan-09
Jan-11
Jan-13
Jan-15
Bureau of Labor Statistics, Current Employment Statistics survey, August 07, 2015.
Shaded area represents recession as denoted by the National Bureau of Economic Research.
Most recent 2 months of data are preliminary.
* denotes significance.
Summary
Mining &
Logging
Construction
Manufacturing
Trade:
Wholesale
Retail
Transp.,
Warehousing
& Utilities
Information
Financial
Activities
Professional
& Business
Services
Private
Education
& Health
Services
Leisure &
Hospitality
Other
Services
Government
Release Date: August 7, 2015
CES Highlights
Government
Employment in selected government
Over-the-month change, July 2015
Government:
5
Seasonally adjusted, in thousands
Federal, except U.S. Postal Service
0
U.S. Postal Service
-1
State government education
-1
State government, excluding education
-2
Local government education
4
Local government, excluding education
4
-4
-2
Government employment remained
flat in July. Employment at the federal,
state, and local levels changed little over
the month. Government added 62,000
jobs over the past 12 months, with the
majority of the employment gain
occurring in state government education
and local government, excluding
education.
0
2
4
6
Bureau of Labor Statistics, Current Employment Statistics survey, August 07, 2015.
Data are preliminary.
* denotes significance.
Summary
Mining &
Logging
Construction
Manufacturing
Trade:
Wholesale
Retail
Transp.,
Warehousing
& Utilities
Information
Financial
Activities
Professional
& Business
Services
Private
Education
& Health
Services
Leisure &
Hospitality
Other
Services
Government
Current Employment Statistics Highlights
Detailed Industry Employment Analysis
CES Analysts
Michael Calvillo
Steve Crestol
Tyler Downing
Brittney Forbes
Lyda Ghanbari
Mike McCall
John Mullins
Michael Osifalujo
Edward Park
Kara Sullivan
Jay Stuart
Parth Tikiwala
Prepared by Staff of the National Estimates Branch
Current Employment Statistics Survey
U.S. Bureau of Labor Statistics
202-691-6555
Email CES
© Copyright 2026 Paperzz