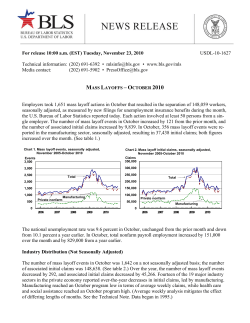
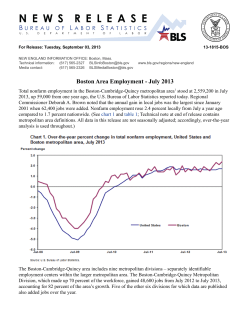
News
United States
Department
of Labor
Bureau of Labor Statistics
Technical information:
(202) 691-6392
http://www.bls.gov/mls/
Media contact:
(202) 691-5902
Washington, D.C. 20212
USDL 08-1717
For release: 10:00 A.M. (EST)
Friday, November 21, 2008
MASS LAYOFFS IN OCTOBER 2008
In October, employers took 2,140 mass layoff actions, seasonally adjusted, as measured by new
filings for unemployment insurance benefits during the month, the Bureau of Labor Statistics of the U.S.
Department of Labor reported today. Each action involved at least 50 persons from a single employer;
the number of workers involved totaled 232,468, on a seasonally adjusted basis. The number of mass
layoff events this October decreased by 129 from the prior month, and the number of associated initial
claims fell by 3,213. Both layoff events and initial claims reached their highest October levels since
2001, a month that experienced continued layoff activity from the September 11 attacks. In October,
635 mass layoff events were reported in the manufacturing sector, seasonally adjusted, resulting in
87,403 initial claims. Over the month, mass layoff events in manufacturing increased by 32 and initial
claims increased by 5,989; the third consecutive over-the-month increase for both. (See table 1.)
Chart 1. Mass layoff events, seasonally adjusted,
November 2003-October 2008
Chart 2. Mass layoff initial claims, seasonally adjusted,
November 2003-October 2008
Events
Claims
3,000
300,000
2,500
250,000
2,000
200,000
Total
Total
1,500
150,000
1,000
100,000
Private nonfarm
Private nonfarm
Manufacturing
500
Manufacturing
50,000
0
0
2004
2005
2006
2007
2008
2004
2005
2006
2007
2008
From January through October 2008, the total number of events (seasonally adjusted), at 16,951,
and initial claims (seasonally adjusted), at 1,742,914, were the highest for the January-October period
since 2002.
2
Table A. Industries with the largest number of mass layoff initial claims in October 2008
October peak
Industry
Initial claims
Year
Initial claims
Temporary help services ......................................
Automobile manufacturing ..................................
Professional employer organizations ...................
Motion picture and video production ..................
Light truck and utility vehicle manufacturing .....
Farm labor contractors and crew leaders .............
Heavy duty truck manufacturing .........................
Discount department stores .................................
Fruit and vegetable canning .................................
Travel trailer and camper manufacturing ............
16,381
10,508
7,242
6,052
6,047
4,123
3,983
3,135
2,836
2,826
1998
2008
2008
1997
2001
1998
2006
2002
2002
2008
18,760
10,508
7,242
7,692
8,763
9,617
7,017
4,959
4,500
2,826
The national unemployment rate was 6.5 percent in October, seasonally adjusted, up significantly
from 6.1 percent the prior month and up from 4.8 percent a year earlier. In October, total nonfarm payroll employment decreased by 240,000 over the month and by 1,078,000 from a year earlier.
Industry Distribution (Not Seasonally Adjusted)
The number of mass layoff events in October was 2,125 on a not seasonally adjusted basis; the
number of associated initial claims was 221,784. (See table 2.) Average weekly layoff events rose
from 271 in October 2007 to 425 in October 2008, while average weekly initial claimants increased
from 27,114 to 44,357. In 2008, both average weekly events and initial claimants reached their highest
October levels since 2001. In 2008, two major sectors reported program highs in terms of average
weekly initial claimants for the month of October—the construction sector and the arts, entertainment,
and recreation sector (with data available back to 1995).
The manufacturing sector accounted for 32 percent of all mass layoff events and 45 percent of
initial claims filed in October 2008; a year earlier, manufacturing made up 31 percent of events and 47
percent of initial claims. This October, the number of manufacturing claimants was greatest in transportation equipment manufacturing (36,110), followed by food manufacturing (11,144). (See table 3.)
Administrative and waste services accounted for 16 percent of mass layoff events and 14 percent of
associated initial claims during the month.
The six-digit NAICS industry with the largest number of initial claims was temporary help services
(16,381), followed by automobile manufacturing (10,508). Among the 10 industries with the highest
levels of initial claims, 3 of the 10—automobile manufacturing, travel trailer and camper manufacturing,
and professional employer organizations—reached program highs in 2008 for the month of October
(with data available back to 1995). (See table A.)
Geographic Distribution (Not Seasonally Adjusted)
Of the 4 census regions, the Midwest had the highest number of initial claims in October due to
mass layoffs (75,210), followed by the West (69,542) and the South (53,087). (See table 5.) Average
3
weekly initial claimants in mass layoffs increased over the year in all 4 regions with the West (+5,341)
and the Midwest (+5,329) experiencing the largest increases.
Of the 9 divisions, the Pacific (60,351) and the East North Central (60,196) had the highest numbers of initial claims in October due to mass layoffs. (See table 5.) All 9 of the divisions experienced
over-the-year increases in average weekly initial claims, led by the Pacific (+4,229) and the East North
Central (+3,829). In 2008, the East South Central and Mountain divisions reached program highs in
average weekly initial claims for the month of October.
California recorded the highest number of initial claims filed due to mass layoff events in October
with 51,286. The next highest states reporting mass layoff initial claims were Ohio (17,764) and
Michigan (16,851). (See table 6.) Twelve states reached program highs in average weekly initial claims
in 2008 for the month of October—Alabama, Alaska, Florida, Georgia, Idaho, Indiana, Michigan,
Nebraska, Nevada, Ohio, Utah, and Wyoming. Forty-four states registered over-the-year increases in
average weekly initial claims associated with mass layoffs, led by California (+3,256), Michigan
(+2,073), and Florida (+1,319).
______________________________
The report on Mass Layoffs in November 2008 is scheduled to be released on Friday, December 19.
Technical Note
The Mass Layoff Statistics (MLS) program is a federalstate program that uses a standardized automated approach to
identifying, describing, and tracking the effects of major job
cutbacks, using data from each state's unemployment
insurance database. Each month, states report on employers
which have at least 50 initial claims filed against them during
a consecutive 5-week period. These employers then are
contacted by the state agency to determine whether these
separations lasted 31 days or longer, and, if so, other
information concerning the layoff is collected. States report
on layoffs lasting more than 1 month on a quarterly basis.
A given month contains an aggregation of the weekly
unemployment insurance claims filings for the Sunday
through Saturday weeks in that month. All weeks are
included for the particular month, except if the first day of the
month falls on Saturday. In this case, the week is included in
the prior month's tabulations. This means that some months
will contain 4 weeks and others, 5 weeks, the number of
weeks in a given month may be different from year to year,
and the number of weeks in a year may vary. Therefore,
analysis of over-the-month and over-the-year change in not
seasonally adjusted series should take this calendar effect into
consideration.
The MLS program resumed operations in April 1995 after
it had been terminated in November 1992 due to lack of
funding. Prior to April 1995, monthly layoff statistics were
not available.
Information in this release will be made available to
sensory impaired individuals upon request. Voice phone:
202-691-5200; TDD message referral phone number: 1-800877-8339.
Definitions
Employer. Employers in the MLS program include those
covered by state unemployment insurance laws. Information
on employers is obtained from the Quarterly Census of
Employment and Wages (QCEW) program, which is
administered by the Bureau of Labor Statistics (BLS).
Initial claimant. A person who files any notice of unem-
ployment to initiate a request either for a determination of
entitlement to and eligibility for compensation, or for a
subsequent period of unemployment within a benefit year or
period of eligibility.
Mass layoff event. Fifty or more initial claims for
unemployment insurance benefits filed against an employer
during a 5-week period, regardless of duration.
Seasonal adjustment
Effective with the release of data for January 2005, BLS
began publishing six seasonally adjusted monthly MLS
series. The six series are the numbers of mass layoff events
and mass layoff initial claims for the total, private nonfarm,
and manufacturing sectors.
Seasonal adjustment is the process of estimating and
removing the effect on time series data of regularly recurring
seasonal events such as changes in the weather, holidays, and
the beginning and ending of the school year. The use of
seasonal adjustment makes it easier to observe fundamental
changes in time series, particularly those associated with
general economic expansions and contractions.
The MLS data are seasonally adjusted using the X-12ARIMA seasonal adjustment method on a concurrent basis.
Concurrent seasonal adjustment uses all available monthly
estimates, including those for the current month, in
developing seasonal adjustment factors. Revisions to the
most recent 5 years of seasonally adjusted data will be made
once a year with the issuance of December data. Before the
data are seasonally adjusted, prior adjustments are made to
the original data to adjust them for differences in the number
of weeks used to calculate the monthly data. Because weekly
unemployment insurance claims are aggregated to form
monthly data, a particular month's value could be calculated
with 5 weeks of data in one year and 4 weeks in another. The
effects of these differences could seriously distort the
seasonal factors if they were ignored in the seasonal
adjustment process. These effects are modeled in the X-12ARIMA program and are permanently removed from the
final seasonally adjusted series.
Table 1. Mass layoff events and initial claimants for unemployment insurance, November 2004 to October 2008,
seasonally adjusted
Total
Date
Private nonfarm
Manufacturing
Events
Initial
claimants
Events
Initial
claimants
2004
November ....................................................
December ....................................................
1,320
1,148
130,873
111,060
1,174
991
119,029
99,784
380
287
45,416
31,935
2005
January ........................................................
February .......................................................
March ...........................................................
April ..............................................................
May ..............................................................
June .............................................................
July ...............................................................
August ..........................................................
September ...................................................
October ........................................................
November ....................................................
December ....................................................
1,475
1,146
1,207
1,252
1,248
1,196
1,250
1,144
2,248
1,101
1,176
1,261
160,725
121,455
131,271
136,752
136,420
127,084
132,445
125,686
297,544
110,035
114,965
134,461
1,346
1,020
1,066
1,125
1,104
1,078
1,103
1,000
2,028
982
1,042
1,132
151,028
110,480
120,945
126,550
123,495
118,012
119,566
113,762
251,185
100,934
103,535
123,418
382
353
372
401
398
368
357
341
417
321
332
360
61,324
43,568
53,673
60,681
54,999
58,300
46,602
47,598
55,304
43,230
42,071
46,863
2006
January ........................................................
February .......................................................
March ...........................................................
April ..............................................................
May ..............................................................
June .............................................................
July ...............................................................
August ..........................................................
September ...................................................
October ........................................................
November ....................................................
December ....................................................
1,107
1,031
1,084
1,171
1,124
1,146
1,179
1,270
1,173
1,191
1,232
1,194
110,800
109,798
119,049
121,580
117,115
123,827
121,017
135,400
123,767
121,827
133,803
131,062
988
940
983
1,043
1,005
1,030
1,051
1,107
1,056
1,076
1,121
1,092
101,494
101,828
110,668
112,175
107,181
114,080
111,336
124,427
114,677
113,123
124,559
121,796
283
322
323
368
314
352
372
377
385
399
414
374
34,037
43,147
48,119
49,568
43,087
44,869
48,534
60,906
45,767
53,601
58,385
51,408
2007
January ........................................................
February .......................................................
March ...........................................................
April ..............................................................
May ..............................................................
June .............................................................
July ...............................................................
August ..........................................................
September ...................................................
October ........................................................
November ....................................................
December ....................................................
1,254
1,352
1,277
1,243
1,199
1,238
1,247
1,228
1,307
1,347
1,329
1,433
128,223
143,837
130,981
126,977
120,587
129,858
127,687
121,886
128,487
136,124
139,671
141,750
1,118
1,238
1,169
1,116
1,096
1,116
1,140
1,128
1,204
1,224
1,215
1,315
117,824
135,066
122,488
116,926
113,069
120,165
119,614
114,628
121,294
127,163
131,390
133,024
391
416
412
382
370
351
392
335
430
430
414
462
52,858
61,749
52,606
43,930
48,910
40,670
51,333
36,518
53,432
57,695
56,965
58,108
2008
January ........................................................
February .......................................................
March ...........................................................
April ..............................................................
May ..............................................................
June .............................................................
July ...............................................................
August ..........................................................
September ...................................................
October ........................................................
1,438
1,672
1,571
1,308
1,626
1,643
1,512
1,772
2,269
2,140
144,111
177,374
157,156
133,914
171,387
165,697
151,171
173,955
235,681
232,468
1,317
1,539
1,460
1,186
1,496
1,491
1,368
1,622
2,092
1,976
134,347
166,782
147,537
124,053
161,912
153,568
140,116
163,800
221,538
218,131
427
529
482
483
528
541
443
599
603
635
55,488
66,913
64,088
60,552
72,058
76,514
57,470
72,244
81,414
87,403
Events
Initial
claimants
Table 2. Mass layoff events and initial claimants for unemployment insurance, November 2004 to October 2008,
not seasonally adjusted
Total
Date
Private nonfarm
Manufacturing
Events
Initial
claimants
Events
Initial
claimants
2004
November ....................................................
December ....................................................
1,399
1,614
130,423
161,271
1,201
1,487
115,549
152,092
412
436
44,243
50,726
2005
January ........................................................
February .......................................................
March ...........................................................
April ..............................................................
May ..............................................................
June .............................................................
July ...............................................................
August ..........................................................
September ...................................................
October ........................................................
November ....................................................
December ....................................................
2,564
810
806
1,373
986
1,157
1,981
645
1,662
905
1,254
2,323
263,952
74,644
88,937
158,582
101,358
120,463
244,216
67,582
213,281
91,941
116,127
254,258
2,421
722
733
1,263
891
941
1,745
598
1,505
757
1,079
2,168
253,409
68,372
83,793
148,133
93,332
103,307
222,377
63,484
179,042
80,694
102,182
242,753
823
230
246
395
249
216
856
188
318
249
363
706
108,985
24,931
33,030
59,129
30,424
32,783
136,210
22,531
47,497
37,276
41,442
96,382
2006
January ........................................................
February .......................................................
March ...........................................................
April ..............................................................
May ..............................................................
June .............................................................
July ...............................................................
August ..........................................................
September ...................................................
October ........................................................
November ....................................................
December ....................................................
1,245
719
921
1,140
872
1,489
1,511
708
865
964
1,315
2,249
117,946
66,555
111,838
121,589
84,809
164,761
166,857
72,844
87,699
98,804
136,186
254,503
1,123
658
856
1,038
794
1,224
1,335
656
785
820
1,172
2,126
108,701
62,208
106,177
112,964
78,663
140,687
154,342
69,054
81,274
88,133
125,009
244,783
331
210
285
296
192
319
648
203
296
311
455
735
35,097
24,892
44,688
39,538
23,570
41,095
96,152
28,494
39,076
46,737
58,473
105,462
2007
January ........................................................
February .......................................................
March ...........................................................
April ..............................................................
May ..............................................................
June .............................................................
July ...............................................................
August ..........................................................
September ...................................................
October ........................................................
November ....................................................
December ....................................................
1,407
935
1,082
1,219
923
1,599
1,599
963
717
1,083
1,799
2,167
134,984
86,696
123,974
127,444
85,816
172,810
175,419
93,458
67,385
108,455
198,220
224,214
1,263
861
1,015
1,115
856
1,318
1,450
908
667
929
1,593
2,071
124,475
82,097
118,431
118,040
81,153
148,669
164,939
88,345
64,026
97,716
181,184
216,898
456
273
367
309
224
313
684
220
246
338
514
699
53,615
36,170
49,886
35,229
26,527
36,571
101,390
23,361
29,381
50,918
75,413
91,754
2008
January ........................................................
February .......................................................
March ...........................................................
April ..............................................................
May ..............................................................
June .............................................................
July ...............................................................
August ..........................................................
September ...................................................
October ........................................................
1,647
1,269
1,089
1,272
1,552
1,622
1,891
1,427
1,292
2,125
154,503
119,508
114,541
130,810
159,471
166,742
200,382
139,999
129,586
221,784
1,520
1,178
1,039
1,172
1,438
1,315
1,687
1,343
1,202
1,917
144,191
113,587
110,147
121,625
150,462
140,916
186,018
133,146
122,505
205,553
488
361
333
394
388
309
760
414
361
689
54,418
42,527
43,740
48,188
51,698
42,097
108,733
51,912
46,391
100,457
Events
Initial
claimants
Table 3. Industry distribution: Mass layoff events and initial claimants for unemployment insurance
Initial claimants for
unemployment insurance
Mass layoff events
Industry
October
2007
August
2008
September
2008
October
2008
October
2007
August
2008
September
2008
October
2008
1,347
1,224
430
1,772
1,622
599
2,269
2,092
603
2,140
1,976
635
136,124
127,163
57,695
173,955
163,800
72,244
Total ............................................................
1,083
1,427
1,292
2,125
108,455
139,999
129,586
221,784
Total, private .......................................................
Agriculture, forestry, fishing and hunting .........
Total, private nonfarm .......................................
Mining ..............................................................
Utilities .............................................................
Construction ....................................................
Manufacturing .................................................
Food ............................................................
Beverage and tobacco products .................
Textile mills .................................................
Textile product mills 3 ..................................
1,033
104
929
(2)
–
114
338
50
8
8
1,373
30
1,343
3
2
( )
142
414
40
8
10
1,227
25
1,202
6
2
( )
144
361
33
7
13
2,034
117
1,917
6
2
( )
206
689
75
7
20
103,897
6,181
97,716
(2)
–
7,126
50,918
5,264
603
732
134,871
1,725
133,146
207
2
( )
9,717
51,912
3,510
630
1,013
124,096
1,591
122,505
728
2
( )
10,763
46,391
3,068
648
1,422
213,602
8,049
205,553
449
2
( )
14,864
100,457
11,144
488
2,925
Seasonally adjusted
Total ..............................................................
Total, private nonfarm .......................................
Manufacturing .................................................
235,681
221,538
81,414
232,468
218,131
87,403
Not seasonally adjusted
1
3
Apparel ......................................................
Leather and allied products .........................
Wood products ............................................
Paper ...........................................................
Printing and related support activities .........
Petroleum and coal products ......................
Chemicals ...................................................
3
Plastics and rubber products .....................
Nonmetallic mineral products ......................
Primary metals ............................................
Fabricated metal products ..........................
Machinery 3 ..................................................
Computer and electronic products ..............
Electrical equipment and appliances ..........
Transportation equipment 3 .........................
4
4
3
10
232
487
347
792
6
(2)
31
10
7
(2)
6
10
(2)
35
3
10
(2)
5
7
(2)
32
8
5
–
408
(2)
3,582
708
434
(2)
907
981
(2)
2,980
516
938
(2)
268
688
(2)
2,901
603
341
–
8
9
(2)
68
17
10
(2)
13
527
914
(2)
6,932
1,392
1,042
(2)
1,394
11
8
16
18
30
8
19
25
16
12
13
35
47
21
48
47
1,133
440
1,579
1,367
3,625
1,161
1,709
2,179
1,224
861
1,582
2,357
4,903
1,755
6,038
4,632
18
10
12
30
26
11
28
15
22
43
36
21
5,459
674
1,516
4,887
2,446
1,485
4,058
1,556
3,453
7,897
3,705
3,873
36,110
88
112
87
149
23,399
19,787
19,278
3
Furniture and related products ..................
18
20
13
32
1,504
2,566
1,153
2,902
3
Miscellaneous manufacturing ...................
5
5
13
538
520
(2)
1,210
13
66
31
33
27
142
100
48
20
112
54
45
38
161
75
49
1,571
5,881
3,153
3,645
1,765
12,674
9,077
6,640
1,642
10,345
4,383
6,021
2,573
15,328
6,007
7,820
60
45
38
63
4,640
3,192
3,104
5,025
8
13
7
15
616
742
396
1,014
26
5
35
(2)
181
5
54
30
99
6
2
46
4
1,968
382
10,778
(2)
1,708
1,521
3,346
175
74
5,623
(2)
18,557
346
4,021
2,043
7,552
297
73
3,022
337
65
9
12
44
334
5
39
42
125
16
(2)
91
19
30
42
4,458
(2)
19,682
1,462
2,584
1,320
6,221
1,185
–
4,558
1,412
1,431
1,715
5,128
800
1,464
2,864
5,490
764
922
3,804
Wholesale trade ..............................................
Retail trade ......................................................
Transportation and warehousing ....................
Information ......................................................
Finance and insurance 3 ..................................
3
Real estate and rental and leasing ...............
3
Professional and technical services ..............
Management of companies and enterprises ...
3
Administrative and waste services ................
Educational services .......................................
Health care and social assistance ..................
Arts, entertainment, and recreation .................
Accommodation and food services .................
Other services, except public administration ..
Unclassified ....................................................
140
(2)
20
21
47
3
1
45
(2)
214
9
35
18
74
9
–
Government ........................................................
Federal ............................................................
State ................................................................
Local ................................................................
50
16
16
18
54
8
13
33
1
Data were reported by all states and the District of Columbia.
Data do not meet BLS or state agency disclosure standards.
3
Data beginning in 2008 are not strictly comparable to prior years
2
(2)
due to a change in NAICS versions.
NOTE: Dash represents zero.
30,945
292
2,823
3,106
10,278
962
(2)
8,182
1,746
2,985
3,451
Table 4. Mass layoff events and initial claimants for unemployment insurance, October 2006 to October 2008,
not seasonally adjusted
Private nonfarm
Total mass layoffs
Date
Mass layoffs
Events
Initial
claimants
Events
Extended mass layoffs
lasting more than 30 days
Initial
claimants
Realization rates 1
Initial
claimants
Events
Initial
claimants
1,640
330,954
39.8
72.3
1,110
199,250
35.4
61.3
1,421
259,234
43.2
74.5
1,018
173,077
33.7
54.5
1,814
r
347,149
39.5
70.0
1,340
r
258,767
35.9
r
70.3
1,756
r
335,854
r
44.7
r
81.3
p
31.4
p
41.1
Events
2006
October ......................................
November ..................................
December ..................................
964
1,315
2,249
98,804
136,186
254,503
820
1,172
2,126
88,133
125,009
244,783
Fourth Quarter ...........................
4,528
489,493
4,118
457,925
January ......................................
February ....................................
March .........................................
1,407
935
1,082
134,984
86,696
123,974
1,263
861
1,015
124,475
82,097
118,431
First Quarter ...............................
3,424
345,654
3,139
325,003
April ............................................
May ............................................
June ...........................................
1,219
923
1,599
127,444
85,816
172,810
1,115
856
1,318
118,040
81,153
148,669
Second Quarter .........................
3,741
386,070
3,289
347,862
July ............................................
August ........................................
September .................................
1,599
963
717
175,419
93,458
67,385
1,450
908
667
164,939
88,345
64,026
Third Quarter .............................
3,279
336,262
3,025
317,310
October ......................................
November ..................................
December ..................................
1,083
1,799
2,167
108,455
198,220
224,214
929
1,593
2,071
97,716
181,184
216,898
Fourth Quarter ...........................
5,049
530,889
4,593
495,798
January ......................................
February ....................................
March .........................................
1,647
1,269
1,089
154,503
119,508
114,541
1,520
1,178
1,039
144,191
113,587
110,147
First Quarter ...............................
4,005
388,552
3,737
367,925
April ............................................
May ............................................
June ...........................................
1,272
1,552
1,622
130,810
159,471
166,742
1,172
1,438
1,315
121,625
150,462
140,916
Second Quarter .........................
4,446
457,023
3,925
413,003
July ............................................
August ........................................
September .................................
1,891
1,427
1,292
200,382
139,999
129,586
1,687
1,343
1,202
186,018
133,146
122,505
Third Quarter .............................
4,610
469,967
4,232
441,669
October ......................................
2,125
221,784
1,917
205,553
2007
2008
1
The event realization rate is the percentage of all private nonfarm
r
2,p
1,330
2,p
181,386
number of extended mass layoff events is generally revised upwards
mass layoff events lasting more than 30 days. The initial claimant realization
by less than 10 percent and the number of initial claimants associated
rate is the percentage of all private nonfarm mass layoff initial claimants
with such events increases by 25-40 percent.
r
= revised.
associated with layoffs lasting more than 30 days.
2
These quarterly numbers are provisional and will be revised as more
data on these layoffs become available. Experience suggests that the
p
= preliminary.
Table 5. Mass layoff events and initial claimants for unemployment insurance by census region and division,
not seasonally adjusted
Initial claimants for
unemployment insurance
Mass layoff events
Census region and division
October
2007
August
2008
September
2008
October
2008
United States 1 .........................................
1,083
1,427
1,292
2,125
108,455
139,999
129,586
221,784
Northeast ..........................................................
New England ................................................
Middle Atlantic ..............................................
141
9
132
226
24
202
142
15
127
270
25
245
12,152
614
11,538
22,736
2,304
20,432
11,646
1,180
10,466
23,945
2,522
21,423
South ................................................................
South Atlantic ...............................................
East South Central .......................................
West South Central ......................................
230
131
51
48
362
212
90
60
475
153
54
268
538
295
111
132
23,180
11,952
6,791
4,437
38,188
20,313
11,179
6,696
43,772
12,291
4,788
26,693
53,087
25,535
15,162
12,390
Midwest ............................................................
East North Central ........................................
West North Central .......................................
261
215
46
307
254
53
225
189
36
511
406
105
38,853
32,840
6,013
33,238
26,689
6,549
26,646
23,087
3,559
75,210
60,196
15,014
West .................................................................
Mountain .......................................................
Pacific ...........................................................
451
38
413
532
50
482
450
43
407
806
98
708
34,270
2,905
31,365
45,837
4,688
41,149
47,522
3,675
43,847
69,542
9,191
60,351
1
See footnote 1, table 3.
NOTE: The States (including the District of Columbia) that
comprise the census divisions are: New England: Connecticut,
Maine, Massachusetts, New Hampshire, Rhode Island,
and Vermont; Middle Atlantic: New Jersey, New York, and
Pennsylvania; South Atlantic: Delaware, District of Columbia,
Florida, Georgia, Maryland, North Carolina, South Carolina,
Virginia, and West Virginia; East South Central: Alabama,
October
2007
August
2008
September
2008
October
2008
Kentucky, Mississippi, and Tennessee; West South Central: Arkansas,
Louisiana, Oklahoma, and Texas; East North Central: Illinois, Indiana,
Michigan, Ohio, and Wisconsin; West North Central: Iowa, Kansas,
Minnesota, Missouri, Nebraska, North Dakota, and South Dakota;
Mountain: Arizona, Colorado, Idaho, Montana, Nevada, New Mexico,
Utah, and Wyoming; and Pacific: Alaska, California, Hawaii, Oregon,
and Washington.
Table 6. State distribution: Mass layoff events and initial claimants for unemployment insurance,
not seasonally adjusted
Initial claimants for
unemployment insurance
Mass layoff events
State
Total 1 ..............................................
Alabama .............................................
Alaska .................................................
Arizona ...............................................
Arkansas .............................................
California ............................................
Colorado .............................................
Connecticut .........................................
Delaware ............................................
District of Columbia ............................
Florida .................................................
Georgia ...............................................
Hawaii .................................................
Idaho ...................................................
Illinois ..................................................
Indiana ................................................
Iowa ....................................................
Kansas ................................................
Kentucky .............................................
Louisiana ............................................
Maine ..................................................
Maryland .............................................
Massachusetts ....................................
Michigan .............................................
Minnesota ...........................................
Mississippi ..........................................
Missouri ..............................................
October
2007
August
2008
September
2008
October
2008
1,083
1,427
1,292
2,125
108,455
139,999
129,586
221,784
24
12
3
8
3
358
3
6
(2)
26
13
13
18
621
11
4
(2)
1,037
3,288
–
–
610
1,486
28,004
322
(2)
(2)
488
613
36,120
258
368
694
(2)
9,849
2,938
408
1,120
1,090
241
586
359
34,584
196
402
(2)
3,865
1,631
979
1,877
51,286
1,143
540
(2)
10
–
–
7
10
380
4
(2)
(2)
7
8
439
3
4
3
(2)
126
32
4
10
–
79
21
(2)
3
39
29
15
3
28
7
–
7
4
51
9
(2)
18
55
40
18
4
34
10
3
8
6
48
5
15
21
–
–
October
2007
–
96
20
9
4
176
61
9
22
5,082
2,835
(2)
192
43
34
10
6
24
163
(2)
5
4
40
4
6
16
64
63
23
18
46
22
(2)
11
11
81
23
17
35
7,710
5,129
1,662
347
3,449
453
(2)
430
(2)
1,027
32
5
21
74
5
5
29
3
45
5
54
18
(2)
118
6
36
146
(2)
16
3
23
August
2008
September
2008
–
October
2008
–
5,988
1,885
919
324
12,946
6,825
910
2,682
6,164
4,359
3,727
291
5,487
851
217
762
495
3,669
334
908
1,490
4,941
4,314
1,455
478
2,351
14,929
(2)
349
310
4,130
430
463
1,196
7,842
7,961
3,818
2,543
8,327
1,662
(2)
885
980
16,851
1,880
1,513
5,877
(2)
10,896
(2)
2,106
7,009
(2)
271
1,912
170
3,151
728
10,760
3,123
(2)
7,994
(2)
3,741
6,521
5,912
789
2,942
5,898
573
819
2,421
310
3,670
396
4,725
1,838
(2)
17,764
1,137
3,883
13,028
249
2,504
390
2,232
(2)
1,793
325
2,268
–
702
234
5,187
745
(2)
3,165
Montana ..............................................
Nebraska ............................................
Nevada ...............................................
New Hampshire ..................................
New Jersey .........................................
New Mexico ........................................
New York ............................................
North Carolina ....................................
North Dakota ......................................
Ohio ....................................................
Oklahoma ...........................................
Oregon ................................................
Pennsylvania ......................................
5
(2)
14
53
(2)
17
88
(2)
3
23
3
38
5
94
25
(2)
62
(2)
28
70
Rhode Island ......................................
South Carolina ....................................
South Dakota ......................................
Tennessee ..........................................
Texas ..................................................
Utah ....................................................
Vermont ..............................................
Virginia ................................................
Washington .........................................
West Virginia ......................................
Wisconsin ...........................................
Wyoming .............................................
3
13
5
12
–
–
–
–
–
–
–
–
11
30
(2)
(2)
6
14
(2)
43
(2)
17
40
(2)
3
4
11
(2)
49
12
97
3
(2)
4
16
(2)
40
(2)
22
86
9
(2)
4
29
1,496
5,124
(2)
664
361
880
(2)
4,503
884
10,616
243
(2)
546
5,161
(2)
3,790
(2)
1,457
7,714
721
(2)
655
2,641
80
4
2,122
2,414
(2)
(2)
465
1,058
(2)
3,918
(2)
Puerto Rico .........................................
11
18
18
13
894
1,958
1,715
1,117
–
16
(2)
28
3
–
–
1
See footnote 1, table 3.
2
Data do not meet BLS or state agency disclosure standards.
–
18
(2)
17
4
36
9
–
–
–
1,327
(2)
3,202
212
–
NOTE: Dash represents zero.
–
–
1,604
(2)
1,663
440
2,905
793
–
–
9,778
276
© Copyright 2026 Paperzz