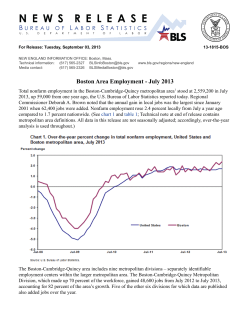
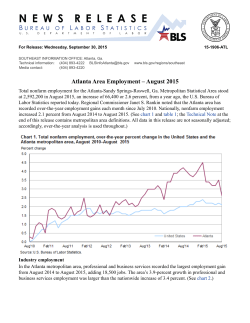
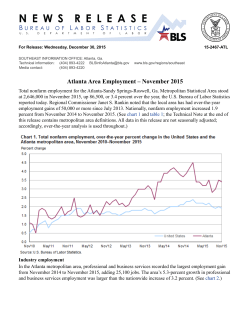
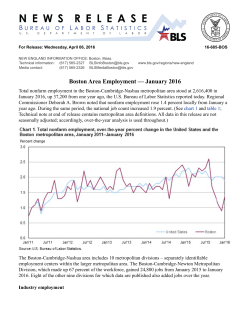
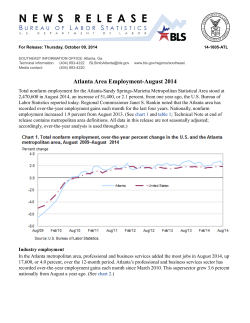
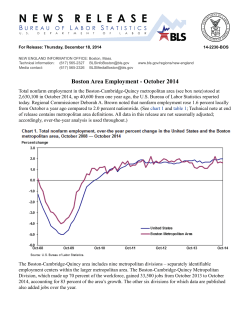
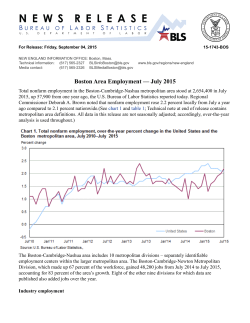
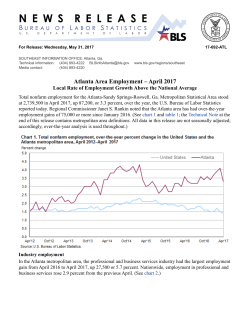
Internet address:
Historical, technical
information:
Current data:
Media contact:
http://www.bls.gov/lpc/
(202) 691-5606
(202) 691-5200
(202) 691-5902
USDL 08-1123
TRANSMISSION OF THIS
MATERIAL IS EMBARGOED
UNTIL 8:30 A.M. EDT,
FRIDAY, AUG. 8, 2008.
PRODUCTIVITY AND COSTS
Second Quarter 2008, Preliminary
The Bureau of Labor Statistics of the U.S. Department of Labor today reported preliminary
productivity data—as measured by output per hour of all persons—for the second quarter of 2008. The
seasonally adjusted annual rates of productivity change in the second quarter were:
2.3 percent in the business sector and
2.2 percent in the nonfarm business sector.
Productivity gains in both sectors reflected output increases and small declines in hours worked.
In manufacturing, the preliminary productivity changes in the second quarter were:
-1.4 percent in manufacturing,
-3.5 percent in durable goods manufacturing, and
0.7 percent in nondurable goods manufacturing.
Productivity in the total manufacturing sector fell 1.4 percent in the second quarter of 2008, as
both output and hours worked decreased. The decline in productivity was concentrated in the durable
goods subsector. Output and hours in manufacturing, which includes about 12 percent of U.S.
business-sector employment, tend to vary more from quarter to quarter than data for the aggregate
business and nonfarm business sectors. Second-quarter measures are summarized in table A and
appear in detail in tables 1 through 5.
The data sources and methods used in the preparation of the manufacturing series differ from
those used in preparing the business and nonfarm business series, and these measures are not directly
comparable. Output measures for business and nonfarm business are based on measures of gross
domestic product prepared by the Bureau of Economic Analysis of the U.S. Department of Commerce.
Quarterly output measures for manufacturing reflect indexes of industrial production independently
prepared by the Board of Governors of the Federal Reserve System. See Technical Notes for further
information on data sources (page 7).
Data in this release reflect the regular multi-year revision to the national income and product accounts
released by the Bureau of Economic Analysis of the U.S. Department of Commerce on July 31. See
Revised Measures, page 4.
2
Table A. Productivity and costs: Preliminary second-quarter 2008 measures
(Seasonally adjusted annual rates)
Sector
Productivity
Output
Hours
Hourly
compensation
Real
hourly
compensation
Unit
labor
costs
Percent change from preceding quarter
Business
Nonfarm business
Manufacturing
Durable
Nondurable
2.3
2.2
-1.4
-3.5
0.7
1.5
1.7
-3.5
-5.5
-1.3
-0.7
-0.5
-2.0
-2.1
-2.0
3.8
3.6
4.6
5.0
3.8
-1.2
-1.4
-0.4
0.0
-1.2
1.5
1.3
6.1
8.8
3.0
-0.1
0.1
0.3
0.0
0.7
1.5
1.5
1.9
1.6
2.3
Percent change from same quarter a year ago
Business
Nonfarm business
Manufacturing
Durable
Nondurable
2.7
2.8
2.6
2.7
2.6
1.7
1.8
-0.1
0.2
-0.5
-0.9
-1.0
-2.7
-2.5
-3.1
4.2
4.3
4.6
4.3
5.0
Business
Business sector output per hour increased 2.3 percent from the first quarter to the second
quarter of 2008, as output increased 1.5 percent and hours of all persons engaged in the sector—
employees, proprietors, and unpaid family workers—fell 0.7 percent (seasonally adjusted annual rates).
The increase in output was greater and the decline in hours was smaller than in the first quarter, when
productivity rose 2.2 percent, as revised (tables A, B, and 1). Historically, from 2000 through 2007,
business sector productivity had grown at an average annual rate of 2.5 percent.
Hourly compensation increased 3.8 percent in the second quarter of 2008, less than the 5.0
percent gain in the first quarter. This measure of compensation includes wages and salaries,
supplements, employer contributions to employee benefit plans, and taxes. Real hourly compensation,
which takes into account changes in consumer prices, fell 1.2 percent during the second quarter of 2008
as consumer prices increased 5.0 percent (seasonally adjusted annual rates).
Unit labor costs, which reflect changes in both hourly compensation and productivity, increased
at an annual rate of 1.5 percent during the second quarter of 2008. The implicit price deflator for the
business sector, which reflects changes in both unit labor costs and unit nonlabor payments, increased
0.6 percent in the second quarter of 2008 and 2.0 percent one quarter earlier.
3
Nonfarm Business
Productivity increased 2.2 percent in the nonfarm business sector during the second quarter of
2008 as output grew 1.7 percent and hours at work declined 0.5 percent. Revised results for firstquarter 2008 show that productivity increased 2.6 percent, output rose 0.9 percent, and hours fell 1.6
percent (tables A, B and 2). Nonfarm business output per hour had increased at an average annual rate
of 2.5 percent from 2000 through 2007.
Hourly compensation in the nonfarm business sector increased 3.6 percent in the second quarter
of 2008, compared to a 5.2 percent rise one quarter earlier. When the 5.0 percent annual rate of
increase in consumer prices is taken into account, real hourly compensation fell 1.4 percent in the
second quarter of 2008. This measure rose 0.8 percent in the first quarter.
Unit labor costs increased 1.3 percent in the second quarter of 2008 and 1.5 percent over the
last four quarters. The implicit price deflator for nonfarm business output rose 0.5 percent in the
second quarter of 2008 and 2.1 percent in the first quarter.
Chart 1. Output per Hour, Nonfarm Business, all persons, 2001:1-2008:2
2001:1-2007:4
Percent change
Chart 2. Unit Labor Costs, Nonfarm Business, all persons, 2001:1-2008:2
Percent change
12
From previous quarter, compound annual rate
10
12
From previous quarter, compound annual rate
10
From same quarter a year ago
8
8
6
6
4
4
2
2
0
0
-2
-2
-4
-4
-6
From same quarter a year ago
-6
2001
2002
2003
2004
2005
2006
2007
2008
2001
2002
2003
2004
2005
2006
2007
2008
Manufacturing
Productivity decreased 1.4 percent in manufacturing in the second quarter, as output fell 3.5
percent and hours of all persons declined 2.0 percent. In durable goods industries, productivity fell 3.5
percent—the largest drop since fourth-quarter 1990, when output per hour fell 4.6 percent. In
nondurable goods industries, productivity grew 0.7 percent in the second quarter as hours fell faster
than output (tables A, 3, 4, 5). In total manufacturing, output per hour increased 2.6 percent from the
second quarter of 2007 to the second quarter of 2008; output declined slightly over the four quarters,
0.1 percent, whereas hours fell by 2.7 percent. For the entire 2000-2007 period manufacturing
productivity increased at a 3.7 percent annual rate.
During the second quarter of 2008, hourly compensation grew 4.6 percent in total
manufacturing, 5.0 percent in durable manufacturing and 3.8 percent in nondurable manufacturing
(seasonally adjusted annual rates). Manufacturing hourly compensation also increased 4.6 percent over
the last four quarters. When the increase in consumer prices is taken into account, the real hourly
compensation of all manufacturing workers fell 0.4 percent in the second quarter.
4
Unit labor costs in manufacturing jumped 6.1 percent in the second quarter of 2008. The
growth in unit labor costs from the second quarter of 2007 was 1.9 percent, reversing the 0.8 percent
decline from the first quarter of 2007 to the first quarter of 2008 (chart 4). The 2000-2007 long-term
average annual rate of growth for unit labor costs is 0.3 percent.
Chart 3. Output per Hour, Manufacturing, all persons, 2001:1-2008:2
Chart 4. Unit Labor Costs, Manufacturing, all persons, 2001:1-2008:2
Percent change
Percent change
16
16
12
12
8
8
4
4
0
0
-4
-4
From previous quarter, compound annual rate
-8
From same quarter a year ago
-8
From previous quarter, compound annual rate
-12
From same quarter a year ago
-16
-12
-16
2001
2002
2003
2004
2005
2006
2007
2008
2001
2002
2003
2004
2005
2006
2007
2008
Revised Measures
Output data for the business and nonfarm business sectors, and the compensation series for all
sectors, incorporate the revised national income and product accounts (NIPA) data released by the
Bureau of Economic Analysis, U.S. Department of Commerce, on July 31. Revisions for these sectors
go back to the first quarter of 2005. Table B presents previous and revised productivity and related
measures for the major sectors: business, nonfarm business and manufacturing, for the first quarter of
2008 and for the years 2007 through 2005 (see page 5).
In the first quarter of 2008, output and hours were revised up in all three sectors. In both the
business and manufacturing sectors the revisions to hours were greater than to output, resulting in
downward revisions to productivity. In nonfarm business the revision to hours offset the revision to
output, and productivity increased at the same 2.6 percent rate reported June 4. In business and
nonfarm business there were small upward revisions to hourly compensation and unit labor costs. In
manufacturing, hourly compensation growth was revised down much more than productivity; the
downward revision to unit labor costs was due solely to the downward revision to hourly
compensation.
Growth in output and output per hour were revised down in the business and nonfarm business
sectors in 2007 and 2005, and were little changed in 2006. In both sectors, the average annual rate of
productivity growth from 2004 to 2007 was 1.4 percent, compared to 3.3 percent from 2000 to 2004.
Manufacturing sector output per hour was not revised historically.
For the year 2007, hourly compensation was revised down in all three sectors, leading to
downward revisions to unit labor costs. For 2006, manufacturing hourly compensation and unit labor
costs were revised up; for 2005 these same measures were revised down. Revised quarterly series
appear in tables 1-5 and appendix tables 1-5. The full historical revisions including the quarterly
measures can be found on the productivity and costs home page http://www.bls.gov/lpc/#data.
5
Table B. Previous and revised productivity and related measures
Percent changes at annual rates
Sector
Productivity
Output
Hours
Hourly
compensation
Real
hourly
compensation
Unit
labor
costs
First Quarter 2008
Business:
Previous………………
Revised……………….
Nonfarm business:
Previous………………
Revised……………….
Manufacturing:
Previous………………
Revised……………….
2.4
2.2
0.6
0.7
-1.7
-1.5
4.8
5.0
0.4
0.6
2.3
2.7
2.6
2.6
0.7
0.9
-1.8
-1.6
4.9
5.2
0.6
0.8
2.2
2.5
3.6
3.4
-1.2
-0.8
-4.7
-4.0
7.9
6.2
3.5
1.8
4.2
2.8
Annual average 2007
Business:
Previous........................
Revised.........................
Nonfarm business:
Previous........................
Revised.........................
Manufacturing:
Previous........................
Revised.........................
1.9
1.5
2.3
2.0
0.4
0.5
5.1
4.2
2.2
1.3
3.2
2.6
1.8
1.4
2.3
2.0
0.5
0.5
5.1
4.1
2.2
1.3
3.2
2.7
3.4
3.4
1.6
1.6
-1.7
-1.7
5.6
3.5
2.7
0.7
2.1
0.1
Annual average 2006
Business:
Previous........................
Revised.........................
Nonfarm business:
Previous........................
Revised.........................
Manufacturing:
Previous........................
Revised.........................
1.0
0.9
3.1
3.0
2.1
2.1
4.0
3.8
0.7
0.5
2.9
2.9
1.0
1.0
3.2
3.2
2.2
2.2
3.9
3.8
0.6
0.5
2.9
2.8
1.1
1.1
1.8
1.8
0.8
0.8
2.8
4.1
-0.5
0.8
1.7
3.0
Annual average 2005
Business:
Previous........................
Revised.........................
Nonfarm business:
Previous........................
Revised.........................
Manufacturing:
Previous........................
Revised.........................
2.0
1.8
3.6
3.5
1.6
1.6
4.0
4.0
0.6
0.6
2.0
2.1
1.9
1.7
3.6
3.4
1.7
1.7
4.0
4.0
0.6
0.6
2.1
2.2
4.9
4.9
3.7
3.7
-1.2
-1.2
4.2
1.9
0.9
-1.4
-0.6
-2.8
6
Revised Measures: Nonfinancial Corporations
Output, based on the income side of the NIPA for nonfinancial corporations, was revised down
sharply in the first quarter to -0.1 percent, leading to a corresponding downward revision to
productivity (table C). Unit labor costs were revised up as the revision to productivity was greater than
a downward revision to hourly compensation. Unit profits fell 14.7 percent, rather than 1.5 percent as
reported June 4. From the first quarter of 2007 through the first quarter of 2008, productivity increased
2.1 percent (table 6). Productivity had increased at an average annual rate of 2.7 percent from 2000
through 2007.
Table C. Nonfinancial corporations: Previous and revised productivity and cost measures
Percent changes at annual rates
Productivity
Output
Previous………
Revised……….
4.6
1.0
3.2
-0.1
Hours
Hourly
compensation
Real
hourly
compensation
First quarter 2008
-1.4
5.9
1.5
-1.1
4.9
0.6
Unit
labor
costs
Implicit
Unit
price
profits deflator
1.2
3.9
-1.5
-14.7
0.5
0.5
3.2
3.2
-5.8
-9.0
1.6
1.5
2.8
1.5
5.5
12.2
2.8
2.8
2.4
1.1
6.6
12.7
2.9
2.9
Annual average 2007
Previous………
Revised……….
1.5
0.9
2.2
1.6
0.7
0.7
4.8
4.1
1.9
1.3
Annual average 2006
Previous…
Revised……….
0.7
2.1
3.0
4.4
2.2
2.2
3.5
3.6
0.2
0.3
Annual average 2005
Previous………
Revised……….
1.4
2.6
3.1
4.3
1.7
1.7
3.8
3.7
0.4
0.4
Next release date
The next release of Productivity and Costs is scheduled for 8:30 a.m. EDT, Thursday, Sept.
4, 2008. Revised second-quarter measures for business, nonfarm business, and manufacturing will be
released at that time, along with preliminary measures for nonfinancial corporations.
7
TECHNICAL NOTES
Labor Hours: Hours data for the labor productivity and cost measures include hours for all persons
working in the sector—wage and salary workers, the self-employed and unpaid family workers. The
primary source of hours and employment data is the BLS Current Employment Statistics (CES)
program, which provides monthly survey data on the number of jobs held by wage and salary workers
in nonfarm establishments. The CES also provides average weekly paid hours of production and
nonsupervisory workers in these establishments. Weekly paid hours are adjusted to hours at work
using data from the National Compensation Survey (NCS). The BLS Hours at Work survey, conducted
for this purpose, was used for earlier years. The Office of Productivity and Technology estimates
average weekly hours at work for nonproduction and supervisory workers using information from the
Current Population Survey (CPS), the CES, and the NCS.
Data from the CPS are used for farm labor, nonfarm proprietors, and nonfarm unpaid family
workers. Estimates of labor input for government enterprises are derived from the CPS, the CES, and
the National Income and Product Accounts (NIPA) prepared by the Bureau of Economic Analysis
(BEA) of the Department of Commerce.
The CES measures jobs, counting a person who is employed by two or more establishments at
each place of employment. In contrast, the CPS features measures of employment that count each
person only once and classify each person according to his or her primary job; hours worked at all jobs
by that person accrue to his or her primary job. However, the CPS also collects more detailed
information on employment and hours worked at primary jobs and all other jobs, separately. The BLS
productivity measures use the more detailed information on employment and hours to assign all hours
worked to the correct industrial sector and avoid duplicating hours data from the CES.
Output: Business sector output is a chain-type, current-weighted index constructed after excluding
from gross domestic product (GDP) the following outputs: general government, nonprofit institutions,
and private households (including owner-occupied housing). Corresponding exclusions also are made
in labor inputs. Business output accounted for about 78 percent of the value of GDP in 2000. Nonfarm
business, which excludes farming, accounted for about 77 percent of GDP in 2000.
Annual indexes for manufacturing and its durable and nondurable goods components are
constructed by deflating current-dollar industry value of production data from the U.S. Bureau of the
Census with deflators from the BLS. These deflators are based on data from the BLS producer price
program and other sources. The industry shipments are aggregated using annual weights, and
intrasector transactions are removed. Quarterly manufacturing output measures are based on the index
of industrial production prepared monthly by the Board of Governors of the Federal Reserve System,
adjusted to be consistent with annual indexes of manufacturing sector output prepared by BLS.
Durables include the following 3-digit NAICS industries: wood product manufacturing; nonmetallic
mineral product manufacturing; primary metal manufacturing; fabricated metal product manufacturing;
machinery manufacturing; computer and electronic product manufacturing; electrical equipment and
appliance manufacturing; transportation equipment manufacturing; furniture and related product
manufacturing; and miscellaneous manufacturing. Nondurables include: food manufacturing; beverage
and tobacco product manufacturing; textile mills; textile product mills; apparel manufacturing; leather
and allied product manufacturing; paper manufacturing; printing and related support activities;
petroleum and coal products manufacturing; chemical manufacturing; and plastics and rubber products
manufacturing.
Nonfinancial corporate output is a chain-type, current-weighted index calculated on the basis of
the costs incurred and the incomes earned from production. The output measure excludes the
following outputs from GDP: general government; nonprofit institutions; private households;
unincorporated business; and those corporations classified as offices of bank holding companies,
offices of other holding companies, or offices in the finance and insurance sector. Nonfinancial
corporations accounted for about 54 percent of the value of GDP in 2000.
Productivity: These productivity measures describe the relationship between real output and the labor
time involved in its production. They show the changes from period to period in the amount of goods
8
and services produced per hour. Although these measures relate output to hours at work of all persons
engaged in a sector, they do not measure the specific contribution of labor, capital, or any other factor
of production. Rather, they reflect the joint effects of many influences, including changes in
technology; capital investment; level of output; utilization of capacity, energy, and materials; the
organization of production; managerial skill; and the characteristics and effort of the work force.
Labor Compensation: Estimates of labor compensation by major sector, required for measures of
hourly compensation and unit labor costs, are based primarily on employee compensation data from the
NIPA, prepared by the BEA. The compensation of employees in general government, nonprofit
institutions and private households are subtracted from compensation of domestic employees to derive
employee compensation for the business sector. The labor compensation of proprietors cannot be
explicitly identified and must be estimated. This is done by assuming that proprietors have the same
hourly compensation as employees in the same sector. The quarterly labor productivity and cost
measures do not contain estimates of compensation for unpaid family workers.
Unit Labor Costs: The measures of unit labor costs in this release describe the relationship between
compensation per hour and productivity, or real output per hour, and can be used as an indicator of
inflationary pressure on producers. Increases in hourly compensation increase unit labor costs; labor
productivity increases offset compensation increases and lower unit labor costs.
Presentation of the data: The quarterly data in this release are presented in three ways; as index
number series where 1992=100, as percent changes from the corresponding quarter of the previous
year, and as percent changes from the previous quarter presented at a compound annual rate. Annual
data are presented both as index number series and percent changes from the previous year.
The index numbers and rates of change reported in the productivity and costs news release are
rounded to one decimal place. All percent changes in this release and on the BLS web site are
calculated using index numbers to three decimal places. These index numbers are available at the BLS
web site, http://www.bls.gov/data/home.htm, or by contacting the BLS Division of Major Sector
Productivity. (Telephone 202-691-5606 or email [email protected])
Information in this release will be made available to sensory-impaired individuals upon request.
Voice phone: 202-691-5606; Federal Relay Service number: 1-800-877-8339.
9
Table 1. Business sector: Productivity, hourly compensation, unit labor costs, and prices, seasonally
adjusted
Real
Year
Output per
Hours
CompensacompensaUnit
Unit nonImplicit
and
hour of
of all
tion per
tion per
labor
labor pay- price
quarter
all persons Output
persons
hour (1)
hour (2)
costs
ments (3)
deflator (4)
--------------------------------------------------------------------------------------------------------Indexes 1992=100
2006
2007
I
II
III
IV
r136.1
r136.6
r135.9
r135.9
r162.8
r164.0
r164.1
r164.8
r119.7
r120.1
r120.8
r121.2
r168.0
r168.1
r168.9
r172.6
r120.6
r119.6
r119.1
r122.1
r123.5
r123.1
r124.3
r127.0
r133.4
r136.2
r136.2
r133.4
r127.2
r128.0
r128.8
r129.4
ANNUAL
r136.1
r163.9
r120.4
r169.4
r120.3
r124.5
r134.8
r128.3
I
II
III
IV
r135.9
r137.6
r139.7
r139.7
r164.5
r166.8
r169.0
r168.8
r121.0
r121.2
r121.0
r120.8
r174.7
r175.5
r177.1
r179.0
r122.4
r121.7
r121.9
r121.7
r128.5
r127.5
r126.8
r128.1
r134.3
r137.4
r139.7
r139.2
r130.7
r131.2
r131.6
r132.2
ANNUAL
r138.2
r167.3
r121.0
r176.5
r121.9
r127.7
r137.7
r131.4
2008
I
r140.5
r169.1
r120.3
r181.2
r121.9
r128.9
r139.5
r132.9
II
141.3
169.7
120.1
182.9
121.6
129.4
139.2
133.1
--------------------------------------------------------------------------------------------------------Percent change from previous quarter at annual rate(5)
2006
2007
I
II
III
IV
r2.6
r1.4
r-2.0
r0.2
r5.6
r2.9
r0.3
r1.7
3.0
1.5
r2.4
r1.5
r5.5
r0.2
r2.0
r9.0
r3.6
r-3.3
r-1.9
r10.7
r2.8
r-1.2
r4.1
r8.8
r3.1
r8.6
r-0.1
r-8.0
r3.0
r2.6
r2.4
r1.9
ANNUAL
r0.9
r3.0
2.1
r3.8
r0.5
2.9
r3.3
r3.0
I
II
III
IV
r0.0
r5.0
r6.2
r0.1
r-0.7
r5.6
r5.5
r-0.6
r-0.7
r0.6
-0.7
-0.7
r4.8
r1.9
r3.6
r4.4
r1.1
r-2.6
r0.8
r-0.6
r4.8
r-2.9
r-2.4
r4.3
r2.8
r9.6
r6.9
r-1.6
r4.0
r1.7
r1.1
r2.0
ANNUAL
r1.5
r2.0
r0.5
r4.2
r1.3
r2.6
r2.1
r2.4
2008
I
r2.2
r0.7
r-1.5
r5.0
r0.6
r2.7
r1.0
2.0
II
2.3
1.5
-0.7
3.8
-1.2
1.5
-0.8
0.6
--------------------------------------------------------------------------------------------------------Percent change from corresponding quarter of previous year
2006
2007
2008
I
II
III
IV
r1.3
r1.7
0.2
r0.5
r3.6
r3.5
2.4
r2.6
2.3
1.8
2.2
2.1
4.2
4.0
r2.9
r4.1
0.5
r0.1
r-0.4
r2.1
r2.9
r2.3
r2.7
r3.6
r3.9
5.2
3.5
r0.7
r3.3
r3.4
3.0
r2.5
ANNUAL
r0.9
r3.0
2.1
r3.8
r0.5
2.9
r3.3
r3.0
I
II
III
IV
r-0.1
r0.8
r2.8
r2.8
r1.0
r1.7
r3.0
r2.4
r1.2
0.9
r0.2
-0.4
r3.9
r4.4
r4.8
r3.7
r1.5
r1.7
r2.4
r-0.3
r4.1
r3.6
r1.9
r0.9
r0.7
r0.9
r2.6
r4.3
r2.7
r2.5
r2.2
r2.2
ANNUAL
r1.5
r2.0
r0.5
r4.2
r1.3
r2.6
r2.1
r2.4
I
3.4
r2.8
r-0.6
r3.7
r-0.4
r0.4
r3.9
r1.7
II
2.7
1.7
-0.9
4.2
-0.1
1.5
1.3
1.4
--------------------------------------------------------------------------------------------------------See footnotes following Table 6.
August 8, 2008
r=revised
Source: Bureau of Labor Statistics
10
Table 2. Nonfarm business sector: Productivity, hourly compensation, unit labor costs, and prices,
seasonally adjusted
Real
Year
Output per
Hours
CompensacompensaUnit
Unit nonImplicit
and
hour of
of all
tion per
tion per
labor
labor pay- price
quarter
all persons Output
persons
hour (1)
hour (2)
costs
ments (3)
deflator (4)
--------------------------------------------------------------------------------------------------------Indexes 1992=100
2006
2007
I
II
III
IV
r135.1
r135.7
r134.9
r135.0
r163.2
r164.3
r164.4
r165.0
r120.8
r121.1
r121.9
r122.2
r166.8
r167.1
r167.9
r171.7
r119.7
r118.9
r118.3
r121.4
r123.5
r123.1
r124.4
r127.1
r135.5
r138.6
r138.3
r134.9
r127.9
r128.8
r129.5
r130.0
ANNUAL
r135.2
r164.2
r121.5
r168.3
r119.6
r124.5
r136.8
r129.1
I
II
III
IV
r135.0
r136.4
r138.3
r138.6
r164.7
r167.0
r169.2
r168.9
r122.0
r122.4
r122.3
r121.9
r173.7
r174.1
r175.5
r177.8
r121.8
r120.7
r120.9
r121.0
r128.7
r127.7
r126.9
r128.3
r135.2
r138.2
r140.3
r139.8
r131.1
r131.5
r131.8
r132.5
ANNUAL
r137.1
r167.5
r122.2
r175.3
r121.1
r127.9
r138.4
r131.7
2008
I
r139.5
r169.3
r121.4
r180.1
r121.2
r129.1
r140.3
r133.2
II
140.3
170.0
121.2
181.7
120.8
129.5
140.0
133.4
--------------------------------------------------------------------------------------------------------Percent change from previous quarter at annual rate(5)
2006
2007
I
II
III
IV
r2.5
r1.8
r-2.1
r0.2
r6.0
r2.9
r0.3
r1.4
r3.3
1.1
2.4
r1.2
r5.2
r0.7
r2.0
r9.4
r3.3
r-2.8
r-2.0
r11.0
r2.6
r-1.1
r4.1
r9.1
r3.9
r9.4
r-0.9
r-9.5
r3.1
r2.9
r2.1
r1.5
ANNUAL
1.0
3.2
2.2
r3.8
r0.5
r2.8
r3.6
r3.1
I
II
III
IV
r0.0
r4.1
r5.8
r0.8
r-0.9
r5.8
r5.5
r-0.7
-0.9
r1.6
r-0.3
-1.6
r4.9
r0.8
3.3
r5.4
r1.2
r-3.6
r0.5
r0.4
r4.9
r-3.2
r-2.4
r4.5
r0.9
r9.4
r6.3
r-1.6
r3.4
r1.5
r0.9
r2.1
ANNUAL
r1.4
r2.0
0.5
r4.1
r1.3
r2.7
r1.2
r2.1
2008
I
2.6
r0.9
r-1.6
r5.2
r0.8
r2.5
r1.5
r2.1
II
2.2
1.7
-0.5
3.6
-1.4
1.3
-0.9
0.5
--------------------------------------------------------------------------------------------------------Percent change from corresponding quarter of previous year
2006
2007
2008
I
II
III
IV
r1.3
r1.7
r0.3
r0.6
r3.7
r3.7
r2.6
r2.6
2.4
2.0
2.3
2.0
4.2
r3.9
r2.9
r4.3
r0.5
r0.0
r-0.5
r2.2
r2.9
2.2
2.6
r3.6
r4.3
r5.9
r3.8
r0.5
r3.4
r3.6
r3.1
r2.4
ANNUAL
1.0
3.2
2.2
r3.8
r0.5
r2.8
r3.6
r3.1
I
II
III
IV
r0.0
r0.5
r2.5
r2.7
r0.9
r1.6
r2.9
r2.4
0.9
r1.1
r0.4
r-0.3
r4.2
r4.2
r4.6
r3.6
r1.7
r1.5
r2.2
r-0.4
r4.2
r3.7
r2.0
r0.9
r-0.2
r-0.2
r1.5
r3.7
r2.5
r2.1
r1.8
r2.0
ANNUAL
r1.4
r2.0
0.5
r4.1
r1.3
r2.7
r1.2
r2.1
I
3.3
r2.8
r-0.5
r3.6
r-0.5
r0.3
r3.8
r1.6
II
2.8
1.8
-1.0
4.3
0.1
1.5
1.3
1.4
--------------------------------------------------------------------------------------------------------See footnotes following Table 6.
August 8, 2008
r=revised
Source: Bureau of Labor Statistics
11
Table 3. Manufacturing sector: Productivity, hourly compensation, and unit labor costs,
seasonally adjusted
Real
Year
Output per
Hours
CompensacompensaUnit
and
hour of
of all
tion per
tion per
labor
quarter
all persons
Output
persons
hour (1)
hour (2)
costs
-------------------------------------------------------------------------------------------------Indexes 1992=100
2006
2007
I
II
III
IV
172.6
172.7
174.5
175.4
147.2
147.4
148.0
147.4
85.3
85.4
84.8
84.0
r170.9
r169.5
r170.3
r174.6
r122.7
r120.7
r120.0
r123.5
r99.0
r98.2
r97.6
r99.5
ANNUAL
173.8
147.5
84.9
r171.3
r121.7
r98.6
I
II
III
IV
177.0
178.7
180.6
r182.5
147.8
149.6
151.2
r151.0
83.5
83.7
83.7
82.8
r176.9
r176.4
r176.4
r179.7
r124.0
r122.3
r121.4
r122.2
r100.0
r98.7
r97.6
r98.5
ANNUAL
r179.7
r149.9
83.4
r177.3
r122.5
r98.7
2008
I
r184.0
r150.7
r81.9
r182.4
r122.8
r99.1
II
183.3
149.4
81.5
184.5
122.7
100.6
-------------------------------------------------------------------------------------------------Percent change from previous quarter at annual rate(5)
2006
2007
I
II
III
IV
-0.6
0.2
4.3
2.2
1.8
0.6
1.6
-1.7
2.4
0.4
-2.5
-3.8
r14.3
r-3.1
r1.8
r10.4
r12.3
r-6.5
r-2.1
r12.1
r15.0
r-3.3
r-2.3
r8.0
ANNUAL
1.1
1.8
0.8
r4.1
r0.8
r3.0
I
II
III
IV
3.6
3.8
4.5
4.2
1.2
4.9
4.3
-0.4
-2.3
1.0
-0.2
-4.4
r5.5
r-1.1
r-0.1
r7.8
r1.8
r-5.5
r-2.8
r2.7
r1.8
r-4.8
r-4.4
r3.4
ANNUAL
3.4
1.6
-1.7
r3.5
r0.7
r0.1
2008
I
r3.4
r-0.8
r-4.0
r6.2
r1.8
r2.8
II
-1.4
-3.5
-2.0
4.6
-0.4
6.1
-------------------------------------------------------------------------------------------------Percent change from corresponding quarter of previous year
2006
2007
2008
I
II
III
IV
1.5
0.4
0.9
1.5
2.4
2.1
2.3
0.6
0.9
1.7
1.4
-0.9
r5.4
r3.3
r2.3
r5.6
r1.6
r-0.6
r-1.0
r3.6
r3.8
r2.9
r1.4
r4.1
ANNUAL
1.1
1.8
0.8
r4.1
r0.8
r3.0
I
II
III
IV
2.6
3.5
3.5
4.0
0.4
1.5
2.1
2.5
-2.1
-1.9
-1.3
-1.5
r3.5
r4.1
r3.6
r2.9
r1.1
r1.4
r1.2
r-1.0
r0.9
r0.6
r0.0
r-1.1
ANNUAL
3.4
1.6
-1.7
r3.5
r0.7
r0.1
I
4.0
r2.0
r-1.9
r3.1
r-1.0
r-0.8
II
2.6
-0.1
-2.7
4.6
0.3
1.9
-------------------------------------------------------------------------------------------------See footnotes following Table 6.
August 8, 2008
r=revised
Source: Bureau of Labor Statistics
12
Table 4. Durable manufacturing sector: Productivity, hourly compensation, and unit labor costs,
seasonally adjusted
Real
Year
Output per
Hours
CompensacompensaUnit
and
hour of
of all
tion per
tion per
labor
quarter
all persons
Output
persons
hour (1)
hour (2)
costs
-------------------------------------------------------------------------------------------------Indexes 1992=100
2006
2007
I
II
III
IV
198.8
198.9
201.7
202.4
179.6
180.5
181.1
180.1
90.3
90.7
89.8
89.0
r166.0
r164.6
r165.3
r170.2
r119.2
r117.1
r116.5
r120.4
r83.5
r82.7
r81.9
r84.1
ANNUAL
200.4
180.3
90.0
r166.5
r118.3
r83.1
I
II
III
IV
204.4
207.9
210.9
r214.3
180.3
183.9
186.9
r187.0
88.2
88.4
88.6
87.3
r173.0
r172.5
r172.2
r175.5
r121.3
r119.6
r118.6
r119.4
r84.7
r83.0
r81.7
r81.9
ANNUAL
r209.4
r184.5
88.1
r173.3
r119.7
r82.8
2008
I
r215.4
r186.8
r86.7
r177.8
r119.7
r82.5
II
213.5
184.2
86.3
180.0
119.7
84.3
-------------------------------------------------------------------------------------------------Percent change from previous quarter at annual rate(5)
2006
2007
I
II
III
IV
-1.8
0.3
5.7
1.4
0.4
2.1
1.2
-2.1
2.3
1.8
-4.3
-3.4
r13.7
r-3.3
r1.6
r12.6
r11.7
r-6.6
r-2.3
r14.4
r15.9
r-3.6
r-3.9
r11.1
ANNUAL
2.2
3.3
1.1
r3.9
r0.6
r1.7
I
II
III
IV
3.9
7.1
6.0
6.6
0.4
8.2
6.8
0.3
-3.4
1.0
0.8
-6.0
r6.7
r-1.2
r-0.7
r7.9
r3.0
r-5.5
r-3.3
r2.8
r2.7
r-7.7
r-6.2
r1.2
ANNUAL
4.5
2.3
-2.0
r4.1
r1.3
r-0.3
2008
I
r2.1
r-0.4
r-2.5
r5.2
r0.9
r3.0
II
-3.5
-5.5
-2.1
5.0
0.0
8.8
-------------------------------------------------------------------------------------------------Percent change from corresponding quarter of previous year
2006
2007
2008
I
II
III
IV
3.2
2.0
2.2
1.4
4.8
4.6
3.6
0.4
1.6
2.5
1.4
-1.0
r4.9
r3.1
r1.9
r5.9
r1.1
r-0.8
r-1.5
r3.9
r1.6
r1.1
r-0.4
r4.5
ANNUAL
2.2
3.3
1.1
r3.9
r0.6
r1.7
I
II
III
IV
2.8
4.5
4.6
5.9
0.4
1.8
3.2
3.9
-2.4
-2.5
-1.3
-1.9
r4.3
r4.8
r4.2
r3.1
r1.8
r2.1
r1.8
r-0.8
r1.4
r0.3
r-0.3
r-2.6
ANNUAL
4.5
2.3
-2.0
r4.1
r1.3
r-0.3
I
r5.4
r3.6
r-1.7
r2.7
r-1.4
r-2.5
II
2.7
0.2
-2.5
4.3
0.0
1.6
-------------------------------------------------------------------------------------------------See footnotes following Table 6.
August 8, 2008
r=revised
Source: Bureau of Labor Statistics
13
Table 5. Nondurable manufacturing sector: Productivity, hourly compensation, and unit labor costs,
seasonally adjusted
Real
Year
Output per
Hours
CompensacompensaUnit
and
hour of
of all
tion per
tion per
labor
quarter
all persons
Output
persons
hour (1)
hour (2)
costs
-------------------------------------------------------------------------------------------------Indexes 1992=100
2006
2007
I
II
III
IV
148.0
148.4
149.0
150.3
115.0
114.8
115.4
115.1
77.7
77.3
77.4
76.6
r178.0
r176.6
r177.8
r180.4
r127.8
r125.7
r125.3
r127.6
r120.2
r119.0
r119.3
r120.0
ANNUAL
148.9
115.1
77.2
r178.2
r126.6
r119.6
I
II
III
IV
151.2
151.4
152.7
r152.9
115.6
116.0
116.4
r116.1
76.5
76.6
76.3
75.9
r181.9
r181.4
r181.8
r185.3
r127.5
r125.8
r125.2
r126.0
r120.3
r119.9
r119.1
r121.2
ANNUAL
r152.0
r116.0
76.3
r182.6
r126.1
r120.1
2008
I
r155.1
r115.8
r74.6
r188.8
r127.1
r121.8
II
155.4
115.4
74.3
190.6
126.7
122.7
-------------------------------------------------------------------------------------------------Percent change from previous quarter at annual rate(5)
2006
2007
I
II
III
IV
1.0
1.1
1.5
3.5
3.6
-0.9
2.2
-1.1
2.6
-1.9
0.6
-4.4
r15.5
r-3.1
r2.6
r6.1
r13.4
r-6.5
r-1.4
r7.7
r14.4
r-4.1
1.1
r2.5
ANNUAL
0.2
0.3
0.1
r4.5
r1.1
r4.3
I
II
III
IV
2.5
0.4
3.5
0.6
2.0
1.3
1.6
-1.1
-0.5
0.9
-1.9
-1.7
r3.3
r-1.0
r0.7
r7.9
r-0.3
r-5.3
r-2.0
r2.8
r0.8
r-1.4
r-2.7
r7.3
ANNUAL
2.1
0.9
-1.2
r2.5
r-0.3
r0.4
2008
I
r5.9
r-1.2
r-6.7
r7.9
r3.5
r1.9
II
0.7
-1.3
-2.0
3.8
-1.2
3.0
-------------------------------------------------------------------------------------------------Percent change from corresponding quarter of previous year
2006
2007
2008
I
II
III
IV
0.2
-0.7
-0.4
1.8
-0.1
-0.6
1.0
0.9
-0.3
0.1
1.4
-0.8
r6.2
r3.5
r3.1
r5.1
r2.4
r-0.4
r-0.2
r3.0
r6.0
r4.2
r3.6
r3.2
ANNUAL
0.2
0.3
0.1
r4.5
r1.1
r4.3
I
II
III
IV
2.1
2.0
2.5
1.7
0.5
1.1
0.9
0.9
-1.6
-0.9
-1.5
-0.8
r2.2
r2.7
r2.3
r2.7
r-0.2
r0.1
r-0.1
r-1.2
r0.0
r0.7
r-0.2
r1.0
ANNUAL
2.1
0.9
-1.2
r2.5
r-0.3
r0.4
I
r2.6
r0.1
-2.4
r3.8
r-0.3
r1.2
II
2.6
-0.5
-3.1
5.0
0.7
2.3
-------------------------------------------------------------------------------------------------See footnotes following Table 6.
August 8, 2008
r=revised
Source: Bureau of Labor Statistics
14
Table 6. Nonfinancial corporate sector: Productivity, hourly compensation, unit labor costs, unit profits,
and prices, seasonally adjusted
Output
Hourly
Real
Unit
Total
Unit
Implicit
Year
per allcompenhourly
Unit
nonunit
proprice
and
employee
Employee sation
compenlabor
labor
costs
fits
deflator
quarter
hour
Output hours
(1)
sation(2) costs
costs(6) (7)
(8)
(4)
---------------------------------------------------------------------------------------------------------Indexes 1992=100
2006
2007
I
II
III
IV
r146.3
r146.0
r147.0
r146.0
r176.2
r176.5
r178.5
r177.8
r120.4
r120.9
r121.5
r121.8
r164.5
r164.5
r165.1
r167.8
r118.1
r117.0
r116.3
r118.7
r112.4
r112.6
r112.3
r114.9
r112.9
r114.4
r114.2
r116.2
r112.5
r113.1
r112.8
r115.3
r182.5
r183.1
r193.0
r173.9
r118.8
r119.4
r120.0
r120.5
ANNUAL
r146.3
r177.3
r121.1
r165.5
r117.5
r113.1
r114.4
r113.4
r183.1
r119.7
I
II
III
IV
r146.2
r147.4
r148.1
r148.8
r177.8
r179.7
r180.9
r181.7
r121.7
r121.9
r122.1
r122.1
r170.3
r171.3
r172.5
r175.0
r119.4
r118.7
r118.7
r119.0
r116.5
r116.2
r116.5
r117.6
r117.2
r117.4
r117.8
r118.9
r116.7
r116.5
r116.8
r117.9
r171.8
r172.5
r166.8
r155.9
r121.6
r121.5
r121.3
r121.3
ANNUAL
r147.6
r180.0
r122.0
r172.3
r119.0
r116.7
r117.9
r117.0
r166.7
r121.4
2008
I
r149.2
r181.7
r121.8
r177.1
r119.2
r118.7
r118.7
r118.7
r149.8
r121.5
---------------------------------------------------------------------------------------------------------Percent change from previous quarter at annual rate(5)
2006
2007
I
II
III
IV
r4.4
r-0.9
r2.7
r-2.6
r7.0
r0.8
r4.7
r-1.6
2.4
1.7
1.9
r1.0
r8.3
r0.0
r1.5
r6.9
r6.3
r-3.5
r-2.5
r8.5
r3.7
r0.9
r-1.2
r9.7
r-0.6
r5.3
r-0.5
r6.9
r2.5
r2.1
r-1.0
r9.0
r12.1
r1.4
r23.3
r-34.1
r3.7
r2.0
r2.1
r1.7
ANNUAL
r2.1
r4.4
2.2
r3.6
r0.3
r1.5
1.4
r1.4
r12.2
2.8
I
II
III
IV
r0.4
r3.4
r1.8
r1.9
r0.0
r4.3
r2.6
r1.9
-0.3
0.8
0.7
0.0
r6.1
r2.2
2.8
5.9
r2.4
-2.3
0.1
r0.9
r5.7
r-1.2
r1.0
r3.9
r3.6
r0.8
r1.3
r3.9
r5.1
r-0.7
r1.0
r3.9
r-4.7
r1.7
r-12.5
r-23.7
r3.8
r-0.4
r-0.8
r0.2
ANNUAL
r0.9
r1.6
0.7
r4.1
r1.3
3.2
r3.0
r3.2
r-9.0
r1.5
2008
I
r1.0
r-0.1
r-1.1
r4.9
r0.6
r3.9
r-0.9
r2.6
r-14.7
0.5
---------------------------------------------------------------------------------------------------------Percent change from corresponding quarter of previous year
2006
2007
I
II
III
IV
r3.2
r1.6
r2.9
r0.9
r5.9
r3.9
r5.2
r2.7
2.6
2.3
r2.2
1.8
r4.1
r3.7
r2.6
r4.1
r0.4
r-0.2
r-0.7
r2.1
r0.9
r2.0
r-0.3
r3.2
r1.4
r2.7
r-1.3
r2.7
r1.0
r2.2
r-0.6
r3.1
r17.1
r9.8
r26.8
r-2.0
r3.0
3.2
r2.6
2.4
ANNUAL
r2.1
r4.4
2.2
r3.6
r0.3
r1.5
1.4
r1.4
r12.2
2.8
I
II
III
IV
r-0.1
r1.0
r0.7
r1.9
r1.0
r1.8
r1.3
r2.2
1.1
r0.8
0.6
0.3
r3.6
r4.1
r4.5
r4.3
r1.1
r1.4
r2.1
r0.3
r3.7
r3.1
3.7
r2.3
r3.8
r2.7
r3.1
r2.4
r3.7
r3.0
r3.6
r2.3
r-5.9
r-5.8
r-13.6
r-10.3
r2.4
r1.8
1.1
r0.7
ANNUAL
r0.9
r1.6
0.7
r4.1
r1.3
3.2
r3.0
r3.2
r-9.0
r1.5
2008
I
r2.1
r2.2
r0.1
r4.0
r-0.2
r1.9
r1.3
r1.7
r-12.8
r-0.1
---------------------------------------------------------------------------------------------------------See footnotes following Table 6.
August 8, 2008
r=revised
Source: Bureau of Labor Statistics
15
SOURCES: Output data are from the Bureau of Economic Analysis and the Census Bureau of
the U.S. Department of Commerce; the Bureau of Labor Statistics, U.S. Department of Labor;
and the Federal Reserve Board. Compensation and hours data are from the Bureau of Labor
Statistics and the Bureau of Economic Analysis.
RELIABILITY: Productivity and cost measures are regularly revised as more complete
information becomes available. The measures are first published within 40 days of the close of
the reference period; revisions appear 30 days later, and second revisions after an additional 60
days. In the business sector, the third publication (second revision) of a quarterly index of output
per hour of all persons has differed from the initial value by between –1.5 and +1.3 index points
approximately 95 percent of the time. This interval is based on the performance of this measure
between the fourth quarter of 1995 and the first quarter of 2008.
Footnotes, Tables 1-6
(1) Wages and salaries of employees plus employers' contributions for social insurance and
private benefit plans. Except for nonfinancial corporations, where there are no selfemployed, data also include an estimate of wages, salaries, and supplemental payments
for the self-employed.
(2) The change for recent quarters is based on the Consumer Price Index for all urban consumers
(CPI-U). The trend from 1978-2007 is based on the Consumer Price Index research series
(CPI-U-RS).
(3) Unit nonlabor payments include profits, consumption of fixed capital, taxes on production
and imports less subsidies, net interest and miscellaneous payments, business current
transfer payments, rental income of persons, and the current surplus of government
enterprises.
(4) Current dollar output divided by the output index.
(5) Quarterly changes: Percent change compounded at annual rate is calculated using index
numbers to three decimal places. Indexes published in the news release are rounded to
one decimal place for convenience. Annual changes: Percent change is calculated using
annual average indexes to three decimal places.
(6) Unit nonlabor costs include consumption of fixed capital, taxes on production and imports
less subsidies, net interest and miscellaneous payments, and business current transfer
payments.
(7) Total unit costs are the sum of unit labor and nonlabor costs.
(8) Unit profits include corporate profits before tax with inventory valuation and capital
consumption adjustments.
16
Appendix table 1. Business sector: Revised productivity, hourly compensation, unit labor costs, and prices,
seasonally adjusted
Real
Year
Output per
Hours
CompensacompensaUnit
Unit nonImplicit
and
hour of
of all
tion per
tion per
labor
labor pay- price
quarter
all persons Output
persons
hour (1)
hour (2)
costs
ments (3)
deflator (4)
--------------------------------------------------------------------------------------------------------Indexes 1992=100
2005
I
II
III
IV
r134.3
r134.2
r135.6
r135.2
r157.1
r158.4
r160.2
r160.6
r117.0
r118.0
r118.2
r118.8
r161.2
r161.6
r164.1
r165.8
r120.1
r119.5
r119.6
r119.6
r120.0
r120.4
r121.1
r122.6
r128.5
r129.5
r131.6
r132.4
r123.2
r123.8
r125.0
r126.3
ANNUAL
r134.8
r159.1
r118.0
r163.2
r119.7
r121.0
r130.5
r124.6
--------------------------------------------------------------------------------------------------------Percent change from previous quarter at annual rate(5)
2005
I
II
III
IV
r2.7
r-0.3
r4.1
-1.0
3.7
r3.2
r4.8
1.0
0.9
3.5
0.7
2.0
r2.3
r1.0
r6.5
r4.2
r0.5
r-1.8
r0.2
r0.1
r-0.4
r1.3
r2.3
r5.2
r10.2
r3.0
r6.9
r2.4
r3.6
r2.0
r4.1
r4.1
ANNUAL
r1.8
r3.5
1.6
4.0
0.6
r2.1
r4.7
3.1
--------------------------------------------------------------------------------------------------------Percent change from corresponding quarter of previous year
2005
I
II
III
IV
r2.4
r1.4
r2.1
r1.4
3.8
3.5
r3.7
r3.1
1.3
2.0
1.5
r1.7
r4.7
3.8
4.0
r3.5
r1.7
r0.8
r0.3
r-0.3
r2.3
2.3
r1.8
r2.1
r4.4
r3.3
r5.5
r5.6
3.1
r2.7
r3.3
r3.4
ANNUAL
r1.8
r3.5
1.6
4.0
0.6
r2.1
r4.7
3.1
-------------------------------------------------------------------------------------------------------Appendix table 2. Nonfarm business sector: Revised productivity, hourly compensation, unit labor costs,
and prices, seasonally adjusted
Real
Year
Output per
Hours
CompensacompensaUnit
Unit nonImplicit
and
hour of
of all
tion per
tion per
labor
labor pay- price
quarter
all persons Output
persons
hour (1)
hour (2)
costs
ments (3)
deflator (4)
--------------------------------------------------------------------------------------------------------Indexes 1992=100
2005
I
II
III
IV
r133.3
r133.4
r134.6
r134.2
r157.3
r158.4
r160.3
r160.8
r118.0
r118.8
r119.1
r119.8
r160.0
r160.8
r163.2
r164.7
r119.2
r118.9
r118.9
r118.8
r120.0
r120.5
r121.2
r122.7
r129.9
r130.8
r133.2
r134.2
r123.7
r124.3
r125.6
r126.9
ANNUAL
r133.9
r159.2
r118.9
r162.2
r118.9
r121.1
r132.0
r125.1
--------------------------------------------------------------------------------------------------------Percent change from previous quarter at annual rate(5)
2005
I
II
III
IV
r3.2
r0.3
r3.7
r-1.1
r3.7
r2.9
r4.8
r1.3
0.5
2.7
1.0
2.5
r2.8
r1.9
r6.2
r3.7
r1.0
r-0.9
r-0.1
r-0.4
r-0.5
r1.6
r2.4
r4.9
r11.2
r3.0
r7.4
r3.1
r3.9
r2.2
r4.3
r4.2
ANNUAL
r1.7
r3.4
1.7
4.0
0.6
r2.2
r5.2
3.4
--------------------------------------------------------------------------------------------------------Percent change from corresponding quarter of previous year
2005
I
II
III
IV
r2.3
r1.3
r1.9
r1.5
3.8
r3.3
r3.5
r3.2
1.4
2.0
1.6
1.7
r4.6
r3.8
4.0
r3.6
r1.6
r0.9
0.2
r-0.1
r2.2
2.5
r2.0
r2.1
r5.0
r3.9
r5.9
r6.1
3.3
r3.1
3.5
r3.6
ANNUAL
r1.7
r3.4
1.7
4.0
0.6
r2.2
r5.2
3.4
-------------------------------------------------------------------------------------------------------See footnotes following Table 6.
August 8, 2008
r=revised
Source: Bureau of Labor Statistics
17
Appendix table 3.
costs, seasonally
Manufacturing sector: Revised productivity, hourly compensation, and unit labor
adjusted
Real
Year
Output per
Hours
CompensacompensaUnit
and
hour of
of all
tion per
tion per
labor
quarter
all persons
Output
persons
hour (1)
hour (2)
costs
-------------------------------------------------------------------------------------------------Indexes 1992=100
2005
I
II
III
IV
170.0
172.0
172.9
172.8
143.7
144.5
144.7
146.5
84.5
84.0
83.7
84.8
r162.2
r164.2
r166.5
r165.3
r120.8
r121.4
r121.3
r119.2
r95.4
r95.5
r96.3
r95.6
ANNUAL
171.9
144.8
84.3
r164.5
r120.7
r95.7
-------------------------------------------------------------------------------------------------Percent change from previous quarter at annual rate(5)
2005
I
II
III
IV
7.1
4.7
2.2
-0.2
5.7
2.0
0.6
5.3
-1.4
-2.5
-1.5
5.5
r-8.3
r5.0
5.8
r-2.9
r-9.9
r2.1
r-0.5
r-6.7
r-14.4
r0.3
r3.5
r-2.8
ANNUAL
4.9
3.7
-1.2
r1.9
r-1.4
r-2.8
-------------------------------------------------------------------------------------------------Percent change from corresponding quarter of previous year
2005
I
II
III
IV
5.2
5.6
5.3
3.4
3.9
4.0
3.4
3.4
-1.3
-1.5
-1.8
0.0
r3.4
r2.7
r1.8
r-0.3
r0.4
r-0.2
r-1.9
r-3.9
r-1.7
r-2.7
r-3.4
r-3.6
ANNUAL
4.9
3.7
-1.2
r1.9
r-1.4
r-2.8
------------------------------------------------------------------------------------------------Appendix table 4. Durable manufacturing sector: Revised productivity, hourly compensation, and
unit labor costs seasonally adjusted
Real
Year
Output per
Hours
CompensacompensaUnit
and
hour of
of all
tion per
tion per
labor
quarter
all persons
Output
persons
hour (1)
hour (2)
costs
-------------------------------------------------------------------------------------------------Indexes 1992=100
2005
I
II
III
IV
192.6
195.0
197.3
199.7
171.4
172.6
174.7
179.4
88.9
88.5
88.5
89.8
r158.3
r159.7
r162.2
r160.7
r117.9
r118.1
r118.2
r115.9
r82.1
r81.9
r82.2
r80.5
ANNUAL
196.2
174.5
89.0
r160.2
r117.5
r81.7
-------------------------------------------------------------------------------------------------Percent change from previous quarter at annual rate(5)
2005
I
II
III
IV
7.1
5.1
4.8
4.9
7.1
3.0
4.9
11.2
-0.1
-2.0
0.1
6.0
r-7.1
r3.7
r6.6
r-3.7
r-8.7
r0.8
r0.3
r-7.4
r-13.2
r-1.4
r1.7
r-8.2
ANNUAL
5.4
5.2
-0.2
r1.9
r-1.4
r-3.3
-------------------------------------------------------------------------------------------------Percent change from corresponding quarter of previous year
2005
I
II
III
IV
4.4
5.4
6.1
5.5
4.1
4.9
5.2
6.5
-0.3
-0.6
-0.9
1.0
r3.9
r2.6
r1.6
r-0.3
r0.9
r-0.3
r-2.1
r-3.9
r-0.5
r-2.7
r-4.3
r-5.4
ANNUAL
5.4
5.2
-0.2
r1.9
r-1.4
r-3.3
------------------------------------------------------------------------------------------------See footnotes following Table 6.
August 8, 2008
r=revised
Source: Bureau of Labor Statistics
18
Appendix table 5. Nondurable manufacturing sector: Revised productivity, hourly compensation,
and unit labor costs seasonally adjusted
Real
Year
Output per
Hours
CompensacompensaUnit
and
hour of
of all
tion per
tion per
labor
quarter
all persons
Output
persons
hour (1)
hour (2)
costs
-------------------------------------------------------------------------------------------------Indexes 1992=100
2005
I
II
III
IV
147.8
149.5
149.6
147.7
115.1
115.4
114.3
114.0
77.9
77.2
76.4
77.2
r167.6
r170.7
r172.3
r171.7
r124.9
r126.3
r125.5
r123.9
r113.4
r114.2
r115.2
r116.3
ANNUAL
148.7
114.7
77.2
r170.6
r125.1
r114.8
-------------------------------------------------------------------------------------------------Percent change from previous quarter at annual rate(5)
2005
I
II
III
IV
7.8
4.6
0.4
-5.1
4.0
0.9
-3.9
-0.8
-3.6
-3.5
-4.3
4.5
r-10.8
r7.5
r3.9
r-1.5
r-12.4
r4.5
r-2.2
r-5.3
r-17.3
r2.8
r3.4
r3.9
ANNUAL
4.9
2.0
-2.8
r1.6
r-1.6
r-3.1
-------------------------------------------------------------------------------------------------Percent change from corresponding quarter of previous year
2005
I
II
III
IV
6.8
6.3
5.0
1.8
3.8
3.0
1.4
0.0
-2.9
-3.1
-3.4
-1.8
r2.4
r2.8
r1.9
r-0.5
r-0.5
r-0.1
r-1.8
r-4.0
r-4.1
r-3.3
r-2.9
r-2.2
ANNUAL
4.9
2.0
-2.8
r1.6
r-1.6
r-3.1
------------------------------------------------------------------------------------------------Appendix table 6. Nonfinancial corporate sector: Revised productivity, hourly compensation,
unit labor costs, unit profits, and prices, seasonally adjusted
Output
Hourly
Real
Unit
Total
Unit
Implicit
Year
per allcompenhourly
Unit
nonunit
proprice
and
employee
Employee sation
compenlabor
labor
costs
fits
deflator
quarter
hour
Output hours
(1)
sation(2) costs
costs(6) (7)
(8)
(4)
---------------------------------------------------------------------------------------------------------Indexes 1992=100
2005
I
II
III
IV
r141.8
r143.7
r142.8
r144.8
r166.4
r169.9
r169.7
r173.2
r117.3
r118.2
r118.8
r119.7
r158.0
r158.6
r160.8
r161.2
r117.7
r117.3
r117.2
r116.3
r111.4
r110.4
r112.6
r111.4
r111.3
r111.4
r115.7
r113.1
r111.4
r110.6
r113.5
r111.8
r155.9
r166.8
r152.2
r177.4
r115.3
r115.7
r116.9
r117.7
ANNUAL
r143.3
r169.8
r118.5
r159.7
r117.1
r111.4
r112.9
r111.8
r163.2
116.4
---------------------------------------------------------------------------------------------------------Percent change from previous quarter at annual rate(5)
2005
I
II
III
IV
r3.0
r5.5
r-2.5
r5.6
r3.2
r8.7
r-0.5
r8.7
0.2
3.0
r2.0
3.0
r2.5
r1.7
r5.6
r1.0
r0.7
r-1.1
r-0.6
r-2.9
r-0.4
r-3.6
r8.4
r-4.3
r7.6
r0.1
r16.7
r-8.9
r1.7
r-2.6
r10.6
r-5.6
r23.6
r31.1
r-30.6
r84.3
4.0
r1.1
r4.4
r2.7
ANNUAL
r2.6
r4.3
1.7
r3.7
0.4
r1.1
r3.3
r1.7
r12.7
2.9
---------------------------------------------------------------------------------------------------------Percent change from corresponding quarter of previous year
2005
I
II
III
IV
r3.2
r3.4
r1.2
r2.8
r4.4
r5.1
r3.0
r4.9
1.1
1.7
1.7
2.1
4.7
r3.8
3.8
r2.7
r1.6
r0.9
0.0
r-1.0
r1.4
r0.4
r2.5
r-0.1
r1.6
r1.9
r6.2
r3.4
r1.5
r0.8
r3.5
r0.8
r15.3
r14.5
r1.3
r20.0
3.0
r2.4
3.2
r3.1
ANNUAL
r2.6
r4.3
1.7
r3.7
0.4
r1.1
r3.3
r1.7
r12.7
2.9
--------------------------------------------------------------------------------------------------------See footnotes following Table 6.
August 8, 2008
r=revised
Source: Bureau of Labor Statistics
© Copyright 2026 Paperzz