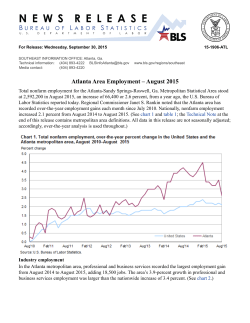
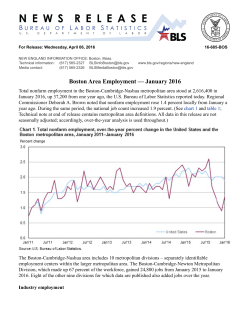
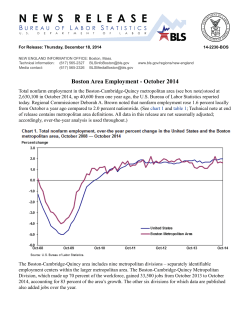
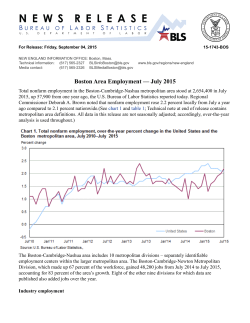
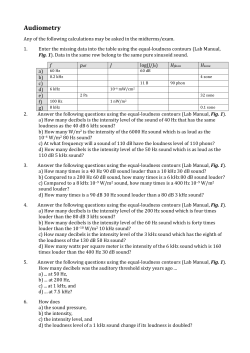
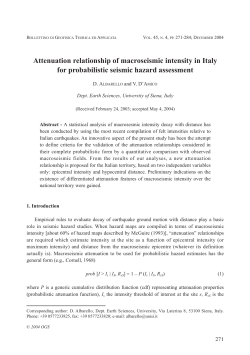
USDL-10-1391
For release 10:00 am (EDT) Wednesday, October 6, 2010
Technical information:
Media contact:
(202) 691-5606 • [email protected] • www.bls.gov/mfp
(202) 691-5902 • [email protected]
PRELIMINARY MULTIFACTOR PRODUCTIVITY TRENDS - 2009
Private nonfarm business sector multifactor productivity increased at a 0.7 percent annual rate in 2009, the U.S.
Bureau of Labor Statistics reported today. (See chart 1, table A.) This was the largest gain in multifactor
productivity since 2005. (See table 1.) Multifactor productivity measures the change in output per unit of
combined inputs of labor and capital. Multifactor productivity is designed to measure the joint influences on
economic growth of technological change, efficiency improvements, returns to scale, reallocation of resources,
and other factors, allowing for the effects of capital and labor. Multifactor productivity, therefore, differs from
labor productivity (output per hour worked) measures that are published quarterly by BLS since it includes
information on capital services and other data that are not available on a quarterly basis. Additionally, multifactor
productivity measures for the private business and private nonfarm business sectors account for shifts in the
composition of labor. Estimates of labor composition are not included in the quarterly labor productivity
measures.
The multifactor productivity gain in 2009 reflected a 3.6 percent decrease in output and a 4.3 percent decrease in
the combined inputs of capital and labor. Capital services grew by 1.2 percent, the slowest gain in the series
which began in 1987. Labor input fell 6.9 percent, the largest decline for the series which began in 1987.
Private business sector multifactor productivity grew 0.8 percent in 2009, the largest gain in multifactor
productivity since 2005. The multifactor productivity gain in 2009 reflected a 3.5 percent decline in output and a
4.2 percent decrease in the combined inputs of capital and labor.
Chart 1. Output per hour of all persons, multifactor productivity, and output per unit of capital services in the
private nonfarm business sector, 2000-2009
Annual percent change
6.0
4.0
2.0
0.0
-2.0
-4.0
-6.0
2000
2001
2002
Output per hour of all persons
2003
2004
2005
1Multifactor- productivity
2006
2007
2008
2009
Output per unit of capital services
Historical trends in private nonfarm business
Multifactor productivity in private nonfarm business grew 1.0 percent annually between 1987 (the starting point
of the series) and 2009. (See table A.) Output increased at a 2.9 percent annual rate over the period and combined
units of labor input and capital services rose an average of 1.9 percent per year. Output per hour (labor
productivity) grew 2.3 percent. For the 2007-2009 period, multifactor productivity in private nonfarm business
slowed, averaging 0.4 percent per year, a sharp decline from the 1.4 percent growth rate in the 2000-2007 period.
Historical trends in labor productivity growth can be viewed as the sum of three components: multifactor
productivity growth, the contribution of increased capital intensity, and the contribution of shifts in labor
composition. The relationship between labor productivity growth and these three components can be seen in table
B and chart 2. Chart 2 shows how, relative to output per hour, multifactor productivity and the contribution of
capital intensity shifted upward in the latter half of the 1990s. These contributions continued to be relatively high
over the 2000-2007 period. For 2007-2009, the contribution of capital intensity rose sharply compared to
previous periods.
Of the 2.3 percent growth rate in labor productivity for the 1987-2009 period, 1.0 percent can be attributed to
increases in multifactor productivity, 1.0 percent to the contribution of capital intensity, and 0.3 percent to
changes in labor composition. (See table B.)
The methodology for measuring preliminary multifactor productivity for 2009 is a simplified version of the
methodology that BLS uses when more detailed information is available. Data will be revised in mid-year 2011.
Chart 2. Percentage point contributions to growth in output per hour in the private nonfarm business sector,
1987-2009
3.0
Average annual percent change
0.4
2.5
0.2
1.3
2.0
1.0
1.5
1.0
0.3
0.5
0.4
0.5
0.5
1.4
0.2
0.2
2.2
0.5
1.2
1.0
0.6
0.6
1987-1990
1990-1995
1.0
0.0
1987-2009
Contribution of capital intensity
1995-2000
Contribution of labor composition
2000-2007
2007-2009
Multifactor productivity
Multifactor productivity plus the contributions of capital intensity and labor composition may not sum to output per
hour due to independent rounding.
-2-
Table A. Compound annual growth rates for productivity, output, and inputs in the private nonfarm
business and private business sectors for selected periods, 1987-2009
In percent
Private nonfarm business
1
19872009
19871990
19901995
19952000
20002007
20072009
20082009
1.0
0.5
0.5
1.3
1.4
0.4
2.3
-1.0
1.5
-0.4
1.6
-0.5
2.8
-1.1
2.7
-0.6
2.9
-3.8
0.7
3.8
-4.7
2.9
3.2
2.9
5.0
2.7
-1.9
-3.6
1.9
2.7
2.4
3.6
1.3
-2.3
-4.3
1.0
0.6
0.4
3.9
2.3
1.7
0.6
3.7
2.0
1.3
0.7
3.4
2.5
2.2
0.3
6.2
0.4
0.0
0.3
3.4
-4.3
-4.7
0.4
2.0
-6.9
-7.1
0.3
1.2
3.3
1.9
2.0
3.9
3.4
7.0
9.0
1.0
0.6
0.4
1.5
1.5
0.4
2.4
-0.8
1.6
-0.4
1.5
-0.3
2.9
-0.9
2.7
-0.5
2.9
-3.6
0.8
3.8
-4.5
2.9
3.2
2.9
5.0
2.7
-1.8
-3.5
1.9
2.6
2.4
3.4
1.2
-2.2
-4.2
1.0
0.5
0.5
2.1
1.6
0.6
2.0
1.3
0.7
2.3
2.0
0.3
0.3
0.0
0.3
-4.2
-4.6
0.4
3.8
3.6
3.2
6.0
3.3
1.9
-6.8
-7.0
0.2
1.1
3.2
2.0
1.8
3.9
3.3
6.8
8.8
Productivity
2
Multifactor Productivity
Output per hour of all persons
Output per unit of capital services
Output
Inputs
3
Combined inputs
4
Labor Input
Hours
5
Labor composition
Capital services
Analytic ratio
Capital services per hour of all
persons
Private business
1
Productivity
2
Multifactor Productivity
Output per hour of all persons
Output per unit of capital services
Output
Inputs
3
Combined inputs
4
Labor Input
Hours
5
Labor composition
Capital services
Analytic ratio
Capital services per hour of all
persons
1 Excludes government enterprises.
2 Output per unit of combined labor input and capital services.
3 The growth rate of each input is weighted by its share of nominal costs.
4 Index of hours at work; hours at work by age, education, and gender group are weighted by each group’s share of labor compensation.
5 Ratio of labor input to hours.
-3-
Table B. Compound annual growth rates in output per hour of all persons and the contribution of
capital intensity, labor composition, and multifactor productivity in the private nonfarm business and
private business sectors for selected periods, 1987-2009
In percent
19872009
19871990
19901995
19952000
20002007
20072009
20082009
2.3
1.5
1.6
2.8
2.7
2.9
3.8
Contribution of capital
2
intensity
1.0
0.6
0.6
1.2
1.0
2.2
2.8
Contribution of labor
3
composition
0.3
0.4
0.5
0.2
0.2
0.2
0.1
1.0
0.5
0.5
1.3
1.4
0.4
0.7
2.4
1.6
1.5
2.9
2.7
2.9
3.8
Contribution of capital
2
intensity
1.0
0.6
0.6
1.2
1.0
2.2
2.8
Contribution of labor
3
composition
0.3
0.4
0.5
0.2
0.2
0.3
0.1
1.0
0.6
0.4
1.5
1.5
0.4
0.8
Private nonfarm business
1
Output per hour of all persons
4
Multifactor productivity
Private business
1
Output per hour of all persons
4
Multifactor productivity
1 Excludes government enterprises.
2 Growth rate in capital services per hour multiplied by capital's share of current dollar costs.
3 Growth rate of labor composition (the growth rate of labor input less the growth rate of the hours of all persons)
multiplied by labor's share of current dollar costs.
4 Output per unit of combined labor input and capital services.
Multifactor productivity plus the contributions of capital intensity and labor composition may not sum to output per
hour due to independent rounding.
-4-
Technical Notes
The simplified methodology for preparing preliminary estimates of MFP is outlined in the June
2005 Monthly Labor Review article, “Preliminary estimates of multifactor productivity growth” located
at http://www.bls.gov/opub/mlr/2005/06/art3abs.htm. This methodology is applied to both the private
nonfarm business and private business sectors and measures are calculated only for the most recent year.
Data for all previous years are not different from the August 24, 2010 “Multifactor Productivity Trends”
news release (USDL-10-1171).
Capital Services: Capital services are the services derived from the stock of physical assets and
software. Capital services measures constructed for the preliminary MFP measures are based on less
detail only for the most recent year. The preliminary measures consist of eight asset types as opposed to
the 76 asset types included in estimates for all previous years. The assets included in the preliminary
estimates are computers, software, communications and other information processing equipment, other
fixed business equipment, structures, inventories, rental residences, and land. Investments, depreciation,
and capital income are estimated for each of these eight aggregates. Capital services are calculated by a
chained superlative Tornqvist index combining stocks of the eight asset categories, weighted by capital
income shares.
Labor Input: Labor input in private business and private nonfarm business is obtained by chained
superlative Tornqvist aggregation of the hours at work by all persons, classified by age, education, and
gender with weights determined by each group’s share of labor compensation. The preliminary
estimates of 2009 hours worked for the private nonfarm business and private business sectors are
extrapolated from the hours worked reported in the nonfarm business and business sectors, respectively,
in the June 3, 2010 “Productivity and Costs” news release (USDL-10-0747).
The labor composition index estimates the effect of shifts in the age, education, and gender
composition of the work force on the efficiency of hours worked. The preliminary MFP labor
composition measure estimates the number of hours worked by each type of worker based on Current
Population Survey (CPS) data. The estimate of the 2009 labor composition index assumes relative
wages across groups remain constant between 2008 and 2009.
Additional information concerning data sources and methods of measuring labor composition
can be found in Cindy Zoghi, 2007, “Measuring Labor Composition: A Comparison of Alternate
Methodologies” http://www.bls.gov/bls/fesacp1121407.pdf.
Combined Inputs: Labor input and capital services are combined using Tornqvist aggregation,
employing weights that represent each component's share of total costs. The Tornqvist index uses
changing weights; the share in each year is averaged with the preceding year's share. Total costs are
defined as the value of output less a portion of taxes on production and imports. Most taxes on
production and imports, such as excise taxes, are excluded from costs; however, property and motor
vehicle taxes remain in total costs.
-5-
Output: Private business sector output is a chain-type, current-weighted index constructed after
excluding from gross domestic product (GDP) the following outputs: general government, nonprofit
institutions, private households (including owner-occupied housing), and government enterprises. This
release presents data for the private business and private nonfarm business sectors. The private business
sector accounted for approximately 76 percent of gross domestic product in 2005. Additionally, the
private nonfarm business sector excludes farms from the private business sector, but includes
agricultural services. Multifactor measures exclude government enterprises, while the BLS quarterly
Productivity and Cost series include them. The output measures reflect the revised National Income and
Product Accounts (NIPA) data released by the Bureau of Labor Statistics (BEA) on July 31, 2009 but do
not reflect the revised data released by BEA on July 30, 2010. The preliminary estimates of 2009
output for the private nonfarm business and private business sectors are extrapolated from the output
reported in the nonfarm business and business sectors, respectively, in the June 3, 2010 “Productivity
and Costs” news release (USDL-10-0747).
Multifactor Productivity: Multifactor productivity measures describe the relationship between output
in real terms and the inputs involved in its production. They do not measure the specific contributions
of labor, capital, or any other factor of production. Rather, multifactor productivity is designed to
measure the joint influences of output, capital, and labor on economic growth of technological change,
efficiency improvements, returns to scale, reallocation of resources due to shifts in factor inputs across
industries, and other factors.
The multifactor productivity indexes for private business and private nonfarm business are derived
by dividing an output index by an index of labor input and capital services. The output indexes are
computed as chained superlative indexes (Fisher Ideal indexes) of components of real output.
-6-
1
Table 1. Private nonfarm business sector: productivity and related measures for the 1987-2009 period
Annual percent change from previous year
Productivity
Inputs
Capital
5
Services
Combined
units of
labor input
and
capital
6
services
Capital
services
per hour
of all
persons
3.5
3.3
3.7
3.9
3.5
3.5
0.8
1.1
1.4
-0.9
3.8
3.6
4.7
0.1
-1.1
1.0
3.3
4.1
3.4
2.9
2.5
3.2
3.7
1.0
0.0
1.5
3.3
4.0
3.8
5.5
2.7
0.3
0.1
0.0
1.4
0.6
1.5
1.6
3.3
4.4
5.1
5.2
5.6
2.7
2.2
4.0
2.4
2.6
4.5
4.9
5.5
6.6
7.1
3.2
3.0
4.5
3.6
3.9
1.7
3.0
1.9
4.3
4.7
-2.2
-3.9
-1.5
0.2
1.7
1.6
0.7
2.4
2.5
2.6
4.5
1.0
1.9
3.1
4.2
1.2
-1.6
-2.0
-0.4
1.2
6.8
5.1
3.5
2.9
2.4
2.8
0.3
-0.5
0.6
1.5
5.8
7.3
6.2
3.5
1.1
0.1
-0.2
-0.9
-2.8
-4.7
1.0
0.4
0.5
0.1
0.7
3.4
3.2
2.4
-0.2
-3.6
1.9
2.5
1.2
-1.7
-6.9
3.3
3.4
3.3
2.8
1.2
2.4
2.8
1.9
-0.3
-4.3
1.5
1.2
2.8
5.1
9.0
Year
Output
per hour
of all
persons
Output
per unit
of
capital
services
Multifactor
2
Productivity
1988
1989
1.7
0.8
0.9
-0.3
1.0
0.1
4.6
3.5
1990
1991
1992
1993
1994
1.9
1.7
4.0
0.7
1.1
-1.9
-3.6
1.3
0.4
0.9
0.4
-0.9
2.3
0.3
0.7
1995
1996
1997
1998
1999
0.5
2.6
1.5
3.0
3.3
-1.2
-0.4
-0.4
-1.2
-1.4
2000
2001
2002
2003
2004
3.4
3.1
4.7
3.7
2.8
2005
2006
2007
2008
2009
1.7
1.0
1.9
2.1
3.8
3
Output
Labor
4
Input
See footnotes following table 4.
Source: Bureau of Labor Statistics
-7-
1
Table 2. Private business sector: productivity and related measures for the 1987-2009 period
Annual percent change from previous year
Productivity
Inputs
Capital
5
Services
Combined
units of
labor input
and
capital
6
services
Capital
services
per hour
of all
persons
3.4
3.2
3.8
3.8
3.5
3.4
1.1
1.1
1.5
-0.8
4.0
3.3
4.9
-0.1
-1.0
1.0
3.1
4.5
3.1
2.7
2.3
3.1
3.6
0.9
0.1
1.4
3.1
4.2
3.8
5.2
2.5
0.4
-0.3
-0.3
1.7
0.8
1.5
1.8
2.9
4.6
5.2
5.1
5.6
2.7
2.0
3.9
2.3
2.4
4.4
4.6
5.3
6.4
6.9
3.2
2.8
4.4
3.5
3.7
1.6
3.0
1.9
4.3
4.7
-1.9
-3.8
-1.3
0.4
1.6
1.7
0.8
2.4
2.6
2.6
4.6
0.9
2.0
3.1
4.2
1.2
-1.8
-1.9
-0.5
1.1
6.6
5.0
3.4
2.8
2.5
2.8
0.2
-0.4
0.5
1.5
5.5
7.3
6.0
3.5
1.3
0.2
0.0
-0.8
-2.6
-4.5
1.0
0.5
0.5
0.1
0.8
3.4
3.1
2.3
0.0
-3.5
1.9
2.3
1.1
-1.5
-6.8
3.2
3.1
3.1
2.7
1.1
2.3
2.6
1.8
-0.1
-4.2
1.5
1.0
2.6
4.9
8.8
Year
Output
per hour
of all
persons
Output
per unit
of
capital
services
Multifactor
2
Productivity
1988
1989
1.6
1.0
0.5
-0.1
0.8
0.3
4.4
3.7
1990
1991
1992
1993
1994
2.2
1.6
4.2
0.6
0.9
-1.6
-3.4
1.6
0.3
1.2
0.7
-0.9
2.5
0.2
0.7
1995
1996
1997
1998
1999
0.1
2.9
1.7
3.0
3.5
-1.4
-0.1
-0.1
-1.2
-1.2
2000
2001
2002
2003
2004
3.5
3.2
4.6
3.9
2.9
2005
2006
2007
2008
2009
1.7
1.0
1.8
2.1
3.8
3
Output
Labor
4
Input
See footnotes following table 4.
Source: Bureau of Labor Statistics
-8-
1
Table 3. Private nonfarm business sector: indexes of productivity and related measures, 1987-2009
Indexes 2005=100
Productivity
Year
Output
per hour
of all
persons
Inputs
Output
per unit
of
capital
services
Multifactor
2
Productivity
Output
3
Labor
4
Input
Capital
5
Services
Combined
units of
labor input
and
capital
6
services
Capital
services
per hour
of all
persons
1987
1988
1989
66.1
67.2
67.7
113.6
114.6
114.2
82.1
83.0
83.0
54.2
56.7
58.7
75.6
78.3
80.9
47.7
49.4
51.4
66.0
68.3
70.7
58.2
58.6
59.3
1990
1991
1992
1993
1994
69.0
70.2
73.0
73.4
74.2
112.1
108.1
109.5
109.9
110.9
83.3
82.6
84.5
84.8
85.4
59.5
59.0
61.3
63.5
66.5
80.9
80.0
80.8
83.5
87.0
53.1
54.6
56.0
57.8
59.9
71.4
71.4
72.5
74.9
77.9
61.5
64.9
66.7
66.8
66.9
1995
1996
1997
1998
1999
74.6
76.5
77.6
80.0
82.6
109.6
109.1
108.7
107.3
105.9
85.4
86.5
87.1
88.4
89.9
68.6
71.7
75.3
79.3
83.7
89.3
91.3
94.9
97.2
99.8
62.6
65.7
69.3
73.9
79.1
80.4
82.8
86.5
89.7
93.2
68.1
70.1
71.4
74.5
78.0
2000
2001
2002
2003
2004
85.4
88.1
92.2
95.7
98.4
103.5
99.5
98.0
98.2
99.9
91.3
91.9
94.2
96.5
99.0
87.5
88.4
90.1
92.8
96.7
101.0
99.4
97.4
97.0
98.1
84.5
88.8
91.9
94.5
96.8
95.8
96.1
95.7
96.2
97.7
82.5
88.6
94.1
97.4
98.5
2005
2006
2007
2008
2009
100.0
101.0
102.9
105.0
109.0
100.0
99.8
98.9
96.1
91.6
100.0
100.4
100.9
101.0
101.7
100.0
103.2
105.6
105.5
101.6
100.0
102.5
103.7
101.9
94.9
100.0
103.4
106.8
109.7
111.0
100.0
102.8
104.7
104.4
100.0
100.0
101.2
104.0
109.3
119.1
See footnotes following table 4.
Source: Bureau of Labor Statistics
-9-
1
Table 4. Private business sector: indexes of productivity and related measures, 1987-2009
Indexes 2005=100
Productivity
Year
Output
per hour
of all
persons
Inputs
Output
per unit
of
capital
services
Multifactor
2
Productivity
Output
Labor
4
Input
3
Capital
5
Services
Combined
units of
labor input
and
capital
6
services
Capital
services
per hour
of all
persons
1987
1988
1989
65.2
66.3
67.0
111.0
111.6
111.5
81.1
81.8
82.0
54.1
56.5
58.6
76.5
79.0
81.6
48.8
50.6
52.5
66.7
69.0
71.4
58.8
59.4
60.1
1990
1991
1992
1993
1994
68.4
69.5
72.5
72.9
73.6
109.7
106.0
107.8
108.0
109.4
82.6
81.8
83.9
84.1
84.7
59.5
59.0
61.4
63.4
66.5
81.5
80.7
81.5
84.0
87.8
54.2
55.6
56.9
58.7
60.8
72.0
72.1
73.1
75.4
78.6
62.3
65.6
67.2
67.5
67.3
1995
1996
1997
1998
1999
73.7
75.8
77.1
79.5
82.3
107.8
107.8
107.6
106.4
105.2
84.4
85.9
86.6
87.9
89.5
68.5
71.6
75.3
79.2
83.6
90.1
91.9
95.5
97.7
100.0
63.5
66.4
70.0
74.4
79.5
81.1
83.4
87.0
90.1
93.4
68.3
70.3
71.7
74.7
78.2
2000
2001
2002
2003
2004
85.2
87.9
91.9
95.5
98.3
103.1
99.2
97.8
98.2
99.8
91.0
91.7
93.9
96.4
99.0
87.4
88.2
90.0
92.8
96.7
101.2
99.5
97.5
97.1
98.1
84.8
89.0
92.0
94.5
96.9
96.0
96.2
95.8
96.2
97.7
82.6
88.6
94.0
97.3
98.5
2005
2006
2007
2008
2009
100.0
101.0
102.9
105.0
109.0
100.0
100.0
99.3
96.7
92.3
100.0
100.5
101.0
101.1
101.9
100.0
103.1
105.5
105.4
101.7
100.0
102.3
103.5
102.0
95.0
100.0
103.1
106.2
109.1
110.3
100.0
102.6
104.4
104.3
99.9
100.0
101.0
103.6
108.7
118.2
See footnotes following table 4.
Source: Bureau of Labor Statistics
- 10 -
Footnotes, Tables 1-4
Source: BLS develops productivity measures using output data published by the Bureau of Economic Analysis
(BEA), compensation and hours data published by other Bureau of Labor Statistics (BLS) programs, and capital
data supplied by BEA and U.S. Department of Agriculture. Also see Technical Notes in this release.
(1) The private business sector includes all of gross domestic product except the output of
general government, government enterprises, non-profit institutions, the rental
value of owner-occupied real estate, and the output of paid employees of private households. The private
nonfarm business sector also excludes farms but includes agricultural services.
(2) Output per unit of combined labor input and capital services.
(3) Gross domestic product originating in the sector, superlative chained index.
(4) Index of hours at work of all persons including employees, proprietors, and unpaid family
workers, classified by age, education, and gender. This superlative chain
index is computed by combining changes in the hours of each age, education, and gender group
weighted by each group’s share of labor compensation.
(5) A measure of the flow of capital services used in the sector. Capital services are the services
derived from the stock of physical assets and software. The assets included are fixed business
equipment, structures, inventories, and land.
(6) Labor input combined with capital services are weighted with labor's and capital's share of
current dollar costs to form a superlative chained index.
- 11 -
© Copyright 2026 Paperzz