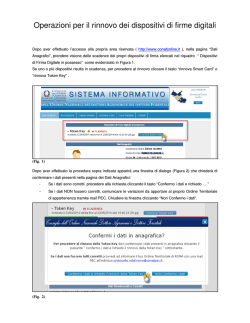
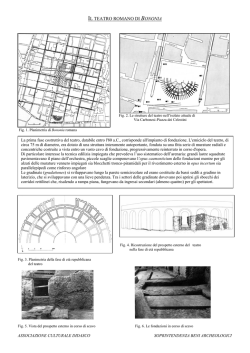
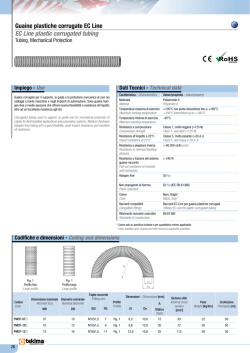
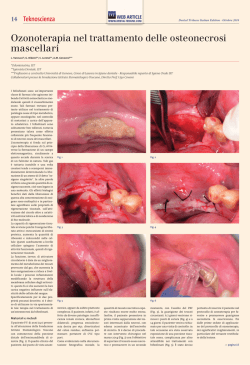
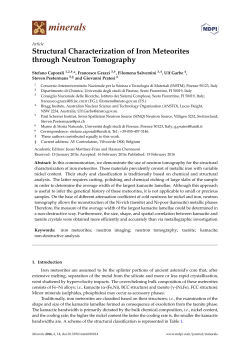
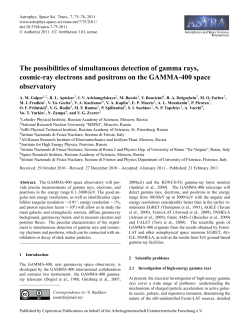
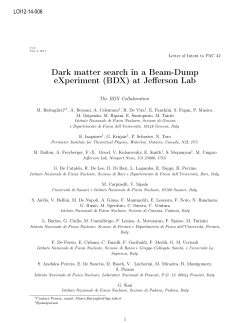
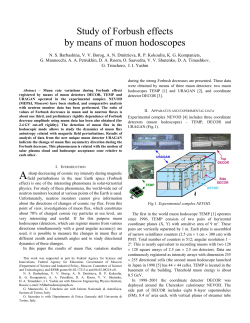
Performances of a large area scanning system for elemental analysis with tagged 14 MeV neutron beams G.Nebbia1, M.Lunardon1, S.Pesente1, G.Viesti1 , M.Barbui2, M.Cinausero2,E.Fioretto2, G.Prete2, A.Pantaleo3, G.D’Erasmo3, M.Palomba3, V.Filippini4 1 Dipartimento di Fisica and INFN Sezione di Padova, 2 INFN, Laboratori Nazionali di Legnaro, 3 Dipartimento di Fisica and INFN Sezione di Bari, 4 INFN Sezione di Pavia I. INTRODUCTION The inelastic scattering of neutrons is an efficient tool in several applications, the detection of hidden explosives [1] is achieved by determining the elemental ratio of C, N, O contained in common explosive materials employing well known gamma-ray spectroscopy techniques. Moreover, this technique has been proposed to determine the content of unexploded ordnance (UXO) in which high explosive material has to be discriminated from chemical warfare agents or other fillings [2]. Several medical applications as well have been recently presented [3,4]. A peculiar feature of the present project is the use of tagged neutron beams : a linear array of alpha detectors is used to define 10 independent neutron beams that are exploring simultaneously 10 pixels, each of them having a surface of 10 x 10 cm2. Each pixel is viewed by an independent gamma-ray detector operated in coincidence with the alpha paticle array. The coincidence between alpha particles and gamma-rays is known to be very effective for background reduction. Furthermore, the measure of the coincidence time opens the possibility to determine the position of the unknown object from the neutron time-of-flight and to subtract on-line the background. performed by using the associated particle technique (APT) , i.e. by detecting the alpha particle emitted in coincidence with neutrons. Fig.1 Schematic view of the sensor. II. EXPERIMENTAL SETUP Fast neutron based techniques imply the use of electronic neutron sources as small portable accelerators with a significant increase in cost and complexity with respect to the use of simple radioactive sources. Moreover, fast neutron are supposed to produce a strong background because they interact not only with the sensor parts, but also with the surrounding materials and with all nuclei contained in the soil. The reduction of the background is therefore a key point in the practical use of fast neutrons in order to counterbalance the increased price and complexity of the technique. In this respect, a specific characteristic of our project is the use of several tagged neutron beams in order to define with the maximum possible accuracy the inspected area and distinguish the signals here produced from those originating from the surrounding background . Tagging of 14 MeV neutrons produced in the D+T reaction is A spherical 1 mm thick, 37 cm diameter stainless steel scattering chamber has been installed at a dedicated beam line of the 7 MV VdG accelerator in Legnaro (Italy). In the reaction chamber a 2 MeV D beam is first defined by an entrance collimator, then degraded in energy down to 200 keV. A second 3 mm diameter collimator defines the final beam spot on the target. The neutron production target is a T-Ti disc 8 µm thick deposited on a copper support 2mm thick and 2 cm in diameter. The target activity is 1.4 Ci. The temperature of the target can be monitored using a PT100 gauge. The tagging system has been realized by means of a Parallel Plate Avalanche Counter having total area of 10 x 100 mm2 mounted inside the reaction chamber at an azimuthal angle of 450 at 7 cm from the target. The PPAC anode is divided in 10 pads (10 x 10 mm2 each) with independent read out. This solution has been selected because PPAC are low cost detectors with practically no CP680, Application of Accelerators in Research and Industry: 17th Int'l. Conference, edited by J. L. Duggan and I. L. Morgan © 2003 American Institute of Physics 0-7354-0149-7/03/$20.00 487 radiation damage, they allow sub-nanosecond time resolutions and their count rate capability is very high. The PPAC is operated with isobutane at a pressure of 25 torr with an applied voltage of 860 Volts across a gap of 2 mm. The entrance window is an 8 µm kapton foil able to stop both the deuteron elastically scattered from the beam and the beta particles from T decay.. Finally the γ-ray array has been realized with 10 BaF2 detectors with a volume of about 500 cm3 each. The front-end electronics, made by standard NIM modules, allows to register fast coincidences between any alpha-gamma pairs and their coincidence time. Furthermore, simple home-made hardware pattern units are used to identify the PPAC pad and the gamma detector participating to each coincidence event. The γ-ray energy signals from the BaF2 detectors are also mixed in a linear fan-in fan-out circuit before the analog-to-digital conversion. Consequently, the coincidence event is defined by only 4 parameters: the PPAC pattern unit identifying the fired anode pad; the gamma-ray pattern unit identifying the BaF2 detector fired; the gamma-ray energy; the alphagamma coincidence time. Data are converted using a PCI card containing four 20 MHz flash-ADC and stored on the hard disk of the host PC. A schematic view of the setup is shown in fig. 1 determine with precision the position of the block, thanks to the solid angle variation. Typical results demonstrate the possibility of determining the position of the gamma-ray source with an uncertainty of about 1 cm. using the statistical errors obtained from a gaussian fit of the hit distribution as shown in fig. 2. The quoted uncertainty is obviously determined by the statistical significance of the hit distribution function, in this case it corresponds to the irradiation of the graphite sample for about 1000 seconds with the neutron yield of about 106 n/sec quoted above. Fig. 2. Position distribution III. RESULTS Test runs were performed using the energy degraded deuteron beam yielding a neutron flux of about 106 neutrons/second over 4π. In the following, the PPAC pads and the gamma-ray detectors will be indicated with αn and γn with n=1-10. In order to test the apparatus in its full configuration, a block of graphite of about 20x20x10 cm3 volume was positioned along the BaF2 array at about 10 cm below the detectors front faces at a distance of about 70 cm from the T -Ti target, laying on a box of soil with dimensions 100x100x70 cm3. To test the selectivity of the α-particle detection, a window on the coincidence peak was used to reduce the contribution of the random α−γ coincidences and a single tagged neutron beam was selected by setting a proper window on a specific pad in the PPAC pattern spectrum. Then the position of the graphite block was changed horizontally, along the gamma-ray detector direction, and vertically in small steps (2 cm). The yield of the 4.4 MeV gamma-ray was reconstructed as a function of the position of the graphite target. The obtained yield distribution is fully compatible with the expected 10 x 10 cm2 neutron beam size at the scanning plane. The position of the graphite block along the horizontal coordinate can then be determined in a coarse way looking at the combination of PPAC pad and gamma-ray detector that maximize the coincidence rate at 4.4 MeV γ-energy. Moreover, the gamma-ray yield of the 4.4 MeV transition in the different gamma-ray detectors as reconstructed without selection of a particular PPAC pad , allows to 488 The time resolution of the sensor has been studied by selecting only events in the 4.4 MeV peak given by the time of flight spectrum relative to one selected pair of alpha-gamma detectors. The overall time resolution obtained for such events, δt=3.5 ns [FWHM] as shown in fig 3, has been corrected for the spread due to the different neutron flight paths within the volume of the graphite block. The resolution corrected for such geometrical effect is δt=1.5 ns [FWHM], which implies a resolution in the vertical coordinate of about 5 cm. Fig. 3. Timing distribution Within the obtained uncertainties from the horizontal two dimensional position definition and the time-of-flight information (third dimension in space) one can determine the position of a given gamma-ray source or define the volume unit (about 10x10x5 cm3) under investigation thus improving the signal-to-background ratio. In order to obtain a quantitative estimate of such improvement we report in fig .4a the spectrum obtained from one BaF2 detector positioned above the graphite sample with the “loosest conditions” allowed by our electronic setup, i.e. with a wide coincidence requirement on any of the alpha counter (400 ns. wide gate), thus defining a neutron “strip” about 1 meter long , 10 cm. wide and with essentially no requirement on the third dimension. Fig. 5. Irradiation of different samples In fig. 4b is shown the same spectrum but in coincidence with the correlated alpha counter (10x10 cm2 horizontal definition of the neutron beam) and a narrow window on the time of flight spectrum (5 cm. in the third dimension of the neutron beam). Integration of the 4.4 MeV peak (and first escape) and comparison with a linearly fitted background, yields an improvement in the signal to background ratio of a factor 3.8 at this energy. A number of different samples were irradiated for a period of about 1000 seconds to demonstrate the capability of the system to identify various elements relevant to different possible applications. In fig. 5 are shown the spectra relative to irradiations of a sample of graphite, of an explosive simulant (about 2 Kg of melamine) and a bottle (1 liter) of H3PO4. The background has been subtracted by means of an equivalent irradiation time after removing the sample. One can see that the signature gamma-rays for a number of elements are identified, in particular the gamma ray groups from 12C (Eγ = 4.4 MeV), 14 N (Eγ = 2.3 MeV), 16O (Eγ = 3.85, 6.1 MeV) and 31P (Eγ = 2.23 MeV). It is interesting to verify the sensitivity of the system in the identification of a particular compound defining a fingerprint of the compound itself. From fig. 5 one can notice for example that the explosive simulant (melamine) can be characterized by the presence in the γ-ray spectrum of the 4.4 MeV line of carbon and the 2.3 MeV line of nitrogen. 489 A very simple way of analizing the spectrum is to define the product Pcn = Ic x In as the signature of the melamine sample, where Ic and In are the integrals of the 4.4 MeV and the 2.3 MeV peaks respectively. 1,5 1,3 Pcn Fig. 4. Graphite sample irradiation 1,1 0,9 0,7 1 2 3 4 5 detector number 6 7 8 Fig. 6. Pcn variation (see text) In fig. 6 is plotted the variation of Pcn as a function of γ-detector for the irradiation of the melamine sample positioned under detector γ4 on the soil box . As in the example of fig. 4 the two data sets have been taken without the request of strict conditions on the associated particle (triangles) and with the request of such conditions (squares). The values of Pcn have been normalized to unity for detector γ2 assuming that in this position the contribution to Pcn is mainly due to the soil. One can clearly see that in the first case the system is unable to detect the fingerprint of the melamine sample across the strip of soil analized by the gamma counters, while with the use of the associated particle conditions the presence of melamine is clearly identified in the proper location even with such a rough analysis. It is now useful to study the full capabilities of the system by exploiting its wide angular coverage of both the alpha and the gamma counters. For each pair of alfagamma detectors the results of the irradiation of different samples were analized as follows : a) all the γ-spectra taken in a background irradiation have been sliced in 200 KeV bins and normalized to each other thus creating a response function for each γ-detector. b) a sample has been positioned under detector γ4 and an irradiation has been started. c) every few seconds of irradiation a normalized spectrum has been created for each γ-detector and a normalized average of the spectra acquired by all the othe detectors has been subtracted. In a number of applications of the fast neutron analysis it would not be viable to have a separate background irradiation thus severely hindering the sensitivity of the method, where possible a background irradiation run would essentially double the inspection time. In fig. 8b the spectrum relative to the irradiation of a H3PO4 sample with backround subtracted from a separate run is compared with the spectrum (fig 8a) obtained with the average background subtracted online as described above. It can be seen that the subtraction of background online is essentially equivalent to the subtraction of the background from a separate dedicated run demonstrating the great advantage in the data treatement given by a wide angular segmented device. Fig. 8 - a (top) , b(bottom) see text CONCLUSIONS Fig. 7 - Online background subtraction The result of such procedure yields 10 spectra from which a normalized average background has been subtracted online from the adjacent detectors without need of a separate background irradiation. The result of the described procedure is shown for 8 detectors and for a sample of H3PO4 in fig. 7 where one can clearly see on the γ-4 spectrum the characteristic signatures of the sample (cfr fig 5) ; it is interesting to notice that the same signatures are present also in the spectra of γ5 and to some extent of γ3 , once again this feature can be used to determine the centroid of the sample position . 490 The Associated Particle Technique has been exploited with a large geometry of the system, it is possible to identify samples of particular elements in a “searching mode” subtracting the background dynamically during the irradiation. [1] G. Vourvopoulos in Chemistry and Industry, 1994, p. 297-300. [2] P. Bach, J.L. Ma, D. Froment, J.C. Jaureguy Nucl. Instr. and Meth. B 79, 1993, 605. [3] J.J Kehayas et al. , Appl. Radiat. Isot. , 49 (1998) 737 [4] J.J. Kehayas et al, Ann. NY Academy of Sciences 904 (2001) 140
© Copyright 2026 Paperzz