Control of calcium carbonate precipitation in anaerobic reactors
Emerentiana Petronella Adriana van Langerak
Proefschrift
ter verkrijging van de graad van doctor
op gezag van de rector magnificus
van de Landbouwuniversiteit Wageningen
Dr C M . Karssen,
in het openbaar te verdedigen
op dinsdag 3 november 1998
des namiddags te vier uur in de Aula.
I}.
The research as described in this thesis was financially supported by:
The Dutch Government (Novem grant 51270/2510)
Borculo Whey Products
Coop. Suiker Unie U.A.
DHV-Water B.V.
Haarman & Reimer, Bayer UK Ltd.
Industriewater Eerbeek B.V.
KNP-BT N.V.
Paques B.V.
Roermond Papier B.V.
ISBN 90-5485-923-7
Copyright" 1998,E.P.A. van Langerak, Veenendaal, TheNetherlands.
Allrightsreserved,nopartofthisbookmaybereproducedbyanyprocesswithoutwrittenpermission
from thepublisher.
BIBLIOTHEEK
LANDBOUWUNIVERSITEIT
WAGENINGEN
Abstract
Anaerobic treatment of waste waters with a high calcium content may lead to excessive
precipitation of calciumcarbonate. Sofar, noproper methodswereavailable topredict orreduce
the extent of precipitation in an anaerobic treatment system. Moreover, it also was not clear to
what extent precipitation in an anaerobic reactor can be tolerated because adequate knowledge
on the structure and quality of methanogenic sludges with high calcium carbonate content was
lacking. Inthisthesis, the feasibility of anaerobic treatment of waste waters with ahigh calcium
content was investigated.
Thedevelopment of high ash content anaerobic sludges was studied under varying conditionsof
biomass yield, precipitating quantities of CaC03 and particle size of the seed sludge. The
location of CaCOa precipitation, within the aggregates or in the bulk solution, appeared to be
an important factor determining the quality of highash content sludges. Precipitation inthebulk
solution isconsidered as favourable for thedevelopment of these sludges and can inexample be
stimulated by seeding with the smallest possible granules or by maintaining the phosphate
concentration as low as possible. Operating a reactor containing heavy sludge is often
problematical because the crystals will tend to agglomerate, resulting in cementation of the
sludge bed. This cementation can be retarded by decreasing the degree of pre-acidification.
Two different options can be distinguished to reduce the extent of calcium carbonate
precipitation in an anaerobic reactor. It was found that phosphate, in concentrations of 0.5 -5
mgP.1"1, can drastically reduce the quantity of calcium carbonate precipitation. Additives that
only inhibit the formation of calciteandnotthatof aragonite (e.g. iron) arenot suitable, because
in that case aragonite, of which the solubility is only slightly lower than of calcite, will
accumulate in the reactor. The second option is to remove calcium from the influent in a
crystallization reactor reusing the anaerobic effluent alkalinity.
The amount of calcium carbonate precipitation in an anaerobic reactor can be estimated with
equilibrium models asdeveloped inthisdissertation, whichtake into account kinetic factors that
influence the apparent solubility of calcium carbonate, being the influent composition, the
hydraulic retention time and the value of the crystallization rate constant.
In this dissertation, insights have been provided for the design and application of integrated
anaerobic-physical-chemical technologies which enable the control of the calcium carbonate
precipitation in the anaerobic treatment of waste water with a high calcium content, which
appear e.g. in the waste-paper and food processing industries.
Contents
General Introduction
Development of high ash content crushed methanogenic sludge
in UASB reactors
3
19
Impact of location of CaC0 3 precipitation on the development
of intact anaerobic sludge
37
Influence of phosphate and iron on the extent of calcium
carbonate precipitation during anaerobic digestion
55
5
Influent calcium removal by crystallization reusing
anaerobic effluent alkalinity
6
Phosphate removal and kinetics of CaC0 3 precipitation
in anaerobic reactors
83
Discussion and conclusions
93
Discussie en conclusies
71
101
Dankwoord
111
Curriculum Vitae
112
1 General introduction
General aim of the investigation - the aim of the investigation described in this
thesisistodevelopanintegrated anaerobic-physical-chemical technology enablingthe
control and optimum utilisation of the effects of inorganic precipitation in the
anaerobic treatment of waste waters with a high calcium concentration. As a result,
anaerobic waste water treatment can be the core technology in closed water circuits,
whicharecharacterized bylowuseoffresh water, duetowhichthesalt concentration
(including the calcium salt concentration) tends to increase.
Chapter1
Background; formulation of the problem
The biotechnological technique of anaerobic waste water treatment has become a very
successful technology during the last two decades.62,63 The phenomenon of the formation of
highly active and well settleable bacterial aggregates, granular sludge, in upflow anaerobic
sludge blanket (UASB) reactors contributed to a major extent to the success of anaerobic
treatment techniques. A lot of research was carried out in elucidating the mechanisms of
growth of anaerobic granular sludge and in characterization of these aggregates.2-3-4-22-28
Amongst a variety of other factors, it was found that influent calcium concentrations up to
150 mgCa2+T' promote granulation27'31'34'4849,66 and also that calcium improves the stability
of the granular sludge formed.33 However, many waste waters contain much higher calcium
concentrations, even up to 2.500 mgCa2+T'.25,53,58,59 This may lead to an excessive
precipitation of calcium carbonate and/or calcium phosphate in an anaerobic reactor, or
particularly in the sludge aggregates. Precipitation is often found to result in undesirable
situations, suchasthe formation ofatooheavy sludge, lossof specific methanogenic activity
of the sludge due to scaling-in of biomass, nutrient deficiency, clogging of discharge pipes
and/or scaling in the aerobic post-treatment SyStem.8'13'25'38,51,57,58,64
Waste waters with high calcium concentrations for instance prevail in the waste paper
processing industry.37,38,50The chemical oxygen demand (COD) of the process water ofthese
industries mainly consists of starch. During the waste paper processing, the starch is
converted into glucose, which is rapidly further converted into volatile fatty acids by
acidifying bacteria. Anotherimportantcomponentofwastepaper iscalciumcarbonate, which
is used as a filler in the paper. During the waste paper processing, a high calcium process
water is generated as a result of the following reaction:38
2 CH3COOH + CaC0 3
-*
2 CH3COO- + Ca2+ + H 2 0 + C0 2 t
(1)
Many efforts were made during the last decade to lower the use of fresh water in industrial
processes. In some paper factories, this even resulted in a zero discharge of waste water,
consequently in a closed water circuit.50 In this case, accumulation of calcium will occur in
the process water, which might result in scaling problems. Moreover, accumulation of the
fatty acids will occur (eq. 1), which causes serious odour problems.37 These problems can
be overcome by applying in-line biological treatment of the process water, e.g. anaerobic
treatment.38 During anaerobic treatment of the process water, the volatile fatty acids are
Introduction
converted intomethane and carbon dioxide. Theproduced carbon dioxide can react with the
calcium, resulting in undesirable precipitation of calcium carbonate inthe anaerobic reactor
and/or in the aerobic post-treatment system.37,38 For a proper design and operation of such
in-line anaerobic treatment systems, adequate knowledge regarding the calcium scaling
potential is required.50
Highconcentrations ofcalcium and/orphosphatealsooccur inthewastewaterof citric-acid-,
whey-, sugar- and olive-oil factories,25,39,53 as well as in leachates from landfills. Especially
leachates from young landfills are suitable for anaerobic treatment because of their high
concentrationof volatilefatty acids.However, seriousprecipitationof calciumandothersalts
will occur.51'57-58,59 Waste waters with a high calcium content also arise when waste waters
are neutralized with lime, which is the cheapest neutralizing agent.65,89
For all above mentioned waste waters, it is of great importance to develop methods which
allow thecontrol orprevention ofprecipitation. Incase scalingproblems cannotbe avoided,
theuseof anaerobic treatment techniques wouldbe impeded and asaresult alsolessprogress
would be made to reduce water use. Up to now, no proper methods were available to
calculate the amount of precipitation in an anaerobic treatment system. Moreover,
fundamental knowledge onthe structure andquality of high ashcontent methanogenic sludge
was lacking. This lack of knowledge hinders the implementation and application of
sustainable anaerobic technologies for treatment of high calcium waste waters. Inthisthesis,
the feasibility of anaerobic treatment of waste waters with a high calcium content was
studied. For this, we focused on the development of a sustainable integrated physicalchemical-biological treatment system. The insights from this research might also lead to
applications in other fields where calcium deposition occurs, e.g. in oil production21,95 or
phosphate removal from municipal waste waters.67
The phenomenon of calcium precipitation during anaerobic treatment
Qualityof high ash content sludge
A high contents of calcium in the influent of an anaerobic reactor can lead to excessive
precipitation of calcium carbonate and this may result in severe problems such as i) scaling
of reactor walls and effluent pipes, ii) loss of buffer capacity, Hi) decreasing efficiency due
to sludge washout, iv) loss of specific methanogenic activity and vj space occupation by
inorganic precipitates.25,57,58 But also positive effects due to the presence of high calcium
Chapter 1
concentrations were reported. Jordening et a/.53 found a distinct improvement of biomass
retention in anaerobic fluidized bed reactors due to the presence of calcium concentrations
up to 2.5 gCa 2+ .l'.
The amount of CaC0 3 precipitation, the biomass yield and the location where the CaC03
precipitates are important parameters determining the development and quality of anaerobic
sludge. Theamount ofprecipitation strongly dependsonthewastewater composition andthe
conversions that take place.89 The biomass yield depends on the amount of COD degraded
and the yield coefficient (gVSS.gCOD'), which varies for different types of COD.52 The
accumulation of biomass compared to the accumulation of calcium carbonate determines the
ash content of the sludge at steady state conditions. Ash contents below 60% are considered
to be favourable for anaerobic sludge.65 For sludges with a higher ash content, serious
decreases of methanogenic activity were reported.25-58
Excepttheamount of CaC0 3precipitation andbiomassyield, particularly the structure ofthe
sludge aggregates needs to be considered with respect to its quality. This structure of the
sludge is strongly influenced by the location of calcium carbonate deposition. Precipitation
can take place in the bulk solution and/or in the biofilm. Precipitation in the bulk solution
is governed by the composition of the bulk liquid medium, which in UASB reactors varies
over theheight of the reactor, especially whenalow upflow velocity isapplied.10In casethe
formed precipitates rinse out of the reactor, harmful effects on the sludge structure and
quality are unlikely. Incase the formed precipitates are retained inthe reactor, new biofilms
can develop on their surface.51 On the other hand, also agglomeration of the formed
precipitates can take place, which may lead to channelling and clogging problems.25
Precipitation within the biofilm occurs when the micro-environment in the biofilm is more
favourable for precipitation than the environment in the bulk solution.5 Within anaerobic
biofilms, acetic acid is converted in the more weak carbonic acid, leading to elevated pH
conditions.7-26 This increased biofilm pH may initiate calcium carbonate precipitation in the
film.5 As in large granules the core is often depleted from substrate, and therefore does not
contribute to the digestion process3, calcium carbonate precipitation will mainly proceed in
the active outer layer of a granule. In case the core of a granule is not depleted from
substrate, deposition of precipitates towards the core of a granule is expected, as was
observed by Uemura and Harada.93
Introduction
Extentof calciumcarbonateprecipitation duringanaerobic treatment
One of the important parameters determining the feasibility of anaerobic treatment for high
calcium waste waters is the amount of CaC03 that can precipitate. The quantity of calcium
carbonate that will precipitate in the anaerobic reactor is preliminary dictated by the
concentrations of calcium and carbonate, which depend on a variety of factors, such as the
wastewatercomposition (typeof substrate, alkalinity) andtheconversionreactions occurring
in the system.90 During this thesis, a chemical equilibrium model was developed which
enables the calculation of the quantity of calcium carbonate tobe expected during anaerobic
treatment. Detailed information is provided in chapters 4, 5 and 6. The theory beyond the
modelcanbesummarized asfollows. Intheanaerobicdegradation, thebiodegradableorganic
compounds as present in the influent are converted into the completely reduced form of
carbon, which is methane (CH4; oxidation state C -4), and the completely oxidized form of
carbon, which is carbon dioxide (C0 2 , oxidation state C +4). The TOC/COD ratio (total
organic carbon and chemical oxygen demand) is a measure of the state of oxidation of a
substrate.90 Table 1 gives the TOC/COD ratios of several substrates that are often
encountered in waste waters.
Table 1. Molecular mass, TOC,CODand stateofoxidation ofcarbon for various substrates
Molecular
mass
Structural
formula
Oxidation
state C
TOC
(g.l-1)
COD
(g.l 1 )
TOC/COD
Formic acid
46
CHOOH
+2
0.261
0.35
0.75
Acetic acid
60
CHjCOOH
0
0.4
1.067
0.375
Propionic acid
74
C2H5COOH
-0.667
0.486
1.514
0.321
Lactic acid
90
C3H603
0
0.4
1.067
0.375
Butyric acid
88
C3H7COOH
-1
0.545
1.818
0.30
Glucose
180
C6H1206
0
0.4
1.067
0.375
Citric acid
192
C6H807
+1
0.375
0.75
0.5
After the TOC/COD ratio of asubstrate hasbeen determined, the quantities of CH4and C0 2
formed per gram of COD can be calculated as follows (provided that no growth occurs or
other electron acceptors are present)90:
CH4 (mol.l1) = COD(g. l')/64
CO, (mol.l') = {(16/3 *TOC/COD) -1} * {COD/64}
Chapter 1
In order to calculate the amount of precipitation during anaerobic digestion, the solubility
product of calcium carbonate needs to be known, which was often found to differ several
orders of magnitude from the theoretical value.67,90,91 The reason for thisdiscrepancy willbe
explained below.
Calcium carbonate: thermodynamics, kinetics and the role of additives
Thermodynamics
Calcium carbonate occurs in various polymorphs.11 These are, in order of increasing
solubility, calcite, aragonite, vaterite and amorphous calcium carbonates. The solubility
products of calcite, aragonite and vaterite are 10'84, 10"82and 10"79, respectively, at 30°C
andthe solubility decreases athigher temperatures.77 Various amorphous calcium carbonates
are described in literature, such as amorphous calcium carbonate and calcium carbonate
monohydrate with solubility products of 10"65 and 10"72 , respectively, at 30°C.9,61 Under
normal conditions, calcite is the thermodynamically stable form, but at a high degree of
supersaturation other, less stable polymorphs will form initially, which will subsequently
ripen to form calcite.55,74,75,84
During waste water treatment, far less calcium carbonate precipitation usually takes place
than is expected based on thermodynamic equilibrium67,71,90,91 because thermodynamic
equilibrium often does not establish. The reason for this is that the kinetics of the
precipitation process plays an important role and therefore need to be considered as well.
Kineticsof CaC03precipitation
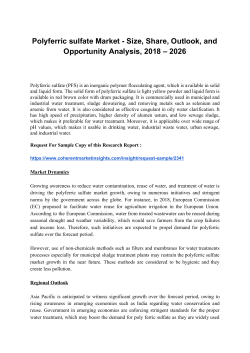
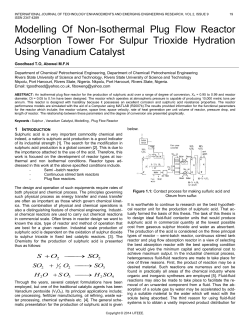
Three main processes can be distinguished in the formation of a solid phase from a
supersaturated solution, namely nucleation, crystallization and ripening (Fig. l).71-87-88
Nucleation,or "precipitation" occurs asaresultofthe interactionbetween ionsormolecules,
and it leadstothe formation of a critical nucleus. Thenucleation process determines thesize
of the crystals formed. In an unstable, highly supersaturated solution, nuclei can appear
spontaneously (this is also called "homogeneous nucleation"). When nuclei are formed on
existing particles, the term "heterogeneous nucleation" is used. Because the formation of
precipitates on an existing surface requires less energy, heterogeneous nucleation can occur
at a lower degree of supersaturation than homogeneous nucleation. For detailed theoretical
information on kinetics of nucleation, the concerning literature can be consulted.29,30,44,88,96,97
Introduction
Labile supersaturated solution
Metastable
supersaturated solution
Surface
heterogeneous
4-
Nucleation
homogeneous
"Seededgrowth"
4-
Nuclei/precipitates
Seed crystals
Crystalgrowth
TV
Crystallites
Oswald ripening
\r
1 Crystal
Coagulation
SS
Figure 1. Simplified diagram oftheprocesses involved insolidphase formation of
calciumcarbonate.sss=supersaturatedsolution,ss=saturatedsolution(adaptedfrom:
NancollasandReddy71).
Crystal growth can occur on existing nuclei or added seed crystals. The kinetics of crystal
growth are usually studied in a metastable, supersaturated solution.56 In sucha solution, the
degree of supersaturation is such low that nucleation is supposed not to occur, but it is
sufficiently high for crystal growth after the addition of seed crystals.
Oneof the primary factors controlling the reaction rate isthe degree of disequilibrium. The
saturation state, a, can, in the case of calcium carbonate, be defined as (Ca2+)(C032) /
KspCaC03. The distance from equilibrium is usually defined as the difference between a and
1. The general observation is that the rate of precipitation increases with increasing
disequilibrium.69 At different extents of disequilibrium, different mechanisms determine the
reaction kinetics. Generally, surface reactions (e.g. diffusion within the hydrated adsorption
layer; adsorption at a step; migration along a step; integration at a kink site on the step or
dehydration of ions) aremost important near equilibrium, whiletransport control of reaction
rates is more important at increasing disequilibrium. In the latter case, possible rate
determining stepsaretransport of lattice ionstothesurface byconvection; transport oflattice
ions to the crystal surface by diffusion through the solution or adsorption of the reactant at
the solid/liquid interface.
Chapter 1
The crystallization rate can be represented in terms of the general kinetics equation:7
Rate = k.s.a"
(2)
in which k is the rate constant for crystal growth, s is proportional to the total number of
available growth sites on the added seed crystals6, a is the degree of supersaturation and n
is the effective order of the reaction.
At a high degree of disequilibrium, reaction rates are likely to be controlled by transport
limitation and would be described by a simple first-order equation with n = l in equation 2.
At n=2, the so called "parabolic rate law" is obtained, which was popularized by the BCF
(Burton, Cabrera and Frank12) theory of crystal growth at screw dislocations, also known as
the spiral growth mechanism. The BCF model is a rather simplistic, but yet convenient,
method ofpicturing surfaces of solids. Ittreats thesolid asbeing madeof "blocksof matter".
The lowest energy sites would be in the interior of a crystal, which has no defects. All six
faces of a block would bebonded to adjacent blocks. On aperfect infinite surface, one face
of a block would be exposed and only five faces can be bonded to adjacent blocks. Blocks
along the edge would have two faces exposed, while those on the corners have three faces
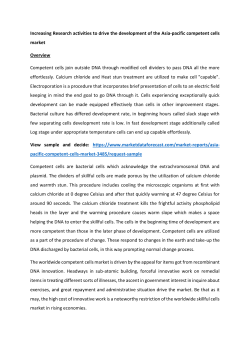
exposed. The BCF model is important to introduce the idea of steps on surfaces and kinks
within the steps (Fig. 2). Because these sites have more exposure than normal surface sites,
they are favoured for reaction by attachment, detachment or adsorption of foreign ions.
Surface Nucleus _ ,
Figure2. Schematicpresentation ofcrystalsurface inBCFmodelshowingadsorbed
ions inblack.69
Introduction
Theparabolic rate law states that if c istheconcentration of the dissolved mineral in solution
and csis the solubility, then (1) growth units enter at surface kinks with a rate proportional
to c-cs, and (2) the kink density varies in proportion to c-cs. This leads to a growth rate
dependence of (c-cj2 which is represented by the a2term as seen in equation 2.76
The BCF growth theory and the accompanying parabolic rate law were developed for
describing near-equilibrium gas-phase crystal growth.12 However, it also has been used to
explain a great deal of crystal growth data outside the range of conditions for which the
model originally was intended. The parabolic rate law appears to be a popular explanation
of calcite growth kinetics and it often was found to fit well to obtained experimental
data.1416,35,60 However, it should be applied cautiously because it gives a good fit to almost
any initial rate experiment.24
While the nonlinear behaviour of growth rate with increasing saturation state is frequently
described by the parabolic rate law, recent observations by scanning force microscopy
suggest that much of this behaviour can be attributed to the nonlinear rates associated with
early-stage surface nucleation.24 The ideathatcalcitegrowthbegins with asurface nucleation
stepisnotnew. In 1971, Nancollas andReddy70already claimed theformation of surface and
bulk nuclei, which they address toas "secondary nucleation". For processes that are surface
nucleation controlled, the exponential rate laws are equivalent to equation 2 with n > 2 .
As a result of the ripeningprocess, larger crystals are formed. Finely divided solids havea
higher solubility than largecrystals. Asaconsequence, small crystals are fhermodynamically
less stable and tend to recrystallize into large ones.8788
Additives
It is a well-known phenomenon that additives are capable of altering the surface properties
of crystals, which leads to changes in nucleation, growth and ripening kinetics. Thereby,
changes occur in the shape of crystals as well as in their agglomeration and dispersion
behaviour. The effects of additives are generally directly or indirectly related to the
adsorption of the additive on the crystal or nucleus surface.
Poisoning of crystal nucleation or growth plays afundamental role in calcite growth andhas
a broad impact. In nature, organically-secreted chemicals regulate carbonate
Chapter 1
biomineralization. Organisms are capable of creating astonishing regulated skeletons of
calcium precipitates, because they are able to control the kinetics of nucleation and crystal
growth perfectly.8898 In industry, phosphate based poisons are often used to control scaling
in pipes, heat exchangers and desalination facilities'8'78,81 whereas polyelektrolytes may be
used in soda-based detergents to prevent calcium carbonate encrustation on laundry.93
Many waste water constituents are known to inhibit the kinetics of calcium carbonate
formation.79 Phosphates and phosphonates are well known inhibitors and have been
thoroughly studied.24'32'42'46,68'78'79'82Otherexamples of inhibitors of calcium carbonate crystal
growth are the anions sulphate and arsenate; the cations iron, copper, zinc, cadmium and
magnesium and the organic additives citrate, nucleic acid and humic acid.17'20'3643-68,79,83
Several mechanisms of crystal growth inhibition by additives were proposed in literature,
including inhibition of nucleation,46 adsorption onto growth sites,68changes insurface charge
and kinetic frustration of cation dewatering.80
Phosphate
Phosphate isan important nutrient for anaerobic microorganisms, it isawell known inhibitor
of calcium carbonate growth anditisalsocapableto(co)precipitate withcalcium. Moreover,
it is a chemical which should not be discharged into surface waters, because it stimulates
eutrophication. Therefore, it is an important compound to be considered when studying the
feasibility of anaerobic treatment of waste waters with a high calcium content. The fate of
phosphate in an anaerobic reactor treating waste waters with a high calcium content is
determined bythreeprocessesthatoccurduringtheanaerobic degradationprocess: biological
assimilation, coprecipitation of phosphate with calcite and/or precipitation of calcium
phosphates.
P-removalby biologicalassimilationor coprecipitation
Anaerobic, non-P-limited biomass contains 6-15 mgP.gVSS"1.2-85 Assuming a yield for
anaerobic microorganisms of 0.02-0.05 g.g"1,52 approximately 0.08-0.54 mgP will be
removed from theliquid phaseper gram of converted COD. Chemical removal of phosphate
by precipitation and/or coprecipitation in the sludge may contribute to a further phosphate
removal. Coprecipitation iscausedby interaction betweendissolved phosphateandthecalcite
surface duringcrystal growth ofcalcite, followed bythe incorporation ofpartofthe adsorbed
phosphate into the crystal lattice.2045 The quantity of phosphate that can coprecipitate was
10
Introduction
supposed to be dependent on the rate of calcite growth and the rate at which phosphate is
adsorbed onto the growing crystals.4145 It was recently shown that adsorption of phosphate
ions increases with the increase in calcium ion concentration in solution, indicating that
phosphateadsorbs onthecalciumcarbonate surface accompanying Ca2+.84Innaturalwaters,
coprecipitation of phosphate withcalcitehighly contributes tophosphate removal, preventing
excessive eutrophication.i923404147
Calciumphosphateprecipitation
The Ostwald step rule, or the rule of stages, postulates that the precipitate with the highest
solubility (i.e. the least stable solid phase) will form first in a consecutive precipitation
reaction. The least stable phase, often an amorphous solid phase, nucleates first because its
nucleation rate exceeds that of the more stable phase. In case of calcium phosphates, the
polymorphs, amorphous calcium phosphate (ACP), dicalciumphosphate (DCP),
octacalciumphosphate (OCP)andhydroxyapatite(HAP)canbedistinguished,73ofwhichHAP
is the thermodynamically most stable phase.1554 Generally, amorphous calcium phosphate
precipitates first and then recrystallises, eventually via DCP and/or OCP to form
hydroxyapatite (HAP; Ca5(P04)3OH).1 Several additives can inhibit or even hinder the final
formation of HAP, such as carbonate, magnesium, P 2 0 7 and citric acid.72 Which calcium
phosphate precursor will be formed depends, amongst others, on the pH and the degree of
supersaturation.73,92 For pH values between 7 and 10, ACP is a reasonably well defined
compound, with a Ca/P ratio between 1.45 and 1.51.15,86
Scope of the thesis
Upto now, noproper methods were available topredict or reducethe extent of precipitation
in an anaerobic treatment system. Moreover, it was not clear inhow far precipitation in the
anaerobic reactor can be tolerated because fundamental knowledge on the structure and
quality of highashcontent methanogenic sludgewaslacking. This lackof knowledgehinders
theimplementation andproper application of sustainableanaerobictechnologies for treatment
of high calcium waste waters. Such waters are expected to become much more abundant in
the near future as aresult of the attempts made inindustries toreducetheuseof fresh water.
This leads to more concentrated process- and waste waters. Therefore, in this dissertation,
the feasibility of anaerobic treatment of waste waters with a high calcium content was
studied.
11
Chapter 1
Chapters 2 and 3 describe investigations dealing with the development of high ash content
sludge under varying conditions of biomass yield, amount of precipitation and particle size
distribution of theinoculum. Chapter 2details experiments carried out with crushed granular
sludge and chapter 3deals with experiments with intact granular sludge as inoculum. It was
found that the location ofprecipitation highly controls the quality of high ashcontent sludge.
In chapter 3, a biofilm model is described, by which factors can be assessed that influence
the location of precipitation in an anaerobic reactor.
In chapter 4, it is investigated to what extent calcium carbonate deposition in an anaerobic
reactor can be reduced by dosing inhibitors, phosphate and iron, of CaC03 crystal growth.
In this chapter we also present a chemical equilibrium model which allows the calculation
of the extent of precipitation, provided the proper apparent solubility of calcium carbonate
can be estimated.
In chapter 5, it is investigated to what extent calcium carbonate deposition in an anaerobic
reactor canbereduced by calcium removal from the influent. Anovel process configuration,
comprising an anaerobic reactor combined with acrystallisation reactor, wascapable of very
selective removal of calcium from the influent, reusing the anaerobic effluent alkalinity.
Chapter 6 describes how to calculate the quantity of calcium carbonate precipitation in an
anaerobic reactor by using adapted chemical equilibrium models which take into account
important kinetic factors that influence the apparent solubility of calcium carbonate, namely
the presence of phosphate, the hydraulic retention time and the composition of the influent.
Chapter 7discusses and summarizes the insights gained from the investigation and indicates
the relevance of this thesis work to the field.
In hoofdstuk 8 worden de bevindingen van dit proefschrift in het Nederlands samengevat.
References
1.
2.
3.
12
Abbona F& Francini-Angela M(1995) Crystallization of hydroxyapatite from very dilute
solutions. N.Jb.Miner. Mh.12 563-575.
Alphenaar PA, Sleyster R, Reuver P de, Ligthart GJ & Lettinga G (1993a) Phosphorus
requirement inhigh-rate anaerobic wastewater treatment. Wat. Res.27749-756.
Alphenaar PA, Perez MC & Lettinga G (1993b) The influence of substrate transport
limitation on porosity and methanogenic activity of anaerobic sludge granules. Appl.
References
4.
5.
6.
7.
8.
9.
10.
11.
12.
13.
14.
15.
16.
17.
18.
19.
20.
21.
22.
23.
Microbiol. Biotechnol. 39 276-280.
Alibhai KRK & Forster CF (1986) An examination of the granulation process in UASB
reactors. Environ. Technol.Lett. 7 193-200.
Arvin E & Kristensen GH (1983) Phosphate precipitation in biofilms and floes. Wat. Sci.
Technol. 1565-85.
Barone JP, Nancollas GH & Yoshikawa Y (1983) Crystal growth as a function of seed
surface area. J. Crystal Growth63 91-96.
Beer D de, Huisman JW, van den Heuvel JC & Ottengraf SPP (1992) The effect of pH
profiles inmethanogenicaggregates onthekinetics of acetateconversion. Wat.Res. 10 13291336.
Borgerding J (1972) Phosphate deposits in digestion systems. J. Wat. Pollut. ControlFed.
44 813-819.
Brecevic L & Nielsen AE (1989) Solubility of amorphous calcium carbonate. J. Crystal
Growth98 504-510.
BritoAG &MeloLF(1997)Asimplified analysis of reaction and mass transfer inUASBand
EGSB reactors. Env. Technol. 18 35-44.
Brooks R, Clark LM &Thurston EF (1950) Calcium carbonate and itshydrates. Phil. Trans.
Roy. Soc. London A243 145-167.
Burton WK, Cabrera N & Frank FC (1951) The growth of crystals and the equilibrium
structure of their surfaces. Phil. Trans.Roy. Soc. London A243 299-358.
Callander IJ & Barford JP (1983) Precipitation, chelation and the availability of metals as
nutrients in anaerobic digestion II. Applications. Biotechnol. Bioeng. 25 1959-1972.
Cheng VKW (1993) A Monte Carlo study of moving steps during crystal growth and
dissolution. J. Crystal Growth 134 369-376.
Christoffersen J, Christoffersen MR, Kibalczyc &Andersen FA (1989) Acontribution tothe
understanding of the formation of calcium phosphates. J. Crystal Growth94 767-777.
Christoffersen J & Cristoffersen MR (1990) Kinetics of spiral growth of calcite crystals;
determination of the absolute rate constant. J. CrystalGrowth 100 203-211.
Compton RG & Pritchard KL (1990) Kinetics of the Langmuirian adsorption of Cu" ions at
the calcite/water interface. J. Chem. Soc. FaradayTrans. 86 129-136.
Cowan JC & Weintritt DJ (1976) Water Formed Scale Deposits. Gulf Publishing Company,
Houston, Texas.
Danen-Louwerse HJ, Lijklema L & Coenraats M (1995) Coprecipitation of phosphate with
calcium carbonate in lake Veluwe. Wat.Res. 29 1781-1785.
Davis JA, Fuller CC & Cook AD (1987) A model for trace metal sorption processes at the
calcite surface: Adsorption of Cd2+ and subsequent solid solution formation. Geochim.
Cosmochim.Acta 51 1477-1490.
Dawe RA & Zhang Y(1997) Kinetics of calcium carbonate scaling using observations from
glass mircomodels. J. PetroleumSci. Eng. 18 179-187.
De Zeeuw WJ (1987) Granular sludge in UASB reactors. In: Proc. GASMAT Workshop,
Lunteren, The Netherlands (Edited by Lettinga G and Zehnder AJB), 132-145.
Dittrich M, Dittrich T, Sieber I & Koschel R (1997) A balance analysis of phosphorus
elimination by artificial calcite precipitation in a stratified hardwater lake. Wat.Res. 3123713
Chapter 1
248.
24.
25.
26.
27.
28.
29.
30.
31.
32.
33.
34.
35.
36.
37.
38.
39.
40.
41.
14
Dove PM & Hochella MF (1993) Calcite precipitation mechanisms and inhibition by
orthophosphate: In situ observations by Scanning Force Microscopy. Geochim.Cosmochim.
Acta 57 705-714.
El-Mamouni R, Guiot SR, Mercier P, Safi B&Samson R(1995) Liming impact on granules
activity of the multiplateanaerobic reactor (MPAR) treating whey permeate. BioprocessEng.
12 47-53.
Flora JRV, Suidan MT, Biswas P & Sayles GD (1995) A modelling study of anaerobic
biofilm systems: I. Detailed biofilm modelling. Biotechnol. Bioeng. 46 43-53.
Forster CF (1991) Anaerobic upflow sludge bed blanket reactors: aspects of their
microbiology and their chemistry. J. Biotechnol. 17221-232.
Fukuzaki S, Nishio N, Sakurai H&Nagai S(1991) Characteristics ofmethanogenic granules
grown on propionate in an UASB reactor. J. Ferment. Bioeng. 71 50-57.
Gomez-Morales J, Torrent-BurguesJ &Rodriguez-Clemente R(1996)Nucleationof calcium
carbonate at different initial pH conditions. J. Crystal Growth 169 331-338.
Gomez-Morales J, Torrent-Burgues J, Lopez-Macipe A & Rodriguez-Clemente (1996b)
Precipitation of calcium carbonate from solutions with varying Ca2+/carbonate ratios. J.
Crystal Growth 166 1020-1026.
Goodwin JAS, Wase DAJ & Forster CF (1990a) Anaerobic digestion of ice-cream
wastewaters using the UASB process. Biological Wastes32 125-144.
Gratz AJ & Hillner PE (1993) Poisoning of calcite growth viewed in the atomic force
microscope (AFM) J. CrystalGrowth 129789-793.
Grotenhuis JTC (1992) Structure and stability of methanogenic granular sludge. PhD thesis,
Agricultural University, Wageningen, The Netherlands.
Guiot SR, Rochelau S, HawariJ&Samson R(1992)Induction ofgranulation by sulphonatedlignin and calcium inan upflow anaerobic sludge bed reactor. J. Chem. Tech.Biotechnol. 53
45-56.
Gutjahr A, Dabringhaus H & Lacmann R (1996a) Studies of the growth and dissolution
kinetics of the CaC0 3 polymorphs calcite and aragonite. I. Growth and dissolution rates in
water. J. Crystal Growth 158 296-309.
Gutjahr A, Dabringhaus H & Lacmann R (1996b) Studies of the growth and dissolution
kinetics of the CaC0 3 polymorphs calcite and aragonite. II. The influence of divalent cation
additives on the growth and dissolution rates. /. Crystal Growth 158 310-315.
Habets LHA & Knelissen HJ (1997) In line biological water regeneration in zero discharge
recycle paper mill. Wat. Sci. Technol. 35 41-48.
Habets LHA, Hooimeijer A&Knelissen HJ(1997)In-linebiological process water treatment
for zero discharge operation at recycled fibre board mills. Pulp&PaperCanada98 184-187.
Hamdi M, Festino C & Aubart C (1992) Anaerobic digestion of olive mill wastewaters in
fully mixed reactors and in fixed film reactors. ProcessBiochem. 27 37-42.
Hartley AM, House WA, Callow ME & Leadbeater BSC (1995) The role of green alga in
the precipitation of calcite and the coprecipitation of phosphate in freshwater. Int. Rev. Ges.
Hydrobiol. 80 385-401.
Hartley AM, HouseWA,Callow ME&Leadbeater BSC(1997)Coprecipitation of phosphate
References
42.
43.
44.
45.
46.
47.
48.
49.
50.
51.
52.
53.
54.
55.
56.
57.
58.
59.
60.
61.
with calcite in the presence of photosynthesizing green algae. Wat. Res. 31 2261-2268.
Heath CR, Leadbeater BCS & Callow ME (1995) Effects of inhibitors on calcium carbonate
deposition mediated by freshwater algae. J. Appl. Phycology7 367-380.
Herzog RE, Shi Q, Patil JN & Katz JL (1989) Magnetic water treatment: the effect of iron
on calcium carbonate nucleation and growth. Langmuir 5 861-867.
House WA &Tutton JA (1982) An investigation of the heterogeneous nucleation of calcite.
J. Crystal Growth56 699-710.
House WA & Donaldson L (1986) Adsorption and coprecipitation of phosphate on calcite.
J. Colloidand Interface Sci. Ill 309-324.
HouseWA (1987) Inhibition ofcalcite crystal growth by inorganic phosphate. J. Colloidand
InterfaceScience 119 505-511.
House WA (1990) The prediction of phosphate coprecipitation with calcite in freshwaters.
Wat. Res. 24 1017-1023.
Huang J & Pinder KL (1995) Effects of calcium on development of anaerobic acidogenic
biofilms. Biotechnol. Bioeng. 45 212-218.
Hulshoff Pol LW, de Zeeuw WJ, Velzeboer CTM &Lettinga G(1983)Granulation inUASB
reactors. Wat. Sci. Technol. 15 291-304.
Huster R, Demel I& Geller A (1991) Closing paper mill Whitewater circuits by inserting an
anaerobic stage with subsequent treatment. Wat. Sci. Technol. 24 81-90.
Iza J, Keenan PJ & Switzenbaum MS (1992) Anaerobic treatment of municipal solid waste
landfill leachate: operation of a pilot scale hybrid UASB/AF reactor. Wat. Sci. Technol. 25
255-264.
Jia XS, Furumai H&Fang HHP (1996) Yieldsof biomass and extracellular polymers in four
anaerobic sludges. Env. Technol. 17 283-291.
Jordening HJ, Pellegrini A & Buchholz K (1988) Fluidized bed reactors for purification of
waste water with high calcium content. In: Fifth international symposium on anaerobic
digestion, May 22-26 1988, Bologna, Italy, 289-294.
Jourani A & Bounahmidi T (1995) The kinetics of calcium phosphate precipitation in
clarification. Int. SugarJnl. 97 633-639.
KabasciS, Althaus W&Weinspach PM (1996)Batchprecipitation ofcalcium carbonate from
highly supersaturated solutions. TransIChemE74A 765-772.
Kazmierczak TF, Tomson MB&Nancollas GH (1982)Crystal Growth ofcalcium carbonate.
A controlled composition kinetic study. J. Phys. Chem. 86 103-107.
Kennedy KJ, Hamoda MF & Guiot SG (1988) Anaerobic treatment of leachate using fixed
film and sludge bed systems. J. WaterPollut. ControlFed. 60 1675-1683.
Keenan PJ, Isa J & Switzenbaum MS (1993) Inorganic solids development in a pilot-scale
anaerobic reactor treating municipal solid waste landfill leachate. Wat.Environ. Res. 65181188.
Ketunnen RH & Rintala JA (1998) Performance of an on-site UASB reactor treating leachate
at low temperature. Wat. Res. 32 537-546.
Kralj D, Brecevic L & Nielsen AE (1990) Vaterite growth and dissolution in aqueous
solution; I. Kinetics of crystal growth. J. CrystalGrowth 104 793-800.
Kralj D & Brecevic L (1995) Dissolution kinetics and solubility of calcium carbonate
15
Chapter I
62.
63.
64.
65.
66.
67.
68.
69.
70.
71.
72.
73.
74.
75.
76.
77.
78.
79.
16
monohydrate. ColloidsandSurfaces;APhysicochemicalandEngineeringAspects96287-293.
Lettinga G, van Velsen AFM, Hobma SW, De Zeeuw W & Klapwijk A (1980) Use of the
Upflow Sludge Blanket process (USB) reactor concept for biological waste water treatment,
especially for anaerobic treatment. Biotechnol. Bioeng. 22 699-734.
Lettinga G(1996)Sustainable integrated biological wastewater treatment. Wat.Sci.Technol.
33 85-98.
Loewenthal RE, Kornmuller URC & van Heerden EP (1994) Struvite precipitation in
anaerobic treatment systems. Wat. Sci. Technol. 30 107-116.
Ludwig C & Svardal K (1994) Practical application of a computer model for neutralization
in anaerobic wastewater treatment. Poster presented at: Seventh international symposiumon
anaerobic digestion, January 23-27 1994, Cape Town, South Africa, 227-230.
Mahoney EM, Varangu LK, Cairns WL, Kosaric N & Murray RGE (1987) The effect of
calcium on microbial aggregation during UASB reactor start-up. Wat. Sci. Technol. 19249260.
Marani D, Di Pinto AC, Ramadori, R & Tomei MC (1997) Phosphate removal from
municipal waste water with low lime dosage. Env. Technol. 18 225-230.
Meyer HJ (1984)The influence of impurities on thegrowth rate ofcalcite. J. Crystal Growth
66 639-646.
MorseJW(1983)Thekinetics ofcalcium carbonatedissolution andprecipitation. In:Reviews
inMineralogy, 227-264.
Nancollas GH & Reddy MM (1971) The crystallization of calcium carbonate II. Calcite
growth mechanism. J. ColloidInt. Sci. 37 824-830.
Nancollas GH&Reddy MM(1974) Crystal growth kinetics ofminerals encountered inwater
treatment processes. In: Aqueous environmental chemistryof metals. A.J. Rubin Ed. (Ann.
Arbor Science Publishers, Inc.).
Nancollas GH, Tomson MB, Battaglia G, Wawrousek H & Zuckerman M (1974)
Precipitation of calcium phosphates: the influence of tricarboxylic acids, magnesium and
phosphonate. In: Chemistryof wastewatertechnology Ann.Arbor Science.
Nancollas GH, Lore M, Perez L, Richardson C. & Zawacki SJ (1989) Mineral phases of
calcium phosphate. Theanatomical record224 234-241.
Ogino T, Suzuki T. & Sawada K (1990) The rate and mechanism of polymorphic
transformation of calcium carbonate in water. J. Crystal Growth 100 159-167.
Peric J, Vucak M, Krstulovic R, Brecevic L & Kralj D (1996) Phase transformation of
calcium carbonate polymorphs. Thermochim.Acta 277 175-186.
Plummer LN, Parkhurst DL & Wigley TML (1979) Critical review of the kinetics of calcite
dissolution and precipitation. In: ChemicalModelling in Aqueous Systems (Ed. EA Jenne).
ACS Symposium series 93. American Chem. Society 537-571.
Plummer LN &Busenberg E(1982)The solubilities ofcalcite, aragoniteand vaterite in C0 2 H20 solutions between 0 and 90°C. Geochim. Cosmochim.Acta 46 1011-1040.
Reddy MM & Nancollas GH (1973) Calcite crystal growth inhibition by phosphonates.
Desalination 12 61-73.
Reddy MM (1974) Kinetic inhibition of calcium carbonate formation by waste water
constituents. In: Chemistryof waste water Technology. AJ Rubin (Ed.), 31-58.
References
80.
81.
82.
83.
84.
85.
86.
87.
88.
89.
90.
91.
92.
93.
94.
95.
96.
97.
98.
Rodriguez-Clemente R& Gomez-Morales J (1996) Microwave precipitation of CaC0 3 from
homogeneous solutions. J. CrystalGrowth 169 339-346.
Rosmalen GM van (1981) Scale prevention, study on the crystallization of calcium sulphate
and barium sulphate with and without inhibitors. Thesis, Technical University Delft, The
Netherlands.
Sabbides TG & Koutsoukos PG (1996) The effect of surface treatment with inorganic
orthophosphate on the dissolution of calcium carbonate. J. Crystal Growth 165 268-272.
Sawada K, Ogino T & Suzuki T (1990) The distribution coefficients of Mg2+ ion between
CaC0 3 polymorphs and solution and the effects on the formation and transformation of
CaC0 3 in water. J. CrystalGrowth 106 393-399.
SawadaK(1997)Themechanisms ofcrystallization andtransformation ofcalciumcarbonates.
Pure &Appl. Chem. 69 921-928.
Scherer P, Lippert H & Wolff G (1993) Composition of the major elements and trace
elements of 10 methanogenic bacteria determined by inductively coupled plasma emission
spectometry. Biol. TraceElementsRes. 5 149-163.
Seckler MM, Bruinsma OSL & Van Rosmalen GM (1996) Calcium phosphate precipitation
in afluidized bed in relation toprocess conditions: ablack box approach. Wat.Res. 30 16771685.
Steefel CI & van Cappellen P (1990) A new kinetic approach to modelling water-rock
interaction: the role of nucleation, precursors and Ostwald ripening. Geochim. Cosmochim.
Acta 54 2657-2677.
Stumm W & Morgan JJ (1996) Aquatic Chemistry. Wiley, New York.
Svardal K & Kroiss H (1988) Neutralization in anaerobic waste water treatment. In: Fifth
international symposiumon anaerobic digestion, May 1988, Bologna, Italy, 335-340.
Svardal K (1991) Calcium carbonate precipitation in anaerobic waste water treatment. Wat.
Sci. Technol. 23 1239-1248.
Tarre S & Green M (1994) Precipitation potential as a major factor in the formation of
granular sludge in an upflow sludge-blanket reactor for denitrification of drinking water.
Appl. Microbiol. Biotechnol. 42 482-486.
Tsuge H, Yoshizawa S & Tsuzuki M (1996) Reactive crystallization of calcium phosphate.
TranslChemE74A 797-802.
Uemura S & Harada H (1995) Inorganic composition and microbial characteristics of
methanogenic granular sludge grown in a thermophilic upflow anaerobic sludge blanket
reactor. Appl. Microbiol. Biotechnol. 43 358-364.
Verdoes D (1991) Calcium carbonate precipitation in relation to detergent performance.
Thesis, Delft University Press, The Netherlands.
Vetter OJ (1987)Calcium carbonate scale inoilfield operations. SPE 16908, 62ndAnn. Tech.
Conf.,Dallas, TX. Sept. 27-30.
Zettlemoyer AC (Ed.) (1969) Nucleation. Marcel Dekker, Inc., New York.
Zhang JW & Nancollas GH (1990) Mechanisms of growth and dissolution of sparingly
soluble salts. In: Reviews inMineralogy (eds. Hochella MF & White AF) 23 365-396.
Zundert Mvan (1996) Perfecte controle over biomineralisatie. ChemischMagazine 128-129
(In Dutch).
17
2 Development of high ash content crushed
methanogenic sludge in UASB reactors
E.P.A. van Langerak, G. Gonzalez-Gil, A. van Aelst
J.B. van Lier, H.V.M. Hamelers & G. Lettinga
Abstract -The feasibility of anaerobic treatment of waste waters with ahigh calcium
content (600 - 1200 mgCa 2+ .l') was studied. The influence of the amount of
precipitation and the influence of differences in biomass yield were investigated on
the development of anaerobic sludge. The experiments were performed in lab scale
Upflow AnaerobicSludge Blanket(UASB)reactors, inoculated withcrushed granular
sludge. Four reactors were operated during 180 days at a constant organic loading
rate of 14 gCOD.r'.d"1, treating completely and partly acidified waste water with
different calcium concentrations in the influent. Treatment of completely acidified
waste water with a calcium concentration of 1200 mgCa 2+ .r' resulted in an unstable
COD removal efficiency (60-90%). Furthermore, cementation of the sludge bed
occurred after 180 days of operation, leading to operational problems. With
completely acidified waste water and a lower calcium concentration in the influent
(600 mgCa 2+ .l'), less calcium precipitated and COD removal efficiency always
exceeded 98%. The cultivated sludge had a high ash content, 80-90%, and
methanogenic activity remained more or less constant at 0.7 gCOD.gVSS'.d"1.
However, scaling of reactor compartments occurred under latter condition. The
presence of a fraction of non-acidified substrate, i.e. glucose, decreased the risk of
cementation, resulted in better granulation of the methanogenic sludge and seemed
toprevent scaling of reactor compartments. Considerable amounts of phosphate were
shown to be removed from the influent, most probably by coprecipitation, and
incorporated in the anaerobic sludge. The results indicate that anaerobic treatment of
high calcium waste waters in UASB reactors is more feasible for partly than for
completely acidified substrates.
Published as: Langerak EPA van, Gonzales-Gil G, Aelst A van, Lier JB van,
Hamelers HVM & Lettinga G (1998) Effects of high calcium concentrations on the
development of methanogenic sludge in UASB reactors Wat. Res. 32 1255-1263.
19
Chapter 2
Introduction
Anaerobictreatment of wastewaters isnowadayswidely accepted asaproventechnology and
extensively used. One of the main factors leading to the success of anaerobic treatment was
the introduction of high-rate reactors in which biomass retention and liquid retention are
uncoupled.9,24Amongst thesehigh-ratereactors, theupflow anaerobic sludgeblanket(UASB)
reactor ismostly applied. Anaerobic sludgeinUASBreactorsspontaneously immobilizesinto
wellsettling granular sludge. Several studiesrevealed that calcium, atconcentrations ranging
from 80 to 150 mg.l"1, stimulates the formation of granules during the start up of UASB
reactors.41626 Many waste waters, however, contain considerably more calcium than 150
mg.l"1, for example due to the utilization of lime, a cheap neutralizing agent.30 A high
calcium content can also result from the industrial production process, which is the case for
sugar industries21 and waste paper industries.1417 Also leachates from young landfills contain
considerable amounts of calcium.23 Too high contents of calcium in the influent of an
anaerobic reactor can lead to excessive precipitation of calcium carbonate. This might result
insevereproblems suchasi) scaling of reactor wallsand effluent pipes, ii)loss ofbuffer capacity, Hi)decreasing efficiency due to sludge washout, iv) loss of specific methanogenic
activity and v) space occupation by inorganic precipitates.11,2223 Also positive effects due to
the presence of calcium were reported. Jordening et a/.21 found improvement of biomass
retention inanaerobic fluidized bed reactors duetothepresence of calcium in concentrations
up to 2.5 gCa2+.l"'.
The amount of precipitation, the biomass yield and the location of precipitation seem to be
important parameters determining the development and quality of anaerobic sludge during
treatment of high calcium waste waters. The amount of precipitation depends on the waste
water composition (i.e. calcium concentration and alkalinity) and the conversions that take
place.31Thebiomass yielddepends ontheamountof CODdegraded andtheyield coefficient
(gVSS.gCOD1), which varies for different types of COD.19 The accumulation of biomass
compared to the accumulation of calcium carbonate determines the ash content of the sludge
at steady state conditions. Ash contents below 60% are considered to be favourable for
anaerobic sludge.25 For sludges withahigher ashcontent, seriousdecreases of methanogenic
activity were reported.11,23 Besides amount of precipitation and biomass yield, the structure
of the sludge needs to be considered to evaluate its quality. This structure is influenced by
thelocation of calcium carbonate deposition. Precipitation cantake place inthe bulk solution
and/or in the biofilm. Bulk precipitation is governed by the composition of the bulk liquid,
20
Development of crushedsludge
which varies over the height of the reactor, especially in UASB reactors with a low upflow
velocity.8 If washout of the formed precipitates occurs, no harmful effects on the sludge
structure and quality are to be expected. In case the formed precipitates are retained in the
reactor, new biofilms can develop on their surface.18 On the other hand, agglomeration of
the formed precipitates can take place, which leads to channelling and clogging problems.11
Biofilm precipitation occurs when the micro-environment in the biofilm is more favourable
for precipitation than the environment inthebulk solution. Within anaerobicbiofilms, acetic
acid isconverted inthe more weak carbonic acid, leading to elevated pH conditions.713 The
increased biofilm pHmay initiatecalciumcarbonateprecipitation.6Inlargegranules, thecore
isoften depleted from substrate and, therefore, does not contribute tothe digestion process.3
Calcium carbonate precipitation can then be expected in the active outer layer of a granule.
When the core of agranule is notdepleted from substrate, deposition of precipitates towards
the core of a granule is expected.
Calcium can also precipitate with phosphate, which is generally present in waste water.
Removal of toomuchphosphate from thereactor solutionmightcausereactor failure because
phosphate is an essential nutrient for microbial growth.2
In the present research, the feasibility of anaerobic treatment of waste waters with a high
calcium content was studied. The influence of the amount of precipitation and the influence
of differences in biomass yield were investigated on the development of anaerobic sludge.
Four lab scale UASB reactors were operated. The reactors were inoculated with crushed
granular sludge because it was expected that a small particle size of the sludge will favour
precipitation inthebulk solution, resulting in lessdetrimental effects of the precipitation on
the structure and quality of the anaerobic sludge. Reactors Rl and R2 were fed with
completely acidified substrate (acetate and butyrate) at influent calcium concentrations of
1200and600mgCa2+.l'1respectively whilereactorsR3andR4werefed withpartly acidified
substrate (acetate, butyrate and glucose), also at calcium concentrations of 1200 and 600
mgCa2*.!"1respectively. Theashandphosphatecontent of thesludgeaswellas itsbiological
activity were followed in time. Phosphate measurements of influent and effluent were
performed to study to what extent phosphate will be removed from solution.
21
Chapter 2
Materials and methods
Experimental set-up
The experiments were performed in a temperature controlled room at 30 + 2°C using four
glass UASBreactors with a volume of 4.5 1 (approx. 55 cm height, 10cm i.d.). TheUASB
reactors were equipped with a reverse funnel phase separator. After passing the gas through
aconcentrated sodiumhydroxide solutionfor removing carbondioxide andthrough acolumn
filled with soda lime pellets with indicator, methaneproduction was monitored by a wet gas
meter (Meterfabriek, Dordrecht, The Netherlands). The reactors Rl and R2 were fed with
completely acidified substrate and the reactors R3and R4with partly acidified substrate. All
substrates were neutralized by amixture of Ca(OH)2and/or NaOH and/or NaHC03, in such
a way that all reactors were supplied with equal alkalinity in the influent. Operational and
influent parameters for the reactors are given in Table 1.
Biomass
TheUASBreactors were seeded with anaerobic granular sludge originating from a full scale
UASBreactortreating wastewaterofpapermill industries(Industriewater Eerbeek, Eerbeek,
The Netherlands). Prior to seeding, the granular sludge was crushed with a hand blender
(Multiquick 350 combi, Braun) under anaerobic conditions. To each reactor, 2 litres of wet
sludge was supplied, containing 145 gram VSS in total.
Medium
The mineral medium for the UASB reactors consisted of (g.11): NH4C1 (0.75), KH2P04
(0.026 for R1/R2 and 0.087 for R3/R4), MgSO4.7H20 (0.29), NaCl (0.17), yeast extract
(0.008) and 1ml per litre of a trace element solution according to Zehnder et. a/.34 For the
methanogenic activity tests, the medium consisted of (g.l"1): NH4C1 (0.28), MgSO4.7H20
(0.1), KH2P04 (0.25), CaCl2 (0.01), NaHC03 (4) and 0.1 ml.l"1 of a trace element solution
according toZehnder etal.M Allchemicals were of analytical grade (Merck AG, Darmstadt,
Germany) except theyeastextract (Oxoid, Unipath Ltd, Basingstoke, England) and resazurin
(Fluka ChemieAG, Buchs, Switzerland). The media were prepared in tap water, containing
about 35 mgCa2+.l"'.
Methods
Sludge bed samples were periodically taken from the bottom and top of the sludge bed.
Sampling was done by inserting a tube (2 cm id.) into the sludge bed at the desired level
22
Development ofcrushedsludge
(either bottom or top) after which the samples were siphoned from the reactor.
Methanogenicactivitytests were performed in duplicate in 120ml serum bottles filled with
25 ml of medium and 1 gVSS.l"1. The substrate consisted of 2.5 gCOD-acetate.l'. The
headspace of the bottles was flushed with a mixture of N2 and C0 2 gas in a ratio 70:30 to
create anaerobic conditions and aproper C02/HC03-buffer to stabilize thepH around 7. The
bottles were supplied with a second feed of 1gCOD-acetate.l"1when about 80%of theCOD
was degraded. Next, the bottles were flushed again and incubated. The methane production
rate was then determined by measuring the percentage of methane periodically in the headspaceofthebottlesduring 4-8hours. Thespecific methanogenic activity wascalculated from
the slope of the methane production curve, and expressed as gCOD.gVSS'.d"1. The
percentage of methane in the headspace was determined as previously described.28
Table 1.Operational andinfluent parameters for thefour reactorsRl, R2,R3andR4.
Rl
R2
R3
R4
14
14
14
14
14
14
Period "
OLR2) (gCOD.l '.d-')
3)
HRT (hr)
9
9
9
9
9
9
COD (g.l•')
5.25
5.25
5.25
5.25
5.25
5.25
Ac:Bu:Gl4) (COD ratio)
1:1:0
1:1:0
1:1:2
1:1:1
1:1:2
1:1:1
Calcium influent (mg.r1)
1150
575
1150
1150
575
575
Sodium influent (mg.l1)
0
660
660
430
660
660
HC0 3 influent (mg.l- )
0
0
1740
1150
1740
1150
Chloride influent (mg.r1)
0
0
1010
670
0
0
P04-P influent (mgP.l') 5 )
6±2
6+2
20 + 5
20 + 5
20 + 5
20 + 5
1
1)Allreactors wererunfor 180days. InR3andR4,adifferent substratecompositionwasusedduringperiod
I (day 0-56) and II (day 57-180); 2) OLR = organic loading rate; 3) HRT = hydraulic retention time;4)
Ac:Bu:Gl = acetate:butyrate:glucose; 5)Phosphateconcentrationintheinfluent fluctuated asaresultofdilution
problems due to clogging becauseof precipitation.
Particle size distribution was measured using image analysis. Samples of well-mixed
aggregates were brought into a petri dish (d=6 cm). Sludge samples were analyzed with a
minimum of 200 granules per sample. The petri dish pictures were digitalized and analyzed
23
Chapter 2
on a MAGISCAN 2 image analyzer (Applied Imaging, Tyne and Wear, UK) using the
image-analyzing software package GENIAS (v4.6, 1993,Applied Imaging, Tyne and Wear,
UK). The radius wascalculated from themeasured object perimeter assuming ideal spherical
particles. Particles smaller than 10fx.m in diameter were not considered in the calculations.
Forscanningelectronmicroscopy (SEM) analysis, granules were fixed for 2 hours in2.5%
glutaraldehyde. After rinsing two times with sodium cacodylate buffer, the granules were
fixed for 1.5 hours in 1% osmium tetroxide. After rinsing with demineralized water, the
aggregates were dehydrated inan ethanol series (10, 30, 50, 70, 90 and 100%, 20min. per
step) and subsequently critical-point dried with C0 2 . After gold/palladium sputter coating,
the aggregates were examined on a SEM (JSM 6300F, Jeol).
Analysis
Chemical oxygen demand (COD)was determined using the 'micro-method'.20 VFAwere
analyzed by gas chromatography as previously described.27 Biogas composition(CH4, C0 2
and N2)wasmeasured taking gas samples of 100fAfrom thegas sampling port of thereactor
and analyzed by gas chromatography.27 Calciumsamples were prepared for measuring both
the soluble and the total content. For measuring soluble calcium concentrations, effluent
samples were filtrated using a membrane filter with apore size of 0.45 fim, after which the
samplewas acidified up topH 2with HN0 3 (65%) and stored. For analysisof total calcium,
samples of 20 ml were directly transferred into adigestion tube, adding 2.5 ml 65% HN0 3 ,
7.5 ml 37% HC1and 10ml distilled water. Hereafter, the mixture was heated for two hours
at 80°C, subsequently cooled, and diluted withdemineralized water in a volumetric flask of
100 ml. Prior to analysis, all samples were diluted with 0.2% lanthan nitrate solution.
Calcium was measured by an atomic absorption spectrometer (Model AA975, Varian,
Springvale, Australia), using alamp at 422.7 nmwavelength. Theburning gas for the flame
was a mixture of air/acetylene (2:1).' Dry weight and ash content of the sludge were
analyzed using standard methods.1 Specificgravityofthe sludge (wetdensity)was measured
by use of a pycnometer according to standard methods (1). Phosphorus was determined
colorimetrically for filtered samples (0.45 fim) by the ascorbic acid method using a
spectrophotometer (800nm).' Thephosphorus content of the sludge was determined from
supernatant after destruction. Dried sludge (0.5-1 gram) was destructed adding 2.5 ml65%
HN0 3 , 7.5 ml 37% HC1and heated during 1hour at 80°C, 1hour at 150°C and 3hours at
250°C. The supernatant was filtrated and diluted in a volumetric flask of 100 ml. Prior to
phosphate analysis, the samples were neutralized to pH 2 with NaOH.
24
Developmentof crushed sludge
Results
Reactorperformance
After inoculation with crushed granular sludge, all four reactors were continuously operated
at a fixed organic loading rate of 14gCOD.l '.d'. The achieved COD removal efficiencies,
shown in Fig. 1, were generally around 98% for reactors R2, R3 and R4. The performance
of reactor Rl was less stable and the COD removal efficiency was generally about 90%.
After sampling of sludge, the efficiency of this reactor always dropped slightly, and even
down to 60% in the period day 110-150 (Fig. 1).
100
&
v
80
CO
>
o
E
CD
Q
O
O
/
\
60 40 -
' \
••-/
—-
20 0
R1
R2
50
R3
....
R4
100
150
time(days)
Figure 1.CODremovalefficiency ofthereactorsRl, R2,R3andR4.Effluent COD
consisted mainly ofacetate.
Depositionof calcium precipitates
Since the reactors were fed with synthetic waste water with ahigh calcium content and since
bicarbonate was produced from the anaerobic degradation of the substrate and was added in
the influent in some reactors (Table 1), calcium carbonate precipitation could prevail. The
amount of calcium that precipitated in each reactor varied considerably. Two factors clearly
influenced theamount of calcium thatprecipitated; i)Theinfluent calcium concentration; the
amount of precipitation was higher in reactor Rl, fed with 1200 mgCa.l1, than in R2, fed
with 600 mgCa.l"1 (Table 2) and ii) The COD removal efficiency; a higher COD removal
efficiency resulted in higher bicarbonate concentrations and thus in a higher CaC03
deposition. E.g. in Rl, 265 mgCa2+.1"' precipitated at aCOD removal efficiency between60
and 90%, compared to 706 mgCa 2+ .r' during periods of higher removal efficiency (Table
2).
25
Chapter 2
c
00
d NO CO
+1 +1 +1
3
P3
t~
O
o
ON
^ON
<N
NO
o
d
+1
+
2
ON
ON
CN
+1 +1 +1 +1 +1
s
<*
3
<N ON *"!
NO
-3-
^J-
o
+1
+1 NO
O
J3
O.
3
co
co
+1 +1
o
•o
ON
NO
00
3
"3
•o
N
o O
oo Ooo
(S
o
+1 +1 +1 +1
o
ON
1^
B
a
•8
NO
- S '»
ON
o
O
+1 +1 +1
d
+1
2
13
ON
"3
V
iC
U1
o <s NO
d NO NO
d
+1 +1 +1 +1 +1
w
e
o
A
ei
o
W
Tien
s
o
ts
a.
o
— r^
u U«
1*
c
o
3
Fi )3
X>
O
26
ON
V
o
-C
c
•a
U
3
a
H
o
A
d
d
+1 +1 +1 +1 +1
ON
as
a.
58
00
o
o
ON
e
o
ON
o
_3
•a
c
3
B
•a a!
CS
1)
o
o
u
cfl
n
CO
Ou
o
l-t
>
o
u
c
fi
«
•s
6fl
F
E
3
3
F
a.
o
t-.
O
O
U
•a
O
F
«
3
XI
3
a.
H
611
K
o
4>
CL,
o
a* o< cu
•a
X)
o
^_7
oi
o
u_
^
•a
Development ofcrushedsludge
In addition to carbonate, also phosphate was removed from the solution. The phosphate
removal efficiency fluctuated for thedifferent reactorsandalsovariedwith theCODremoval
efficiency. Inreactor Rl, theeffluent phosphate concentration wasonly 0.2 mgP.l'1 atahigh
COD removal efficiency (i.e. 90%), while at moderate efficiency (i.e. 60-90%) it remained
at a value of 2.5 mgP.l"1 (Table 2). In reactors R3 and R4, applied influent concentrations
of phosphate were higher (20 mgP.l"1) than in reactors Rl and R2 (6 mgP.l"1)- Despite the
higher influent phosphate levels, also low concentrations (0.4 - 6.5 mgP.l"') were found in
the effluent of reactors R3 and R4 (Table 2).
Placeof depositionand scalingof reactor compartments
Except for reactor R3, 80-100% of theprecipitated calcium accumulated inthereactors. The
washout of smallcalciumprecipitates amounted 20-100mgCa2+.l"' (Table2). InreactorR3,
87% of the calcium precipitates washed out of the system, particularly during period I.
However, after lowering theglucose fraction inthesubstrate (period II), theprecipitatewash
out dropped to 7% (Table 2). Contrary to the other reactors, considerable scaling (2-3 mm)
of calcium carbonate occurred in reactor R2 on the glass reactor wall above the sludge bed
and onthe settler. In reactor Rl, theglass wall did not show any scaling and remained clear.
In reactors R3 and R4, fed with partially acidified substrate, the reactor parts also remained
free of CaC03. The glass reactor walls were covered with a thin, slimy layer of biomass.
time (days)
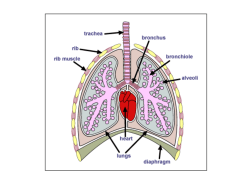
Figure 2. Ash content(% of dry weight) as measured in time for reactors Rl, R2,
R3andR4for sludgesampled from thebottom(o)andthetop(A) ofthesludgebed.
27
Chapter 2
Sludge development
The increase in ash content of the anaerobic sludge grown in the reactors R1-R4 is shown
inFig. 2. The inorganic fraction increased the fastest in Rl; sludge from the bottom and the
top of the sludge bed reached an ash content over 70% within two months (Fig. 2). In
reactor R2, theashcontent increased much slowerthan inRl, particularly for thetopsludge.
Nonetheless, the ash content of sludges from both reactors Rl and R2 reached values over
80% after 180 days of operation. In contrast, the rate of increase in ash content in R3 and
R4(fed with VFA and glucose) remained distinctly lower (Fig. 2). The sludges from thetop
finally reached values of only 50 and 30% for R3 and R4 respectively. The ash content of
sludge from thebottom of both reactors reached values of 80% at the end of the experiment
(Fig. 2). Together with the ash content, also the dry weight and the density of the sludge
increased (Table 3). This allowed equal or even higher concentrations of VSS to be present
at the end of the experiment compared to the start up conditions despite the high space
occupation by inorganic material. Measurement of the P-content of the sludge revealed a
sharp increase inall reactors. TheP-content oftheseed sludgeamounted 12mgP.gVSS"'and
increased during the experiment up to 30 - 192 mgP.gVSS' after 180 days (Table 3). The
maximum specific methanogenic activity remained more or less constant during the
experiment and amounted 0.7 gCOD.gVSS'.d' for the reactors Rl and R2 and 0.5
gCOD.gVSS '.d 1 for the reactors R3 and R4 (Fig. 3).
1.2 • R1
•o
0.8,
CO
CO
0.4
1.2 • R3
i o i
•9
"
i1—=
b
o
o
0
>
1.2
0
50
c
100
150
C)
T—-
'—»—
50
100
150
50
100
150
1.2 ' R4
0.8£
^^i—
0.4
0
A-
*
0.4
>
1
0.8
0.8
0.4
0
C
50
100
150
C)
time (day
Figure3.Maximummethanogenicactivity(gCOD.gVSS'.d1)onacetateasmeasured
intimefor thereactors Rl, R2,R3andR4for sludge sampled from thebottom (o)
andthetop (A) ofthesludgebed.
28
Development ofcrushedsludge
Table 3. Sludgebed characteristics at thestart and theend (t=180days) ofthe
experiment. Sludge bed volume, dry weight, density, amount of VSSandthe
phosphorus content are listed for bottom and top sludgeand thetotal sludgebed.
(% of TSS)
VSS in
reactor
(gram)
P-content of
sludge
(mgP.gVSS1)
1055
86
145
12
90
70
1878
2294
11
4
192
61
--
—
-
139
48
187
0.75
0.75
1.5
68
28
2021
1350
9
18
-
—
--
bottom
top
total
1.3
1.3
2.6
44
13
1738
1100
13
51
--
—
--
bottom
top
total
1.3
1.3
2.6
33
8
1442
1100
17
70
--
-—
-
Volume
wet sludge
Dry weight"
Density TSS
VSS
(1)
(%)
(g.l 1 )
2
8
bottom
top
total
0.75
0.75
1.5
bottom
top
total
Start; inoculum
Rl
R2
R3
R4
—
93
51
144
72
30
129
95
224
135
53
105
80
185
149
46
—
—
—
" Dryweightwasmeasuredafter removalofsurfaceattachedwaterbyspreadingthesludge
during5minutesonagrid, whichwasplacedonahydroscopictissue(paper napkin).
The results of sizedistribution measurements ofthe granulesare shown inFig. 4. Inreactors
Rl and R2, the sizeof thecultivated sludgeparticleshardly increased during the experiment.
Themedian diameter of the inoculum was0.06 mm whilethe diameter was0.09 mm for the
top sludge of Rl and 0.11mm for the bottom and top sludge of R2 after 180days. The size
distribution of the sludge from the bottom of Rl could not be measured, because serious
cementation of the sludge bed took place. In fact, it was not longer possible to operate
reactor Rl after 180days. Scanning electron microscopy (SEM) revealed that the cemented
sludgeconsisted of linked small spherical particles withadiameter of approximately 100 jum
(Fig. 5a). The surface of the particles consisted of a dense crystal structure with a minor
amount of biomass (Fig. 5b). In contrast to reactors Rl and R2, granulation proceeded
distinctly better in reactors R3 and R4. By the end of the experiment, the sludge bed in the
latter reactors was divided intwo equal parts. Thebottom part consisted of whitish particles
withamediandiameter of 1.1 mm andtheupperpart contained blackparticles withamedian
diameter of 0.6 mm (Fig. 4).
29
Chapter2
The granules from the bottom sludge of reactors R3 and R4 had a dense core of calcium
carbonate with a thick layer of loosely attached biomass. The surface of most granules was
covered with a dense biofilm in which precipitates could not be detected (Fig. 5c). At
locations at the surface where the biofilm layer was thin or absent, the underlying layer of
crystal plates showed up (Fig. 5d).
E 100
= 80
3 60
o 40
£ 20
0
0
a-
£
.
0.5 1.0
CD
T3
o
c
a>
3
C7
1 .
Cementation
ofthe
sludgebed
U
E
o
c
CO
40
£20
1-
iikrnw , Jlllmihi^.
lrWU
0.5 1.0 1.5 2.02.5
8,60
1
-I "'
10
0
k
0.51.0 1.5
R1
50
40
30
20
10
0
20
I 1 ilk,
0.5 1.0 1.5 2.0 2.5 3.0
16
12
8
4
ffl
Dlhkm,. ,,
0.5 1.0
0.5 1.0 1.5 2.0
0.5 1.0 1.5 2.0 2.5 3.0
R2
R3
R4
Diameter (mm)
Figure4. Granular sizedistribution (frequency (%) oftheamount ofgranules) from
the inoculum andthecultivated sludgesattheendof theexperiments (t=180)from
thebottom and topof thesludge bedsof reactors Rl, R2, R3andR4.
Discussion
The results of this study showed that high COD removal efficiencies could be maintained
during treatment of waste water with calcium concentrations as high as 1200 mgCa2+.l"' at
an organic loading rate of 14gCOD.l 'd'. Although the ash content of the sludge increased
rapidly (upto90%),the specific methanogenic activity remained at the same level (0.5-0.7
gCOD.gVSS'.d1) during the 180 days of continuous operation. This is in contrast with
results of Keenan et al.23 who measured a decrease of the methanogenic activity from 0.56
to 0.25 gCOD.gVSS'.d'1 at a final ash content of the sludge of 78%. El-Mamouni et alu
even reported a decrease from 0.77 to 0.13 gCOD.gVSS'.d"1 at a final ash content of 5078%. However, the specific methanogenic activity of sludge from reactors Rl and R2 was
2-3 times lower than of sludge cultivated on similar VFA mixtures in absence of excess
calcium.1012 This indicates that calcium carbonate precipitation did negatively influence the
activity of the sludge. Theactivity of the sludge from reactor R2 initially increased upto 1.2
30
Developmentof crushed sludge
gCOD.gVSS '.d' but itdecreased beyond day 50. Thisdecrease canvery likely be attributed
to the continuously increasing ash content and density of the sludge, leading to severe
scaling-in of the biomass. Compared to reactor R2, the ash content in reactor Rl increased
morerapidly, causingfaster masstransfer limitations. Latter might explainwhyhigher levels
of acetate were found inthe effluent of reactor Rl (500mgCOD.l') compared toreactor R2
(100 mgCOD.l1) (Fig. 1).
-•40-(tm
Figure5. Scanning electron microscope photographs of: (a)cemented sludge from
thebottom part ofRl attheend oftheexperiment whichconsisted ofagglomerated
sphericalcrystalparticles,bar=lOOjtm;(b)detailofthesurfaceofasphericalparticle
as shown in 5a, showing a dense crystal surface with some attached bacteria,
bar=1/xm;(c)granule from the bottom of reactor R3at theendof the experiment,
showing adensebiofilm onthesurface, bar=10^m;(d)granule from thebottomof
R3at the end of theexperiment, showing thecalcium precipitates aspresent inthe
core of theaggregates, bar=10/tm.
Although scaling-in of biomass took place, a serious decrease in methanogenic activity did
not occur. Likely, not only biofilm precipitation but alsobulk precipitation took place. Bulk
precipitation might havebeen favoured by the small particle size of the sludges. The formed
precipitates tended to remain in the sludge bed due to the low upward velocity applied.
Subsequently, attachment of biomass could takeplace on the formed crystal surfaces, which
31
Chapter2
was indeed confirmed by microscopy. Attachment of biomass toprecipitated shells wasalso
observed by Iza et al.n Very likely, the moderate activity we measured was the average of
poorly active, scaled-in biomass and more active biomass as present in thin biofilms on the
surface of the formed precipitates. The presence of precipitates did not reduce the
concentration of VSS in the reactor, because space occupation by the precipitates was
accompanied by a higher dry weight and density of the sludge (Table 3). Consequently,
sufficient and active biomass waspresent, allowing high treatment efficiencies at the applied
loading rate of 14 gCOD.l'.d"1. However, in reactor Rl, agglomeration of crystals could
easily take place due to the high density, low sheer forces and availability of free crystal
surface due to poor overgrowth (Fig. 5a). This agglomeration process of crystals is known
as ripening29 and caused severe operational problems.
The sludge from reactor R3 and R4, fed with partly acidified substrate, had a different
composition and morphology incomparison to sludges cultivated in reactors Rl and R2, fed
with a VFA mixture. The activity of the granules cultivated in reactors R3 and R4 also
remained more or less constant in time but did not exceed 0.5 gCOD.gVSS'.d 1 . This
observed lowermethanogenic activity mightbeattributed tothepresence of arelatively large
fraction of acidifying biomass33 and the presence of larger granules, in which mass transfer
was probably reduced. The larger size of the glucose-VFA fed granules compared to the
VFA fed sludge (Fig. 4) canbe attributed to abetter granulation process due tothe presence
of a large fraction of extracellular polymers during growth on glucose.19 The layered
structure we observed, consisting of a core of calcium precipitates with an exterior layer of
biomass, was also observed by Uemura and Harada32 in experiments treating unacidified
waste water under thermophilic conditions. This layered structure can be explained by the
occurrence of substrate and pH profiles inthe sludge particles.5 The relatively high biomass
yield in reactors R3 and R4 very likely prevented cementation of the sludge bed (Fig. 5c).
Regardingphosphate, itcanbeconcluded that muchmorephosphate accumulation tookplace
inthe sludge than could beexpected from biological assimilation. Anaerobic, non phosphate
limited sludge contains about 10mgP.gVSS1.2 In our experiments, P-contents up to almost
200mgP.gVSS"1weremeasured, indicatingprecipitationand/or coprecipitation ofphosphate.
Based on data of reactor Rl (Table 2), it is likely that coprecipitation took place. At a high
COD removal efficiency (>90%), the average calcium and phosphate concentrations were
434and0.2 mg.l"1respectively. During aperiodof lower CODremoval efficiency (60-90%),
the average concentrations of both calcium and phosphate were higher, 875 and 2.5 mg.l"1
respectively. When it is assumed that concentrations of calcium and phosphate in the liquid
32
Developmentof crushedsludge
phase were controlled by the same calcium phosphate polymorph during both periods, the
phosphate concentrations should become lower at increasing calcium concentrations.
However, the contrary was found. In case of coprecipitation, more phosphate will be
eliminated at higher calcium carbonate precipitation rates.15 The latter is in accordance with
our findings.
Conclusions
The feasibility of anaerobic treatment of waste waters with high calcium concentrations
depends on the degree and location of calcium precipitation and the biomass yield.
Treatment of completely acidified waste water with a calcium concentration of 1200mg.l"1,
atanorganicloading rateof 14gCOD.l '.d', results inanunstable CODremoval efficiency.
The biomass is scaled as a result of the excessive precipitation and the density increases
quickly which finally results in cementation of the sludge bed.
Under similar biomassyield conditionsbut withlesscalcium intheinfluent (600mgCa2+.l'),
high COD removal efficiencies (98%) can be attained. The inoculation with crushed sludge
with a small particle size very likely attributes to this good performance. However, under
latter condition, scaling of reactor compartments is favoured.
Inthepresenceofglucose, the feasibility ofanaerobictreatment ofhigh calciumwastewaters
highly increases because precipitates are quickly covered with faster growing acidogens,
preventing cementation of the sludge bed. Moreover, treatment of partly acidified waste
water results in a better granulation and seems to diminish the risk for scaling of reactor
compartments.
Soluble phosphate can be very well removed from the influent. Coprecipitation was found
to be the most likely mechanism for the phosphate removal.
Acknowledgements
The authors thank Jaing-Nan Lin for conducting part of the experimental work. Financial
support by the Dutch government (NOVEM), Borculo Whey Products Coop., DHV Water
BV, Haarmann & Reimer Ltd., Industriewater Eerbeek BV, KNP-BT NV, Paques BV,
Roermond Papier BV and the Coop. Suiker Unie U.A. is highly appreciated.
33
Chapter2
References
1.
2.
3.
4.
5.
6.
7.
8.
9.
10.
11.
12.
13.
14.
15.
16.
17.
18.
19.
34
APHA (1992) Standard methodsfor the Examination of Wasteand Wastewater. American
Public Health Association, New York.
Alphenaar PA, Sleyster R, Reuver P de, Ligthart GJ & Lettinga G (1993a) Phosphorus
requirement in high-rate anaerobic waste water treatment. Wat. Res. 27 749-756.
Alphenaar PA, Perez MC & Lettinga G (1993b) The influence of substrate transport
limitation on porosity and methanogenic activity of anaerobic sludge granules. Appl.
Microbiol. Biotechnol. 39 276-280.
Alibhai KRK & Forster CF (1986) An examination of the granulation process in UASB
reactors. Environ. Technol.Lett. 7 193-200.
Arcand Y, Chavarie C& Guiot SR (1994) Dynamic modelling of thepopulation distribution
in the anaerobic granular biofilm. Wat. Sci. Technol. 30 63-73.
Arvin E & Kristensen GH (1983) Phosphate precipitation in biofilms and floes. Wat. Sci.
Technol. 1565-85.
Beer D de, Huisman JW, van den Heuvel JC & Ottengraf SPP (1992) The effect of pH
profiles inmethanogenic aggregates onthekinetics of acetateconversion. Wat.Res. 10 13291336.
BritoAG &MeloLF (1997)Asimplified analysis ofreaction and mass transfer in UASBand
EGSB reactors. Env. Technol. 18 35-44.
De Zeeuw WJ (1987) Granular sludge in UASB reactors. In: Proc. GASMAT Workshop,
Lunteren, The Netherlands (Edited by Lettinga G & Zehnder AJB) 132-145.
Dolfing J & Bloemen WGBM (1985) Activity measurements as a tool to characterize the
microbial composition of methanogenic environments J. Microbial. Methods 4 46-57.
El-Mamouni R, Guiot SR, Mercier P, Safi B&Samson R(1995) Liming impact on granules
activity of the multiplate anaerobic reactor (MPAR) treating whey permeate. BioprocessEng.
12 47-53.
Fang HHP, Li YY & Chui HK (1995) UASB treatment of waste water with concentrated
mixed VFA. J. Environ. Eng. 121 153-160.
Flora JRV, Suidan MT, Biswas P & Sayles GD (1995) A modelling study of anaerobic
biofilm systems: I. Detailed Biofilm Modelling. Biotechnol. Bioeng. 46 43-53.
Habets LHA & Knelissen HJ (1997) In line biological water generation in a zero discharge
recycle paper mill. Wat. Sci. Technol. 35 41-48.
House WA & Donaldson L (1986) Adsorption and coprecipitation of phosphate on calcite.
J. Colloid and Interface science 112 309-324.
Hulshoff Pol LW, deZeeuwWJ, Velzeboer CTM &Lettinga G(1983) Granulation in UASB
reactors. Wat. Sci. Technol. 15 291-304.
Huster R, Demel I& Geller A (1991) Closing paper mill Whitewater circuits by inserting an
anaerobic stage with subsequent treatment. Wat. Sci. Technol. 24 81-90.
Iza J, Keenan PJ & Switzenbaum MS (1992) Anaerobic treatment of municipal solid waste
landfill leachate: operation of a pilot scale hybrid UASB/AF reactor. Wat. Sci. Technol.25,
255-264.
Jia XS, Furumai H&Fang HHP(1996) Yieldsof biomassand extracellular polymers in four
anaerobic sludges. Env. Technol. 17 283-291.
Developmentof crushedsludge
20.
21.
22.
23.
24.
25.
26.
27.
28.
29.
30.
31.
32.
33.
34.
Jirka A & Carter MJ (1975) Micro semi-automated analysis of surface and waste waters for
chemical oxygen demand. Analyt. Chem. 47 1397-1401.
Jordening HJ, Pellegrini A & Buchholz K (1988) Fluidized bed reactors for purification of
waste water with high calcium content. In: The5th international symposium on anaerobic
digestion, May 22-26 1988, Bologna, Italy, 289-294.
Kennedy KJ, Hamoda MF & Guiot SG (1988) Anaerobic treatment of leachate using fixed
film and sludge bed systems. J. WaterPollut. ControlFed. 60 1675-1683.
Keenan PJ, Isa J & Switzenbaum MS (1993) Inorganic solids development in a pilot-scale
anaerobic reactor treating municipal solid waste landfill leachate. Water. Environ. Res. 65
181-188.
Lettinga G, Van Velsen AFM, Hobma SW, De Zeeuw W & Klapwijk A (1980) Use of the
Upflow Sludge Blanket process (USB) reactor concept for biological waste water treatment,
especially for anaerobic treatment. Biotechnol. Bioeng. 22 699-734.
Ludwig C & Svardal K (1994) Practical application of a computer model for neutralization
in anaerobic waste water treatment. In: The 7thinternational symposium onanaerobic digestion, January 23-27 1994, Cape Town, South Africa, 227-230.
Mahoney EM, Varangu LK, Cairns WL, Kosaric N & Murray RGE (1987) The effect of
calcium on microbial aggregation during UASB reactor start-up. Wat. Sci. Technol. 19249260.
Rebac S, Visser A, Gerbens S, van Lier JB, Stams AJM & Lettinga G (1996) The effect of
sulphate on propionate and butyrate degradation in a psychrophilic anaerobic expanded
granular sludge bed (EGSB) reactor. Env. Technol. 17 997-1005.
Sierra R&Lettinga G(1991)Theeffect of aromatic structure onthe inhibition of acetoclastic
methanogenesis in granular sludge. Appl. Microbiol. Technol. 34 544-550.
Stumm W & Morgan JJ (1996) Aquatic Chemistry.Wiley, New York.
Svardal K& Kroiss H (1988) Neutralization inanaerobic waste water treatment. In: The5th
international symposiumon anaerobicdigestion, May 22-26 1988, Bologna, Italy, 335-340.
Svardal K (1991) Calcium carbonate precipitation in anaerobic waste water treatment. Wat.
Sci. Technol. 23 1239-1248.
Uemura S & Harada (1995) Inorganic composition and microbial characteristics of
methanogenic granular sludgegrown inathermophilic upflow anaerobic sludgeblanketreactor. Appl. Microbiol. Biotechnol. 43 358-364.
Vanderhaegen B, Ysebaert E, Favere K, Van Wambeke M, Peeters T, Panic V,
Vanderlangenbergh V & Verstraete W (1992) Acidogenisis in relation to in-reactor granule
yield. Wat. Sci. Technol. 25 21-30.
Zehnder AJB, Huser BA, Brock TD & Wuhrmann K (1980) Characterization of an acetatedecarboxylating, non-hydrogen-oxidizing methane bacterium. Arch. Microbiol. 124 1-11.
35
3 Impact of location of CaC0 3 precipitation on
the development of intact anaerobic sludge
E.P.A. van Langerak, H. Ramaekers, J. Wiechers, A.H.M. Veeken,
H.V.M. Hamelers & G. Lettinga
Abstract - The development of anaerobic intact granular sludge was studied in
UASB reactors under varying conditions of CaC0 3 precipitation and biomass
yield. Varying precipitating quantities were obtained using different calcium
concentrations in the influent and different biomass yields were obtained by
feeding with completely or partly acidified substrate. Four reactors were operated
at a constant organic loading rate of 13 gCOD.T'.d"1. Additionally, with a biofilm
model, key factors were elucidated that determine the location of precipitation
within an anaerobic bioreactor, being either the sludge aggregate or the bulk
solution. Treatment of completely acidified waste water with high calcium
concentrations (780-1560 mgCa2+.l"') resulted in the rapid formation of dense,
high ash content granules of which the specific methanogenic activity rapidly
dropped and which easily agglomerated, leading to serious cementation of the
sludge bed. At a lower influent calcium concentration (390 mgCa2+.l"'), treatment
of completely acidified waste water resulted in precipitation on reactor
compartments, while precipitation within the aggregates did hardly take place. The
presence of a fraction of non-acidified substrate retarded cementation of the sludge
bed and resulted in development of high ash content sludge with a satisfactory
quality. The developed biofilm model was shown to provide a clear, qualitative
insight in the factors that affect the location of precipitation, and thereby the
quality of high ash content sludge. Moreover, it explains the observed differences
in the location of precipitation during the experiments. A low Ca/Na ratio, a small
granule diameter and a high crystallization rate constant (=low CaC0 3 growth
inhibition) were found to stimulate precipitation in the bulk solution, and are
considered to be favourable parameters for the development of good quality high
ash content sludge.
Submitted for publication in WaterResearch.
37
Chapter3
Introduction
Anaerobic treatment of waste waters is nowadays accepted as a proven technology, for
which the upflow anaerobic sludge blanket (UASB) reactor is mostly applied.21 In these
reactors, the anaerobic biomass spontaneously immobilizes into well settling granular
sludge with a good specific methanogenic activity. However, the methanogenic activity
might become negatively affected when calcium carbonate precipitates within the
granules.61516 Excessive precipitation of CaC03 in an anaerobic digester also may lead to
cementation of the sludge bed, leading to operational problems.19
The risk of calcium carbonate precipitation in anaerobic treatment exists for all waste
waters with a high calcium content. Examples of industries where calcium is released to
the waste water are the sugar- and waste paper industry.91014 In anaerobic digestion,
organic pollutants are converted to methane and carbon dioxide. Bicarbonate can form
calcium carbonate precipitates with the calcium present in the waste water.28 In addition to
carbonate, calcium can also precipitate with phosphate, which is generally present in
waste water because it is an essential nutrient for microbial growth.2 However, phosphate
is also an important inhibitor of calcium carbonate crystal growth8,22 and as shown in
previous research, its presence in an anaerobic digester will result in a decrease of the
extent of calcium carbonate precipitation.20
The extent of precipitation, the biomass yield and the location of precipitation can be
considered as important parameters for the development and quality of anaerobic sludge
in the treatment of high calcium waste waters. The amount of precipitation depends on the
waste water composition, the COD conversion and the kinetics of the CaC03
precipitation. The latter parameter is particularly influenced by the presence of inhibitors
of crystal growth.20 The ratio between biomass and CaC0 3 accumulation determines the
ash content of the sludge at steady state conditions. Serious losses of methanogenic
activity were reported for sludge with a high ash content616 although also high ash content
sludges have been cultivated with a relatively high methanogenic activity.1719 This
contradiction can be explained considering the structure of the high ash content sludge.
This structure is highly influenced by the location where calcium carbonate deposits.
Precipitation can take place in the bulk solution but also within the sludge aggregates.
Bulk precipitation is primarily governed by the composition of the bulk liquid. It is
obvious that if any washout of the formed precipitates occurs, no harmful effects on the
38
Developmentof intact sludge
sludge structure and quality will occur. In case the formed precipitates are retained in the
reactor, new biofilms can develop on the crystal surface.11 On the other hand, also
agglomeration of the formed precipitates can take place, leading to serious channelling
and clogging problems.619 Precipitation within the sludge aggregate occurs when the
micro-environment in the biofilm is more favourable for precipitation than the
environment in the bulk solution.4 Within the anaerobic biofilms, acetic acid is converted
in the weaker carbonic acid, which leads to elevated pH conditions.5,7 In large granules,
the core is often depleted from substrate and, therefore, then does not contribute to the
digestion process.3 Calcium carbonate precipitation in that case can only be expected in
the active outer layer of a granule. When the core of a granule is not depleted from
substrate, also deposition of precipitates can occur towards the core of a granule, as was
observed by Uemura and Harada.29
With the present research we aim to gain insight in the factors that determine the location
of precipitation and thereby the quality of high ash content anaerobic sludge developing in
the treatment of high calcium waste waters. For this we investigated the growth of intact
granular sludge under conditions of varying quantities of precipitation and various degrees
of biomass yield, which could be achieved by using different calcium concentrations in
the influent and by feeding with either completely or partly acidified substrate. The
experiments were carried out in reactors with effluent recirculation in order to ensure
proper mixing. Additionally, we developed a steady state biofilm model to elucidate the
key factors that determine the location of CaC03precipitation within an anaerobic reactor.
Materials and methods
Experimental design
Four identical glass, recycled upflow anaerobic sludge blanket (UASB) reactors were used
with a reactor volume of 160 ml and a total system volume of 450 ml (Fig. 1). Effluent
recirculation was applied to obtain a homogeneous liquid composition in the system,
which resulted in an upflow rate of 1.8 m.hour1. The influent flow rate was 1 l.d'1 and
the recycling flow rate 130 l.d1. The methane production was monitored by liquid
displacement after passing the gas through a concentrated sodium hydroxide solution (Fig.
1). The chosen influent composition for the reactors was such that various degrees of
precipitation can be attained, resulting in development of sludges with varying ash
contents. The reactors were operated at an organic loading rate of 13 gCOD.l'.d' and a
39
Chapter3
hydraulic retention time (HRT) of 9 hours. The influent composition of the four reactors
is given in Table 1.
Biomass
The UASB reactors were seeded with intact anaerobic granular sludge originating from a
full scale UASB reactor treating paper mill waste water (Industriewater Eerbeek,
Eerbeek, The Netherlands). Each reactor was supplied with 50 ml of wet sludge,
corresponding to 6 g VSS per reactor.
Medium
The mineral medium for the UASB reactors consisted of (g.l'1): NH4C1 (0.75), KH2P04
(0.065), MgSO4.7H20 (0.29), NaCl (0.17), yeast extract (0.008) and 1 ml per litre of a
trace element solution according to Zehnder et. al..x For the batch experiments the
medium consisted of (g.l 1 ): NH4C1 (0.28), MgSO4.7H20 (0.1), KH2P04 (0.5), CaCl2
(0.01), NaHC03 (4) and 0.1 ml.l'1 of a trace element solution according to Zehnder et al.
(1980). The substrates used in the experiment consisted of mixtures of acetate and glucose
in a ratio as listed in Table 1. All chemicals were analytical grade (Merck AG,
Darmstadt, Germany) except the yeast extract (Oxoid, Unipath Ltd, Basingstoke,
England) and resazurin (Fluka Chemie AG, Buchs, Switzerland). The media were
prepared in demineralized water.
Methane
Effluent
Figure 1.Diagram oftheUASBreactors.
40
NaOH
Developmentofintact sludge
Table 1. Processconditions and influent composition for thereactors Rl, R2,R3
andR4.
COD
C2:glucose
Ca influent
Na influent
P influent
(g-11)
(COD ratio)
(mg.r1)
(mg.r1)
(mgP.l1)
Rl
R2
R3
R4
5
1:0
1.560
0
15
5
1:0
780
900
15
5
1:0
390
1.350
15
5
3:1
780
450
15
Experimental methods
Samples from the sludge bed were periodically taken from the reactors to determine ash
content, dry weight and methanogenic activity. Methanogenic acetoclastic activity tests
were performed in 120 ml serum bottles filled with 25 ml of media and 1gVSS.l"1. The
substrate consisted of 2.5 gCOD-acetate.l"1. The headspace of the bottles was flushed with
a mixture of N2 and C0 2 gas (70:30 v/v) to create anaerobic conditions and a proper
C02/HC03-buffer to stabilize the pH around 7. The bottles were supplied with a second
feed of 1 gCOD-acetate.l"1 after 80% of the initial substrate COD was degraded. Next,
the bottles were flushed again and incubated. The methane production rate was then
determined by measuring the percentage of methane periodically in the headspace of the
bottles during 4-8 hours. The specific methanogenic activity was calculated from the slope
of the curve, and expressed as gCH4COD.gVSS'1.d'1. The percentage of methane in the
headspace was determined as described previously.25 Particle size distribution was
measured using image analysis.19
Analysis
VFAsamples were analyzed by gas chromatography as described previously.24 Chemical
oxygen demand (COD)was determined according to the 'micro-method' as described by
Jirka and Carter.13 Biogas composition (CH4, C0 2 and N2) was measured taking gas
samples of 100 iA from the gas sampling port of the reactor (Fig. 1) and analyzed by gas
chromatography.24 Calcium samples of the effluent were prepared for measuring the
soluble calcium content. For this, effluent samples were filtrated using a 0.45 nm
membrane filter, after which the sample filtrate was acidified up to pH 2 with HN0 3
(65%) and stored at 4°C. Prior to analysis, samples were diluted with 0.2% lanthan
nitrate solution. Calcium was measured by an atomic absorption spectrometer (Model
AA975, Varian, Springvale, Australia), using a lamp at 422.7 nm wavelength. The
41
Chapter3
burning gas for the flame was a mixture of air/acetylene (2:1).' Dry weight and ash
content of the sludge were analyzed using standard methods (APHA, 1992).Phosphorus
in the influent and effluent of the reactors was determined colorimetrically for filtered
samples (0.45 /*m) by the ascorbic acid method using a spectrophotometer (800nm).'
Modelling
A steady-state biofilm model was developed to elucidate factors that determine the
location of CaC0 3 precipitation within an anaerobic reactor. Two possible locations for
precipitation are distinguished in the model: (1) within the sludge aggregate and (2) in the
bulk solution. The bulk solution is considered to be a completely mixed compartment,
which is achieved by effluent recirculation. Transport in the biofilm takes place by
diffusion (Fig. 2).
1
substrate degradation
• CaC03 production
Gas
•gas production
- CaC03 production
Effluent
diffus on
sludge
bulk
T
Influent
Figure 2. Diagram of the steady-state biofilm model used to gain insight in the
factors thatdetermine thelocation of CaC03precipitation inananaerobic reactor.
The flux from the bulk solution towards the biofilm (Jf) is expressed by:
Jf
=
kf ([Ca]f -[Ca]b)
where:
Jf
kf
[C]f
[C]b
42
= flux from the bulk solution towards the biofilm (mol.hour '.dm'2)
= transport coefficient (dm.hour1)
= concentration in the biofilm (mol.l"1)
= concentration in the bulk solution (mol.l'1)
Developmentofintact sludge
The following assumptions were made in thedevelopment of the mathematical model:
Only thedegradation of acetate is considered.
The diffusion coefficient is equal for all substrates and products.
The concentration at the surface of the granule is equal to that in thebulk solution,
allowing thecalculation of the transport coefficient, kf.
The concentration decreases linearly within the granule and the average
concentration is [C] f . Thetransport coefficient, kf, then equals D f / r where Df =
diffusion coefficient inthebiofilm (dm2.hour"') andr = biofilm radius(dm)
C 0 2 and CH 4 are the only components in the gas phase, and all gas is formed in
the bulk solution
Due to the low solubility of methane, it is assumed that all methane formed
immediately escapes to thegasphase.
For describing the degradation rate of acetic acid (RAc) we used Monod kinetics:27
RAC
=
Xf * V _ * [HAcT] / (K, + [HAcT])
where:
Vmi
= maximum substrate consumption rate (mol.gVSS'.hour 1 )
Xf
= microorganism density in thebiofilm (gVSS.l 1 )
Ks
= Monod's half-velocity constant (mol.l' 1 )
[HAcT]
= total acetic acid concentration inthe system (mol.l 1 )
The rate of calcium carbonate precipitation can be calculated using is represented the
following equation:8-20'23
= k.s^/lAP-vXp)2
where:
r
= calcium carbonate accumulation rate
k
= growth rate constant
s
= reactive crystal surface area
IAP = ionic activity product (Ca2+)(C032)
Ksp
= solubility product of CaC0 3
(mol.l1.s"1)
(dm.s1)
(dm2.mol1)
(mol2.l2)
(mol2.l2)
The applied equilibrium constants of carbonic acid and acetic acid and an overview of
input parameters are listed in Table 3.
43
Chapter3
Results
CODremoval efficiency
The COD removal efficiencies of all four reactors are presented in Figure 3. In reactor
Rl, the COD removal efficiency gradually increased to 99% after 50 days, and
deteriorated afterwards, with efficiency drops down to 10% (Fig. 3a). The experiment
with Rl was terminated after 165 days because the sludge bed was cemented to such a
high extent that it was no longer possible to operate the reactor. However, note that the
efficiency was still 70% at day 165. In reactor R2, fed with a lower influent calcium
concentration, the COD removal reached 99% immediately after the start-up. Like in
reactor Rl, the efficiency in R2 was far from stable (Fig. 3b). The experiment carried out
with this reactor was terminated after 165 days as well, because of cementation of the
sludge bed. Reactor R3, fed with the lowest influent calcium concentration, achieved a
COD removal efficiency of 99% after two weeks (Fig. 3c). The experiment with this
reactor was terminated after 44 days, because clogging of the inlet filter (Fig.1) resulted
in high sheer forces in the reactor and deterioration of the granular sludge, which led to
serious wash-out of biomass. The COD removal efficiency in reactor R4, fed with partly
acidified substrate, remained very high (97-99%) until day 230. At that day, sludge was
removed because the reactor was fully filled with sludge and the efficiency dropped to
90%. Cementation of the sludge bed ultimately also occurred in this reactor (after 260
days), and the experiment was then terminated. The COD removal efficiency was still
95% at that time (Fig. 3d).
Table 2. Minimum and maximum valuesmeasured for reactor pH, precipitated quantitiesof
calcium, dissolved phosphate concentrations and %C02 inthebiogas.
Rl
R2
min
max
pH reactor
6.7
7.2
Ca precipitated mgCal"'
260
860
P0 4 -P effluent (mgP.l')
0.6
3.9
% C0 2 in biogas
10
20
min
R4
R3
max
min
max
min
7.2
7.6
7.5
8
7.1
7.4
230
630
190
290
280
430
0.6
6.3
4.4
6.5
2.0
5.0
8
14
5
7
15
20
Quantityof calciumcarbonateprecipitation
Table 2 presents the results of the reactor pH, the precipitated quantities of calcium, the
effluent phosphate concentrations and the pC0 2 of the biogas. The precipitated quantities
44
max
Development of intact sludge
of calcium carbonate in each of the reactors fluctuated widely, mainly because of the
fluctuations in COD removal efficiency (Fig. 3).
E c?
Q
O
O
100
o
O
100
80
60
40
20
0
150
R3
R4
100
£*
80
60
40
0
10
20
30
40
50 0
time (days)
50
100
150
200 250
time (days)
Figure 3. Cause of the assessed COD removal efficiency (""—), ash content
(—), dry weight (•••) and methanogenic activity (—) of the sludge in UASB
reactors 1-4.
Locationof calciumcarbonateprecipitation
In the reactors Rl and R2, calcium carbonate precipitated mainly within the sludge
granules. The crystals became visual at the surface of the granules after 120 days in both
reactors. These surface crystals showed a tendency to agglomerate, and due to that,
cementation of the sludge bed commenced. Together with the onset of agglomeration,
also scaling of the marble (phase separator, Fig. 1) became apparent. In contrast, hardly
any calcium carbonate precipitated within the sludge in reactor R3 but instead it
precipitated mainly on the glass reactor wall, on the wall of the recirculation vessel, on
the settler (marble) and within the teflon filter at the bottom of the reactor, which
45
Chapter3
consequently was clogged frequently (Fig. 1). Like in reactor Rl and R2, in reactor R4
the calcium carbonate precipitated within the sludge aggregates. However, the first signs
of granule cementation became visible only after 230 days.
Sludge characteristics
Since in reactors Rl and R2, calcium carbonate precipitated within the sludge aggregates,
the sludge ash content in these reactors increased rapidly, reaching 90% within 50 days
(Fig. 3a/3b). Beyond day 50, the dry matter content of the sludge continued to increase in
both reactors, from 50% to 70%. This shows that the granules became completely filled
with precipitates, as was confirmed by microscopic observations of cross sections of the
granules (pictures not shown). The maximum specific methanogenic activity of the sludge
in reactors Rl and R2 increased during the first 50 days, but from then onwards it
continuously decreased. At the end of the experiment, hardly any activity was left (Fig.
3a/b). The average diameter of the sludge granules remained at 2.1 mm during the 165
days of operation.
In reactor R3, very little calcium carbonate precipitated in the sludge aggregates and the
ash content only increased to 32% (Fig. 3c). In case calcium carbonate would have
precipitated exclusively in the sludge, the ash content should have increased to 70% at
day 44. The methanogenic activity of the sludge in this reactor increased from 0.7 to 1.8
gCOD.gVSS'.d"1 in this short experimental period (Fig. 3c). The average diameter of the
granules in R3 was 1.8 mm at the start of the experiment, and could not be measured at
the end of the experiment because deterioration and washout of the sludge had taken
place.
In reactor R4, operated at an influent calcium concentration of 780 mgCa.l"1 and partially
fed with glucose, less calcium carbonate precipitated than in Rl and R2 (Table 2).
Moreover, the biomass yield was higher due to the presence of glucose. As a result of
these factors, a slower increase of the sludge ash content prevailed compared to the
sludge in Rl and R2. However, despite that, the ash content of the sludge also reached a
value of 95% after 260 days of operation. During the first 40 days of the experiment, the
sludge activity increased to 1.7 gCOD.gVSS'.d"1 and thereafter, it gradually dropped to
0.6 gCOD.gVSS'.d"1 (Fig. 3d). After 94 days of operation, when the ash content of the
sludge amounted to 80%, we observed a porous structure of the granules. However, after
165 days of operation, the granules were completely filled with calcium precipitates
46
Developmentof intact sludge
except at one spot, where a pit allowed transport of substrates and products towards the
core of the granule. The outer part of the granules consisted of a thick layer of biomass,
and the inner part of a dense core of calcium carbonate and scaled-in biomass. About
forty-five days later (at day 210), the entire sludge bed tended to float. Most of the
granules were stuck together by a slimy, stringy biomass structure. This layer was barely
permeable for gas. Although most of the granules could easily be separated from each
other, some of them were agglomerated tightly by crystal bindings. Clearly visible
crystals were spread over the surface of many of the granules, and most of them were
covered with a thin biomass layer. This biomass layer seems to prevent crystal
agglomeration. Due to the high density of the granules, and because the reactors were
filled up completely with sludge, any distinct abrasion did not occur, allowing
cementation to take place. When the operation of the reactor was terminated at day 260,
approximately half of the sludge bed was agglomerated by crystal bindings. During the
experiment, the diameter of the granules in R4 increased from 2 to 3.1 mm at the
termination of the experiment. Even at that time, the activity was still 0.6 gCOD.gVSS'.
d' and the COD removal efficiency 95% despite the very high ash-content (95%) of the
sludge.
Discussion
Qualitativeinterpretationof experimental data
In reactors Rl and R2, fed with acetate as substrate and with calcium concentrations of
respectively 1560 and 780 mgCa.l"1, precipitation exclusively proceeded within the
granules and not in the bulk solution. As a result, the granules became completely filled
up with precipitates. Due to that, the mass transfer became very low and the specific
methanogenic activity dropped accordingly. However, when operated at a lower calcium
influent concentration (R3; 390 mgCa.l"1) than Rl and R2, any significant precipitation
within the sludge aggregates did not occur, but instead, the CaC0 3 mainly precipitated
onto glass and plastic reactor parts. The presence of a fraction of non-acidified substrate
(glucose) in the influent, clearly had a strong effect. Although ultimately the ash content
of the sludge reached a value of 95%, it increased much slower in reactor R4 than in Rl
and R2 and the methanogenic activity remained at a reasonable value (Fig. 3d).
Appearing crystals at the surface of the granules did not show a strong tendency to
agglomerate. The main reason for that can be found in the fact that they were rapidly
covered with a layer of fast growing acidifying biomass. This layer delays the
47
Chapter3
cementation of the sludge bed. The main question arising from these experiments is why
in reactors Rl, R2 and R4 the precipitation occurred within the sludge aggregates, while
in R3, it proceeded on glass and plastic reactor parts. The reason for this should be found
in differences between the feed solutions of Rl, R2, R4 and R3. To explain the observed
discrepancies in location of precipitation, the different conditions applied for the four
reactors were simulated with the developed biofilm model. The used input parameters are
summarized in Table 3.
Table3.Theconstantsused insimulations withthebiofilm model.
Constant
k,
k2
kH
K,
KSP
V
* max
Xf
K,
Q
v,
vb
k'
kf
A,
r
D,
equilibrium constant for H 2 C0 3 /HC0 3
equilibrium constant for HC0 3 7C0 3 2 '
Henry's constant
equilibrium constant for HAc/Ac"
solubility product of calcite
maximal conversion rate for HAc
microorganism density in biofilm
Monod's constant for HAc conversion
flow rate
sludge volume
bulk volume
crystallisation rate constant (=k.s)
transfer coefficient
total sludge area in the reactor
biofilm radius
diffusion coefficient in the biofilm
Value
Unit
4.10-7
4.10-"
29.3
1.105
mol.l"1
mol.l'
mol.r'.atm 1
mol.l-1
mol2.l2
mol.gVSS'.hour'
gVSS.l"1
mol.l-1
dm3.hour1
1
1
l.mol'.hour 1
dm.hour1
dm2
dm
dm2.hour1
io- 85
3.3.10"3
120
0.0001
0.04
0.05
0.1
360- 7.2.105
function of r
function of r
various
6.67.10"
To simplify the calculations, it was assumed that all granules were 3 mm in diameter, and
that the crystallization rate constant, k, was 50 l.mol'.s 1 . 20 The calculated rates of
calcium precipitation for the biofilm and for the bulk phase are shown in Fig. 4a. They
appear to be in the same order of magnitude as the calculated rates (Table 2). By dividing
the rate of precipitation in the biofilm over that in the bulk solution, a ratio factor is
obtained which allows the estimation of the most likely location of precipitation (Fig. 4b).
At a ratio of 1, rates are equal and there is no preference for biofilm or bulk
precipitation. At a ratio < 1, there is a tendency for precipitation in the bulk solution,
while at a ratio > 1, precipitation in the biofilm is favoured. The calculated values for the
ratio factor shown in figure 4b reveal the ratio is lowest (0.25) for R3, indicating that
48
Development ofintact sludge
precipitation is least likely to occur within the biofilm in this reactor, which was indeed
found. Consequently, the model looks a suitable tool to explain where CaC03
precipitation will proceed despite the fact that assumptions and simplifications were made
in the present model. So we assumed equal and constant crystallization rate constants for
all four reactors. However, in reality, this constant depends on the phosphate
concentration in the reactor, because it is an inhibiting compound for calcium carbonate
crystal growth.20 As the phosphate concentration varied in all four reactors (Table 2), k
was not constant during the experiments. Moreover, a uniform granule diameter of 3 mm
was assumed, while in reality, the size of the granules was more diverse (data not
shown). The effect of those two factors on the location of precipitation, and consequently
on the quality of high ash content sludge, will be discussed below.
<D 600
? _500
| 3400
.1O300
% B1200
£ 100
b
•
m
R1
R2
R3
R4
Figure 4. (a) Calculated steady-state precipitation rates in the bulk solution and
biofilm phase in reactors R1-R4. The COD concentration was 5g.l"\ and the
Ca/Na composition as follows:
Rl: Ca=0.04M, Na=0M
R2:Ca=0.02M, Na=0.04M
R3: Ca=0.01M, Na=0.06M R4:Ca=0.02M, Na=0.02M
(b) Calculated ratio between the precipitation rates in the film and bulk solution
for the four reactors.
Effects of the crystallization rate constant and granular size on the location of
precipitation
From the discussion above, it is clear that the Ca/Na ratio of the influent is an important
parameter determining the location of precipitation in an anaerobic reactor. But, as
explained above, a substantial effect can also be expected from the granular size and the
crystallization rate constant with respect to the location of the precipitation. This can be
demonstrated, though also qualitatively, with the developed biofilm model. For this
purpose, simulations were carried out with k values varying between 1and 200 mol.r'.s"1,
which are, according to earlier findings, reasonable values in anaerobic digestion under
49
Chapter3
conditions of high (5 mgP.l"1) and low phosphate concentrations (0-1 mgP.l1).20
Moreover, we made simulations for granule diameters varying between 0.75 and 6 mm.
The values for the remaining applied parameters are summarized in Table 3. The results
of the simulations are presented in Figure 5. It appears that for small granules (0.75 mm),
and at low values of k' (1-100 mol.l'.s"1), there does not exist any clear preference for
bulk or biofilm precipitation. Only at very low inhibition by phosphate (k'=200), there
exists some tendency towards bulk precipitation. For larger granules, and under
conditions of smaller crystallization rate constants, k, precipitation in the biofilm tends to
dominate (Fig. 5). These examples illustrate that the location of precipitation particularly
will be controlled by the rates of conversion and mass transport processes, which are,
amongst others, influenced by the granular size, the crystallization rate constant and the
composition of the feed solution.
Possibilitiesto cultivatea high ash contentsludgewithappropriatemethanogenic activity
In our present experiments, we measured a significant loss of activity for the sludge in Rl
and R2. These findings are in fact quite in contradiction with those of previous
experiments, where no drop of methanogenic activity was found.19 However, in these
previous experiments, conducted with similar feeds compared to the present experiments,
we used a seed sludge with a distinct smaller diameter, e.g. only 0.06 mm compared to 2
mm in this study. Apparently, the smaller size is the size of the granules in the seed
sludge the more bulk precipitation will dominate. Consequently, less scaling-in of biomass
will prevail, and the less will be the drop in specific methanogenic activity. This
prevalence of bulk precipitation in case of smaller aggregates could be confirmed on the
basis of simulations with the biofilm model. However, with both types of sludge, crushed
and intact granules, a serious agglomeration of sludge occurs when treating completely
acidified waste water, leading to severe operational problems. On the other hand, when
the biomass yield is high, e.g. in presence of partially acidified feed solutions,
cementation of the sludge bed will be strongly retarded, as was shown previously19 and
also in the present experiments. The addition of non acidified substrate thus improves the
quality of high ash content sludge because it retards agglomeration.
Also other researchers described big controversies in specific activity of high ash content
sludges. Keenan eta/.16 and El-Mamouni et al.6 found a serious loss of activity during the
development of high ash content sludge, contrary to Ketunnen et al}1. From the
discussion as mentioned above, it will be clear that the contradictions can be explained
50
Developmentof intact sludge
considering the factors that determine the location of precipitation. However, duetoa
lack of detailed information inthese studies, regarding e.g. granular size andpresenceof
compounds inhibiting calcium carbonate crystal growth, a detailed evaluation of those
results cannot beprovided.
filmprecipitation
•k'=1 Hk'=10 Qk'=50 ak'=100 • k'=200
&
Its
CO
*- ^
iiil
n
II1
to
4-»
'Q.
O
F
±
«=
O 0.5
£ 2
0.75
1.5
3
bulk precipitation
6
Granulediameter (mm)
Figure 5.The effect ofgranular size onthe precipitation rates inthefilmdivided
over theprecipitation rate inthebulk (ratio film/bulk) atdifferent k' values. The
calculated COD removal efficiency fluctuated duetodifferences ingranular size.
The calculated values were as follows: 0.75mm (COD%=99); 1.5mm
(COD%=98); 3mm (COD%=92); 6mm(COD%=74).
With respect to the cultivation of a high quality "high ash content sludge", it can be
concluded that biofilm precipitation should beminimized. Theresults of simulations with
the biofilm model reveal that this canbeaccomplished bye.g. 1)using seed sludge with
small aggregates; 2) applying a low Ca/Na ratio and 3) not inhibiting crystal growth,
which can be accomplished by providing a low phosphate concentration in the reactor.
The biofilm model we developed is certainly an appropriate tool, to provide a good
qualitative insight in the factors that determine the location of precipitation. In would
obviously be attractive to make a quantitative model, however, many additional kinetic
factors need to be considered for this purpose. For instance, one factor that should be
considered in a quantitative model is the available crystal surface in the reactor. The
present model assumes that thecrystallization rate constant, k'(=k.s), is constant for the
film and bulk phase during the entire experiment. However, values of k' will increase
once appropriate surface area for crystal growth (s) is formed,18 which will e.g. lead to
enhanced biofilm precipitation once some crystals are formed there. Thus, in order to
make quantitative predictions, adynamic model should bedeveloped, which isfarbeyond
the scope ofthis research.
51
Chapter3
Conclusions
Starting up a reactor using intact granular sludge in case of feeds consisting of completely
acidified waste water and with a calcium concentration of 780-1.560 mgCa.1'1-, will result
in the rapid formation of dense, high ash content granules of which the specific
methanogenic activity will rapidly deteriorate, resulting in a poor COD removal
efficiency.
When operating the same system at a lower influent calcium concentration, 390 mg.l"1,
less precipitation occurs within the sludge aggregates. Instead, precipitation takes place on
glass and plastic reactor parts.
The presence of non acidified substrate leads to the development of high ash content
sludge of still quite satisfactory quality. The sludge activity remains at a reasonably high
level (0.6 gCOD.gVSS"1. d"1) even at a prolonged period of operation. As a result of the
higher biomass yield, cementation of the sludge bed is significantly retarded, which can
be attributed to the occurrence of biofilms on the crystal surfaces.
The developed steady-state biofilm model provides a clear, qualitative insight in the
factors that affect the location of precipitation and it explains the observed differences in
the location of precipitation.
Factors which promote precipitation in the bulk solution phase are (1) a small granular
size; (2) a low concentration of phosphate; and (3) a low calcium/sodium ratio at equal
alkalinity. By stimulating precipitation in the bulk solution, the quality of the sludge can
be maintained satisfactory, despite the fact that the ash content comes up to high levels.
Acknowledgements
The authors thank the Dutch government (NOVEM BV), Borculo Whey Products Coop.,
DHV-Water BV, Haarman & Reimer Ltd., Industriewater Eerbeek BV, KNP-BT NV,
Paques BV, Roermond Papier BV and the Coop. Suiker Unie U.A. for their financial
support.
References
1.
2.
52
APHA (1992) Standard methods for the Examination of Waste and Waste water.
American Public Health Association, NewYork.
Alphenaar PA, Sleyster R, Reuver P de, Ligthart GJ & Lettinga G (1993) Phosphorus
Developmentof intact sludge
3.
4.
5.
6.
7.
8.
9.
10.
11.
12.
13.
14.
15.
16.
17.
18.
19.
requirement in high-rate anaerobic waste water treatment. Wat. Res. 27 749-756.
Alphenaar PA, Perez MC & Lettinga G (1993) The influence of substrate transport
limitation on porosity and methanogenic activity of anaerobic sludge granules. Appl.
Microbiol. Biotechnol. 39 276-280.
Arvin E & Kristensen GH (1983) Phosphate precipitation in biofilms and floes. Wat. Sci.
Technol. 1565-85.
De Beer D, Huisman JW, van den Heuvel JC & Ottengraf SPP (1992) The effect of pH
profiles in methanogenic aggregates on the kinetics of acetate conversion. Wat. Res. 10
1329-1336.
El-Mamouni R, Guiot SR, Mercier P, Safi B & Samson R (1995) Liming impact on
granules activity of the multiplate anaerobic reactor (MPAR) treating whey permeate.
BioprocessEng. 12 47-53.
Flora JRV, Suidan MT, Biswas P & Sayles GD (1995) A modelling study of anaerobic
biofilm systems: I. Detailed Biofilm Modelling. Biotechnol. Bioeng. 46 43-53.
House WA (1987) Inhibition of calcite crystal growth by inorganic phosphate. J. Colloid
and Interface Science 119 505-511.
Habets LHA, Hooimeijer A & Knelissen HJ (1997) In-line biological process water
treatment for zero discharge operation at recycled fibre board mills. Pulp&PaperCanada
98 184-187.
Huster R, Demel I & Geller A (1991) Closing paper mill Whitewater circuits by inserting
an anaerobic stage with subsequent treatment. Wat. Sci. Technol. 24 81-90.
Iza J, Keenan PJ & Switzenbaum MS (1992) Anaerobic treatment of municipal solid waste
landfill leachate: operation of a pilot scale hybrid UASB/AF reactor. Wat. Sci. Technol.
25 255-264.
Jia XS, Furumai H & Fang HHP (1996) Yields of biomass and extracellular polymers in
four anaerobic sludges. Env. Technol. 17 283-291.
Jirka A & Carter MJ (1975) Micro semi-automated analysis of surface and waste waters
for chemical oxygen demand. Analyt. Chem. 47 1397-1401.
Jordening HJ, Pellegrini A & Buchholz K (1988) Fluidized bed reactors for purification of
waste water with high calcium content. In: Fifth international symposium on anaerobic
digestion, May 22-26 1988, Bologna, Italy, 289-294.
Kennedy KJ, Hamoda MF & Guiot SG (1988) Anaerobic treatment of leachate using fixed
film and sludge bed systems. J. WaterPollut. ControlFed. 60 1675-1683.
Keenan PJ, Isa J & Switzenbaum MS (1993) Inorganic solids development in a pilot-scale
anaerobic reactor treating municipal solid waste landfill leachate. Water. Environ. Res. 65
181-188.
Kettunen RH & Rintala JA (1998) Performance of an on-site UASB reactor treating
leachate at low temperature. Wat. Res. 32 537-546.
Langerak EPA van, Hamelers HVM & Lettinga G (1997) Influent calcium removal by
crystallization reusing anaerobic effluent alkalinity. Wat. Sci. Technol. 36 341-348.
Langerak EPA van, Gonzales GG, Aelst A van, Lier JB van, Hamelers HVM & Lettinga
G (1998a) Effects of high calcium concentrations on the development of methanogenic
sludge in upflow anaerobic sludge bed (UASB) reactors. Wat. Res. 32 1255-1263.
53
Chapter3
20.
21.
22.
23.
24.
25.
26.
27.
28.
29.
30.
54
Langerak EPA van, Beekmans MMH, Beun JJ, Hamelers HVM and Lettinga G. (1998b)
Influence of phosphate and iron on the extent of calcium carbonate precipitation during
anaerobic digestion. Submitted. Chapter 4 of this thesis.
Lettinga G (1996) Sustainable integrated biological waste water treatment. Wat. Sci.
Technol. 33 85-98.
Meyer HJ (1984) The influence of impurities on the growth rate of calcite. J. Crystal
Growth 66 639-646.
Ogino T, Suzuki T & Sawada K (1990) The rate and mechanism of polymorphic
transformation of calcium carbonate in water. /. Crystal Growth 100 159-167.
Rebac S, Visser A, Gerbens S, van Lier JB, Stams AJM & Lettinga G (1996) The effect
of sulphate on propionate and butyrate degradation in a psychrophilic anaerobic expanded
granular sludge bed (EGSB) reactor. Env. Technol. 17997-1005.
Sierra R & Lettinga G (1991) The effect of aromatic structure on the inhibition of
acetoclastic methanogenesis in granular sludge. Appl. Microbiol.Technol. 34 544-550.
Stumm W & Morgan JJ (1996) Aquatic Chemistry. Wiley, New York.
Suidan MT & Wang YT (1985) Unified analysis of biofilm kinetics. J. Env. Eng. ASCE
111 634-646.
Svardal K (1991) Calcium carbonate precipitation in anaerobic waste water treatment.
Wat. Sci. Technol. 23, 1239-1248.
Uemura S & Harada H (1995) Inorganic composition and microbial characteristics of
methanogenic granular sludge grown in a thermophilic upflow anaerobic sludge blanket
reactor. Appl. Microbiol. Biotechnol. 43 358-364.
Zehnder AJB, Huser BA, Brock TD & Wuhrmann K (1980) Characterization of an
acetate-decarboxylating, non-hydrogen-oxidizing methane bacterium. Arch. Microbiol. Y2A
1-11.
4 Influence of phosphate and iron on the
extent of CaC0 3 precipitation
during anaerobic digestion
E.P.A. van Langerak, M.M.H. Beekmans, J.J. Beun,
H.V.M. Hamelers & G. Lettinga
Abstract - It was investigated to what extent calcium carbonate deposition in an
anaerobic reactor can be reduced by dosing inhibitors, phosphate and iron, of CaC0 3
crystal growth. At several concentrations of the additive, the extent of precipitation
was assessed in continuous experiments with lab-scale reactors. Phosphate
concentrations in the reactor as low as 0.5 - 5 mg total-P.l"1 were found to severely
inhibit CaC0 3 precipitation. On the contrary, iron did not inhibit the deposition of
CaC03, which was found tobe due tothe fact that iron, in contrast tophosphate, only
inhibits the growth of calcite andnotthe formation of aragonite.Theresults led tothe
conclusion that only additives, inhibiting the formation of as well aragonite and
calcite, can be used as effective inhibitors during anaerobic digestion. A developed
chemical equilibrium model was shown to be a useful tool to calculate the extent of
calcium carbonate deposition during anaerobic digestion provided theproper apparent
solubility product of calcium carbonate can be estimated.
Submitted for publication in J. Chem. Technol.Biotechnol.
55
Chapter 4
Introduction
For concentrated industrial waste waters, anaerobic treatment is often the key to costeffective treatment. During anaerobic treatment of waste waters with a high calcium and/or
phosphorus content, precipitation is likely to occur. High calcium concentrations in waste
water i.e. occur in the waste paper industry, especially when waste water loops are closed
for reuse.1 Precipitation in an anaerobic system generally leads to serious problems, like
CaC03 scaling on reactor walls, loss of specific methanogenic activity, cementation of the
sludge bed and clogging of effluent pipes.2'4 With chemical equilibrium models, the amount
of calcium carbonate deposition in an anaerobic reactor can be estimated. Those models
assume establishment of equilibrium of precipitates within treatment time spans. However,
the actually prevailing solubility products often differ one or two orders of magnitude from
the thermodynamic value for different types of waste waters,5-6 which can be attributed to
kinetic inhibition of calcium carbonate formation by waste water constituents.7 Traces of
several additives can reduce the reaction rate constant of calcium carbonate deposition by
several orders of magnitude.8 Although numerous publications on the role of inhibitors on
calcium carbonate formation kinetics exist,8"12theapplicability of such inhibitors to diminish
the extent of calcium carbonate deposition during anaerobic digestion was never studied so
far. Amongst others,phosphate and ironareknown tobe very effective inhibitorsof calcium
carbonate crystallization.8-9 Both components are usually present inthe influent of anaerobic
digesters as they are needed for the growth of micro-organisms. Therefore, phosphate and
iron were selected in this work to study their influence on the extent of calcium carbonate
deposition during anaerobic digestion.
The aim of this research was to study the possibility of dosing phosphate and/or iron in the
influent of an anaerobic reactor to diminish the extent of calcium carbonate deposition.
Theoretical aspects
Calcium carbonate
Calcium carbonate can be found in different polymorphs, which in order of increasing
solubilityarecalcite,aragonite, vaterite,hydrated andamorphouscalciumcarbonate. Calcite,
aragonite and vaterite have solubility products of 10'84, 10"82 and 10 7 9 mol2.l2 respectively
at30°C.15Calcium carbonatemonohydrate hasasolubilityproduct of 10"72mol2.l2at30°C16
and for amorphous calcium carbonate it is 10"65mol2.l2.15 Calcite is the thermodynamically
stable CaC0 3 polymorph, however, formation of the other, metastable, phases during
56
Influence of phosphate and iron
spontaneous precipitation from a highly supersaturated solution is acommonphenomenon.16
The presence of impurities can have important consequences on the formation and
transformation behavior of the metastable phases.10
Kineticsof CaC03 crystal growth
The driving force for a crystallization reaction is the extent of the supersaturation of the
solution. If surface diffusion or integration of ionsat kink sitesaretheratedetermining step,
the rate expression of calcium carbonate growth can be expressed as:917"19
k.syiip-^
' CaCO,
where:
r
CaC03
k
s
IAP
K sp
= calcite accumulation rate
= crystal growth rate constant
= reactive crystal surface area
= ionic activity product (Ca2+)(C032)
= solubility product of CaC03
(i)
(mol.l-'.s-1)
(dm.s1)
(dmlmol 1 )
(mol 2 .r 2 )
(rnol2.!2)
The value of k can be drastically reduced by the presence of additives, inhibiting crystal
growth. Regarding the estimation of s, it is important to notify that the crystal growth
depends on the density of growth sites on the surface and not on the specific surface areaof
the crystals,20 which makes it a parameter difficult to assess.
Inhibitionmechanismof crystal growth
Inhibition of crystal growth by trace amounts of additives generally is assumed tobe caused
bytheblocking of surface sites(activegrowth sites, i.e. terraces, stepsor kinks)by adsorbed
molecules or ions of the additive. A reversible adsorption can be described by a Langmuir
isotherm:8'12
k
adsXi
©. =
k
ads-Ci
where:
+
l
9j
C;
kads
(2)
= fraction of surface sites covered by the additive
= concentration of additive
= adsorption constant
(-)
(mol.l1)
(l.mol1)
57
Chapter4
With the further assumption that the growth rate constant k decreases with increasing
coverage corresponding to:
*
=k0(l -Q)
where:
ko
k
(3)
= growth rate constant without additive
= growth rate constant with additive
(dm.s'1)
(dm.s1)
substitution of equation 2 and 3 in equation 1gives:
r
— 3 ^ o - - ( l - -
r
^
ads' i
T
) - ( v ^ - «
2
(4)
Both supersaturation and inhibition influence the rate of crystallization (Eq. 1). To study the
influenceofinhibitorsonthecrystallization rate,independentfrom supersaturation, wedefine
rx to evaluate the results of the experiments:
{JiAP-fiQ2
kn.s.\l
\
k
-J^±
^
+1
)
Materials and methods
Experimental set-up
The experiments were performed in a temperature controlled room at 30 + 2°C. The glass
Expanded Granular Sludge Bed (EGSB) reactors had a working volume of 5.71 (150 cm
height, 5 cm i.d.) and were equipped with a reverse funnel phase separator. After passing
the gas through a concentrated sodium hydroxide solution for removing carbon dioxide and
through a column filled with soda lime pellets with indicator, methane was monitored by a
wet gasmeter. Three reactors were operated. All reactors were fed with amixture of acetate
and butyrate (1:1 COD). The influent COD concentration was 5.3 gCOD.l'. The applied
hydraulic retention time (HRT) was 20 hours.
The influence ofphosphate on theextent of CaC03 deposition was studied in reactor Rl and
58
(5)
Influenceofphosphate andiron
R2. Both reactors were supplied with different levels of phosphate in the influent, ranging
from 0-30 mgP.l"1. Phosphate was supplied as KH2P04. The influent of reactor Rl was
neutralized with Ca(OH)2, resulting in an influent calcium concentration of 1200 mgCa.l"1.
Reactor R2 was neutralized with 600mgCa.l"1 and 630mgNa.l"1. Both reactors were seeded
with anaerobic sludge originating from lab scale UASBreactors. This sludge had ahigh ash
content (80-90%) and a moderate activity, 0.5 gCOD.gVSS'.d"1.4 The sludge was crushed
with ahandblender (Multiquick 350 combi, Braun) under anaerobic conditions. The amount
of sludge added in each reactor was 600 ml, containing 75 gVSS. To fluidize the heavy
sludge, an upflow velocity of 24 m.hr"1 was applied by recirculation (ratio 1:140).
Reactor R3 was used to study the influence of iron on the extent of CaC0 3 deposition. For
this purpose, several concentrations of iron were supplied in the influent, ranging from 0 500 mgFe.l"1. Iron was dosed as FeCl2. Calcium and sodium were added in concentrations
of 600 and 630 mg.l"1 respectively. Reactor R3 was seeded with anaerobic granular sludge
from Industriewater Eerbeek B.V., the Netherlands. Theash content of this sludge was15%
and the activity 0.7 gCOD.gVSS'.d"1. The amount of sludge added to reactor R3 was 1.51,
containing 125gVSS. Inorder toexpand the granular sludge, anupflow velocity of 7m.hr"1
was applied by recirculation (ratio 1:40).
The calcium, phosphate and iron concentrations and the pH of the influent and the effluent
were regularly measured during operation, as well as the pC0 2 of the biogas.
Medium
The mineral medium used was described elsewhere.4 The doses of phosphate and iron
fluctuated in time for the three reactors and are indicated in the text and figures.
Analytical Methods
Analysesof VolatileFatty Acids(VFA),biogascomposition (CH4, C0 2 and N2), calciumand
phosphorus were described elsewhere.4 Iron was analyzed by AAS according to standard
methods.21 X-ray diffraction analysis was performed using a Guinier camera and CokA
radiation.
Modelling
A chemical equilibrium model was developed to calculate the speciation in the anaerobic
reactor. Activity coefficients werecalculated according toDaviesandcalculationsweremade
by iteration, using the multivariable method of Newton-Rhapson.22
59
Chapter4
Input parameters for themodel are CODof the influent and the effluent (gCOD.l1), sodium
(M), calcium (M), chloride (M) and the TOC/COD ratio of the substrate. It was assumed
that all converted COD was used for the production of methane, consequently the yield of
biomass was neglected. The ratio TOC/COD allows topredict the average oxidation stateof
organic carbon in the waste water, and from that the specific amount of methane and
carbondioxide produced can be calculated.3 Mass balances for electroneutrality, sodium,
chloride, calcium, acetic acid, inorganic carbon, methane and gas were used. The last
balance was introduced to calculate the speciation of inorganic carbon in the gas and liquid
phase. It was assumed that methane and carbondioxide are the only components of the
gaseous phase. Considered species in the model are H + , OH", Na + , Ca2+, CI", HAc, Ac",
H2C03, HCO3-, C0 3 2 , C02gas, CH4gasand Vg' (total gasvolume), thecomplexes CaC03°and
CaHC03+ and thesolidphase CaC03. For used equilibrium constants isreferred toPlummer
and Busenberg.13
Results
Influenceofphosphate on CaC03deposition
ThereactorsRl and R2wereoperated atanorganicloading rate of 6-8 gCOD.l'.d"1. During
thetime of operation (150days), aCODremoval efficiency of 90-95% wasobtained. Based
on model calculations with measured input parameters and assuming thermodynamic
equilibrium (pKspCaC03=8.4), calcium concentrations of 265 ± 35 and 42 ± 13 mgCa2+.l"'
are to be expected in the effluent of Rl and R2 respectively. However, considerable higher
concentrations of calcium were found in the effluent of both reactors, up to 748 and 276
mg.l"1 for Rl and R2 respectively. The extent of calcium carbonate precipitation turned out
todependonthephosphatedosage. Thehighertheconcentration ofphosphate inthe influent,
the less calcium carbonate precipitated. This clearly demonstrates that the presence of
phosphatedrastically reducesthecalciumcarbonate deposition, especially inreactor Rl (Fig.
1). In reactor R2, the amount of precipitation fluctuated considerably at phosphate dosages
of 15mgP.l"1 (Fig. 1).To explain thisphenomenon, itneeds tobe considered that inhibition
of calcium carbonate growth is likely caused by the soluble phosphate concentration in the
reactor. Due to phosphate removal, the reactor phosphate concentration is much lower than
the influent concentration (Fig. 2). So, at an initial phosphate dosage of 15 mgP.l'1, the
amount of phosphate in the effluent of R2 fluctuated from 3 to 5 mgP.l"1 (Fig. 2). This
explains the variance in extent of calcium precipitation at a phosphate dosage of 15mgP.l"1
(Fig. 1). Calculation of the apparent solubility of calcium carbonate in the reactors
60
Influence ofphosphate andiron
(pIAP CaC03 ) allows a comparison of the extent of phosphate inhibition in both reactors. The
results shown in figure 3 clearly reveal that at phosphate levels in the reactors between 0.5 5 mgP.l"', the apparent solubility of calcium carbonate is equally increased in both Rl and
R2. Phosphate can thus be effectively used in practice to diminish the extent of calcium
carbonate precipitation in anaerobic digestors.
0
5
10
15
Q.
O
CD
Q.
A
A
600
s
P
'o
400
AA
A *
4
A
A
A
A A
O
A
20
25
3
R2
A
A*
A
A
A*
A
200
±A
•
n
,
•
10
5
15
20
'
•
25
30
Phosphate influent (mgP/l)
Figure 1. Measured amount of calcium precipitation for Rl (•) and R2 (A)and
calculated maximal amount of precipitation (at pKsp=8.35) for Rl (•) and R2 (A)as
function of the phosphate concentration in the influent.
•
c
Q)
0)
(D
nj
-C
Q.
•
A
— 3
A
D.
O)
E
A
A
%.
A
•
•
2
</)
O
AA
.
..».•
'
'
'
•
10
15
20
25
30
Phosphate influent (mgP/l)
Figure 2. Phosphate concentration in the effluent as a function of the phosphate
concentration in the influent as measured for Rl (•) and R2 (A).
61
Chapter4
8.5
O
1
CO
<D
8
8
7 5
££> A
• AA
A
A-• ••mm-
• •
-
A
0.°
<
•
A
A
A
im
A
. . ..£•.
•
Q.
6.5
A
'
1
2
3
A
*
A
A
4
Phosphateeffluent (mgP/l)
Figure3. Measured ionicactivityproduct(IAP)ofCaC03 inreactorRl (•) andR2
(A)as a function of the total concentration of phosphate in the effluent (= reactor
concentration).
The pH in the reactors Rl and R2 was dependent on the extent of precipitation that took
place. The lower the amount of precipitation, the higher was the pH. In Rl, the pH ranged
from 6.5 to 7.1 and in R2 from 6.9 to 7.5.
The sludge was analyzed by X-ray diffraction analysis at the termination of the experiment.
The mineral fraction of the sludge from Rl an R2 consisted mainly of calcite, a minor
fraction ( < 1%) consisted of monohydrocalcite. Crystalline calcium phosphate polymorphs
were not detected.
Calculationof theadsorptionconstant,k^, and the crystalgrowth rate constant,k0'
Incase adsorption ofphosphate atthegrowth sites of thecrystal would affect the growthrate
of calcite, the inhibiting effect of phosphate can be described by an adsorption isotherm
according toLangmuir.12 Several ionicphosphate speciesmight adsorbtothe crystal surface,
but in case of calcite, the complex CaHP04° was recently found to be the most likely
adsorbing and inhibiting specie.23 Assuming CaHP04° to be the adsorbing specie, both the
adsorption constant (k,ds) and the growth rate constant at zero inhibition (ko'=ko.s) can be
calculated according to equation 5 with a non-linear least square fit method (Fig. 4). The
calculated values for the adsorption constants, kads, for reactors Rl and R2 amounted to
1.2*106 l.mol"1 and 7.5*105 l.mol'1 respectively, and the values of the crystal growth rate
constant at zero inhibition, ko', amounted to 223 for Rl and 95 l.mol'1.s'1 for R2.
62
Influenceofphosphateandiron
1000
R1
100
r
10
•••••Ba-jp---
(H
•
C\J
"h.
1
H
DO
DBB
a
•
0)
Q.
<
"""'
-*
0.1
<
1000
0.5
1
1.5
2.5
R2
100, j-»•
ioN-
*4A
i*f
1
0.1
0.5
1
CaHPO 0
* A
A"
1.5
2
2.5
.££..
•*
3
(mgP.r1)
Figure 4. Measured values of rx (Rl (•); R2 (A)) as function of the CaHP04°
concentration andestimated valuesofr„(Rl (D); R2(A))asdetermined withaleast
square linear fit method assuming adsorption according to Langmuir (Eq. 5).
Estimatedvaluesofkads(l.mol'1)are1.2*106(Rl)andT^IO 5 (R2).Estimatedvalues
ofV (l.mol'.s1) are223(Rl) and 95(R2).
Influenceof ironon CaC03deposition
Like reactors Rl and R2, reactor R3 was also operated at an organic loading rate of 6-8
gCOD.l'.d 1 and a COD removal efficiency > 95%. The reactor was supplied with iron
concentrations in the influent ranging from 0-500 mgFe.l"1 (Table 1). The results in Table
1 reveal that dosage of iron in the range 20-50 mgFe.l"1 did not significantly decrease the
amount of calcium carbonate precipitation. Onlydosageof 500mgFe.l"1 resulted inadistinct
decrease of the calcium carbonate precipitation. However, on the basis of calculations with
the equilibrium model, it was found that this effect could not be attributed to an inhibitory
effect of iron, but that it was due to removal of carbonate by precipitation of FeC0 3 , with
an apparent solubility of 10"90mol2.l"2. The results inTable 1show that iron, in contrast to
phosphate, hardly influences the apparent solubility of calcium carbonate inthe reactor, and
thus is not a proper additive to diminish the extent of calcium carbonate deposition in an
anaerobic reactor.
63
Chapter 4
Table 1.Measured iron and calcium concentration of the influent and the effluent
ofreactor R3during periods inwhich theinfluent iron concentration wasvaried
andtheapparent solubility product of calcium carbonate inthereactor(=IAPCaC03).
Iron
influent
mgFe.l"'
Iron
effluent
mgFe.l"1
Calcium
influent
mgCa.l'1
Calcium
effluent
mgCa.l-1
pIArCaC03
Period:
I
(n=3)
0
0.2± 0.1
542± 8
123± 9
571+ 18
78+12
8.0 ±0.1
88± 3
7.9 +0.1
II (n=4)
22+2
4 ±2
III (n=3)
47+9
3 + 1
IV (n=8) 503+80
V (n=3)
0
50 ±20
2 ±1
573+ 14
528±21
544±4
7.6 +0.0
273+28 7.8+0.1
72+5
8.1+0.0
The sludge characteristics of reactor R3 turned out to be different from Rl and R2. The
mineral fraction mainly consisted of aragonite (85-95%) and only a minor fraction (5-15%)
of calcite. No crystalline siderite or iron-oxides were detected. Reactor R3 was started up
with granular sludge without calcium carbonate. At the end of the experiment, many small
crystals (<0.1 mmi.d.) wereformed and retained inthe sludgebed (Fig. 5). However, and
quite important, no crystals were observed within the granules.
Discussion
Influenceofphosphate on the extentof calciumcarbonate deposition
The results of this study reveal that the crystallization of calcium carbonate in an anaerobic
reactor isseverely inhibited atphosphate concentrations inthe range0 . 5 - 5 mgP.l' (Fig. 3).
Atphosphate concentrations exceeding 4 mgP.l'1, the apparent solubility product of calcium
carbonate in the reactors (10 66 - 10'71) even approached the value as measured for
amorphous calcium carbonates (10'65)15 (Fig. 3). This indicates that amorphous calcium
carbonate was formed under all conditions as applied during our experiments, but that the
rate limiting step, being the transformation to calcite, was severely inhibited by thepresence
of phosphate. The calculated adsorption constants, kads, for reactor Rl and R2were 1.2*106
l.mol"1and7.5*105 l.mol"1 respectively, which isslightly higher thanthevalue2.l*105l.mol"1
asfound inearlier phosphate adsorption experiments withcalcite.'' However, Hartley et al.''
calculatedkadsassumingthatthesumofallphosphate species isinhibitory. Asthe adsorption
64
Influenceofphosphate andiron
of phosphates significantly increases at increasing calcium concentrations in solution, k ^
values can only be compared by selecting the proper inhibiting species, i.e. neutral species
(CaHP04°) for calcite.23 The estimated values of V were 223 for Rl and 95 l.mol-'.s"1 for
R2. A difference in V values can easily occur because the measured rate constant, k„\ is
a combination of koand s. Theoretically, kois a constant, but the reaction site density (s)
might vary in Rl and R2 because of the different supersaturation, due to i.e. different
influent calcium concentrations.24
Figure 5. Overview of the morphology of the sludge bed in R3 after 100daysof
operation. Intact granular sludge is present, together with retained freshly formed
crystalparticles,whichmainlyconsistofaragonite.Nocrystalswereobservedwithin
thegranules. Bar indicates 1 mm.
The importance of the reactive surface area (s) on the kinetics of the CaC0 3 deposition is
also evident from the results as obtained for reactor R3 (Table 1). No iron was dosed to the
reactor at the start and the end of the experiment, and thus the amount of precipitation was
expected to be equal during both periods. However, the calculated pIAPCaC03was different,
being 7.6 at the start of the experiment, when any crystal surface area was absent, and 8.1
at the end of the experiment, when many small crystals were present (Fig. 5). This implies
thattheapparent solubility of CaC03 inanaerobic reactorsdrops significantly inthepresence
of appropriate crystal surface area for growth, which isinaccordance with earlier findings.25
65
Chapter4
Thus, the effect of phosphate on calcium carbonate formation canbe expressed as a function
of the concentration in the reactor, using Langmuir adsorption isotherm models. However,
the influence of the available reactive crystal surface area (s) in the reactor on the kinetics
of the calcium carbonate deposition cannot be quantified with the obtained results.
Influenceof ironon extentof calciumcarbonate deposition
The presence of iron as additive showed no effect on the extent of calcium carbonate
deposition although the contrary wasexpected because it isknown that trace amounts of 10"9
M Fe2+ already inhibit calcite formation.8 Indeed, iron appeared to inhibit calcite formation
inour reactors, asonly 5-15% calcite wasfound inthesludge (compared to99% inpresence
of phosphate asinhibitor). However, during iron dosing, most of the calcium carbonate(8595%) waspresent asaragonite, the growth of which isnot strongly inhibited by thepresence
of iron.12,26 Thus inthe reactors, iron inhibited the formation of calcite, but not of aragonite.
As the solubility of aragonite is only slightly higher than for calcite, iron addition did not
effectively decrease the extent of calcium carbonate formation in the reactors (Fig. 6). In
general, it can be concluded from this result that only additives inhibiting the growth of as
well aragonite and calcite can be used as effective inhibitors during anaerobic digestion.
Phosphate seems to fulfill this requirement according to our results which is in
correspondence with literature data.27
Implicationsfor practice
The results of this study show that phosphate is an effective inhibitor of calcium carbonate
crystallization, and can be dosed in the influent of an anaerobic digester to diminish the
extent of calcium carbonate deposition. However, of the dosed phosphate, only a small
fraction will remain in the reactor solution, because part will be removed by biological
phosphate assimilation, phosphate precipitation and/or coprecipitation (Fig. 2). Further
insight in the phosphate removal processes is needed to optimize the phosphate dosing,
allowing minimal deposition of calcium carbonate to be achieved. Once the remaining
phosphate concentration in the reactor, kads and V can be reliably estimated, the apparent
solubility of calcium carbonate in the reactor can be calculated (Equation 4). Once this
apparent solubility of calcium carbonate can be estimated, also the amount of calcium
carbonate deposition to be expected in an anaerobic digester can be calculated, as will be
shown in a next paper.
66
Influenceofphosphate andiron
Amorphous calciumcarbonate; pKsp = 6.5
h
P
Vaterite;pKsp = 7.9
+-
W
Aragonite;pKsp = 8.2
\ f P- I-Fe
4
P + Fe
V P
Calcite;pKsp = 8.4
Figure 6. Schedule of calcite formation and inhibition byphosphate and iron inan
anaerobic reactor. Amorphous calcium carbonate will be formed once the product
(Ca2+)(C032~) exceeds the value 10"65 mol2.l'2. The recrystallization to the stable
calcitecanbeeither directlyor viatheintermediates vaterite and/or aragonite.The
research inthispaper showedthat phosphate inhibits all crystallization steps,while
irononly inhibits thefinalconversion tocalcite.Thus,dosing of iron resulted inan
accumulation ofaragonite, butdidnotreducetheextentofprecipitation becausethe
solubility of aragoniteisonly slightly higherthanforcalcite.
Conclusions
The influence of the additives phosphate and iron on the extent of calcium carbonate
precipitation was studied during continuous experiments in lab-scale anaerobic expanded
granular sludge bed (EGSB) reactors. Phosphate, at concentrations in the reactor as low as
0.5 - 5 mg total-P.l1, was shown to severely inhibit the extent of CaC0 3 precipitation and
canbe effectively used inpractice tominimize CaC03 deposition in anaerobic digestors. On
the contrary, iron did not effectively inhibit the deposition of CaC0 3 . This was shown tobe
due to the fact that iron, incontrast to phosphate, only inhibits the growth of calcite and not
the formation of aragonite. From this results it can be concluded that only additives,
inhibiting the formation of both aragonite and calcite can be used as effective inhibitors
during anaerobic digestion.
Adeveloped chemical equilibrium modelwasshowntobeauseful tooltocalculatetheextent
of calcium carbonate deposition during anaerobic digestion once the proper apparent
67
Chapter4
solubility product of calcium carbonate can be estimated. The apparent solubility of CaC0 3
was shown to be dependent on at least two kinetic factors: (1) the phosphate concentration
in the reactor and (2) the available reactive crystal surface area for growth. The kinetics of
calcium carbonate formation due to phosphate inhibition in an anaerobic reactor can be
approached with a Langmuir adsorption isotherm model.
Acknowledgements
Financial support by the Dutch government (NOVEM), Borculo Whey Products Coop., DHV
Water BV, Haarmann & Reimer Ltd., Industriewater Eerbeek BV, KNP-BT NV, Paques
BV, Roermond Papier BV and the Coop. Suiker Unie U.A. is highly appreciated. The
authors thank Camillo Schure for conducting part of the experimental work and Adrie
Veeken for his help in preparing the chemical equilibrium model.
References
1.
2.
3.
4.
5.
6.
7.
8.
9.
10.
11.
68
Habets LHA &Knelissen HJ (1997) Inlinebiological water regeneration in azero discharge
recycle paper mill. Wat. Sci. Technol. 3541-48.
El-Mamouni R, Guiot, SR, Mercier P, Safi B&Samson R(1995) Liming impacton granules
activity ofthemultiplate anaerobic reactor (MPAR) treating wheypermeate. BioprocessEng.
12 47-53.
Keenan PJ, Isa J & Switzenbaum MS (1993) Inorganic solids development in a pilot-scale
anaerobic reactor treating municipal solid waste landfill leachate. Wat.Environ. Res. 65181188.
Langerak EPA van, Gonzalez-Gil G, van Aelst A, van Lier JB, Hamelers HVM & Lettinga
G (1998) Effects of high calcium concentrations on the development of methanogenic sludge
in upflow anaerobic sludge bed (UASB) reactors. Wat.Res. 32 1255-1263.
Svardal K (1991) Calcium carbonate precipitation in anaerobic waste water treatment. Wat.
Sci. Technol. 23 1239-1248.
Marani D, Di Pinto AC, Ramadori R & Tomei MC (1997) Phosphate removal from
municipal waste water with low lime dosage. Env. Technol. 18 225-230.
Reddy MM (1974) Kinetic inhibition of calcium carbonate formation by waste water
constituents. In: Chemistryof WasteWaterTechnologyA.J. Rubin (ed.), 31-58.
Meyer HJ (1984)The influence of impurities on thegrowth rate ofcalcite. J. Crystal Growth
66 639-646.
House WA (1987) Inhibition of calcite crystal growth by inorganic phosphate. J. Coll. Int.
Sci. 119 505-511.
Verdoes D (1991) Calcium carbonate precipitation in relation to detergent performance.
Thesis, Delft University Press, the Netherlands.
Hartley AM, House WA, Callow ME & Leadbeater BSC (1995) The role of green alga in
the precipitation of calcite and the coprecipitation of phosphate in freshwater. Int. Rev. Ges.
Influenceofphosphate andiron
12.
13.
14.
15.
16.
17.
18.
19.
20.
21.
22.
23.
24.
25.
26.
27.
Hydrobiol. 80 385-401.
Gutjahr A, Dabringhaus H & Lacmann R (1996) Studies of the growth and dissolution
kinetics of the CaC0 3 polymorphs calcite and aragonite. II. The influence of divalent cation
additives on the growth and dissolution rates. J. Crystal Growth 158 310-315.
Plummer LN &Busenberg E(1982)The solubilities ofcalcite, aragonite and vaterite in C0 2 H 2 0 solutions between 0 and 90°C, and an evaluation of the aqueous model for the system
CaCO3-CO2-H20. Geochim. Cosmochim.Acta 46 1011-1040.
Kralj D & Brecevic L (1995) Dissolution kinetics and solubility of calcium carbonate
monohydrate. Colloidsand Surfaces. A; Physicochemicaland Engineering Aspects 96 287293.
Brecevic L & Nielsen AE (1989) Solubility of amorphous calcium carbonate. J. Crystal
Growth 98 504-510.
Kabasci S,Althaus W&Weinspach PM(1996)Batchprecipitation ofcalciumcarbonate from
highly supersaturated solutions. Chem. Eng. Res. Design 74A 765-772.
Nancollas GH & Reddy MM (1971) The crystallization of calcium carbonate II Calcite
Growth Mechanism. J. Coll. Int. Sci. 37 824-830.
Kazmierczak TF,Tomson MB&Nancollas GH (1982)Crystal Growth ofcalcium carbonate.
A controlled composition kinetic study. /. Phys. Chem. 86 103-107.
Ogino T, Suzuki T & Sawada K(1990)The rateand mechanism of polymorphic transformation of calcium carbonate in water. J. CrystalGrowth 100 159-167.
BaroneJP, NancollasGH &YoshikawaY (1983) Crystal growth asafunction ofseed surface
area. J. CrystalGrowth 63 91-96.
APHA (1992) Standard methodsfor the Examination of Wasteand Wastewater. American
Public Health Association, New York.
Stumm W & Morgan JJ (1996) Aquatic ChemistryWiley, New York.
SawadaK(1997)Themechanisms ofcrystallization andtransformation ofcalciumcarbonates.
Pure &Appl. Chem. 69 921-928.
Steefel CI & Van Cappellen P (1990) A new kinetic approach to modeling water-rock
interaction: the role of nucleation, precursors and Ostwald ripening. Geochim. Cosmochim.
Acta 54 2657-2677.
Langerak EPA van, Hamelers HVM & Lettinga G (1997) Influent calcium removal by
crystallization reusing anaerobic effluent alkalinity. Wat. Sci. Technol. 36 341-348.
Herzog RE, Shi Q, Patil JN & Katz JL (1989) Magnetic water treatment: the effect of iron
on calcium carbonate nucleation and growth. Langmuir 5 861-867.
MorseJW(1983)Thekinetics ofcalcium carbonatedissolution andprecipitation. In:Reviews
in Mineralogy 227-264.
69
5 Influent calcium removal by crystallization
reusing anaerobic effluent alkalinity
E.P.A. van Langerak, H.V.M. Hamelers & G. Lettinga
Abstract -Waste waters from thewaste paper industry and landfill leachates contain
high calcium concentrations. Treatment of those wastewaters inan anaerobic system
will lead to extensive precipitation of calcium carbonates. Problems due to
accumulation of calcium carbonate in anaerobic reactors can be avoided by applying
acrystallization reactor to remove calcium from the influent. This solution, however,
isexpensivedueto theneed todosealkalinity. Inthispaper, thepossibility of reusing
the produced alkalinity by recirculating anaerobic effluent was investigated. Calculations and experiments were carried out to investigate towhatextent calcium could be
removed from the influent. Experiments werecarried out ina4.5 1 UASBreactor and
a 0.8 1 crystallization reactor, seeded with sand. The influent contained up to 1800
mg.11 calcium and the substrate was acetic acid. Removal of calcium from the
influent could be successfully accomplished. Recirculation of the anaerobic effluent
supplied sufficient bicarbonate alkalinity for crystallization. Consequently, no extra
chemicals (i.e. Na2C03 and/or NaOH) were needed. A chemical equilibrium model,
with adapted pseudo solubility products, isa very useful tool todetermine the proper
recycle ratio of effluent for optimal performance.
Published as: Langerak EPA van, Hamelers HVM & Lettinga G (1997) Influent
calcium removal by crystallization reusing anaerobic effluent alkalinity. Wat. Sci.
Technol. 36 341-348.
71
Chapter 5
Introduction
Anaerobic treatment of waste waters is nowadays widely applied and considered a proven
technology. However, anaerobic treatment of waste waters with high contents of calcium in
the influent may lead to extensive precipitation causing serious operational problems. In the
sludge bed, it may result in channelling and a dramatic loss of methanogenic activity.
Furthermore, scaling of reactor walls and effluent or recirculation pipes can occur.48-9 High
concentrations of calcium are found in several waste waters due to the utilization of lime, a
cheap neutralizing agent.16 High calcium concentrations can also result from the industrial
productionprocesswhichis, for example, thecase for wastepaper industries.7Alsoleachates
from younglandfills containconsiderable amounts of calcium.9 Subject of our research isthe
development of amethod for removal of calcium from the influent by crystallization reusing
anaerobic effluent alkalinity. Influent calcium can be removed in crystallization reactors
(CR), which are widely used for the central softening of drinking water6 and for the removal
of phosphate.13 Crystallization reactors are fluidized bed reactors with grains (i.e. sand) on
which the crystallization of calcium carbonate takes place. The grains have to move freely
in the upward flow of the water toprevent cementation. Proper initial mixing is required to
obtain a metastable state of supersaturation in the solution. Atoo high local supersaturation
will lead to formation of calcium carbonate precipitates in the bulk solution and should be
prevented. To maintain a sufficient reactive surface for crystallization, some of the grown
grains should be removed regularly and replaced by smaller-diameter seeding grains.6Inthe
present paper, the possibility of using a crystallization reactor for removal of calcium from
the influent is studied. To reduce the need of chemicals, theproduced bicarbonate alkalinity
from the anaerobic reactor was used by recirculation of the effluent.
Methods
Experimental set-up
The experiments were performed in a temperature controlled room at 30°C. Two glass
reactors were used: a bioreactor and a crystallization reactor. The bioreactor (UASB-type)
had avolumeof 4.5 1,aheight of 55cm andadiameter of 10cm. Thecrystallization reactor
consisted of two parts; the bottom part had a volume of 0.2 1, a height of 60 cm and a
diameter of 2 cm, and the upper part (for sedimentation) had a volume of 0.6 1,a height of
30 cm and a diameter of 5 cm (Fig.l). The effluent was recycled in order to mix the
bicarbonateproduced inthebioreactor withthecalciumpresent intheinfluent andto fluidize
the grains in the crystallization reactor. The bioreactor was started up with 1.8 litres of
72
Influentcalcium removal
granular sludge with an ash content of 15%, obtained from Industriewater Eerbeek. The
crystallization reactor was started up with sea sand, the particles of which had a diameter
ranging from 0.1 to 0.3 mm. The mineral medium consisted of (g.l"1): NH4C1 (0.75),
MgSO4.7H20 (0.29), NaCl (0.17) and 1ml per litre of atrace element solution according to
Zehnder et. al..18 The substrate used during theexperiment wasacetic acid, neutralized with
Ca(OH)2 and NaOH (Table 1). All chemicals were of analytical grade (Merck AG, Darmstadt, Germany) except the resazurin (Fluka Chemie AG, Buchs, Switzerland). The media
were prepared in tap water.
The reactors were operated for 31 days and sampled twice a week. The experiment can be
subdivided into twoperiods. During period I, the organic loading rate of the bioreactor was
fixed at 11 gCOD.l '.d'1 and the hydraulic retention time at 20 hours. During period II, the
influence of lowering the retention time on the performance of the system was studied. To
apply equal sludge loading rates during both periods, correction took place for sludge yield
during period Iand the organic loading rate was setat 13gCOD.l'.d' 1 during period II. For
further experimental conditions during period I and II is referred to Table 1.
Analysis
Acetateandbiogascomposition wereanalyzed asdescribeelsewhere.5 For measuring soluble
calcium concentrations, effluent samples were filtrated using a membrane filter with a pore
size of 0.45jtm, after which the samples were acidified up to pH 2 with HN0 3 (65%) and
stored at 4°C. For analysis of total calcium, samples of 20 ml were transferred into a
digestion tube, adding 2.5 ml 65% HN0 3 and 7.5 ml 37% HC1and 10ml distilled water.
Next, the mixture washeated for two hours at 80°C, cooled, and diluted with distilled water
in a volumetric flask of 100ml and stored at4°C. Prior to analysis, all stored samples were
diluted with 0.2% lanthan nitrate solution. Calcium was measured by an atomic absorption
spectrometer (Model AA975,Varian, Springvale, Australia) accordingtostandard methods.1
For scanning electron microscopy (SEM) analyses, crystals were air-dried and some were
cleaved. After gold/palladium sputter coating, the crystals were examined on a SEM (JSM
6300F, Jeol).
Modelling
A chemical equilibrium model was used to calculate the amount of calcium carbonate
precipitation in the bioreactor and the crystallization reactor. For each reactor, separate
equilibrium equations and mass balances were formulated (Table 2). Both systems were
73
Chapter5
connected and the equilibrium state of the system could be iteratively calculated with the
Newton Rhapson procedure. Corrections for ionic strength took place, activity coefficients
werecalculated according toDaviesequation.15 For equilibrium equationsand constantsused
is referred to literature.12 Mass balances for electro neutrality, sodium, chloride, calcium,
acetate,methane, gasand inorganiccarbon wereused inthemodel (Table2). Required input
parameters are calcium (M), sodium (M), chloride (M), COD and acetate in the influent
(gCOD.l1); acetate intheeffluent (gCOD.l1), therecycling factor of liquid (Rf=Qr/Qi); the
recycling factor of gas (Rfg) and the TOC/COD ratio. The latter indicates the average
oxidation state of organic carbon in the waste water, from which the specific amount of
methane and carbon dioxide produced can be predicted.17 It was assumed that no substrate
was converted in the crystallization reactor and the gas phase consisted of CH4 and C0 2 .
Table 1.Theflowrates, recycling factors, influent composition, loading ratesof
CODandcalcium, hydraulic retention times and upflow velocities asapplied
during periods IandII.
Period I
Period II
Days 0-24
n=6
Days 24-31
n=3
Influent flow rate, Q, (l.d1)
Recycling flow rate, Qr (l.d1)
Recycling factor, Rf (Qr/Q^) (-)
5.3 + 0.3
279 + 9
53 ± 1
10.7 + 0.1
292 ± 9
27 + 1
Acetic acid in influent (mgCOD.l1)
Calcium in influent (mg.l1)
Sodium in influent (mg.l1)
9100 + 360
1828 ± 63
1058 ± 66
5386 ± 144
1129 + 60
570 + 37
Organic loading rate UASB (gCOD.l '.d')
Calcium loading rate system (mgCa.l'.d 1 )
HRT in bioreactor (hours)
HRT in crystallization reactor (hours)
Vup in bioreactor (m.h"1)
Vup in crystallization reactor (m.h1)
11 + 1
1828 + 100
20 + 1
0.9 ± 0.1
1.5 ± 0.1
38 + 1
13 + 1
2279 ± 105
10 ± 1
0.45 ± 0.05
1.6 ± 0.1
40 ± 0.1
Results and discussion
Systemperformance
The COD removal efficiency of the bioreactor amounted 98%, and no COD was degraded
in the crystallization reactor. The pH in both reactors was 7.1 ± 0 . 1 during period I and
74
Influent calcium removal
slightly lower (7 ± 0.1) during period II. The percentage of C0 2 in the gas phase of the
bioreactor was24and 22%during period Iand II respectively. Thepercentage of C0 2 inthe
gasphaseof thecrystallization reactor wasalways slightly higher by 0.6-0.8%. The removal
efficiency of calcium inthesystem amounted 96and91% during period IandII respectively.
During both periods, the precipitation took dominantly place in the crystallization reactor.
The calcium removal in this reactor was 97-100% of the total removal (Table 3). During
period II, the concentration of suspended calcium carbonate increased strongly. This was
clearly visible in the reactor: all flows were cloudy because of a white precipitate that was
recycled. Unfortunately, anexactbalanceof suspended calciumcarbonate could notbemade
as dispersed matter accumulated on the settler of the UASB reactor. During the sampling
procedure, partof the settled particleswere swirled anddetermined tobe suspended calcium
carbonate intheeffluent. This explains why more calcium wasmeasured intheeffluent than
in the influent of the bioreactor, especially during period II (Table 3).
Table 2. Balancesandequations tocalculate theequilibrium inacombined system
ofabioreactor and acrystallization reactor.
Bioreactor
EN
Na,
CI,
Ca,
Ac,
t-CH4
Vg'
c,
Crystallization EN
reactor
Na,
CI,
Ca,
Ac,
CcH4
Vg*
c,
=0
= [Na],
= [CI],
= [Ca]CT
= [Ac]e/64.02
= l/(Rf+l) * ([COD]r[Ac]c)/64
=0
= ([COD],-[Ac]e)/64 * (16/3*TOC/COD-l)/(Rf+l)
+ [C03]cr+ [HC03]cr+ [H2C03]cr
=0
= [Na],
= [CI],
= l/(l+Rf)*[Ca]i + Rf/(l+Rf)*[Ca]r
= l/(l+Rf)*[Ac] i /64.02+Rf/(l+Rf)*([Ac] r +[HAc] r )
= Rfg*[CH4]g,r
=0
= Rf/(Rf+l)*([H 2 C0 3 ] r +[HC0 3 ] r +[C03] r ) + Rfg*[COJg.r
EN=electro neutrality; t=total; g,i,r,cr=concentration in gasphase, influent, recirculation
flow,effluent CR; Rf/Rf8=recirculation factor liquid phase/gas phase; Vg'=gasbalance
75
Chapter5
Recirulation biogas
Biogas
CH 4 CO2
Recirculation liquid;Qr
Effluent; Q e
Seasand
with CaCO,
Crystallization
reactor
Glass beads
t
r«;«V
Granular sludge
»ipKI Bioreactor
Influent; Q ,
Figure 1. Diagram of the two-reactor system, consisting of a bioreactor and a
crystallization reactor. 1/e(influent/effluent), r (recycled flow) and cr (effluent of
crystallization reactor).
Equilibrium model
Acomparisonbetweentheresultsofcalciummeasurements andcalculations showed thatthey
did not correspond well. Measured concentrations were considerably higher than the
calculated values (Table 3). A better fit between measurements and calculations could be
obtained by adjusting the solubility product of calcium carbonate (pK^) in the model.
Introduction of pK^ values in the range from 7.6 to 7.9 resulted in good correspondence
between measured and calculated effluent values. However, the percentage of precipitation
occurring inthecrystallization reactor (CR%) wasunderestimated when lowervalues ofpIC^
were introduced inthe model (Table 3). Boththe measured concentrations and the measured
calcium removal in the crystallization reactor fitted with model calculations when a higher
pKsP value (0.2 units) was introduced for the crystallization reactor only (Table 3). In this
case, also measured and calculated values for pH and pC0 2 were found to fit very well.
Kineticsof calciumcarbonate deposition
The need to introduce lower pK^ values in the model indicates that thermodynamic
equilibrium wasnotreached inthe system. Thepseudo solubility products reflect the kinetics
of the precipitation and crystallization processes that took place. The Ostwald step rule
76
Influentcalcium removal
postulates thattheprecipitate with thehighest solubility (i.e. the least stablephase) will form
first in a consecutive precipitation reaction.15 In case of calcium carbonate, hydrated
amorphous phases will form first during precipitation from highly supersaturated solutions.2
The amorphous phase, which is generally a fine precipitate with a disordered lattice, will
transform in the metastable polymorphs vaterite or aragonite by recrystallization.
Subsequently, those metastable polymorphs convert (age) slowly into the most stable form;
calcite.15 The last recrystallization step to calcite is considered to be the rate-determining
step." Likely, conversion of metastable polymorphs into calcite was not completed during
our experiments and the solubility we actually measured in the system was a mixture of the
solubility of amorphous calcium carbonate (pKsp=6.5);2, vaterite and calcite (pKsp=7.9 and
8.4 resp.).12 This was confirmed by electron microscopic analysis of the grains. If no
precipitation but only immediate crystallization of calcite takes place on seed grains, which
occurs at metastable levels of supersaturation, needle shaped crystals can be expected.3
However, weobserved atypical "cauliflower structure" for all grains (Fig. 2). This structure
was also observed during the softening of drinking water and assumed to be the result of a
combination of precipitation, crystallization and agglomeration processes.14
Figure 2. SEMpicture ofacleaved grain from thecrystallization reactor, showing
a typical "cauliflower structure". The seed grain (sand) is visible in the core. Bar
indicates 1mm.
77
Chapter 5
The crystallization rate of calcite depends on three factors: 1) the supersaturation 2) the
growth rate constant, which can be dramatically reduced by traces of certain inhibiting
compounds and 3) theavailable surface area for crystal growth.10 Asa large surface area for
crystal growth was available in the crystallization reactor, it is likely that the rate of calcite
formation was higher in this reactor than in the bioreactor. This higher rate could be
simulated with the model by introducing a higher pK^ value for the crystallization reactor
(Table 3).
Influenceof hydraulicretention time
During period II, the overall calcium removal efficiency of the system decreased slightly
(Table 3). However, this decrease can not be attributed to the lower retention time applied
but can be explained by the relatively low sodium alkalinity that was supplied during this
period (Table 1). Due to the presence of less alkalinity, the maximal calcium removal
efficiency decreased, as was calculated at thermodynamic equilibrium conditions (Table 3).
Alsothe fact that higher pKsPvalues had tobeused tofitthe model with the results indicates
that a saturation state closer to equilibrium was achieved during period II, despite the lower
retention time. This is likely tobecaused bythe higher calcium loading rate thatwasapplied
(Table 1), resulting in a higher precipitation rate during period II (103 mgCa.l'.h"1)
compared toperiod I(88mgCa.r'.h'1). Probably, thehigherprecipitation ratealsostimulated
the formation of suspended calcium carbonate in the bulksolution.
Feasibilityof theprocess and themodel
To evaluate the feasibility of influent calcium removal in a crystallization reactor (CR),
reusing anaerobiceffluent, it isof essential importance toconsider thekinetics ofthecalcium
deposition, as will be shown with some examples. Differences in the kinetics can be
simulated in the model by introducing different pseudo solubility products of calcium
carbonate (pK^). In case of thermodynamic equilibrium in both reactors (pKsp=8.4), the
maximal removal of calcium inthe CR isonly 80% and decreases severely when lowerpKsp
values for both reactors are used (Fig.3). However, introduction of Higher pKsp values for
the CR only (reflecting a higher crystallization rate) leads to considerable higher maximal
removal efficiencies of calcium in this reactor, and results in a better calcium removal at
lower recirculation rates (Fig.3). Inpractice, calcium carbonate precipitation canbeallowed
inthe UASB reactor to a certain extent. For example, 90% removal of the influent calcium
inthe CR wouldbe sufficient to keepthe ash content of the sludgebelow 40% during period
I. This90% removal could notbe reached atthermodynamic equilibrium, and would beeven
78
Influentcalcium removal
more difficult if crystallization would occur slower and at the same rate in both reactors.
However, the higher the crystallization rate inthe CRcompared tothe bioreactor, the lower
is the recirculation factor needed for 90% removal of calcium in the CR (Fig.3). At a pK^
of 8.0 for the CR and 7.6 for the UASB, a recirculation factor of 8 is already sufficient to
keep the ash content of the anaerobic sludge below 40%.
Table 3.Average measured valuesofcalcium concentration andcalcium removal atseveral
locations inthereactor systemandaveragecalculateddatawithdifferent solubility productsof
CaC03 (piy.
Period I
Period n
Measured Calculated values
model with varying pKsp
values
Measured Calculated values
values
model with varying P l ^
UASB 8.4
CR8.4
UASB 7.6
CR7.6
UASB 7.6
CR7.8
UASB 8.4
CR8.4
UASB7.9
CR7.9
UASB 7.9
CR8.1
Influent CR
Calcium (mg.l')
soluble
suspended
110
18
54
110
110
133
153
65
120
114
Influent UASB
Calcium (mg.r1)
soluble
suspended
78
9
23
89
76
100
109
52
113
95
19
76
76
100
165
45
102
95
99
89
11
96
62
38
96
100
0
91
100
0
96
65
35
91
39
61
92
100
0
Effluent UASB
Calcium (mg.r')
77
soluble
suspended
19
Ca removal
System (%)'
CR (%)2
UASB (%)3
96
97
3
1
Calcium removal efficiency entire system: (1 - Caen^m/Cai^N) * 100%
Calcium removal in crystallization reactor (CR) (% of total precipitation in system)
3
Calcium removal in bioreactor (UASB) (% of total precipitation in system)
2
Thus for optimal removal of calcium inthe CR, it isvery important to optimize the kinetics
of crystallization in the CR, which can i.e. be achieved by supply of sufficient surface area
for crystal growth. By optimizing the kinetics of crystallization in the CR, the required
recirculation rate for optimal performance can be minimized. The chemical equilibrium
79
Chapter 5
model can be an excellent tool to calculate the proper recirculation factor for optimal
performance once a good estimation of the required pK^ values for both reactors can be
made.
rr
oc
100
o
01
sn
Q.
O
60
a> a .
40
(0
>
n
F
F
CO
ffl
o
^9
D
O
O
20
u
Recirculationfactorliquid (-)
Figure 3.Influence of recirculation factor on thepercentage of calcium removal in
thecrystallizationreactor, ascalculatedwithdifferent valuesofthesolubilityproduct
of calcium carbonate (pK^). Calculations were performed with average data from
period I(Table 1).
Conclusions
Removal of calcium from the influent of an anaerobic reactor can be accomplished using a
combined systemofananaerobicreactorand acrystallization reactor. Almostall thecalcium
(97-100% of the total precipitation) could be removed in the crystallization reactor,
preventing detrimental calcium carbonate accumulation in the anaerobic reactor. By
recirculating theanaerobic effluent, sufficient bicarbonatecanbesupplied for crystallization.
Consequently, no extra chemicals (i.e. Na2C03 and/or NaOH) are needed.
Based on a thermodynamic equilibrium model, only 65-90% of the total precipitation was
expected to occur in the crystallization reactor. Furthermore, calculated effluent
concentrations of calcium were too low when thermodynamic equilibrium was assumed. By
introducing lower and different values of pK^ for both reactors, it was possible to fit the
model with the measured results. The adapted pKsp values used were shown to reflect the
kinetics of the precipitation and crystallization processes that took place. The available
surface area for crystal growth in the crystallization reactor turned out to be an important
factor influencing the kinetics and determining the feasibility of the process. When factors
influencing the kinetics in both reactors can be quantified, proper values of pK^ can be
estimated. Once values of pK^ for both reactors can be predicted, the chemical equilibrium
80
Influentcalcium removal
model is a very useful tool to determine the proper recycle ratio of effluent for optimal
removal of calcium in the crystallization reactor.
Acknowledgements
The authors would like to thank Jeroen Kemper for conducting part of the experimental
work. The contribution of Adriaan van Aelst related to scanning electron microscopy is
greatfully acknowledged as well as the help of Adrie Veeken in preparing the equilibrium
model. Financial support by the Dutch government (NOVEM), Borculo Whey Products
Coop., DHV Water BV, Haarmann & Reimer Ltd., Industriewater Eerbeek BV, KNP-BT
NV, Paques BV, Roermond Papier BV and the Coop. Suiker Unie U.A. is highly
appreciated.
References
1.
2.
3.
4.
5.
6.
7.
8.
9.
10.
11.
APHA (1992). Standard methodsfor the Examination of Wasteand Wastewater. American
Public Health Association, New York.
Brecevic, L & Nielsen AE (1989) Solubility of amorphous calcium carbonate. J. Crystal
Growth98 504-510.
Dirken PJ, Baars ET, Graveland A & Woensdregt CF (1995) Invloed van entmateriaal op
waterontharding in korrelreactoren, een kristallografische benadering van kiemvorming en
kristallisatie. H20 28 497-502 (In Dutch).
El-Mamouni R, Guiot SR, Mercier P, Safi B&Samson R(1995) Liming impact on granules
activity of themultiplate anaerobic reactor (MPAR) treating wheypermeate. BioprocessEng.
12 47-53.
Florencio L, Nozhevikova A, van Langerak A, Stams AJM, Field JA & Lettinga G (1993)
Acidophilicdegradation ofmethanol byamethanogenicenrichment culture. FEMSMicrobiol.
Lett. 109 1-6.
Graveland A, van Dijk JC, de Moel PJ & Oomen JHCM (1983) Developments in water
softening by means of pellet reactors. J. Amer. WaterWorksAss. 75 619-625.
Huster R, Demel I& Geller A(1991) Closing paper mill Whitewater circuits by inserting an
anaerobic stage with subsequent treatment. Wat. Sci. Tech. 24 81-90.
Kennedy KJ, Hamoda MF & Guiot SG (1988) Anaerobic treatment of leachate using fixed
film and sludge bed systems. J. WaterPollut. ControlFed. 60 1675-1683.
Keenan PJ, Isa J & Switzenbaum MS (1993) Inorganic solids development in a pilot-scale
anaerobic reactor treating municipal solid waste landfill leachate. Water. Environ. Res. 65
181-188.
Nancollas GH &Reddy MM (1974) Crystal growth kinetics of minerals encountered inwater
treatment processes. In: Aqueous environmental chemistry of metals. A.J. Rubin Ed. (Ann.
Arbor Science Publishers, Inc.).
Ogino T, Suzuki T & Sawada K (1990). The rate and mechanism of polymorphic
81
Chapter 5
12.
13.
14.
15.
16.
17.
18.
82
transformation of calcium carbonate in water. J. Crystal Growth 100 159-167.
Plummer LN&Busenberg E (1982)The solubilities of calcite, aragonite andvaterite in C O r
H20 solutions between 0 and 90°C. Geochim. Cosmochim.Acta 46 1011-1040.
Seckler MM, Bruinsma OSL & Van Rosmalen GM (1996) Phosphate removal in a fluidized
bed I. Identification of physical processes. Wat.Res. 7 1585-1588.
Stroom J (1995) Hardheidsreductie van water. De Ingenieur 11 23-25 (In Dutch).
Stumm W & Morgan JJ (1996)Aquatic Chemistry. Wiley, New York.
Svardal K & Kroiss H (1988) Neutralization in anaerobic waste water treatment. In: Fifth
international symposium on anaerobic digestion. May 22-26 1988, Bologna, Italy pp. 335340.
Svardal K (1991) Calcium carbonate precipitation in anaerobic waste water treatment. Wat.
Sci. Tech., 23 1239-1248.
Zehnder AJB, Huser BA, Brock TD & Wuhrmann K(1980) Characterization of an acetatedecarboxylating, non-hydrogen-oxidizing methane bacterium. Arch. Microbiol. 124 1-11.
6 Phosphate removal and kinetics of
CaC0 3 precipitation in
anaerobic reactors
E.P.A. van Langerak, H.V.M. Hamelers & G. Lettinga
Abstract - Anaerobic treatment of waste waters with a high calcium concentration
often leads to undesirable precipitation of calcium carbonate. The amount of
precipitation isoften far lessthanexpected based onthermodynamic equilibrium. The
aims of the present research were to gain insight in the factors that determine the
apparent solubility of calcium carbonate and todevelop models thatpredict theextent
of precipitation, which would be of great help in the_ design of systems for the
anaerobic treatment of high calcium waste waters. As it is known that the
precipitation kinetics and the apparent solubility of calcium carbonate are strongly
dependent on the phosphate concentration, this study also focusses on the phosphate
removal mechanisms occurring inananaerobic treatment system. Phosphate removal
in an anaerobic reactor was found to take place by biological P-assimilation, coprecipitation and precipitation of the calcium phosphates ACP or OCP. This implies
that phosphate should be dosed in excess in order to achieve optimal phosphate
inhibition inthe reactor. Theprecipitation rate and the apparent solubility of calcium
carbonate were shown to be dependent on the hydraulic retention time, the
composition of the influent and the crystallization rate constant (k'=k.s). The latter
depends on the phosphate concentration in the reactor and the availability of surface
area for crystal growth. These kinetic parameters could be impeded in a chemical
equilibrium model, which was shown to be a useful tool for prediction of the extent
of calcium precipitation during anaerobic treatment.
83
Chapter 6
Introduction
High concentrations of calcium occur in various industrial waste waters, for instance in the
effluent from the paper industry.8913 Anaerobic treatment of waste waters with a high
calcium content may lead to undesirable precipitation of calcium carbonate in the
reactors.6,15,27 The amount of calcium carbonate precipitation during anaerobic treatment can
be effectively reduced by dosing phosphate,16 because it is an effective inhibitor of calcium
carbonate crystal growth.5'71118'22 The extent of precipitation is one of the major factors
determining the feasibility of anaerobic treatment of high calcium waste waters. Therefore,
it would be of great practical importance for the design of anaerobic systems to develop
models that predict the extent of precipitation. The available equilibrium models up to now
donotconsider kinetic aspects of precipitation, and thereby donot allow aproper estimation
of the apparent solubility product of calcium carbonate.27 As it was often found that far less
calcium usually precipitates than expected based on thermodynamic equilibrium,1617'27'28 a
detailed study on the factors that influence the extent of precipitation is needed.
As mentioned above, the precipitation kinetics and the apparent solubility of calcium
carbonate both strongly depend on thephosphate concentration inthe anaerobic reactor. The
concentration of phosphate in the reactor is usually distinctly lower than in the influent
because part will be removed by biological or chemical mechanisms.16 This implies that
phosphate should be dosed in excess in order to achieve optimal phosphate inhibition in the
reactor. Detailed insight in the phosphate removal mechanisms is thus required for the
control andcalculation of calcium carbonate precipitation inananaerobic reactor. Phosphate
can be removed from the solution by: 1)biological assimilation, 2) precipitation and 3)coprecipitation. Asmethanogenicbacterialcellscontain6-15mgP.gVSS"1,1'24aremoval of 0.08
- 0.54 mgP per gram of COD converted can be obtained (assuming a yield of methanogens
of 0.02 -0.05 g.g'1). With respect to theprecipitation of calcium phosphate, hydroxyapatite
(HAP) is the thermodynamically most stable polymorph, but it is generally assumed that
otherphases suchasdi calcium phosphate dihydrate (DCPD), amorphous calciumphosphate
(ACP) and octa calcium phosphate (OCP) serve as precursor phases.429 In the coprecipitationmechanism, phosphate adsorbstoacalciumcarbonatecrystal lattice. Next, only
a fraction of the adsorbed phosphorus will be incorporated into the growing crystals.1023
The apparent solubility of calcium carbonate thus depends, amongst other factors, on the
presence of phosphate. Also the availability of reactive surface area for crystal growth isan
84
Kinetics ofCaCOsprecipitation
important factor affecting thekinetics ofcalciumcarbonate crystal growth. 2 ' 4 ' 6 Thepresence
of phosphate affects the valueofthecrystallization rate constant, k,which can be estimated
using a Langmuir adsorption model.16 Thecalcium carbonate accumulation rate inan
anaerobic reactor then can be calculated according tothe equation:16
'iadsXi
r
CaCO,
where:
*o •
s
Kte-Ci
r
CaC03
ko
s
kads
Cj
IAP
+ l
( ^ "^ F
= CaC03 accumulation rate
= growth rate constant without additive(P)
= reactive crystal surface area
= adsorption constant
= concentration ofadditive(P)
= ionic activity product (Ca2+)(C032)
= solubility product ofCaC03
(1)
(mol.l'.s 1 )
(dm.s1)
(dm^mol1)
(l.mol1)
(mol.l1)
(mol2.l"2)
(rnol2.!-2)
In order tobeable toestimate the calcium carbonate accumulation rate, the constants ko,s
and kads need tobeestablished, together with the prevailing phosphate concentration inthe
reactor. Thelatter depends ontheinfluent concentration of phosphate andtheextentof
phosphate removed.
Theaimsof this research were (1)togainabetter insight inphosphate removal mechanisms
in ananaerobic reactor, because itenables the prediction ofthe phosphate concentrationin
the reactor, which strongly affects the extent ofcalcium carbonate precipitation and (2) to
establish the relation between precipitation kinetics and apparent solubility of calcium
carbonate such that chemical equilibrium models canbe used to predict theamount of
calcium deposition inananaerobic reactor.
Materials and methods
Experimental set-up
The experiments were performed inatemperature controlled room at30 ± 2°C. The glass
Expanded Granular Sludge Bed(EGSB) reactors used intheexperiments hada working
volume of5.71 (150 cm height, 5cm i.d.) and were equipped with areverse funnel phase
separator. Thebiogasproducedwasscrubbedusingaconcentrated sodiumhydroxide solution
85
Chapter 6
for removing carbon dioxide and through a column filled with soda lime pellets with
indicator, and then the methane was monitored by a wet gas meter. Two reactors were
operated and fed with a mixture of acetate and butyrate (1:1 COD). The influent COD
concentration was 5.3 gCOD.l'. The applied hydraulic retention time (HRT) was 20hours.
Both reactors were supplied with different levels of phosphate (KH2P04) in the influent,
ranging from 0-30 mgP.l"1. The influent of reactor Rl was neutralized with Ca(OH)2,
resulting in an influent calcium concentration of 1200mgCa.l"1. Reactor R2 was neutralized
with 600 mgCa.l"1 and 630 mgNa.l"1. Both reactors were seeded with crushed anaerobic
sludge originating from lab scale UASB reactors. It wasa high ash content sludge (80-90%)
and its activity amounted to 0.5 gCOD.gVSS'.d"1. The sludge was crushed with a
handblender (Multiquick 350combi, Braun)under anaerobicconditions. Ineach reactor, 600
ml of sludge was supplied, containing 75 gVSS. In order to fluidize the heavy sludge
particles, anupflow velocityof24m.hr"1wasapplied (recirculation ratio 1:140).Thecalcium
and phosphate concentrations andthepH of theinfluent andthe effluent, as well asthepC0 2
of the biogas, were measured during operation of the reactors.
Mediumand analytical methods
The mineral medium used was the same as described elsewhere.15 The applied amounts of
phosphate fluctuated intime for thetworeactors and are indicated inthetext and the figures.
AnalysesofVolatileFatty Acids(VFA), biogascomposition (CH4, C0 2 andN2), calciumand
phosphorus were described elsewhere."
Modelling
Achemical equilibrium model was used to calculate the speciation in the anaerobic reactor.
Activity coefficients were calculated according to Davies and calculations were made by
iteration, using the multi variable method of Newton-Rhapson. Adetailed description of the
model is provided in the chapters 4 and 5. For the purpose of the present study, the model
was extended with phosphate species and kinetics of CaC0 3 precipitation.
Results and discussion
Phosphateremoval mechanisms
Reactors Rl and R2 were fed with increasing amounts of phosphate in the influent. The
results on the phosphate removal for Rl are shown in Figure 1. Those obtained for R2
showed a similar trend (data not shown). Biological phosphate assimilation could only
86
Kineticsof CaCOj precipitation
contribute to the removal of 0.5 - 3 mgP.l"1 under the applied conditions, for this it was
assumed that methanogenic bacterial cells contain 6-15 mgP.gVSS"1 ',24 and have a yield of
0.02-0.05 g.g"1. As the phosphate removal was generally much higher (Fig. 1), apparently
precipitation and/or co-precipitation contributed tothe removal. Todetermine whichprocess
(precipitation and/or co-precipitation) and which precipitate (HAP, OCP, ACP or DCPD)
governed the solubility of phosphate in the reactors, calculations were performed with the
equilibrium model for different phosphate species. Results of these simulations were
compared to measured data (Fig. 1). At low phosphate dosage (0 - 10 mgP.1"1), phosphate
concentrations below 1mgP.1'1 were measured inthe effluent. Only part of this removal can
be attributed tobiological assimilation, therest should bedue tothe formation of HAP (Fig.
1), although any HAP could not be detected in the sludge by X-ray analysis. This is in
correspondence with other investigations, where no distinct pattern of CaP was found in
anaerobic sludge.30 The reactor solution appeared to be undersaturated with respect to the
metastablephasesOCP, ACPandDCPD (Fig. 1),which indicatesthatco-precipitation could
have contributed to the P-removal at phosphate dosages up to 10 mgP.l"1.10 At higher
phosphate dosages (10-25mgP.l"1), themeasured phosphate concentrations were within the
range of solubility between OCP and ACP (Fig. 1). The formation and transformation
behavior of calcium phosphates ispH dependent2025'29and asthepH wasnot constant during
the experiments, slight differences in prevailing metastable phases are to be expected.
Phosphate removal mechanisms
Biologicalremoval
and/orcoprecipitation
PrecipitationofACP/OCP
'
C
Q.
to
E
Q.
O
Phosphate influent (mgP/l)
Figure1.Measured(D)andcalculatedconcentrationsofphosphateintheeffluent as
a function of the phosphate concentration in the influent. In the calculations,
determined apparentvaluesofIAPCaC03wereused.Calculationswereperformed with
thesolidphasesDCPD(—),ACP(-uppermarker),OCP(- lowermarker)andHAP
(-••-) for reactor Rl.
87
Chapter 6
Thus, in order to quantify phosphate removal, the biological phosphate assimilation should
be included in the model, together with the precipitating species ACP or OCP. Moreover,
in order to elucidate the importance of co-precipitation at low phosphate dosages, and high
precipitation rates, further research will be needed.
Otherfactors influencingthe extentof calciumcarbonate deposition
To establish which other factors influence the apparent solubility of calcium carbonate, and
thus the extent of CaC0 3 deposition, a calcium balance over the reactor was made:
d[Ca]
= Qin*\Ca\
dt
where:
(2)
Qeffl*[Ca\ffl -V*rCaCQ3
d[Ca]/dt
[Ca]in/out
Q
V
r
caco3
= calcium accumulation rate
= calcium concentration, influent and effluent
= flow
= volume of system
= calcium carbonate crystallization rate
(mol.s'1)
(mol.l1)
(l.s1)
(1)
(mol.l"'.s"1)
Bysubstituting equation 1inequation 2and assuming thatthe carbonate concentration inthe
reactor solution is constant, the following expression for the apparent solubility product of
calcium carbonate is found:
IAP
IAP
\*
{
where:
^K
-
in
4k'-
sp
HRT',
2- + k'K
HRT'
HRT'j
IAP
IAPin
KsP
HRT'
f2
k'
88
2*V^
apparent solubility product of CaC0 3
L ^ ' U influent
l > ' ' - ' 3Jreactor
= solubility product of CaC03
= HRT *f2* [C03]reaclor
= activity correction coefficient
= k.s = crystal growth rate constant
(mol2.l2)
(mol2.f2)
(mol2.l'2)
(mol.s.I1)
(-)
(l.mol'.s 1 )
(3)
Kineticsof CaCOs precipitation
Theapparent solubility ofcalciumcarbonate, IAPCaC03, inthereactor thusdepends onk', the
hydraulic retention time (HRT) and IAPin. The latter is a measure of the composition
(saturation state) of the influent and is defined as the influent calcium concentration
multiplied with the carbonate concentration inthe reactor. The concentration of carbonate in
the reactor depends on the conversions that take place, and is thus not known in advance.
However, by introducing equation 3inthe chemical equilibrium model, theconcentration of
carbonate in the reactor can be calculated iteratively at defined input values of k' (which
depends on the phosphate concentrations and the availability of surface area for crystal
growth) and the hydraulic retention time.
a
8.5
CO
Low P-inhibition; k'=220
O
O
a
O
Q.
<
High P-inhibition; k'=5
Q.
5.5
10
15
20
25
b
1200r*r
0%
25%
High P-inhibition; k'=5
50%
75%
100%
LowP-inhibition; k'=220
5
10
15
20
Hydraulic retentiontime (hours)
r,
o
ns
Q.
O
CD
Q.
m
o
o
0^
25
Figure 2. Simulations for the conditions as applied in reactor Rl. (a) Apparent
solubility product of calcium carbonate (pIAPCaC03) as function of the hydraulic
retentiontime(HRT)forhigh(k'=5)andlow(k'=220)inhibitionbyphosphate,(b)
Calcium concentrations in the effluent (also expressed as % of maximal possible
precipitation) as function of the hydraulic retention time for high (k'=5) andlow
(k'=220) inhibition byphosphate.
89
Chapter 6
Linking kineticsand apparent solubility
With equation 3, it now becomes possible to predict the apparent solubility of calcium
carbonate (IAPCaC03) in the reactor as a function of the hydraulic retention time and growth
rate constant of calcium carbonate. This expression thus gives the desired link between the
kineticsof precipitation andthe apparent solubility of calcium carbonate. As anexample, we
calculated the apparent solubility of calcium carbonate for the influent conditions as applied
inRl atdifferent hydraulic retention times (0-25hours) and atdifferent degrees of inhibition
byphosphate. For lowphosphate inhibition, weusedk'=220 and for high inhibitionk'=5. 16
Fig. 2a shows the apparent solubility of calcium carbonate as a function of the hydraulic
retention time and Fig. 2b shows the corresponding calculated calcium levels inthe effluent
and the percentage of maximal possible precipitation. At low inhibition by phosphate
(k'=220), thepIAPCaC03sharply increases during the first hour (Fig. 2a), within which70%
of themaximal precipitation already takesplace (Fig. 2b). Thecalculated apparent solubility
of calcium carbonate after 25 hours amounts 10'8 mol2.l"2, which is in correspondence with
earlier observations.16 This example shows that, even in absence of inhibitors, a very long
retention time (> >25 hours) is required to reach complete thermodynamic equilibrium
(pIAP=8.4). Inthepresence ofphosphate (k'=5), the increase of pIAPCaC03intime ismuch
slower. Now only 60% of the maximal precipitation will take place within a retention time
of25hours. ThepIAPCaC03isthen about 7, which isincorrespondence withearlier measured
values as well.16
The results from this research enable the prediction of the extent of precipitation, once the
characteristics of the waste water are known. Besides inhibitors, also the retention time has
animportant influence ontheextent ofprecipitation, especially inthepresence ofphosphate.
To improve the model, it is recommended to establish a quantitative link between k' (k.s)
and the phosphate concentration in the reactor (Eq. 3), which will allow an iterative
calculation of k' once the phosphate concentration in the reactor is known.
Conclusions
In order to obtain phosphate concentrations in an anaerobic reactor medium which provide
optimal inhibition of calcium carbonate crystal growth, it is generally necessary to dose
excess phosphate to the waste water because phosphate will be eliminated from the solution
by biological P-assimilation, co-precipitation and precipitation of calcium phosphates.
Amorphous calcium phosphate (ACP) and octa calcium phosphate (OCP) were shown to be
90
Kineticsof CaCOj precipitation
the most likely calcium phosphate polymorphs to be considered. Co-precipitation of
phosphate seems to occur at relatively low dosing of phosphate, 0-lOmgP.l"1, ( = at high
precipitation rates), but to quantify its contribution, more research is needed.
The precipitation rate and the apparent solubility of calcium carbonate were shown to depend
on the hydraulic retention time, the composition of the influent and the crystallization rate
constant ( k ' = k . s ) . The latter depends on the phosphate concentration in the reactor and the
availability of surface area for crystal growth. These kinetic parameters could be impeded
in a chemical equilibrium model, which was shown to be a useful tool for prediction of the
extent of calcium precipitation during anaerobic treatment.
References
1.
2.
3.
4.
5.
6.
7.
8.
9.
10.
11.
12.
13.
Alphenaar PA, Sleyster R, Reuver P de, Ligthart GJ & Lettinga G (1993a) Phosphorus
requirement in high-rate anaerobic waste water treatment. Wat. Res. 27 749-756.
Barone JP, Nancollas GH & Yoshikawa Y (1983) Crystal growth as a function of seed
surface area. J. CrystalGrowth63 91-96.
Brecevic L & Nielsen AE (1989) Solubility of amorphous calcium carbonate. J. Crystal
Growth98 504-510.
Christoffersen J, Christoffersen MR, Kibalczyc &Andersen FA (1989) Acontribution tothe
understanding of the formation of calcium phosphates. J. Crystal Growth 94 767-777'.
Dove PM & Hochella MF (1993) Calcite precipitation mechanisms and inhibition by
orthophosphate: In situ observations by Scanning Force Microscopy. Geochim.Cosmochim.
Acta. 57 705-714.
El-Mamouni R, Guiot SR, Mercier P, Safi B&Samson R (1995) Liming impact on granules
activity ofthemultiplate anaerobicreactor (MPAR)treating wheypermeate. BioprocessEng.
12 47-53.
Gratz AJ & Hillner PE (1993) Poisoning of calcite growth viewed in the atomic force
microscope (AFM). J. CrystalGrowth 129789-793.
Habets LHA & Knelissen HJ (1997) In line biological water regeneration in zero discharge
recycle paper mill. Wat. Sci. Technol. 3541-48.
Habets LHA, Hooimeijer A&Knelissen HJ (1997) Inlinebiological process water treatment
for zerodischarge operation atrecycled fibre board mills. Pulp &PaperCanada98 184-187.
House WA & Donaldson L (1986) Adsorption and coprecipitation of phosphate on calcite.
J. Colloid and Interface Sci. 112 309-324.
HouseWA (1987) Inhibition of calcitecrystal growth by inorganicphosphate. J. Colloidand
Interface Science 119 505-511.
House WA (1990) The prediction of phosphate coprecipitation with calcite in freshwaters.
Wat. Res. 24 1017-1023.
Huster R, Demel I& Geller A(1991) Closing paper mill Whitewater circuits by inserting an
anaerobic stage with subsequent treatment. Wat. Sci. Technol. 24 81-90.
91
Chapter 6
14.
15.
16.
17.
18.
19.
20.
21.
22.
23.
24.
25.
26.
27.
28.
29.
30.
92
Langerak EPA van, Hamelers HVM & Lettinga G (1997) Influent calcium removal by
crystallization reusing anaerobic effluent alkalinity. Wat. Sci. Technol. 36 341-348.
Langerak EPA van, Ramaekers H, Wiechers J, Veeken A., Hamelers HVM & Lettinga G.
(1998a) Impact of location of CaC0 3 precipitation on the development of intact anaerobic
sludge. Submitted. Chapter 3 of this thesis.
Langerak EPA van, Beekmans MMH, Beun JJ, Hamelers HVM & Lettinga G (1998b)
Influence of phosphate and iron on the extent of calcium carbonate precipitation during
anaerobic digestion. Submitted. Chapter 4 of this thesis.
Marani D, Di Pinto AC, Ramadori, R & Tomei MC (1997) Phosphate removal from
municipal waste water with low lime dosage. Env. Technol. 18 225-230.
Meyer HJ (1984)The influence of impurities on thegrowth rate ofcalcite.J. CrystalGrowth
66 639-646.
NancollasGH&ReddyMM(1974)Crystalgrowth kineticsofmineralsencountered inwater
treatment processes. In: Aqueous environmental chemistry of metals. AJ Rubin Ed. (Ann.
Arbor Science Publishers, Inc.).
Nancollas GH, Lore M, Perez L, Richardson C. & Zawacki SJ (1989) Mineral phases of
calcium phosphate. Theanatomical record224 234-241.
Plummer LN &Busenberg E(1982) Thesolubilities ofcalcite, aragoniteand vaterite in C0 2 H20 solutions between 0 and 90°C. Geochim. Cosmochim.Acta 46 1011-1040.
Reddy MM (1974) Kinetic inhibition of calcium carbonate formation by waste water
constituents. In: Chemistryof waste water Technology. AJ Rubin (Ed.), 31-58.
SawadaK(1997)Themechanisms ofcrystallization andtransformation ofcalciumcarbonates.
Pure &Appl. Chem. 69 921-928.
Scherer P, Lippert H & Wolff G (1993) Composition of the major elements and trace
elements of 10 methanogenic bacteria determined by inductively coupled plasma emission
spectometry. Biol. TraceElementsRes. 5 149-163.
Seckler MM, Bruinsma OSL & Van Rosmalen GM (1996) Calcium phosphate precipitation
in afluidizedbed inrelation toprocess conditions: ablack box approach. Wat.Res. 30 16771685.
Stumm W & Morgan JJ (1996)Aquatic Chemistry. Wiley, New York.
Svardal K (1991) Calcium carbonate precipitation in anaerobic waste water treatment. Wat.
Sci. Technol. 23 1239-1248.
Tarre S & Green M (1994) Precipitation potential as a major factor in the formation of
granular sludge in an upflow sludge-blanket reactor for denitrification of drinking water.
Appl. Microbiol. Biotechnol. 42 482-486.
Tsuge H, Yoshizawa S & Tsuzuki M (1996) Reactive crystallization of calcium phosphate.
TransIChemE74A 797'-802.
Uemura S & Harada H (1995) Inorganic composition and microbial characteristics of
methanogenic granular sludge grown in a thermophilic upflow anaerobic sludge blanket
reactor. Appl. Microbiol. Biotechnol. 43 358-364.
7 Discussion andconclusions
Introduction
High concentrations of calcium occur in the waste water of paper-, citric acid-, whey- and
sugar factories5'671114 aswell as inleachates from landfills.121617 During anaerobictreatment
of these waste waters, methane and bicarbonate areproduced. Theproduced bicarbonate can
precipitate with thepresent calcium. Precipitation of calciumcarbonate inanaerobic reactors
often results inundesirable situations, such asthe formation of a too heavy sludge bed, loss
of specific methanogenic activity of the sludge, nutrient deficiency, clogging of discharge
pipes and/or scaling in the aerobic post-treatment system.5'7'11121617'22
Anaerobic treatment of waste waters is a sustainable technology because energy from the
biodegradable organic waste fraction is recovered as methane gas. Therefore, it would be
highly profitable to achieve that this technology also can be applied for high calcium waste
waters, the more so because they will become more abundant in the near future due to
emphasis put on reuse of water and application of closed water circuits, which will result in
more concentrated waste- and process waters.
93
Chapter7
So far, no proper methods were available to predict or reduce the extent of precipitation in
an anaerobic treatment system. Moreover, it also was not clear to what extent precipitation
in an anaerobic reactor can be tolerated because adequate knowledge on the structure and
quality of methanogenic sludges with high calcium carbonate content was lacking. This lack
of knowledge hindered the implementation and application of the anaerobic treatment
technology for high calcium waste waters.
InthisPhDdissertation, weinvestigated thefeasibility ofanaerobictreatmentofwastewaters
with a high calcium content. The development of high ash content sludges was investigated
under varying conditions ofbiomassyield, precipitating quantitiesof CaC0 3 andparticlesize
of the seed sludge. The location of precipitation, e.g. within the aggregates or in the bulk
solution, appeared tobe an important factor determining the structure and quality ofhighash
content sludges. Next, emphasis waspaid totheprediction of the amount of precipitation in
an anaerobic reactor, and options to reduce the extent of calcium deposition were
investigated. It was shown that the amount of precipitation can be calculated using chemical
equilibrium models in which the kinetics of calcium carbonate precipitation is an important
parameter. The extent of calcium deposition can be diminished either by dosing proper
inhibitorsofCaC0 3crystal growth, likephosphate, orbyremoving calciumfrom the influent
by using a crystallization reactor.
Development of high ash content sludge
Impactof amountand locationofprecipitation on the qualityof high ash contentsludge
In chapters 2 and 3, the effects of variable amounts of precipitation and biomass yield were
investigated, both for crushed and intact methanogenic sludge. The amount of precipitation
depends, amongst others factors, on the waste water composition and the presence of
inhibitorsof CaC0 3 crystal growth, asisexplained inchapters4, 5and 6. Thebiomassyield
depends on the amount of COD degraded and the yield coefficient (gVSS.gCOD'), which
varies for different types of COD.13 The ratio between CaC0 3 and biomass accumulation
determines the ash content of the sludge at steady state conditions.
A serious loss of methanogenic activity was found during the development of high ash
content intact granular sludge, with feeds consisting of completely acidified substrate
(Chapter 3). However, with a similar acidified feed, but with crushed granular sludge as
seed, a high ash content sludge with still quite satisfactory and stable quality was cultivated
94
Discussionand conclusions
(Chapter 2). Controversies regarding the activity of high ash content sludges were also
observed by other authors.51617
The controversies in methanogenic activity of high ash content sludges can be explained
considering the structure of the sludge, and in particular, the location of the CaC03
precipitates. In case precipitation in the bulk solution predominates, the formed precipitates
can either wash-out or be retained in the reactor. Wash-out of CaC0 3 precipitates was
observed inthe reactors inoculated with crushed sludge (Chapter 2). The wash-out amounted
to 10-20% of thetotalprecipitated amount (Chapter 2, Table2). The CaC0 3precipitates that
were present in thebulk solution and were retained inthe reactor served asnuclei, onwhich
biofilms developed. Any serious drop of specific methanogenic activity did not occur under
these circumstances, although the ash content of the sludge reached values up to 95%.
Apparently, bulk precipitation was favoured by the small particle sizeof the seed sludgeand
as a result, relatively little scaling-in of biomass occurred. This hypothesis was confirmed
by the results as described in chapter 3. Under almost identical conditions, except for
distinctly larger granular seed sludge aggregates, precipitation almost exclusively occurred
within the sludge aggregates and wash-out of precipitates was not observed. This exclusive
precipitation within the aggregates turned out to be very detrimental because the granules
became completely filled-up with calcium carbonate, which seriously impeded the transport
of substrate and products within the granules. Asa result, the specific methanogenic activity
of the sludge rapidly decreased, and this soon resulted in a considerable reduction of the
COD removal efficiency of the system. Calculations with a developed steady-state biofilm
model confirm the findings that the smaller the size of the seed sludge granules, the more
likely will be the precipitation in the bulk solution.
Besides the granular size, also the kinetics of CaC0 3 precipitation were found to affect the
location of the precipitation. The results presented inchapter 4clearly show that thekinetics
of CaC03 precipitation are highly influenced by the presence of phosphate. In the presence
of phosphate, using intact granular sludge as seed, precipitation exclusively occurred within
the aggregates (Chapter 3, reactors R1+R2), whereas under similar conditions, but in the
absence ofphosphate, precipitation tookmainly place inthebulk solution (Chapter 4, reactor
R3, Fig. 5). Those results clearly show that also with intact granular sludge as seed,
precipitation in the bulk solution can predominate when phosphate is absent. Calculations
with the biofilm model confirmed that the more phosphate ispresent, the more precipitation
is expected within the sludge aggregates.
95
Chapter7
Thequality of high ash content sludgethus clearly depends on the location where the CaC03
precipitates. Precipitation in the bulk solution can be considered as favourable for the
development of high ash content sludges, because scaling-in of biomass is then relatively
small and appropriate activity is left. Therefore, it is highly advisable to use the smallest
possible granules for the start up incase of treatment of calcium-rich waste waters. Calcium
carbonateprecipitation inthebulk solution isalsoenhanced atlowphosphate concentrations,
however, the presence of phosphate on the other hand drastically reduces the total amount
of precipitation, as was shown in chapter 4. Whether or not the dosing of phosphate will be
advantageous in practical situations can be evaluated with the models as developed in this
study, because they provide a reasonable prediction of the amount and the location of
precipitation.
Cementation
The results in chapter 2 showed that a high ash content sludge (95%) with appropriate
activity can be cultivated, provided a seed sludge with a very small particle size is used for
start-up. Nevertheless, cementation of the sludgebed ultimately becameaseriousbottleneck
in the operation of the reactors when they were fed with completely acidified waste waters.
Cementation started once the sludge ash content reached high levels (80-95%) and when a
large free crystal surface area was present inthe reactor. Under the applied conditions, e.g.
low upflow velocity, these crystals showed a strong tendency to from one big agglomerate
(Chapter 2, Fig. 5a), which is thermodynamically determined. As a result, channelling and
stagnation occurred inthe reactors and the operation had tobe terminated. Inchapters 2and
3, it was shown that cementation can be effectively retarded by reducing the degree of preacidification. When the waste water contained non-acidified substrate (e.g. glucose), a
significant amount of acidifying bacteria wasgrown indueto their relatively higher biomass
yield than methanogens. As a result, crystal surfaces in the reactor became rapidly covered
with a film of acidifying biomass, and this prevented the crystal agglomeration and thereby
retarded cementation. Moreover, the results in chapter 2 showed that the presence of a
fraction of non-acidified substrate promotes granulation.
Ittherefore canbe concluded that a lower degree of pre-acidification is quite favourable for
the treatment of waste water with a high calcium concentration, because it prevents
cementation and promotes granulation. Another possibility to prevent cementation might be
found in application of higher upflow velocities.
96
Discussionand conclusions
Extent of precipitation
Calculation of the amountofprecipitation
The amount of CaC0 3 that precipitates is an important parameter in determining the
feasibility of anaerobic treatment for high calcium waste waters. This quantity is primarily
dictated by the concentrations of calcium and carbonate, which depend on factors like the
waste water composition and the type of conversion reactions proceeding in the system.22
Moreover, the extent of CaC0 3 precipitation is obviously determined by the "apparent
solubility product" of CaC0 3 , which was often found to differ several orders of magnitude
from the theoretical value.1118,22 Consequently, far less calcium usually precipitates than is
expected on the basis of thermodynamic equilibrium.
In this PhD dissertation, we investigated which factors influence the apparent solubility of
calcium carbonate, and developed a model enabling the calculation of the amount of
precipitation during anaerobic treatment. The results in chapter 4 clearly reveal that the
apparent solubility of CaC0 3 depends on the phosphate concentration in the reactor.
Phosphate already was known to be an important inhibitor of calcium carbonate crystal
growth.1019'2021 We found that at concentrations of 5 mgP.l"1 in the reactor, the apparent
solubility product reached values close to 10"65mol2.r2, which corresponds to the solubility
of amorphous calcium carbonate.3 This is in agreement with findings of other researchers,
who also reported that calcium carbonate only precipitates in the amorphous form in the
presence of phosphates.18 It was demonstrated that the value of the crystallization rate
constant, k, depends on the phosphate concentration and canbe estimated using a Langmuir
adsorption model. Moreover, the results in chapters 4 and 5 also showed that the apparent
solubility of CaC0 3 is affected by the available reactive surface area for crystal growth.
In chapter 6, we established a quantitative link between the apparent solubility and the
precipitation kinetics of calcium carbonate. The kinetics of calcium carbonate precipitation
were shown to depend on the hydraulic retention time, the composition of the influent and
on the crystallization rate constant (k'=k.s). The latter depends on the phosphate
concentration and the available reactive crystal surface. A chemical equilibrium model was
developed including these kineticparameters along with equilibrium conditions. This model
proved to be a very useful tool for predicting the extent of calcium precipitation during
anaerobic digestion.
97
Chapter7
Possibilitiesto reduce CaC03precipitation by supplyof inhibitorsof crystal growth
Asmentioned above, the results inchapter 4 revealed that the quantity of calcium carbonate
precipitation in an anaerobic reactor can be drastically reduced by increasing the phosphate
concentration in the reactor. At phosphate concentrations of 0.5 - 5 mgP.T1 in the reactor
medium, the crystallisation rate of calcium carbonate is inhibited to such an extent that far
lessprecipitation occurred than was expected based ona state of thermodynamic equilibrium
(Chapter 6, Fig. 2).Toachievemaximal reduction ofprecipitation, itisadvisabletomaintain
concentrations of > 5 mgP.1"' in the anaerobic reactor medium. Crystallization of calcite is
then completely prevented, and the apparent solubility of calcium carbonate in the reactor
approaches the value for amorphous calcium carbonate (pKsP=6.5). In order to realise such
ahigh concentration in the reactor, it will be necessary todosephosphate inexcess, because
phosphate removal will occur by biological P-assimilation1 and by co-precipitation9 and/or
precipitation4 of calcium phosphates. Investigations in chapter 6 showed that amorphous
calcium phosphate (ACP) or octa calcium phosphate (OCP) were the most likely calcium
phosphate polymorphs to consider.
In addition to phosphate, other additives, e.g. iron, are mentioned in the literature that can
inhibit the formation of calcium carbonate.819,20 However, the results presented inchapter 4
revealed that addition of iron salts was not effective in reducing the extent of calcium
carbonate precipitation during anaerobic treatment. The reason for the absence of a clear
effect could be attributed to the fact that iron only inhibits the formation of calcite and not
that of aragonite, which was predominantly formed in the sludge bed. As a matter of fact,
it canbe concluded that only additives inhibiting the formation of both aragonite and calcite
aresuitablefor reducingtheextentofcalciumcarbonateprecipitation inananaerobic reactor.
Reductionof CaC03precipitation by removalof calciumfrom theinfluent
Besides by adding inhibitors, an alternative solution to reduce the extent of precipitation in
an anaerobic reactor can be found in removal of calcium from the influent. As shown in
chapter 5, a crystallisation reactor placed in front of the anaerobic reactor represents an
attractive option for removal of calcium from the influent. By recirculation of the effluent,
sufficient bicarbonate could be supplied for the precipitation of a significant fraction of the
present calcium. In this way, no extra chemicals (e.g. Na2C03 and/or NaOH) were needed.
Thecalcium removal efficiency of the crystallisation reactor was much higher than expected
on the basis of calculations as carried out with an equilibrium model as developed for the
two-reactor system. This can very likely be attributed to more favourable precipitation
98
Discussionand conclusions
kinetics inthecrystallisation reactor becauseofthepresence ofalarge specific crystallization
surface area. Thechemical equilibrium modeldeveloped for atwo-reactor system (bioreactor
plus crystallisation reactor) turned out to be a very useful tool to calculate the calcium
removal from theinfluent. Itenablesthecalculation oftherecycling factor atwhich optimum
calcium removal occurs at minimal dosing of chemicals.
Conclusions and recommendations
Conclusions
Theinsightsgained from the investigations asdescribed inthisdissertation enablethecontrol
oftheprecipitationof calciumcarbonate inanaerobicreactors. Ashcontentsofmethanogenic
sludges up to 90% can be tolerated provided the formed precipitates are not exclusively
located within the aggregates, so that the sludge retains a satisfactory activity. However, on
the other hand, reactors containing heavy sludges suffer easily from operational problems
because cementation of the sludge bed might take place. Cementation of the sludge is
drastically retarded inthepresence of a fraction non-acidified substrate (e.g. glucose) inthe
influent and this represents a possible tool to improve the feasibility of anaerobic treatment
of high calcium waste waters.
The extent of precipitation of calcium carbonate in an anaerobic reactor can be effectively
reduced by adding phosphate, which is an inhibitor of calcium carbonate crystal growth. As
biological assimilation, co-precipitation and precipitation will lead to phosphate removal, it
may be necessary to supply phosphate inexcessto achievemaximal reduction of the amount
of CaC0 3 precipitation. Only additives inhibiting the formation of both aragonite and calcite
are suitable to reduce the extent of calcium carbonate precipitation in an anaerobic reactor.
Another means to reduce, or even prevent, the precipitation of calcium carbonate can be
found in using a crystallisation reactor to remove calcium from the influent.
The amount of calcium carbonate precipitation in ananaerobic reactor canbe estimated with
equilibrium models wedeveloped, which take into account kinetic factors that influence the
apparent solubility of calcium carbonate, e.g. the influent composition, the hydraulic
retention time and the crystallisation rate constant (k'=k.s). The latter factor depends onthe
presence of inhibitors, likephosphate, andontheavailability of crystal surface area (s). Also
the influent calcium removal and location of precipitation can be estimated with developed
models.
99
Chapter7
With respect to the general aim of this dissertation, it can be concluded that with the work
conducted inthisthesis, sufficient insights havebeenprovided for thedesign and application
of integrated anaerobic-physical-chemical technologies which enable the control of the
calcium carbonate precipitation inthe treatment of waste water with a high calcium content.
In the meantime, it has been shown inpractise that anaerobic waste water treatment can be
very successfully applied in closed water circuits with a high calcium concentration.6'7
Recommendations
Although the developed equilibrium models already are very suitable for predicting the
quantity of calcium carbonate precipitation in an anaerobic system, it seems possible and
therefore highly recommended to further improve them, such that phosphate removal and
inhibition canbemorereliably estimated. For this, aquantitative linkbetween k' (=k.s)and
the phosphate concentration in the reactor should be assessed, because this will allow an
iterative calculation of k' once the phosphate concentration in the reactor is known.
Chemicalphosphateremoval inthepost-treatment system, mediated bytheexpulsionof C0 2 ,
deserves special attention, because high levels of phosphate in the final effluent cannot be
tolerated in view of eutrophication problems when discharging such effluents.
In practise, compounds like sulphate and protein are often encountered in waste waters and
production of sulphide and ammonium will take place during anaerobic treatment. As both
compounds will influence the equilibrium in the system, it is highly recommendable to
extent the models with processes of sulphate reduction and degradation of proteins.
References
Seechapter 8.
100
8 Discussie enconclusies
Inleiding
Hoge calcium concentraties komen voor in hetafvalwater vandepapier-, citroenzuur-, weien suikerindustrie5'6'711'4 alsmede in het percolatiewater van stortplaatsen.1216''7 Tijdens
anaerobe zuivering van deze afvalwaters worden methaan en bicarbonaat gevormd. Het
gevormde bicarbonaat kan vervolgens precipiteren met het aanwezige calcium in het
afvalwater. Precipitatie van calcium carbonaat in anaerobe reactoren resulteert vaak in
ongewenste situaties, zoals de vorming van een te zwaar slibbed, verlies van specifieke
methanogene activiteit van het slib, gebrek aan nutrienten, verstopping van afvoerleidingen
en/of kalkafzetting in een aerobe nabehandelingstrap.5,711121617,22
Anaerobe zuivering van afvalwater iseen duurzametechnologie omdat energie uit organisch
afval wordt teruggewonnen als methaangas. Daarom is het van groot belang om er voor te
zorgen dat deze technologie ook kan worden toegepast voor de behandeling van afvalwaters
met een hoog calcium gehalte, te meer daar deze afvalwaters in de nabije toekomst steeds
talrijker zullen worden omdat veelaandacht wordt besteed aanhet hergebruik vanwater. Het
sluiten van waterkringlopen komt daarom steeds vaker voor, wat leidt tot het ontstaan van
geconcentreerde proces- en afvalwaters.
101
Chapter8
Totopheden waren geengeschikte methoden beschikbaar omdemate vanprecipitatie ineen
anaeroob systeem te voorspellen of te voorkomen. Ook was het niet duidelijk tot op welke
hoogte precipitatie in een anaerobe reactor kan worden getolereerd omdat kennis omtrent de
structuur enkwaliteit vanmethanogeen slibmet eenhoogcalciumcarbonaat gehalte ontbrak.
Deze kennisleemte belemmerde de toepassing van de anaerobe zuiveringstechnologie voor
de behandeling van afvalwaters met een hoog calcium gehalte.
Dit proefschrift had tot doel om de geschiktheid van anaerobe zuivering, eventueel in
combinatie met fysische chemische technologieen, vast te stellen voor de behandeling van
afvalwater met eenhoog calciumgehalte. Deontwikkeling vanslibmethogeasgehalteswerd
bestudeerd onder variabele condities quabiomassa aanwas, hoeveelheid CaC0 3 precipitatie
enkorrelgrootte vanhet entslib. Deplaats vandeprecipitatie, t.w. inde aggregaten of inde
bulk oplossing, bleek eenbelangrijke factor te zijn die de structuur en kwaliteit van slibmet
een hoog asgehalte bepaalt. Verder werd aandacht besteed aan de berekening van de
hoeveelheid precipitatie in een anaerobe reactor, en werden verschillende opties onderzocht
omdehoeveelheidprecipitatieteverminderen. Hetbleekdatdehoeveelheidprecipitatiegoed
kan worden berekend met ontwikkelde chemische evenwichtsmodellen, waarin de kinetiek
vandeprecipitatie werd opgenomen omdat dieeencruciale rol bleek te spelen. Demate van
precipitatie bleek te kunnen worden verminderd middels het toevoegen van geschikte
additieven die de kristalgroei van CaC0 3 remmen, zoals bijvoorbeeld fosfaat, of middels
verwijdering van calcium uit het influent met behulp van een kristallisatiereactor.
Ontwikkeling van slib met een hoog asgehalte
Invloed vande hoeveelheidenplaats vanprecipitatie op de kwaliteit vanslib met een hoog
asgehalte
Inde hoofdstukken 2en 3werd deontwikkeling van slib met een hoog asgehalte bestudeerd
onder verschillende conditiesquahoeveelheid precipitatie, biomassa aanwas en korrelgrootte
verdeling van het entslib. De hoeveelheid precipitatie hangt onder andere af van de
afvalwater samenstelling en van de aanwezigheid van remmers van de kristalgroei van
CaC03, zoals werd beschreven in de hoofdstukken 4, 5 en 6. De biomassa aanwas wordt
bepaald door de hoeveelheid CZV die wordt afgebroken en de aanwascoefficient
(gVSS.gCZV1), die varieert voor verschillende typen CZV.13 De verhouding tussen CaC03
en biomassa accumulatie bepaalt het asgehalte van het slib tijdens steady state condities.
102
Discussie en conclusies
Na opstarten van de reactoren met intact korrelslib en voeding met volledig verzuurd
substraat werd eendrastisch verlies vanmethanogene activiteit geconstateerd (Hoofdstuk 3).
Echter, onder vergelijkbare omstandigheden, maar na opstarten vande reactor met vermalen
slib, werd slib gekweekt met een redelijke methanogene activiteit (Hoofdstuk 2).
Tegenstrijdigheden betreffende de activiteit van slib met een hoog asgehalte worden ook
gevonden door andere onderzoekers.51617
Om de verschillen in kwaliteit, en dan met name de activiteit, van slib met een hoog
asgehalte te kunnen verklaren dient de structuur van het slib te worden beschouwd, en dan
met name de locatie van de CaC03 precipitaten. Wanneer precipitatie uitsluitend plaatsvindt
in de bulkoplossing kunnen de gevormde precipitaten uitspoelen of in de reactor
achterblijven. Uitspoeling van CaC0 3 precipitaten werd waargenomen in de reactoren die
geent werdenmet vermalen slib(Hoofdstuk 2). Deuitspoeling bedroeg 10-20% vandetotale
geprecipiteerde hoeveelheid (Hoofdstuk 2, Tabel2). De CaC0 3precipitaten die indereactor
achterbleven bleken te dienen als groeikernen, waarop zich een biofilm ontwikkelde. Een
drastische afname van methanogene activiteit trad onder deze omstandigheden niet op,
ondanks het hoge asgehalte, 95%, van het slib. Deze resultaten lijken erop te duiden dat
precipitatie in de bulkoplossing plaats vindt wanneer een reactor wordt opgestart met kleine
korrels(vermalen slib)alsentmateriaal, watleidttotrelatief weinig inschalingvanbiomassa.
Inderdaad bleek dat het opstarten van de reactor met grotere aggregaten (intact korrelslib)
uitsluitend leidde tot precipitatie in de slibkorrels onder verder vrijwel identieke condities
(Hoofdstuk 3). Deze precipitatie in de korrels bleek zeer nadelig te zijn, de korrels werden
volledig volgebouwd met calcium carbonaat, wat het transport van substraten en produkten
naar en inde korrel ernstig belemmerde. Alsgevolghiervan daaldedemethanogene activiteit
van het slib snel, wat leidde tot een aanzienlijke vermindering van het CZV verwijderingsrendement van het systeem. Berekeningen met het indit onderzoek ontwikkelde steady-state
biofilmmodel bevestigden dat naarmate de korrels kleiner zijn er meer precipitatie in de
bulkoplossing kan worden verwacht.
Naast de korrelgrootte blijkt ook de kinetiek van de CaC0 3 precipitatie in belangrijke mate
te bepalen waar de afzetting plaats zal vinden. De resultaten zoals beschreven in hoofdstuk
4 toonden duidelijk dat de kinetiek van de CaC0 3 precipitatie sterk wordt beinvloed door
fosfaat. In de aanwezigheid van fosfaat, met intact korrelslib als entmateriaal, vond de
precipitatie uitsluitend plaats binnen in de korrels (Hoofdstuk 3, reactor Rl en R2) terwijl
onder vergelijkbare omstandigheden, maar in afwezigheid van fosfaat, de precipitatie
103
Chapter8
voornamelijk plaatsvond in de bulkoplossing (Hoofdstuk 4, reactor R3, Fig. 5). Deze
resultatenlatendusduidelijk ziendat, wanneer fosfaat afwezig is, ooknaopstartenmet intact
korrelslib deprecipitatie indebulkoplossing kanplaatsvinden. Berekeningen methet biofilm
model bevestigen dat naarmate meer fosfaat aanwezig is, er meer precipitatie in de korrels
kan worden verwacht.
De kwaliteit van slib met een hoogasgehalte blijkt dus in hogemate te worden bepaald door
de plaats waar de CaC0 3 precipitatie plaatsvindt. Precipitatie in de bulkoplossing blijkt het
gunstigst voor de ontwikkeling van slib met een hoog asgehalte omdat onder deze
omstandigheden relatief weinig inschaling van biomassa plaatsvindt en voldoende
methanogeneactiviteit vanhet slib wordt behouden. Voor de opstart van anaerobe reactoren
waarin precipitatie kan worden verwacht ishet daarom aante bevelen om gebruik te maken
van zo klein mogelijke korrels als entmateriaal. Om precipitatie in de bulkoplossing te
stimuleren is het tevens aan te bevelen om zo min mogelijk fosfaat te doseren, echter, het
toevoegen van fosfaat leidt juist weer tot een drastische vermindering van de totale
hoeveelheid precipitatie, zoals isbeschreven inhoofdstuk 4. Of het toevoegen van fosfaat al
dan niet aante bevelen is inde praktijk hangt af van de samenstelling van het afvalwater en
de omzettingen die plaatsvinden. Met de ontwikkelde modellen kan zowel een schatting
wordengemaakt van deplaats alsvandehoeveelheid precipitatie, enkan vervolgens worden
afgewogen of het toevoegen van extra fosfaat al dan niet nodig zal zijn.
Verstening
De resultaten in hoofdstuk 2 toonden dat een slibmet een hoog asgehalte, 95%,kan worden
gekweekt met een redelijke activiteit wanneer de reactoren werden opgestart met vermalen
slib als entmateriaal. Echter, verstening van het slibbed bleek uiteindelijk tot zodanige
operationele problemen te leiden dat de experimenten moesten worden gestopt. Verstening
van het slibbed trad op wanneer het asgehalte van het slib waarden bereikte van 80-95%,
waarbij eenzeer groot vrij kristaloppervlak indereactor aanwezig was. Onder detoegepaste
condities, zoals bijvoorbeeld een lage opstroomsnelheid, vertoonden deze kristallen de
neiging om aaneen te groeien tot een groot agglomeraat (Hoofdstuk 2, Fig. 5a). Als gevolg
hiervan ontstonden gemakkelijk voorkeursstromen en raakten reactoren zodanig verstopt dat
ze niet meer bedreven konden worden. In de hoofdstukken 2 en 3 werd aangetoond dat
verstening danig kan worden geremd door de mate van voorverzuring van het influent te
verlagen. Wanneer het afvalwater een fractie onverzuurd substraat bevat (bijvoorbeeld
glucose) zal een significante hoeveelheid verzurende bacterien ingroeien, die een hogere
104
Discussieen conclusies
biomassa aanwas hebben dan methanogenen. Dit heeft tot gevolg dat aanwezig
kristaloppervlak in de reactor snel kan worden bedekt met een laagje biomassa, wat het
aaneengroeien van de kristallen belemmert en daarmee de verstening vertraagd. Bovendien
werd in hoofdsruk 2 aangetoond dat de aanwezigheid van een fractie onverzuurd substraat
de korrelvorming bevordert.
Er kan dus worden geconcludeerd dat een lage mate van voorverzuring gunstig is voor de
behandeling van afvalwater met een hoog calcium gehalte omdat het verstening van het
slibbed voorkomt en leidt tot eenbetere korrelvorming. Een andere mogelijke oplossing om
verstening te voorkomen is het toepassen van hogere opstroomsnelheden.
Mate van precipitatie
Berekeningvande hoeveelheidprecipitatie
De haalbaarheid van de toepassing van de anaerobe zuiveringstechnologie voor de
behandeling vanafvalwaters meteenhoogcalcium gehalte wordt inbelangrijke matebepaald
door de hoeveelheid CaC0 3 precipitatie die op zal treden. Deze hoeveelheid wordt bepaald
door de hoeveelheden calcium en carbonaat in de reactor, die weer afhangen van de
afvalwatersamenstelling en de omzettingen dieplaatsvinden.22 Bovendien wordt demate van
CaC0 3 precipitatie in hoge mate bepaald door de waarde van het "schijnbare
oplosbaarheidsprodukt" van CaC03, dat vaak enkele ordes van grootte blijkt te verschillen
van de theoretische waarde van het oplosbaarheidsprodukt.1118'22 Hierdoor vindt vaak veel
minder precipitatie plaats dan verwacht wordt, uitgaande van het thermodynamische
evenwicht.
Inditproefschrift hebbenweonderzochtwelkefactoren dit schijnbare oplosbaarheidsprodukt
van calcium carbonaat be'invloeden tijdens anaerobe zuivering. Vervolgens werd een model
ontwikkelt waarmee de hoeveelheid precipitatie tijdens anaerobe zuivering kan worden
berekend. De resultaten in hoofdstuk 4 tonen dat het schijnbare oplosbaarheidprodukt van
CaC0 3 in hoge mate wordt bepaald door de fosfaatconcentratie in de reactor. Het was reeds
bekend dat fosfaat een zeer goede remmer is van de kristalgroei van calcium
carbonaat.1019'20-21 Bij een fosfaat concentratie in de reactor van 5 mgP.l"1 benaderde het
schijnbare oplosbaarheidsprodukt de waarde van 10"65 mol2.l~2, wat corresponded! met de
oplosbaarheid vanamorfcalciumcarbonaat.3 Ditisinovereenstemmingmetbevindingen van
andere onderzoekers, die tevens vonden dat calcium carbonaat alleen in de amorfe vorm
105
Chapter8
precipiteert in de aanwezigheid van fosfaat.18 De aanwezigheid van fosfaat in de reactor
be'invloedtde waarde vande kristallisatie-snelheidsconstante, k, die kan worden geschat met
behulp van een Langmuir adsorptie model (Hoofdstuk 4). De resultaten in de hoofdstukken
4 and 5 tonen dat het schijnbare oplosbaarheid van CaC0 3 tevens wordt bei'nvloed door de
aanwezigheid van actieve kristal groeiplaatsen.
Inhoofdstuk 6beschrijven wedekwantitatievesamenhang tussendeschijnbare oplosbaarheid
en de precipitatie kinetiek van calcium carbonaat. De kinetiek van de calcium carbonaat
precipitatie wordtbepaald doordehydraulische verblijftijd, desamenstelling vanhet influent
endewaardevandekristalgroeisnelheidsconstante (k'=k.s). Dezelaatstewordtbepaalddoor
de fosfaat concentratie in de reactor en de aanwezigheid van actieve groeiplaatsen voor
kristalgroei (s). Het ontwikkelde chemische evenwichtsmodel, waarin deze kinetische
parameters kunnen worden opgenomen, blijkt een zeer goed middel te zijn om de mate van
precipitatie in een anaerobe reactor te berekenen.
Verminderingvan de mate van CaCO}precipitatie door het toevoegen van remmersvan
kristalgroei
De resultaten in hoofdstuk 4 toonden dat de mate van calcium carbonaat afzetting in een
anaerobe reactor drastisch verminderd wordt in de aanwezigheid van fosfaat. Bij
fosfaatconcentraties van 0.5 - 5 mgP.l'1 in de reactorvloeistof wordt de kristallisatie van
calcium carbonaat zodanig gehinderd dat veel minder neerslag wordt gevormd dan te
verwachten valt in geval van thermodynamische evenwicht (Hoofdstuk 6, Fig.2). Om een
optimale reductie van de hoeveelheid precipitatie te verkrijgen is het aan te bevelen om
concentraties >5 mgP.l"1 in de anaerobe reactor te handhaven. De kristallisatie tot calciet
wordt dan volledig verhinderd en de schijnbare oplosbaarheid van CaC0 3 in de reactor
benadert dan de waarde van amorf calcium carbonaat (pKsp=6.5). Om deze hoge
concentraties in de reactor te bereiken zou het nodig kunnen zijn om een overmaat fosfaat
tedoseren, omdatfosfaatverwijdering opzaltredenmiddelsbiologische P-assimilatie1encoprecipitatie9 en/of precipitatie van calcium fosfaten4. Het onderzoek in hoofdstuk 6 toonde
aandat amorf calcium fosfaat (ACP) of octa calcium fosfaat (OCP) demeest waarschijnlijke
fosfaat polymorfen zijn die de oplosbaarheid van fosfaat in een anaerobe reactor bepalen.
Naast fosfaat worden in de literatuur andere additieven, zoals bijvoorbeeld ijzer, genoemd
die de vorming van calcium carbonaat remmen.819'20 Echter, de resultaten in hoofdstuk 4
laten zien dat het toevoegen van ijzer de schijnbare oplosbaarheid van calcium carbonaat
106
Discussieen conclusies
tijdens anaerobe zuivering nietbe'invloedt. Deredenhiervoor ishoogstwaarschijnlijk dat ijzer
alleen de vorming van calciet remt, en niet de vorming van aragoniet, dat onder deze
omstandigheden danook ingrotehoeveelheden inhet slibbed werd aangetroffen. Hieruitkan
worden afgeleid dat alleen additieven diezowelde vorming vancalciet alsaragoniet remmen
geschikt zijn om de mate van calcium carbonaat precipitatie tijdens anaerobe zuivering te
verminderen.
Vermindering vande CaC03 precipitatie door calciumverwijdering uit hetinfluent
Naast het toevoegen van additieven om de mate van calcium neerslag te verminderen, kan
worden overwogen om het calcium uit het influent te verwijderen. In hoofdstuk 5 wordt een
reactorconfiguratie beschreven, bestaande uit een kristallisatiereactor en een anaerobe
bioreactor, waarmee het mogelijk bleek om calcium uit het influent te verwijderen. Middels
het recirculeren van effluent kon voldoende bicarbonaat worden verkregen om een
aanzienlijke hoeveelheid calcium uit het influent te verwijderen. Door het toepassen van
effluent recirculatie bleek het niet nodig om extra chemicalien, zoals bijvoorbeeld Na2C03
en/of NaOH, te doseren. Het verwijderingsrendement van calcium inde kristallisatiereactor
bleek aanzienlijk hoger te zijn danverwacht opbasis van berekeningen zoals uitgevoerd met
het evenwichtsmodel dat we ontwikkelden voor het twee-reactor systeem. De oorzaak
hiervoor kan hoogstwaarschijnlijk worden gevonden in het feit dat de precipitatiekinetiek in
de kristallisatiereactor gunstiger was dan inde bioreactor vanwege de aanwezigheid van een
groot specifiek kristaloppervlak met veel groeiplaatsen. Het ontwikkelde chemische
evenwichtsmodel voor dit twee reactor systeem blijkt een zeer nuttig instrument te zijn
waarmee de mogelijkheden tot het verwijderen van calcium uit het influent kunnen worden
bepaald voor verschillende typen afvalwaters. Zo kan bijvoorbeeld met het model de
recirculatiefactor wordenbepaald, waarbij decalcium verwijdering plaatskanvindenmeteen
minimale dosering van extra chemicalien.
Conclusies en aanbevelingen
Conclusies
De inzichten van het onderzoek zoals beschreven in dit proefschrift leiden ertoe dat het
fenomeen "precipitatie in anaerobe reactoren" wordt begrepen en daarmee kan worden
beheerst. Asgehaltes van methanogeen slibtot zelfs 90% kunnen worden getolereerd mitsde
gevormde precipitaten zich niet uitsluitend hebben afgezet in de korrels, zodat het slib een
redelijke activiteit heeft behouden. Echter, reactoren met een zwaar slibbed hebben vaak te
107
Chapter8
kampenmetoperationeleproblemen, omdathetgevaarbestaatdatvoorkeursstromenontstaan
endatuiteindelijk verstening vanhet slibbed optreedt. Risico's metbetrekking tot verstening
vanhet slibbed worden drastisch verminderd inde aanwezigheid van een fractie onverzuurd
substraat (bijvoorbeeld glucose) in het influent.
De mate van CaC0 3 precipitatie in een anaerobe reactor kan effectief worden verminderd
door het toevoegen van fosfaat, een additief dat de kristalgroei remt. Omdat biologische Passimilatie, coprecipitatie en precipitatie zullen leiden tot gedeeltelijke verwijdering van het
fosfaat kan het nodig zijn om een overmaat fosfaat te doseren om een optimale reductie van
de hoeveelheid CaC0 3 neerslag te verkrijgen. Alleen additieven die zowel de vorming van
calciet alsvanaragoniet remmenzijn geschiktomde hoeveelheid calciumcarbonaat neerslag
in een anaerobe reactor te verminderen. Een andere manier om de hoeveelheid neerslag te
verminderen, of zelfs volledig te voorkomen, ishet verwijderen van calcium uit het influent
met behulp van een kristallisatiereactor en recirculatie van het anaerobe effluent.
De hoeveelheid te verwachten calcium precipitatie in een anaerobe reactor kan worden
berekendmetdechemischeevenwichtsmodellendiewerdenontwikkeldtijdensditonderzoek.
In deze modellen wordt rekening gehouden met kinetische factoren die de schijnbare
oplosbaarheid van calcium carbonaat bei'nvloeden. Deze factoren zijn de influent
samenstelling,dehydraulischeverblijftijd endekristallisatiesnelheidsconstante, k'=k.s. Deze
laatste parameter wordt bei'nvloed door de aanwezigheid van kristalgroeiremmers, zoals
fosfaat, en de aanwezigheid van geschikt kristaloppervlak. Ook de mate van calcium
verwijdering uit het influent met behulp van een kristallisatiereactor en de plaats van
precipitatie kunnen worden bepaald met behulp van de ontwikkelde modellen.
Kijkende naar de doelstelling van dit proefschrift kan worden geconcludeerd dat het
onderzoek voldoende inzichten heeft opgeleverd om te kunnen komen tot het ontwerp ende
toepassing van gecombineerde anaerobe-fysische-chemische technologieen, waarmee de
calcium carbonaat precipitatie tijdens de zuivering van afvalwater met een hoog
calciumgehalte kan worden beheerst. Tijdens de duur van het onderzoek is in de praktijk
gebleken dat anaerobe zuivering succesvol kan worden toegepast in gesloten
waterkringloopsystemen met een hoog calcium gehalte.6'7
Aanbevelingen
Hoewel met de ontwikkelde evenwichtsmodellen de hoeveelheid calcium precipitatie reeds
108
Discussieen conclusies
redelijk kan worden voorspeld lijkt het mogelijk, en daarmee aan te bevelen, om ze zodanig
verder uit te breiden, dat de verwijdering van remming door fosfaat betrouwbaarder kunnen
worden berekend. Hiertoe dient een kwantitatief verband te worden vastgesteld tussen k'
(=k.s) en de fosfaatconcentratie inde reactor, zodat k' iteratief berekend kan worden alsde
fosfaat concentratie in de reactor bepaald is.
Speciale aandacht is verder nodig voor de chemische fosfaat verwijdering in een eventueel
aanwezige aerobe nabehandelingstrap. Als gevolg vanhet uitdrijven van C0 2 uit devloeistof
zal de pH hier stijgen, wat waarschijnlijk zal leiden tot calcium carbonaat en/of fosfaat
precipitatie. Fosfaat verwijdering op deze plaats zou gunstig zijn omdat een hoge
fosfaatconcentratie in het uiteindelijke effluent niet kan worden getolereerd wegens risico's
met betrekking tot eutrofiering van het oppervlaktewater.
In de praktijk komen verder vaak stoffen als fosfaat en eiwitten voor in afvalwater, die
tijdens anaerobebehandelingwordenomgezet ino.a. sulfide enammonium, beidestoffen die
de ligging vanhet chemische evenwicht indereactor zullen bei'nvloeden. Het isdaaromaan
te bevelen de modellen uit te breiden met processen als sulfaatreductie en de afbraak van
eiwitten.
Literatuur
1.
2.
3.
4.
5.
6.
7.
8.
9.
Alphenaar PA, Sleyster R, Reuver P de, Ligthart GJ & Lettinga G (1993a) Phosphorus
requirement inhigh-rate anaerobic wastewater treatment. Wat. Res.27749-756.
Barone JP, Nancollas GH & Yoshikawa Y (1983) Crystal growth as a function of seed
surface area.J. Crystal Growth 6391-96.
Brecevic L & Nielsen AE (1989) Solubility of amorphous calcium carbonate. J. Crystal
Growth 98504-510.
Christoffersen J,Christoffersen MR,Kibalczyc&AndersenFA(1989)Acontributiontothe
understanding of theformation ofcalciumphosphates. J. Crystal Growth 94767-777'.
El-MamouniR,GuiotSR,MercierP,SafiB & SamsonR(1995)Liming impactongranules
activityofthemultiplateanaerobicreactor(MPAR)treatingwheypermeate.BioprocessEng.
1247-53.
Habets LHA&Knelissen HJ(1997) Inlinebiological water regeneration inzerodischarge
recyclepaper mill. Wat. Sci.Technol. 3541-48.
HabetsLHA,Hooimeijer A &KnelissenHJ(1997)In-linebiologicalprocesswatertreatment
for zerodischargeoperationatrecycledfibreboard mills. Pulp&Paper Canada 98184-187.
Herzog RE, ShiQ, PatilJN &KatzJL(1989) Magnetic water treatment: theeffect ofiron
oncalcium carbonate nucleation and growth.Langmuir5861-867.
House WA&Donaldson L(1986) Adsorption and coprecipitation of phosphate oncalcite.
109
Chapter8
10.
11.
12.
13.
14.
15.
16.
17.
18.
19.
20.
21.
22.
110
J. Colloid and InterfaceSci. 112 309-324.
House WA (1987) Inhibition of calcite crystal growth by inorganic phosphate. J. Colloidand
Interface Science 119 505-511.
Huster R, Demel I& Geller A (1991) Closing paper mill Whitewater circuits by inserting an
anaerobic stage with subsequent treatment. Wat. Sci. Technol. 24 81-90.
Iza J, Keenan PJ & Switzenbaum MS (1992) Anaerobic treatment of municipal solid waste
landfill leachate: operation of apilot scale hybrid UASB/AF reactor. Wat. Sci. Technol. 25
255-264.
Jia XS,Furumai H&Fang HHP (1996) Yieldsofbiomass andextracellular polymers in four
anaerobic sludges. Env. Technol. 17 283-291.
Jordening HJ, Pellegrini A & Buchholz K (1988) Fluidized bed reactors for purification of
waste water with high calcium content. In: Fifthinternationalsymposiumon anaerobicdigestion, May 22-26 1988, Bologna, Italy, 289-294.
KabasciS, AlthausW&Weinspach PM(1996)Batchprecipitation ofcalcium carbonate from
highly supersaturated solutions. TransIChemE74A 765-772.
Keenan PJ, Isa J & Switzenbaum MS (1993) Inorganic solids development in a pilot-scale
anaerobic reactor treating municipal solid waste landfill leachate. Wat.Environ. Res. 65 181188.
Ketunnen RH & RintalaJA (1998) Performance ofan on-site UASB reactor treating leachate
at low temperature. Wat.Res. 32 537-546.
Marani D, Di Pinto AC, Ramadori, R & Tomei MC (1997) Phosphate removal from
municipal waste water with low lime dosage. Env. Technol. 18 225-230.
Meyer, HJ (1984)The influence of impurities on thegrowth rateofcalcite.J. CrystalGrowth
66 639-646.
Reddy, MM (1974) Kinetic inhibition of calcium carbonate formation by waste water
constituents. In: Chemistryof waste water Technology. A.J. Rubin (ed.), 31-58.
SawadaK(1997)Themechanisms ofcrystallization andtransformation ofcalciumcarbonates.
Pure &Appl. Chem. 69 921-928.
Svardal K (1991) Calcium carbonate precipitation in anaerobic waste water treatment. Wat.
Sci. Technol. 23 1239-1248.
Dankwoord
Het boekje is af, en dus is het nu tijd om alle mensen die aan de totstandkoming ervan een
bijdrage hebben geleverd hartelijk te bedanken.
In de eerste plaats dank ik mijn promotor, Gatze Lettinga. Beste Gatze, hopelijk zal dit
onderzoek een van de vele steentjes zijn die bijdragen aan een nog uitgebreidere toepassing
van de anaerobe zuiveringstechnologie, een ideaal waar je met een bewonderenswaardige
overtuiging en inzet voor werkt.
Bert Hamelersheeft gedurende dit onderzoek derol vervuld van co-promotor. BesteBert, ik
wilje op deze plaats heel hartelijk bedanken voor je bijdrage. De discussies met jou waren
voor mij zeer leerzaam enje enthousiasme voor dit onderzoek heeft mij de nodige stimulans
gegeven om tot de afronding van dit proefschrift te kunnen komen.
Verschillende studentenengastmedewerkers hebbenzichinhet onderzoek verdiepten talrijke
experimenten uitgevoerd. Graciela Gonzales-Gil, Jaing Nan-Lin, Li-Ru Zhang, Hans
Ramaekers, Jeroen Kemper, Janneke Beun, Mirelle Beekmans, Camillo Schure en Jet
Wiechers, hartelijk dank voor jullie inzet.
Voor technische en administratieve ondersteuning wil ik Jo Ackerman-Jacobs, Use Gerrits,
Sjoerd Hobma, Liesbeth Kesaulya, Johannes van der Laan en Heleen Vos hartelijk danken,
evenals de medewerkers van de mediaservice, de centrale glasinstrument-makerij en de
mechanische werkplaats. Adriaan van Aelst, bedankt voor je hulp bij het maken van foto's
met de elektronenmicroscoop. Voor hun betrokkenheid bij het project en correcties van
manuscripten wil ik Jules van Lier en Adrie Veeken hartelijk danken.
Dan waren er nog de vele overige collega's, studenten en gastmedewerkers op de vakgroep
Milieutechnologie die zorgden voor de nodige afleiding, belangstelling en gezelligheid, waar
ik ze alien hartelijk voor wil bedanken, en in het bijzonder Albert, Anneke, Brian, Elias,
Erna, Frank, Jan, Lourdinha, Mario, Marjo, Mirjam, Piet, Richard, Robbert, Salih, Shyung,
Sjon en Vinnie.
Beste pa en ma, dit boekje ligt er mede voor en dankzij jullie, bedankt voor alles!
Beste Arie, onlangs mocht ik injouw boekje staan, nujij (last but zeker not least!) in het
mijne. Samen schrijven was best gezellig, bedankt!
Ill
Curriculum Vitae
De auteur van dit proefschrift, Emerentiana Petronella Adriana (Anita) van Langerak, werd
op24 april 1969geboren in Hooge Zwaluwe. In 1987 behaalde zij het Atheneum-B diploma
aan het Dongemond College in Raamsdonksveer. In datzelfde jaar begon zij met haar studie
Milieuhygieneaande Landbouw Universiteit Wageningen. Inaugustus 1993werddezestudie
voltooid met als specialisaties anaerobe waterzuivering en microbiologic Haar stage bracht
zij door in Brazilie aan de Universiteit van Para'iba in Campina Grande en bij Cetrel in
Salvador, Bahia, waar zij zich bezig hield met de aerobe zuivering van petrochemisch
afvalwater.
Van augustus 1993 tot januari 1998 was zij werkzaam als toegevoegd onderzoeker aan de
vakgroep Milieutechnologie van de Landbouw Universiteit Wageningen. De resultaten van
dit onderzoek zijn beschreven in dit proefschrift.
Van januari tot juni 1998 was zij werkzaam als cursusdocent bij het Groenhorst Trainings
Centrum Technologie te Ede. Zij werkte mee aan de verzorging van de cursus "Recherche
en Milieu Specialisme" in opdracht van de Regio Politie Midden- en West Brabant.
Sinds September 1998 is zij werkzaam bij de Provincie Zuid-Holland, Bureau Water en
Milieu, Afdeling Handhaving, Bureau Bijzondere Bedrijven enOpsporing als toezichthouder/
emissiespecialist.
112
© Copyright 2026 Paperzz