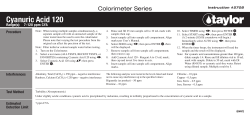
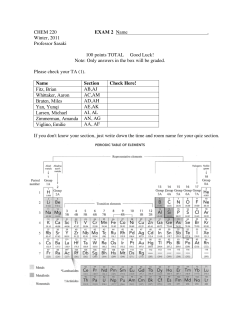
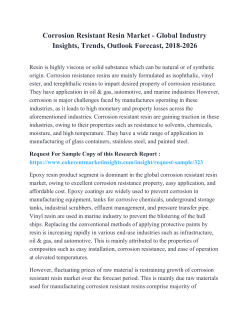
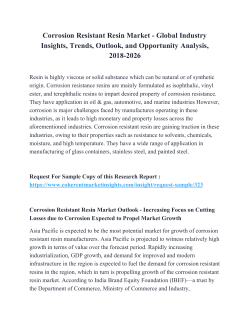
Int. J. Electrochem Sci., 10 (2015) 2740 - 2754 International Journal of ELECTROCHEMICAL SCIENCE www.electrochemsci.org Corrosion Inhibition of Carbon Steel in Hydrochloric Acid Solution using Non- Ionic Surfactants Derived from Phenol Compounds M. Abdallah1,2, B.A.AL Jahdaly1, O.A.Al-Malyo1 1 Department of Chemistry, Faculty of Applied Sciences, Umm Al-Qura University, Makkah Al Mukaramha, Saudi Arabia 2 Department of Chemistry, Faculty of Science, Benha University, Benha, Egypt. E-mail: [email protected], [email protected] Received: 16 September 2014 / Accepted: 6 January 2015 / Published: 19 January 2015 Nonionic surfactants derived from phenol compounds inhibit the corrosion of carbon steel in 1.0 M HCl solution using galvanostatic polarization, electrochemical impedance spectroscopy, potentiodynamic anodic polarization and weight loss techniques. The percentage inhibition efficiency of these compounds increases with increasing the concentration of inhibitors and number of ethylene oxide units per molecule. Inhibition was explained on the basis of adsorption of these compounds on the steel surface.The adsorption process obeys Langmuir isotherms. Polarization data suggested that the non ionic-surfactant molecules used as mixed type inhibitors. All impedance spectra tests exhibit one capacitive loop indicating that the corrosion reaction is controlled by charge transfer process. Nonionic surfactant compounds inhibit the pitting corrosion in chloride containing solutions by shifting the pitting potential into the noble direction. Keywords: Carbon steel, non-ionic surfactant, phenol compounds, corrosion inhibitors, pitting corrosion, adsorption 1. INTRODUCTION The study of corrosion process of carbon steel in hydrochloric acid solution has become important, particularly because the industrial applications of acid solutions, especially in pickling rescaling and cleaning process of steel surface [1]. Inhibitors are used to control the steel dissolution and consumption. Generally, inhibitors are organic compounds, which have nitrogen, oxygen and sulfur atoms in their molecular structure [2-12]. The inhibiting effect of these compounds is generally explained by the formation of a physical and/or chemical adsorption film barrier on the metal surface [13]. The adsorption properties depend on the structures of the organic compounds such as functional groups, steric factor and aromaticity [14]. Int. J. Electrochem. Sci., Vol. 10, 2015 2741 Surfactants corrosion inhibitors have many advantages such as high inhibition efficiency, low price, low toxicity and easy production. The adsorption of surfactant markedly changes the corrosion resisting property of a metal. For these reasons, studying the relation between adsorption and corrosion inhibition are significantly important [15-20]. This work aimed to study the effect of three compounds of nonionic surfactants derived from phenol compounds which have surface active properties, as a corrosion inhibitors for the dissolution of carbon steel type (L-52) in 1.0 M HCl solution using different techniques 2. EXPERIMENTAL TECHNIQUES The carbon steel type (L-52) used in this study had the composition (weight%) 0.26 C, 1.35 Mn, 0.04 P, 0.05 S, 0.005 Nb, 0.02 V, 0.03 Ti and the remainder Fe. For galvanostatic, potentiodynamic anodic polarization and electrochemical impedance spectroscopy techniques, a cylindrical rod embedded in araldite with an exposed surface area of 0.56 cm2 and for weight loss measurements a coupon of carbon steel with dimension of 1 x 2 x 0.2 cm were used. The electrode surface was polished with different grades of emery papers, degreased with acetone, and rinsed with distilled water. A.R. grade hydrochloric acid was used for preparing the corrosive solution. The electrolytic cell was all Pyrex and described elsewhere [21]. The procedure method of weight loss measurements was carried out as described elsewhere [22]. Galvanostatic anodic and cathodic polarization measurements were carried out using a PS remote potentiostat with PS6 software to calculate the corrosion parameters. The potentiodynamic anodic polarization was performed at a scanning rate of 1mV/Sec using a Wenking potentioscan Type POS 73, and the current density potential curves were recorded on an X-Y recorder Type PL-3. The potentials were measured relative to a saturated calomel electrode (SCE), The electrochemical impedance spectroscopy measurements were carried out at open circuit potential (Eocp) in the frequency range from 10 kHz to 100 mHz with signal amplitude perturbation of 5 mV by using a computer-controlled potentiostat (Auto Lab 30, Metrohm). Three non-ionic surfactants derived from phenol compounds were prepared using a method described elsewhere [23] are given in Table 1. Table 1. The chemical structure of nonionic surfactants derived from phenol compounds Structure Compounds Compound I 4-(3,6,9,12-tetraoxatetracosyloxy) phenol Int. J. Electrochem. Sci., Vol. 10, 2015 2742 Compound II 4-(3,6,9,12,15,18-hexaoxatriacontyloxy) phenol (II) Compound III 4-(3,6,9,12,15,18,21,24-octaoxahexatriacontyloxy) phenol 3. RESULTS AND DISCUSSION 3.1. Galvanostatic polarization technique. 1 100 10 Current density, mA/cm 2 6 1 0.1 0.01 1E-3 1E-4 1E-5 -2000 -1500 -1000 -500 0 500 1000 E, mV (SCE) Figure 1.Galvanostatic polarization curves for the dissolution of C-steel in 1.0 M HCl solution in the presence and absence of different concentrations of compound III at 300C. (1) 0.0 ppm (2) 100 ppm (3) 200 ppm (4) 300 ppm (5) 400 ppm (6) 500 ppm Int. J. Electrochem. Sci., Vol. 10, 2015 2743 Fig. 1 shows the galvanostatic anodic and cathodic polarization curves of carbon steel electrode in 1.0M HCl solution in the absence and presence of different concentrations of compound III as an example of the tested compounds. Similar curves were obtained for the other two compounds (not shown). Inspection of the curves of figure 1, one can observe at first a transition region in which the potential increases (anodic polarization) or decreases (cathodic polarization) slowly with current density following the region, there is a rapid linear buildup of potential with current density (Tafel region). The increasing concentrations of non-ionic surfactants derived from phenol compounds causes a decrease in the rate of anodic dissolution reaction, i.e. shifting the anodic current - potential curves in the anodic direction. This may be ascribed to a parallel adsorption of the non-ionic surfactants over the corroding surface [24].The values of anodic (ba) and cathodic (bc) Tafel constants were calculated from the linear region of the polarization curves. The corrosion current (Icorr.) was determined from polarization curves by the intersection of anodic and cathodic Tafel lines with steady state (corrosion) potential (Ecorr). The percentage inhibition efficiency (%I.E) was evaluated from the values of Icorr. From the following equation: I.E = (Ifree - Iinh / Ifree ) X100 (1) where, Iinh and Ifree are the corrosion current densities in the presence and absence of inhibitor. Table 2 shows the effect the inhibitor concentrations on the corrosion kinetics parameters, such as ba, bc, Ecorr, Icorr and IE. Inspection of table 2, as the concentration of inhibitors increases, it is obvious that: iThe corrosion current density (Icorr) decreases and the corrosion potential (Ecorr) shifted to less negative values which indicates that the presence of these compounds retards the dissolution of carbon steel in 1.0 M HCl solution. iiThe values of ba and bc are changed upon the addition of inhibitors compared to blank. This proved that these compounds act as mixed type inhibitors [25]. iiiAt one and the same inhibitor concentration, the degree of inhibition efficiency decreases in the following sequence: Compound III > Compound II > Compound I. This sequence will be discussed later. Table 2: Corrosion parameters of C-steel electrode in 1 M HCl solution containing different concentrations of inhibitors. Concentrations 1 M HCl + compound I 0.00 ppm compound I 100 ppm compound I 200 ppm compound I ba (V docade 1 ) bc (V docade 1 ) -Ecorr mV(SCE) Icorr mA.cm-2 I.E. 76 156 163 123 155 183 465 468 470 0.58 0.21 0.19 63.79 67.24 Int. J. Electrochem. Sci., Vol. 10, 2015 300 ppm compound I 400 ppm compound I 500 ppm compound I 1 M HCl + compound II 100 ppm compound II 200 ppm compound II 300 ppm compound II 400 ppm compound II 500 ppm compound II 1 M HCl + compound III 100 ppm compound III 200 ppm compound III 300 ppm compound III 400 ppm compound III 500 ppm compound III 2744 188 198 211 196 218 239 473 475 478 0.17 0.15 0.12 70.68 74.13 79.31 158 169 177 198 218 181 187 199 227 243 470 472 476 485 488 0.19 0.18 0.16 0.14 0.10 67,24 68.96 72.41 75.68 82.75 157 168 181 197 211 181 189 203 216 255 475 477 480 485 490 0.17 0.16 0.13 0.11 0.08 70.68 72.41 77.58 81.03 86.21 3.2. Electrochemical impedance spectroscopy technique (EIS) The corrosion behavior of C-steel electrode in 1.0M HCl solution in the absence and presence of different concentrations of non-ionic surfactant compounds were investigated by the EIS method over frequency 10khz to 100mHz. at open circuit potential. Figure 2 shows the Nyquist plots for Csteel in 1.0M HCl solution in the absence and presence of different concentrations of compounds III at 30o C as an example of the tested compounds. Similar curves were obtained for the other two compounds (not shown). The obtained Nyquist impedance diagrams in most cases does not show perfect semicircle, generally attributed to the frequency dispersion [26] as a result of roughness and inhomogeneities of the electrode surface. The impedance spectra of the different Nyquist plots are analyzed by fitting the experimental data to a simple equivalent circuit model which is given in Fig. (3), which includes the solution ohmic resistance Rs or RΩ and the double layer capacitance of the electrode/ solution interface Cdl which is placed in parallel to the charge transfer resistance at the electrode/ solution interface Rct [27] due to the charge transfer reaction. The capacity of double layer (Cdl) was calculated from the following equation: Cdl 1 2 f max R ct (2) where, fmax is the maximum frequency. The percentage inhibition efficiencies (% IE) can be calculated from the following equations: R %IE 1 ct x 100 Rct (3) o where, R ct and Rct are the charge transfer resistance in the absence and presence of inhibitor respectively. The parameters obtained from impedance measurements are given in Table 3. It is clear that from this Table, the values of charge transfer resistance (Rct) increase with increasing inhibitor concentration [28] This increase in Rct with inhibitor concentration may be result of more adsorbed Int. J. Electrochem. Sci., Vol. 10, 2015 2745 inhibitor molecules on the steel surface and decreasing of Cdl may be caused by reduction in local dielectric constant and /or by increase in the thickness of the electrical double layer, thus it suggests that the inhibitor molecules act by adsorption at the metal/ solution interface. 200 6 5 -2 Zimg (ohm cm ) 150 4 100 3 2 50 1 0 0 100 200 300 400 500 -2 Zreal(ohm cm ) Figure 2. Nyquist plot of C-steel in 1.0M HCl solution in the absence and presence of different concentrations of compound III: (1) 0.00 ppm (2) 100 ppm (2) 200 ppm (3) 300 ppm (4) 400 ppm (5) 500 ppm. Figure 3. Electrical equivalent circuit (RsΩ is uncompensated solution resistance, Rct is charge transfer resistance and Cdl is double layer capacitance). The order of % IE obtained from EIS measurements is decreases in the following order: Compound III > Compound II > Compound I Int. J. Electrochem. Sci., Vol. 10, 2015 2746 Table 3. EIS data of C-steel in 1M HCl solution in the absence and presence of different concentrations of investigated inhibitors Compounds Conc., ppm Cdl, µFcm−2 RCt, Ω cm2 Rs IE% HCl 1M 98 70 1.3 - Compound I 100 ppm 43 192 1.4 63.54 200 ppm 38 220 1.9 68.18 300 ppm 33 255 2.3 72.55 400 ppm 29 280 2.6 75.00 500 ppm 23 345 2.8 79.71 100 ppm 42 213 1.3 67.13 200 ppm 36 228 1.5 69.29 300 ppm 31 260 1.9 73.07 400 ppm 27 300 2.2 76.66 50`80 ppm 21 420 2.5 83.33 100 ppm 40 230 1.2 69.56 200 ppm 36 255 1.4 72.55 300 ppm 30 330 1.8 78.78 400 ppm 28 420 1.9 83.33 500 ppm 20 545 2.2 87.15 Compound II Compound III 3.3. Pitting corrosion of carbon steel electrode and its inhibition by non-ionic surfactants 3.3.1. Effect of NaCl concentration Figure 4 represents the potentiodynamic anodic polarization curves of C-steel in different concentrations of NaCl solution at 1mV/sec. The slow scan rate permits that the pitting initiation occurs at less positive potential [29]. It’s clear that from this figure, there is no any active dissolution peak was observed during the anodic scan. This reflects the stability of the air formed an oxide film on the steel surface [30]. The higher Cl- ion concentration results in a sudden and marked increase of current density at some definite potential denoting the destruction of the passive film and initiation of visible pits. The higher concentrations of Cl- ion, the higher are the shift of pitting potential to active direction. Examination of the electrode surface after polarization experiments showed visible pits whose number per unit area increases with the increase Cl- ion content of the solution. Also, the Int. J. Electrochem. Sci., Vol. 10, 2015 2747 increase in Cl- ion concentration shifts the critical pitting potential into negative (active) direction. This effect could be attributed to the adsorption of the aggressive anions on the bare metal surface. The dependence of the pitting corrosion potential of the carbon steel in 1.0 M HCl solution on the chloride ion concentration can be clearly seen in figure 5. This figure represents the plot of pitting potential Epitt versus the logarithm of chloride ion concentration. The straight - line relationship was obtained satisfying the following equation [31,32]: Epitt. = a1- b1 log CCl(4) where, a1 and b1 are constants which depend on both the nature of the electrode and the type of aggressive anions. As the concentration of chloride ions increases the pitting potential is shifted to the more negative direction indicating the destruction of passive film and initiation of pitting corrosion. Figure 4. Potentiodynamic anodic polarization curves of carbon steel in 1.0 M HCl solution with different concentrations of NaCl at scan rate of 1mV sec-1. (1) 0.001 M, (2) 0.005 M, (3) 0.01 M, (4) 0.05 M,(5) 0. 1M. 3.3.2. Effect of addition of non-ionic surfactant compounds The effect of different concentrations of non-ionic surfactant compounds on the potentiodynamic anodic polarization curves of carbon steel electrode in 1.0 M HCl + 0.1 M NaCl solution at a scanning rate 1mV/sec was studied .Similar curves were obtained to figure 4 (not shown). It was found that the pitting potential of a carbon steel electrode is shifted to more positive (noble) Int. J. Electrochem. Sci., Vol. 10, 2015 2748 direction with increasing the concentration of additives. This indicates that increased resistance to pitting attack. -450 Epit , mV(SCE) -460 -470 -480 -490 -500 -510 -520 -3.0 -2.5 -2.0 -1.5 -1.0 - log [Cl ], M Figure 5. The relation between Epit and logarithm of chloride ion concentration. Figure 6 shows the relationship between the pitting potential; Epit and the logarithm of concentration of the added compounds. The straight-line relationship was obtained and the following conclusions can be drawn: The increase of inhibitor concentration causes the shift of pitting potential into more positive values in accordance with the following equation [33-36]: Epit= a2 + b2 log Cinh. (5) where, a2 and b2 are constants which depend on both the composition of additives and the nature of the electrode. Inhibition afforded by these compounds using the same different concentrations of the additives shifted the pitting potential to more positive direction decreases in the following order: Compound III > Compound II > Compound I. Two major effects seem to be possible for the inhibition of pitting corrosion. First is the competitive adsorption between aggressive and inhibiting compounds. The adsorption of the latter ions predominates and the electrode will be protected. In this case, the pitting corrosion potential is shifted into the anodic direction. This mechanism seems to be the most effective way to avoid pitting corrosion. Int. J. Electrochem. Sci., Vol. 10, 2015 2749 -200 I II III Epit , mV(SCE) -250 -300 -350 -400 -450 -500 -550 2.0 2.2 2.4 2.6 2.8 log [inh.], ppm Figure.6. Variation of Epit of carbon steel electrode in 1.0 M HCl+1.0MNaCl solutions versus log Cinh: I) Compound I II) Compound II III) Compound III A second way is related to the incorporation of the inhibitive molecules into the passive layer on the metal surface forming an improved stability against the aggressive ions. Once, when pitting corrosion has been started, the inhibitor can be adsorbed within the pits preventing active metal dissolution. As shown in the figures, the order of decreasing Epit of C-steel in the presence of the investigated compounds is in agreement with the order of decreasing % IE of these compounds, obtained from potentiodynamic polarization measurements. 3.4. Weight loss measurements Figure 7 shows the weight loss - time curves for carbon steel in 1.0M HCl solution in the absence and presence of different concentrations of compound III as an example of the tested inhibitors. Similar curves were obtained for the other two compounds (not shown). Inspection of this figure reveals that by increasing the concentrations of this compound, the weight loss of carbon steel samples are decreased. This means that the presence of these compounds retards the corrosion of carbon steel in 1.0M HCl solution or in other words, these compounds act as inhibitors. The linear variation of weight loss with time in uninhibited and inhibited 1.0 M HCl indicates the absence of insoluble surface films during corrosion. In this case, the inhibitors are first adsorbed onto the metal surface and thereafter impede corrosion either by merely blocking the reaction sites (anodic and cathodic) or by altering the mechanism of the anodic and cathodic partial processes. The value of corrosion rate Rcorr was calculated from the following equation: Int. J. Electrochem. Sci., Vol. 10, 2015 2750 (6) where, ∆W is the average weight loss of steel coupons in the corrosive solution. S is the total surface area of the specimen, and t is the immersion time The percentage inhibition efficiency (% IE) and the surface coverage (θ), which represents the part of the metal surface covered by the inhibitor molecules were calculated using the following equations: I.E = (Rfree - Radd / Rfree) X100 (7) θ = (Rfree - Radd / Rfree) (8) where, Rfree and Radd are the weight losses of carbon steel without and with addition of inhibitors, respectively. Figure 7. Weight loss of C-steel as a function of time in 1.0 M HCl solution in absence and presence compound III: (1) 0.0 ppm (2) 100 ppm (3) 200 ppm (4) 300 ppm (5) 400 ppm (6) 500 ppm. Table 4. Effect of inhibitors on the corrosion parameters of C-steel in 1.0 M HCl solution using weight loss measurements at 30◦ C. Concentrations 1 M HCl + compound I 0.00 ppm compound I 100 ppm compound I 200 ppm compound I 300 ppm compound I 400 ppm compound I 500 ppm compound I Rcorr mg cm-2min-1 9.55 3.42 3.18 2.92 2.61 2.02 % I.E 64.81 66.70 69.24 72.67 78.85 θ 0.64 0.67 0.69 0.73 0.79 Int. J. Electrochem. Sci., Vol. 10, 2015 1 M HCl + compound II 100 ppm compound II 200 ppm compound II 300 ppm compound II 400 ppm compound II 500 ppm compound II 1 M HCl + compound III 100 ppm compound III 200 ppm compound III 300 ppm compound III 400 ppm compound III 500 ppm compound II 2751 3.22 2.94 2.62 2.48 1.72 66.28 69.21 72.56 74.03 81.98 0.66 0.69 0.72 0.74 0.82 2.94 2.76 2.36 1.84 1.46 69.21 71.09 75.28 80.73 84.71 0.69 0.71 0.75 0.81 0.85 The values of percentage of inhibition efficiency and surface coverage (θ) of non-ionic surfactants derived from phenol compounds are listed in table (4). Inspection of this table reveals that, the values of inhibition efficiency increases with increasing concentration of these compounds and the order of inhibition efficiency decreases in the following order: Compound III > Compound II > Compound I. This behavior will be discussed be later The values of the percentage inhibition efficiency of non-ionic surfactant compounds toward the corrosion of carbon steel in hydrochloric acid using different techniques show an agreement and conformity of the experimental results. However, there is a small difference in the values obtained. This observed discrepancy could be attributed to the difference of the experimental conditions and the short time taken by the electrochemical measurements. 3.5. Adsorption isotherms Non-ionic surfactants derived from phenol compounds inhibit the corrosion process by the adsorption on metal surface. The adsorption process can be regarded as a single substitution process in which an inhibitor surfactant molecule, Surf, in the aqueous phase substitutes an "x" number of water molecules adsorbed on the metal surface. Surf.(aq) + X H2O (sur) ------->Surf. (sur) + H 2O(aq). (9) where, X is ratio of the number of a water molecules replaced by a single surfactant molecule. Adsorption isotherm equations are generally of the form [29] f(θ, x) exp(-a, θ) = KC (10) where f (θ, x) is the configurational factor that depends essentially on the physical model and assumptions underlying the derivation of the isotherm (a) is a molecular interaction parameter depending upon molecular interactions in the adsorption layer and the degree of heterogeneity of the surface. All adsorption expressions include the equilibrium constant of the adsorption process, Kads, which is related to the standard free energy of adsorption (∆G˚ads) by: Kads = 1 / 55.5 exp (-∆G˚ads / RT). (11) Int. J. Electrochem. Sci., Vol. 10, 2015 2752 Figure 8. Langmuir adsorption isotherm plotted as C/ө versus different inhibitors concentrations of carbon steel in 1.0 M HCl solution. 1) Compound I 2) Compound II 3) Compound III. Attempts were made to fit θ values to the several adsorption isotherms like Frumkin, Freundlich, Temkin and Langmuir. The best fit was obtained with Langmuir isotherm according to the following equation: C / ө = 1 / Kads. + C (12) where, Kads is the equilibrium constant of the adsorption reaction, C is the inhibitor concentration in the bulk of the solution and θ is the surface coverage. The plotting of C/ө against C gave straight line with unit slop,Fig 4.This indicates that the adsorption of these inhibitors toward the steel surface in 1.0 M HCl solution obeys Langmuir adsorption isotherm .This indicates no interaction between the adsorbed molecules at the metal surface [4].The values of Kads is calculated from the intercept and eual to 0.066, 0.046 and 0.022 for compounds I,II and III, respectively. The calculated values of ∆G˚ads for non-ionic surfactants adsorbed on the steel surface is -31.55, -28.25 and -26.60 kJ mol-1 for compounds I, II and III, respectively. The negative values of ΔG°ads ensure the spontaneity of the adsorption process and stability of the adsorbed layer on the carbon steel surface. 3.5. Mechanism of inhibition The inhibition mechanism of the corrosion of carbon steel in 1.0M HCl solution by non-ionic surfactants derived from phenol compounds were studied. It was found that the percentage inhibition efficiency of non-ionic surfactants is dependent on its concentration. These observations indicate that the corrosion inhibition is due to the adsorption of the inhibitors at the metal / solution interface. The nature of interaction of inhibitor on the metal surface during corrosion inhibition can be explained in terms of its adsorption characteristics [37]. However, the inhibition efficiency depends on many Int. J. Electrochem. Sci., Vol. 10, 2015 2753 factors, which include the number of adsorption active centers in the molecule and their charge density, molecular size, mod of adsorption, temperature, heart of hydrogenation and the formation of metallic complexes. The adsorption of these compounds on the metal surface can retard the anodic or the cathodic reaction by one or more of the following mechanisms. iFormation of physical barrier layer between metal and inhibitor. iiReducing the metal reaction through alternating the nature of metal surface. iiiChanging the structure of the metal /solution interface. The inhibiting effect of non-ionic surfactants derived from phenol compounds are due to its adsorption on the steel surface. The adsorbed layer acts as a barrier between the steel surface and the corrosive solution leading to a decrease in corrosion rate. The obtained results by different techniques indicate that the order of inhibition efficiency of the non-ionic surfactants depending on the chemical structure of the surfactant compounds and decreases in the following sequence: Compound III > Compound II > Compound I. The transition of metal/solution interface from a state of active dissolution of the passive state can be attributed to the adsorption of the inhibitor molecules at the metal/solution interface, forming a protective film. It is well recognized that the non-ionic surfactant compounds set up their inhibitory action via the adsorption of the inhibitor molecules onto the metal/solution interface. The adsorption process occurred through ethoxy groups on both the anodic and cathodic areas while the hydrocarbon parts protrude brushlike into the solution. One cannot exclude, however, the possible adsorption of these compounds via π-electrons of the double bonds present in the benzene ring. The presence of more than one double bond in the inhibitor molecule is beneficial to inhibition efficiency [38] The percentage inhibition efficiency obtained from different techniques increased with an increase in the number of ethylene oxide unit. The increase in concentration of the inhibitor would result in a lowering of the interfacial tension at the metal surface [39]. This lowering in the interfacial tension is thought to cause a decrease of the bulk concentration of the inhibitor and an increase in its concentration at the metal surface. 4. CONCLUSIONS 1-The non-ionic surfactant compounds derived from phenol compounds are efficient inhibitors for corrosion of the carbon steel in 1.0 M HCl solution. 2- The percentage inhibition efficiency of these compounds increases with concentration of inhibitors and number of ethylene oxide units per molecule. 3-Gavanostatic polarization measurements indicated that these compounds are of mixed type inhibitors. 4-Non-ionic surfactant molecules inhibit the corrosion of C-steel in 1MHCl solution by its adsorption on its surface. The adsorption obeys Langmuir isotherms. 5-EIS measurements indicating that the corrosion reaction is controlled by charge transfer process. 6- Non-ionic surfactant molecules provide protection against pitting corrosion of C-steel in the presence of chloride ions. Int. J. Electrochem. Sci., Vol. 10, 2015 2754 References 1. M.Lagrene, B.Mernari, M.Traisnel, F.Bentiss, Corros.Sci., 44(2002)573. 2. M. Abdallah, A.M.El-Dafrawy, M.Sobhi, A.H.M. Elwahy, M. R. Shaaban, Int.J.Electrochem Sci, 9(2014)2186. 3. M. Sobhia ,M. Abdallah ,E. Hafez, J. Advances in Chem. 5(2013)830. 4. M. Abdallah, B. H. Asghar, I. Zaafarany, M. Sobhi, Protection Metals and Phys Chem. of Surfaces, 49(2013)485. 5. A. S. Fouda, M. Abdallah and M. Medhat, Protection Metals and Phys Chem. of Ssurfaces, 48(2012)477. 6. S.Issaadi,T.Douadi,A.Zaouaoui,S.Chafaa,M.A.Khan,G.Bouet, ,Corros.Sci.,53(2011)1484. 7. M. Abdallah.,,I.Zaafarany, K.S.Khairou,M.Sobhi, Int.J.Electrochem Sci., 7(2012)1564. 8. A.S.Fouda,S.A.El-Sayyed, M. Abdallah, Anti-Corrosion Methods and Materials,58(2011)63. 9. G.Moretti,F.Guidi,F.Fabris, Corros. Sci.,76(2013)206. 10. A.S.Fouda,M.Abdallah., A.Attia, Chem.Engineering Comm.,197(2010)1091. 11. M.Abdallah.H.E Megahed and M.S.Motae, Mater, Chem. and Physics, 118(2009)111. 12. M. Abdallah.and M. E. Moustafa, Annali Di Chimica ,94(2004)601. 13. F.Bentiss,M.Lagrrene,M.Traisnel, Corrosion, 56(20000733. 14. M. Abdallah., E.A. Helal , A.S. Fouda, Corros. Sci., 48(2006)1639. 15. M.A.Hegazy,A.S.ElTabei,A.H.Bedair,M.A.Sadeq, Corros.Sci., 54(2012)219. 16. O.A.Hazza, M. Abdallah,E. A. M. Gad, Int.J.Electrochem Sci, 9(2014)2237. 17. M. Sobhi ,R. El-Sayed ,M. Abdallah, J.Surfactants and Detergents, 16(2013)937. 18. F. M. Al- Nowaiser,M. Abdallah,E.H.El-Mossalamy, Chem.and Tech.of Fuels and Oils, 47(2012)453. 19. M.Abdallah.,A.A.El-Sarawy and A.Z. El-Sonbati , Corros. Prevention & Control, 48(2001) 97. 20. M.AHegazy,M.F.Zaky, Corros.Sci., 52(2010)1333. 21. A.S.Fouda, M.Abdallah,R. El-Dahab, Desalination and Water Treatment, 22(2010)340. 22. P.B.Mathur and T.Vasudevan, Corrosion, 38(1982)17. 23. M.H.M. Ahmed, M. M. H. Arief,W.M. Kairy, J Oil, Soap and Cosmetic, 60(2011)17. 24. A.S.Fouda.M.M.Farahat,M.Abdallah,Res Chem Intermed,40(2014)1249. 25. M. Abdallah.,,H.E.Megahed M.A.Radwan , E.Abdfattah, J.American Sci., 8(2012)49. 26. O.A.Hazazi,M.Abdallah, Int.J.Electrochem Sci., 8(2013)8138. 27. M.Hegazy,M.Abdallah,M.K.Awad,M.Rezk, Corros.Sci., 81(2014)54. 28. M.Sobhi,M.Abdallah,K.S.Khairou, Monatsh Chem.,143(2012)1379. 29. M.Abdallah, Portugaliae Electrochimica Acta, 22(2004)161. 30. M.Abdallah,I.Zaafarany,S.O.Al-Karanee, A.A.Abd El-Fattah Arab. J.Chem.5(2012)225. 31. M.Abdallah, S.M. Abd El-Haleem. Bull.Electrochem, 12(1996)449. 32. M. Abdallah ,S.A.Al Karane ,A.A.Abdel Fattah, Chem.Engineering Comm.196(2009)1406. 33. M.Abdallah.H.E.Megahed,M.S.Motae, Monatsh Chem, 141(2010)1287. 34. S.M.Abd El Haleem,S.Abd El Haleem,A.Bahgat, Corros.Sci., 87(2014)321. 35. M.Abdallah,I.A.Zaafarany,S.Abd El Waneesand R.Assi ,Int.J. Electrochem Sci., 9(2014)1071. 36. M. Abdallah,S.T. Atwa, M.M.Salem,A.S. Fouda, Int.J.Electrochem Sci., 8(2013)10001. 37. X.Li, S.Deng, H.Fn and T.Li, Electrochem Acta, 54(2009)4089. 38. A. J. Szyprowski, Br Corros. J., 35(2000)155. 39. M. Abdallah, A. I. Mead, Annali Di Chimica, 83(1993)424. © 2015 The Authors. Published by ESG (www.electrochemsci.org). This article is an open access article distributed under the terms and conditions of the Creative Commons Attribution license (http://creativecommons.org/licenses/by/4.0/).
© Copyright 2026 Paperzz