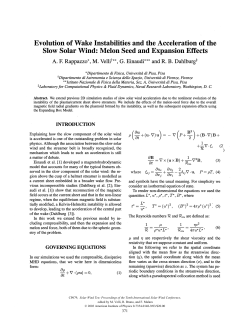
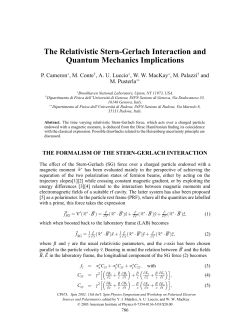
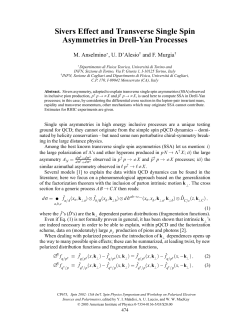
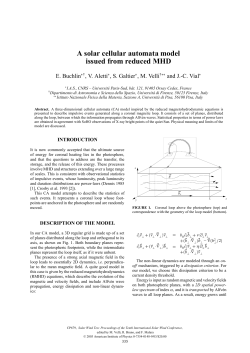
Surface Science 603 (2009) 1812–1830
Contents lists available at ScienceDirect
Surface Science
journal homepage: www.elsevier.com/locate/susc
Magnetism of individual atoms adsorbed on surfaces
Harald Brune a,*, Pietro Gambardella b
a
b
Institut de Physique des Nanostructures, Ecole Polytechnique Fédérale de Lausanne (EPFL), CH-1015 Lausanne, Switzerland
Institució Catalana de Recerca i Estudis Avançats (ICREA) and Centre d’Investigacions en Nanociència i Nanotecnologia (ICN-CSIC), UAB Campus, E-08193 Barcelona, Spain
a r t i c l e
i n f o
Article history:
Available online 10 February 2009
Keywords:
Magnetic impurities
Magnetic anisotropy
Spin–orbit coupling
Dilute magnetic semiconductors
Spin excitation spectroscopy
Spin-polarized transport
Quantized conductance
X-ray circular magnetic dichroism (XMCD)
Scanning tunneling microscopy (STM)
a b s t r a c t
Magnetic impurities in solids cause manifold changes in their macroscopic properties, such as anomalous
low temperature resistance due to Kondo screening, reduction of the superconducting transition temperature due to local suppression of the order parameter, they create magnetic signatures in semiconductors,
and lead to inelastic spin excitations in tunnel junctions. In the present paper we review what has been
learnt about these effects from a surface science approach. Placing the magnetic impurities at well
defined adsorption sites on single crystal surfaces makes their effect on the host, as well as their own
magnetic properties better accessible to experiments, and also better understandable since the atomic
environment of the impurity is exactly known lending comparison with theory more direct. After an
introduction we discuss X-ray magnetic circular dichroism measurements which are spatially averaging
and therefore report on ensemble properties. One of the recent progresses achieved in surface science is
the preparation of well defined ensembles, such as surfaces with only single adatoms, each of them in an
identical atomic environment and with sufficient mutual distance to exclude interactions. Due to this
approach we can now determine the electronic configuration of individual adatoms, their hybridization
with the host, and quantify their spin and orbital moments, as well as the spin–orbit induced magnetocrystalline anisotropy, which can be orders of magnitude larger than thin film and bulk values. In the second part we review recent progress in revealing the magnetic properties of individual atoms with the
scanning tunneling microscope (STM). With this technique the spatial extent of the Kondo screening
cloud and of subgap excitations in the superconductor quasiparticle density of states became apparent.
We outline the first pioneering experiments measuring transport through reversible atomic point contacts containing magnetic atoms and measurements using the subgap features caused in superconducting STM tips to detect the magnetism of individual atoms. We then describe experiments using
inelastic spin excitation spectroscopy to pin down the magnetic ground state and anisotropy energy of
magnetic impurities. We continue with spin-polarized STM experiments reporting magnetization curves
of individual magnetic adatoms and finish by a description of the most recent spin-excitation experiments revealing the necessary anisotropy environment for a high spin impurity to display the Kondo
effect.
Ó 2009 Elsevier B.V. All rights reserved.
1. Introduction
The study of magnetic atoms at surfaces is a multifaceted topic
that can hardly be classified between the boundaries of a single
discipline. The interaction between a magnetic impurity and a nonmagnetic metal is a classical condensed matter problem, usually
treated in the framework of the Anderson or Kondo models [1].
Owing to their reduced atomic coordination, surface adatoms can
further be viewed as a bridge between the atomic and solid state,
with many of their electronic and magnetic properties essentially
determined by intra-atomic correlation effects [2] that are exem-
* Corresponding author.
E-mail address: Harald.brune@epfl.ch (H. Brune).
0039-6028/$ - see front matter Ó 2009 Elsevier B.V. All rights reserved.
doi:10.1016/j.susc.2008.11.055
plified by the well-known set of rules that go under Hund’s name
(Fig. 1).
From a surface science perspective, the investigation of the
adsorption sites and of diffusion and nucleation processes offers
countless opportunities to tune the adatom–substrate interaction,
as well as to construct multiatom magnetic clusters of controlled
shape, density, and dimensions [3]. Adatoms and clusters may further be considered as the precursors of thin films, as the growth of
magnetic mono- and multilayers is typically initiated by the
deposition of transition-metal atoms from the vapor phase onto a
nonmagnetic substrate. Investigating substrate–impurity hybridization and coordination effects thus provides basic understanding
and useful guidelines to tailor the magnetization and magnetic
anisotropy of films as well as nanoparticles and to optimize sensitive interface properties that govern the performances of magnetic
1813
H. Brune, P. Gambardella / Surface Science 603 (2009) 1812–1830
b
Magnetization (a. u.)
Magnetization (a. u.)
a
10
Magnetic field (Tesla)
9.3
µB
2.1
1.1
meV
3.0
µB
3.0
in-plane
0
10
Magnetic field (Tesla)
meV
0
out-of-plane
0.0
spin
orbital
magnetic magnetic
moment moment
magnetic
anistropy
energy
orbital
spin
magnetic magnetic
moment moment
magnetic
anistropy
energy
Fig. 1. (a) Spin and orbital magnetic moment of a gas phase Co atom as given by the Hund’s rules for a d7 electronic configuration. (b) Spin and orbital magnetic moment of an
individual Co atom deposited on a Pt(1 1 1) surface. Both spin and orbital moments are reduced with respect to (a), but remain large compared to bulk Co. The field-dependent
magnetization is represented in (a) by a Brillouin function calculated for T = 5.5 K. Due to the spherical symmetry of the system the magnetization is isotropic and the
magnetic anisotropy energy equals zero. In (b) symmetry breaking and Co–Pt hybridization induce strong anisotropy of the magnetization measured by XMCD along the outof-plane (black) and close to in-plane direction (blue).
storage media and electron transport in spintronic devices. Finally,
adatoms and clusters on nonmagnetic surfaces represent the ultimate paradigm of a nanomagnet, i.e., the smallest entities that
can display ferromagnetic behavior.
While the exploitation of such a property for practical applications is presently beyond reach, these systems are attracting
increasing attention since they straddle the boundary between
classical and quantum magnetism. In a classical picture, the stability of the magnetization orientation of a ferromagnet is determined
by the amplitude of the magnetic anisotropy energy barriers,
which limit thermally-induced fluctuations of the magnetization
and thereby determine the data retention time of a magnetic memory at a given temperature. In quantum systems, such as singlemolecule magnets [4], tunneling can cause discrete changes of
the spin magnetic quantum number, eventually leading to a finite,
temperature-independent probability for magnetization reversal.
Surface systems, as will be shown in the following sections, present
both classical and quantum behavior, and allow us to explore the
transition between these two limits by controlling the adatom–
substrate and adatom–adatom interaction. Moreover, and in analogy with single-molecule magnets, one may envisage to test quantum computation [5] and communication schemes [6], with the
advantage of working with highly versatile and on the atomic scale
well defined structures whose coupling can be adjusted by moving
them about on a two-dimensional support.
In this context, the experimental challenge lies in probing extremely small densities of magnetic atoms (typically on the order of
1014 atoms/cm2 or less) on a macroscopic substrate with nonneg-
ligible para- or diamagnetic response. Until a decade ago, the measurement of surface dilute magnetic impurity systems was
restricted to the anomalous Hall effect (AHE) [7,8] and impurity-induced detuning of a thin film superconducting LC oscillator [9].
While these methods provide access to the average impurity magnetization in response to temperature and external magnetic field,
techniques based either on X-ray magnetic circular dichroism
(XMCD) [10–15] or scanning tunneling microscopy (STM) [16–
23] have recently been shown to yield complementary insight into
the adatoms electron valence, local spin and orbital moments,
magnetic anisotropy, as well as ground and excited magnetic
states. STM, moreover, offers the ability to manipulate and address
single spins at the atomic scale. The aim of this paper is to review
recent progress in this field starting from isolated individual surface atoms and follow the evolution of their magnetic properties
as they are incorporated in particles of larger dimensions. The text
is organized as follows: Section 2 treats XMCD measurements of
individual atoms on nonmagnetic surfaces with strongly different
electronic properties, namely an sp-metal, K, a transition-metal,
Pt, as well as semiconducting Ge and GaAs. Section 3 introduces
to most recent progress achieved in characterizing individual magnetic atoms by means of STM.
2. Magnetism of individual surface atoms probed by XMCD
X-ray absorption spectroscopy (XAS) applied to the study of
magnetic materials has found widespread application thanks to
the advent of intense sources of circularly polarized light with tun-
1814
H. Brune, P. Gambardella / Surface Science 603 (2009) 1812–1830
able energy, soft X-ray monochromators, and dedicated experimental endstations [24]. Because X-ray transitions are localized
on atoms and polarization dependent, XAS probes the valence shell
occupation number as well as the symmetry of the unoccupied
electron orbitals; in other words, the lineshape and relative
strength of the XAS features are a fingerprint of the chemical state
of a given atom. As the X-ray absorption intensity for circularly
polarized light depends on the orientation of the spin and orbital
moment of the unoccupied electron states relative to the X-ray
helicity, magnetic sensitivity is achieved by taking the difference
of absorption spectra for parallel (I+) and antiparallel (I) alignment of the X-ray helicity with respect to the sample magnetization. XMCD spectra obtained in this way allow one to identify
the magnetization direction and strength of a given element, and
to estimate quantitatively the spin (mS) and orbital (mL) magnetic
moments by means of the so-called XMCD sum rules [25–27].
Due to the limited escape depth of low-energy photoelectrons,
XAS measured in the total electron yield mode [24] is inherently
surface sensitive, and has been shown to probe dilute surface
impurities with a concentration down to 3 1012 atoms cm2, corresponding to about 0.002 monolayers (ML) [10].
The XMCD experiments reported here were performed on
beamline ID08 of the European Synchrotron Radiation Facility located in Grenoble, using the photon beam provided by an APPLE
II undulator source with 99 ± 1% circular polarization rate and energy resolution set to about 200 meV. The sample, tightly screwed
at the bottom of a liquid helium flow cryostat, was placed in a thermally-shielded environment between the two coils of a superconducting split magnet, which produced a variable field B of up to 7 T
collinear with the incident X-ray direction. To probe both the outof-plane and in-plane magnetic moments the sample was rotated
with respect to B and the X-ray beam by an angle h comprised between 0° (normal incidence) and 70° (grazing incidence). XAS measurements were performed by recording the sample drain current
as a function of X-ray energy normalized to the incoming photon
2.1. 3d impurities on sp-metal substrates
The behavior of transition-metal impurities in nonmagnetic
metal hosts has attracted attention ever since the discovery of
the Kondo resistance minimum [28]. It is widely recognized that
the extent to which the transition-metal d-states mix with the valence bands of the host directly influences macroscopic measurable
properties such as the electric conductivity, magnetic susceptibility, and specific heat. The work of Friedel [29] and Anderson [30]
on the interaction of a single localized non-degenerate d orbital
with a free-electron gas constitutes the basis of our current understanding of such systems. As shown by Anderson, the preservation
of the impurity magnetic moment depends on the balance between the Coulomb repulsion between electrons with opposite
spins, the hybridization energy between the localized orbital and
the conduction band states of the metal, and the host electron density. As it turns out, these factors influence not only the existence
of a magnetic moment, but also its description in terms of quantum or classical operators. To address such issues in a surface context, a series of experiments was performed on alkali metal
substrates, which, owing to their simple sp electronic structure
represent ideal hosts for studying the interaction between localized 3d states and a free-electron Fermi sea.
The electronic ground state of Fe, Co, and Ni impurities in alkali
metal hosts has been debated among experimentalists [31–38] and
theorists [39,40] for over a decade, in particular with respect to the
3d-valence state, the local moment at the impurity sites, and the
orbital contribution to the total magnetic moment. By combining
XAS and XMCD the ground state and the magnetic moments of
Fe, Co, and Ni impurities on alkali metal surfaces could directly
b
a
L3
XAS (arb. units)
flux given by the photocurrent of a gold grid reference monitor.
Measurements were taken over the L2,3 absorption edges of Mn,
Fe, Co, and Ni, corresponding to the excitation of 2p core electrons
into empty 3d4s states.
Fe1/K
c
L3
Co1/K
L3
Ni1/K
+
I
I–
1
L2
L2
L2
Co d 8
Ni d 9
0
XMCD
I– - I+
XMCD
-1
Fe d 7
705 710 715 720 725 735 775 780 785 790 795 800 805
Photon Energy (eV)
Photon Energy (eV)
850
860
870
880
Photon Energy (eV)
Fig. 2. XAS spectra recorded over the L2,3 edges with parallel (I+, red line) and antiparallel (I, black line) alignment of the photon helicity to the impurity magnetic moment
for (a) 0.015 ML Fe, (b) 0.015 ML Co, and (c) 0.004 ML Ni deposited on K films. The XMCD is shown as I–I+ consistent with the scale of the XAS units. The bottom panels show
the calculated XMCD spectra for d7, d8, and d9 atomic configurations. Adapted from [10].
1815
H. Brune, P. Gambardella / Surface Science 603 (2009) 1812–1830
be determined [10]. Fig. 2 shows the XAS spectra of Fe, Co, and Ni
individual impurities on K films. The impurities were quench-condensed at T = 10 K on multilayer K films previously prepared on a
Cu(1 1 1) surface. The difference with the corresponding bulk elemental spectra [24] is striking: the impurities XAS present narrow
multiplet structures instead of two broad absorption resonances at
the L3 and L2 edges, indicating strong localization of the 3d electrons at the impurity site. Even more remarkably, the comparison
of the experimental data with atomic multiplet calculations [41]
for 2p63dn ? 2p53dn + 1 transitions (see bottom panels of Fig. 2)
indicates that Fe, Co, and Ni have atomic-like ground states with
predominant d7, d8, and d9 character, respectively. Thus, hybridization between d and sp states is, in this case, very limited; the influence of crystal field interactions is also small, likely due to the high
delocalization of the conduction band states of the substrate. On
the other hand, the magnitude of the XMCD is significantly larger
compared to transition-metal bulk atoms and metallic nanostructures [27,42], and consistent with the expectation values of full
Hund’s rules magnetic moments at finite temperature and magnetic field, as reported in Table 1. In particular, the negative (vanishing) XMCD intensity at the L2 edge for Fe and Co (Ni) is an
uncommon signature of the unquenched orbital moment typical
of strongly correlated electrons in free atoms. The expectation values of mL, mS, and the spin dipole moment (mT) projected along the
X-ray beam direction are related by the sum rules [25,26] to the
integrated XMCD signal. Here we report the ratio, R = mL/(mS + mT),
which can be calculated self-consistently from the XMCD spectrum
alone (i.e., without normalization to the isotropic XAS intensity)
Table 1
Calculated Hund’s rules ground state values of the isotropic spin magnetic moment
(mS) and dipole spin magnetic moment (mT), orbitalpmagnetic
ffiffiffiffiffiffiffiffiffiffiffiffiffiffiffiffi moment (mL), total
angular moment (J) and magnetic moment m ¼ g J lB JðJ þ 1Þ, where gJ is the Landé
g-factor, corresponding to the 3d configurations identified on K films. The atomic and
experimental R values are also compared for 0.015 ML Fe, 0.015 ML Co and 0.004 ML
Ni.
Fe d
Co d8
Ni d9
mS
mT
mL
J
m
Rat
Rexp
3
2
1
1
1
2
3
3
2
9/2
4
5/2
6.63 lB
5.59 lB
3.55 lB
3/2
1
2/3
0.95 ± 0.05
0.89 ± 0.04
0.67 ± 0.05
XAS (arb. units)
a
8
6
XMCD
I–I+
z
Co/Pt
B
4
+
I (0°)
I – (0°)
2
L2
I + (70°)
I – (70°)
0
b
c
(111)
L3
XAS (arb. units)
7
[27] and which is temperature and field independent in as much
these parameters do not affect the mixing of electron states with
different total angular momentum J. We find a very good agreement between Rexp deduced from the XMCD measurements and
Rat calculated in the atomic limit for Co and Ni. For Fe there is a discrepancy which is due partly to the imperfect matching of the
measured and calculated d7 XMCD, but that persists also for
R = 1.25 extracted from the theoretical d7 spectrum in Fig. 2a and
is possibly related to finite temperature effects. We note that the
mismatch between the Fe/K and calculated d7 XMCD may be reduced by fine tuning the Slater integral parameters, which has
not been done here in order to present the same type of calculation
for Fe, Co, and Ni.
These measurements allowed us to resolve the ground state and
magnetic moment of 3d impurities on an alkali metal [33–40], as
well as to test the validity of the XMCD sum rules in the precise
context of their derivation, i.e., that of a localized atomic model
[25,26] where mT is not negligible as commonly assumed in itinerant metals [27]. Moreover, there is another important aspect that
stands out, namely the fact that 3d atoms deposited on a metal surface may preserve their atomic-like properties, in particular the
quantization of the spin and orbital moments. This is at variance
with the observation of classically behaving Co impurity magnetization on transition-metal substrates, as shown later in Section 2.2.
In the case of the alkali metals, we find that transition-metal atoms
placed in contact with a low-density free-electron gas (as is the
case for a K surface) undergo an s ? d charge transfer of +1 electron, while the atomic character of the d-states remains almost
unperturbed (see also Fig. 3c). This is not easily explained in the
case of the Anderson model, where intra-atomic and s–d interactions are treated on equal footing [30]. Rather, our observations
call for considering the atomic many-electron states as zero-order
terms of a model Hamiltonian in which interactions with the conduction electrons are treated perturbatively. This approach was explored by Hirst in the 1970s [43], but given only limited
recognition for the lack of direct supporting evidence. However,
it leads naturally to d-shell configurations with integer occupation
numbers, determined by the balance between impurity attractive
potential and repulsive local Coulomb interactions, and to atomic-like mS and mL values. In this model, the correlation effects rep-
0.0
Co/K
Co d 8
-0.5
Co d 7
-8 -6 -4 -2 0 2 4
B (Tesla)
775
780 785 790 795
Photon Energy (eV)
6
8
800
780
790
800
Photon Energy (eV)
Fig. 3. (a) L2,3 XAS spectra of Co impurities (0.03 ML) deposited on Pt(1 1 1) and recorded at T = 5.5 K, B = 7 T with parallel (I+) and antiparallel (I) alignment of the photon
helicity with respect to B at an angle H = 0° relative to the surface normal. (b) XMCD (I–I+) for H = 0° and 70° at B = 7 T. Inset: field-dependence of L3-XMCD for both field
directions. Adapted from [11]. (c) Comparison between the total XAS (I+ + I) after background subtraction for Co impurities on Pt(1 1 1), Co impurities on a K film, and the
calculated XAS for atomic-like d8 and d7 configurations.
1816
H. Brune, P. Gambardella / Surface Science 603 (2009) 1812–1830
resented by the Hund’s rules can only be broken at a large cost of
energy, corresponding to the gap between different dn atomic configurations, which becomes possible only in the limit of very large
host conduction electron density. If such a gap can be overcome,
the impurity d electrons merge into broadened virtual bound states
by mixing with the host s states, as in the Friedel-Anderson approach. This is indeed observed for 3d impurities deposited on
Na, Li, and Cu surfaces, where the free-electron density is roughly
a factor 2, 3, and 6 larger compared to K, respectively. The surface
electron density therefore turns out to be the crucial parameter
determining the extent to which the impurity d-states mix with
the host conduction electrons and thereby governing the magnitude and quantization of the adatom magnetic moment.
2.2. Co impurities on Pt(1 1 1)
Transition-metal substrates differ from alkali metals not only
due to their much larger conduction electron density, but also for
the presence of unfilled d-states crossing the Fermi level, which
heavily affect most of their magnetic properties (e.g., the susceptibility and magnetoresistance) as well as the nonmagnetic ones
(e.g., cohesion, diffusion barriers, catalytic activity, etc.). As an
example of a strongly interacting substrate we present the data
for isolated Co impurities on Pt(1 1 1). The adatom XAS spectra in
Fig. 3a show relatively weak absorption features compared to the
Pt background due to the extremely low concentration of Co adatoms and intense Pt absorption. However, the substrate background can be measured before the adatom deposition and
subsequently subtracted, as done for the experimental XAS
(I+ + I) spectra shown in Fig. 3c, and it cancels out automatically
in the XMCD. The top spectrum of Fig. 3c shows the XAS of Co/
Pt(1 1 1) and reveals broad features typical of Co metal that are
drastically different from the XAS calculated for the vapor-phase
d7 Co configuration shown in the lower spectrum. The spectrum
of Co/Pt(1 1 1) differs also from that of Co impurities deposited on
free-electron metals, where, as we have seen in Section 2.1, the
narrow XAS multiplet structure indicates that the Co ground state
has d8 atomic-like character. On Pt, the impurity 3d-states hybridize strongly with both the 5d and 6s-states of the substrate. Electron delocalization leads to a reduction of intra-atomic
correlation effects, causing a substantial decrease of mS and mL
compared to the vapor-phase. As shown in the diagram of Fig. 1,
the impurity magnetic moments are nonetheless significantly larger than the ones in bulk Co, where mS = 1.52 and mL = 0.15 lB.
According to the XMCD sum rules, the vanishing intensity of the
XMCD at the L2 edge in Fig. 3b indicates that mL is unusually large
for a transition-metal system, with a saturation value
mL = 1.1 ± 0.1 lB measured at T = 5.5 K and B = 7 T applied out-ofplane. This value represents a strong enhancement even with respect to 2D films [44–46], supported nanoparticles [46,47], and
1D atomic chains [42,12]. As shown also by ab-initio calculations
[11,48–50], this trend is naturally to be attributed to the reduced
coordination of the impurities, establishing a gradual transition
from the atomic to the bulk limit governed by the substrate–adatom and lateral adatom–adatom interactions.
Given the pronounced anisotropic spatial extension of the dorbitals, the Co–Pt admixture of 3d and 5d states may lead to unequal filling of wavefunctions with different symmetry, and hence
to a strong anisotropy of the orbital magnetization. As the spin–orbit coupling between mS and mL is taken into account, a strong
magnetic anisotropy of the overall magnetization is to be expected.
Indeed, the magnitude of the XMCD relative to the XAS intensity
measured for B = 7 T applied out-of-plane (h = 0°) and close to inplane (h = 70°) differs by more than 60%, revealing the presence
of extraordinary magnetic anisotropy for the Co adatoms in contact
with the Pt(1 1 1) surface. The magneto-crystalline anisotropy en-
ergy can be determined by means of XMCD by measuring the field
dependence of the L3 minimum along different directions with respect to the substrate normal, as shown in the inset of Fig. 3b. The
fixed-energy L3 intensity depends on the linear combination
mS + 3mL + mT [25,26], but it can be demonstrated that the three
moments mS, mL, and mT follow the same field dependence, i.e., that
the XMCD L3 signal is proportional to the total Co magnetic moment. We find that the adatom magnetization can be adequately
fitted in the framework of a classical model, where the time-averaged projection of the total impurity moment hmi on the magnetic
field direction is given by
R
hmi ¼ m0
^ exp½ðm B þ Kðm
^ B
^ e
^Þ2 Þ=kB TdX
m
:
R
2
^ e
^Þ Þ=kB TdX
exp½ðm B þ Kðm
ð1Þ
Here, m0 stands for the saturation value of the Co plus induced Pt
b represent the unit vectors of the easy axis, the
^, m,
^ and B
moment, e
magnetic moment, and the field direction, respectively, K is a uniaxial
magnetic anisotropy barrier, and the integration is carried out over
the solid angle X of the magnetic moment in spherical coordinates.
The solid lines represent fits of the data by means of numerical integration of Eq. (1) with m and K as free parameters fitted simultaneously for the two curves. Note that, in such a model, all
directions are in principle allowed for the Co magnetic moment,
showing that a classical description is well-suited to describe a
strongly hybridized impurity system, contrary to the case discussed
in Section 2.1. Moreover, owing to the strong Stoner enhancement
factor of Pt, the substrate atoms are highly polarized by 3d transition-metal species, developing a significant intrinsic magnetization
that decays exponentially away from the impurity site. In dilute bulk
CoPt alloys with 1% at. Co concentration, the total moment per Co
atom is of the order of 10 lB [51]. In our case of surface dilute impurities, the fit of Eq. (1) yields m = 5.0 ± 0.6 lB and K = 9.3 ± 1.6 meV.
These values remain unchanged on samples with Co coverage comprised between 0.007 and 0.03 ML showing that magnetic or electronic interactions between the adatoms are negligible.
The magnetic anisotropy energy of individual Co adatoms is
remarkably large even compared to typical hard magnetic systems
such as SmCo5 (K = 1.8 meV per Co atom [52]), Co/Pt and Co/Au
multilayers (K = 0.3 meV per Co atom [53,52]). Different effects
combine in building up such giant anisotropy energy barriers for
Co atoms on Pt(1 1 1): (i) the broken symmetry of the adatoms as
compared to the vapor phase constitutes the necessary condition
to exhibit anisotropic behavior. (ii) The reduced coordination leads
to 3d-electron localization, which augments the orbital and spin
magnetic moments as well as the spin–orbit energy due to increases in the local density of states near the Fermi level [54,55].
(iii) The strong spin–orbit coupling of the Pt 5d-states results in
additional magnetic anisotropy energy of the induced magnetization [11], an effect common to all CoPt compounds [56]. While
(i) determines the angular dependence of the magnetic anisotropy
energy, (ii) and (iii) determine its magnitude. Indeed, the Co/Pt
combination was chosen in order to maximize magnetic anisotropy effects, since hcp–Co presents the largest anisotropy among
3d ferromagnetic elements (K = 0.45 107 erg/cm3 = 0.045 meV/
atom compared to, e.g., 0.005 meV/atom for Fe [57]) and L10-ordered Co50Pt50 alloys have K = 0.8 meV/Co atom [52].
It is well-known that size effects in metallic nanoparticles with
a high ratio of surface to volume atoms influence the saturation
magnetization in cluster beams [58] as well as in surface-supported systems [46,59,47,60,61]. Such effects become dominant
as we reach close to single-digit nanometer dimensions. In this
critical size regime, key questions are how the magnetic anisotropy
energy evolves from single atoms to finite-sized particles, how it
correlates to the atomic magnetic moments, and how both depend
on the details of the atomic coordination.
H. Brune, P. Gambardella / Surface Science 603 (2009) 1812–1830
10
orbital magnetic moment
8
K (meV/atom)
1.2
magnetic anisotropy energy
1.0
0.8
6
0.6
4
0.4
2
0.2
0
0
5
10
15
20
25
30
35
40
0.0
n (atoms)
Fig. 4. (a) Orbital moment mL and anisotropy energy K as a function of the average
for Co/Pt(1 1 1). For comparison, the red and blue dashed-dotted lines
island size n
show the MAE per Co atom of the L10 CoPt alloy and hcp–Co, respectively. The error
bars on the horizontal scale represent the standard deviation of the size distribution
determined by STM. Adapted from [11].
By using the energetic hierarchy of surface diffusion processes
[3], we have studied the development of the magnetic moments
and magnetic anisotropy in monolayer high Co particles starting
from isolated adatoms to 2D islands with an average size of
¼ 40 atoms. While mS is expected to vary in a fairly restricted
n
range between 2.1–2.2 lB for an individual impurity [11,49] and
1.8–1.9 lB for a continuous 2D layer [62], as the majority spin band
is almost filled in all such cases, mL is much more sensitive to
changes in the atomic coordination, reflecting its closer link with
the symmetry and relative filling of the d-orbitals. Fig. 4 shows
the progressive quenching of mL as a function of average particle
. Remarkably, the largest changes of mL are observed for
size n
¼ 3 and 4 atoms mL has already rethe smallest particles: for n
duced to 0.78 and 0.59 lB, respectively. The magnetic anisotropy
energy, as expected, is strongly correlated to the decrease of mL
showing similar drastic changes for one-atom variations of the
¼ 3 atoms, K = 3.3 meV amounts to only
atomic coordination. For n
30% of the individual impurity value, while K drops below the
> 10.
anisotropy energy of the equi-atomic CoPt alloy already for n
The trend evidenced in Fig. 4 shows that an increase by one to
two orders of magnitude in magnetic anisotropy energy with respect to bulk or 2D films can be obtained by reducing the size of
magnetic particles to a few tens of atoms or less on suitable substrates. While this holds on a per atom basis, it is obvious that
the overall stability of the particle magnetization is governed by
the sum of the atomic anisotropy energy contributions. As more
atoms are assembled together to fabricate particles with a large total magnetic moment and a total K strong enough to stabilize ferromagnetic behavior against thermal fluctuations, this gain is
. The
countered by the decrease of K per atom with increasing n
problem, however, can be circumvented by noting that the atomic
coordination rather than the absolute particle size is the key
parameter that governs the magnitude of K, mL, and mS. Surface
supported nanostructures where the shape and composition are
tuned so as to control the coordination of the magnetic atoms
and maximize useful interface effects, such as in core-shell particles [63] and nanowires [64,65], offer very interesting opportunities to exploit such effects.
2.3. Mn impurities on Ge and GaAs surfaces
The investigation of 3d impurities diluted in semiconducting
hosts has attracted enormous interest in recent years thanks to
the discovery of ferromagnetism in (Ga1xMnx)As [66] and
1817
MnxGe1x [67] epitaxial films. Interesting questions in this field relate to the magnetic properties of Mn adsorbed on Ge and GaAs
substrates, in particular to the magnitude of the local magnetic
moment of Mn in a semiconducting matrix and the possibility to
induce two-dimensional ferromagnetism in a Mn-doped surface
d-layer. Efforts aimed at understanding and optimizing the mechanisms responsible for Mn-induced magnetic order in bulk-like
films face the problem that the growth conditions [68] and postgrowth annealing procedures [69–71] affect the Curie temperature
and the saturation magnetization in a way that is often hard to
control, as the concentration and distribution of Mn dopants, the
charge carrier density, the presence of structural defects such as
Mn interstitials, Mn clusters, and As antisites in (Ga1xMnx)As significantly influence the magnitude and sign of the magnetic coupling. A well-known example of this situation is the
magnetization deficit that is found both in (Ga1xMnx)As [72–76]
and MnxGe1x [67] when comparing the experimental saturation
magnetization with that predicted on the basis of the Mn concentration and theoretical estimates of the Mn local moment. Deviations from the expected 4 lB [77,78] and 3 lB [67,79,80] per Mn
atom in (Ga1xMnx)As and MnxGe1x are in the range of 20–80%
[72,73] and 45–60%, respectively. The study of surface impurities,
on the other hand, reveals Mn moments in agreement with theoretical estimates and has allowed to identify the origin of the magnetization deficit [13].
For these studies, single crystal Ge(1 0 0), Ge(1 1 1), and
GaAs(1 1 0) surfaces were prepared in ultra-high-vacuum by repeated Ar+ sputtering and annealing cycles to 650 °C. The clean
Ge(1 0 0) and Ge(1 1 1) surfaces showed the characteristic low-energy electron diffraction (LEED) patterns of the (2 1) and
c(2 8) reconstructions, respectively, and GaAs(1 1 0) the expected
(1 1) LEED pattern, although the precise stoichiometry of this
surface remained undetermined, as preferential sputtering of As
is likely to lead to Ga-rich surface layers. Mn atoms were deposited
at a temperature of 5 K to inhibit surface diffusion and subsequent
cluster formation and with coverages below the nucleation threshold of statistical growth defined by the coverage where 10% of the
islands are dimers and situated for square lattices at 0.05 ML [3].
Coverages of up to 0.35 ML were investigated, where
1 ML = 6.2 1014 atoms/cm2 for the bulk-truncated Ge(1 0 0) surface is taken as a reference unit. Fig. 5a shows the circularly polarized XAS spectra for individual Mn atoms deposited on Ge(1 0 0),
Ge(1 1 1), and GaAs(1 1 0) recorded at 5 K with applied field
B = 6 T. As for Co/Pt, the impurity L2,3 XAS is superposed to a strong
nonmagnetic background signal from the substrate, which gives no
contribution to the XMCD, shown in (b). XAS and XMCD spectra are
also reported for individual Mn atoms deposited on a K film and for
a d5 ground state calculated within a multiplet approach [41]. Contrary to Fe, Co, and Ni impurities investigated in the previous section, which change their atomic ground state from dn to dn + 1, Mn
is found to retain a pure d5 configuration on K owing to the stability of a half-filled d-shell. It is therefore practical to adopt Mn/K
spectra as representative of a pure 6S5/2 ground state, justified also
by the excellent agreement with the calculated I+, I, and I–I+
spectra for such a configuration and the Brillouin fit of the XMCD
magnetization with J = 5/2 reported in Fig. 5c.
Mn/Ge(1 0 0), Ge(1 1 1), and GaAs(1 0 0) XAS and XMCD spectra
present broader multiplet features compared to Mn/K, revealing
that the ground state of Mn atoms in contact with Ge and GaAs
surfaces is not purely d5 owing to varying degrees of hybridization
of the impurity d-states on different substrates, similarly to what is
observed for submonolayer Mn films on metal surfaces [81]. This
result is in contrast with previous XMCD studies of (Ga1xMnx)As,
where the XAS was interpreted in terms of either pure d5 [73] or a
d4–d5–d6 [76,82] admixture, but the XMCD was invariably assigned
to the pure d5 state with the hypothesis of coexisting magnetic and
1818
H. Brune, P. Gambardella / Surface Science 603 (2009) 1812–1830
a
c
I+
I–
0.8
M (arb. u.)
XAS (arb. units)
1.0
0.6
0.4
0.2
Mn1/ K
Mn1/ K 0.01 ML
0.0
1.0
Mn1/ Ge(100)
Mn1/ Ge(111)
Mn1/ GaAs(110)
Mn d
M (arb. u.)
0.8
0.6
0.4
Mn1/ Ge(100) 0.006 ML
Mn / Ge(100) 0.12 ML
Mn / Ge(100) 0.36 ML
0.2
5
0.0
b
0.6
Mn d5
Mn1/ K
0.2
0.4
0.2
Mn / Ge(100) 0.09 ML
Mn / Ge(100) 0.18 ML
-0.4
0.0
0.0
0.6
Mn1/ Ge(100)
-0.2
Mn1/ Ge(111)
Mn1/ GaAs(110)
-0.4
M (arb. u.)
XMCD (arb. units)
M (arb. u.)
0.4
0.4
0.2
Mn1/ GaAs(100) 0.03 ML
Mn / GaAs(100) 0.24 ML
0.0
640
645
650
655
Photon Energy (eV)
+
660
0
1
2
3
4
5
6
7
Magnetic field (T)
Fig. 5. (a) I , I absorption spectra of individual Mn impurities on K, Ge(1 0 0), Ge(1 1 1), and GaAs(1 1 0) surfaces. The Mn coverage is 0.01, 0.03, 0.02, and 0.03 ML, respectively,
T = 5 K, B = 6 T. (b) I–I+ spectra scaled to the I+ + I intensity integrated over the L3 edge. Multiplet calculations of I+, I, and I–I+ are shown for 2p63d5 ? 2p53d6 transitions of
a fully spin-polarized d5 atomic ground state in the limit of zero crystal field and at T = 5 K. (c) Magnetization of Mn/K, Mn/Ge(1 0 0), Mn/Ge(1 1 1), and Mn/GaAs(1 1 0) as a
function of applied field and coverage. The solid lines represent fits to the lowest coverage data according to a Brillouin (Mn/K, Mn/Ge(1 0 0)) or Langevin function (Mn/
Ge(1 1 1), Mn/GaAs(1 1 0). The magnetization units are scaled to the saturation magnetization derived from the fits. Adapted from [13].
nonmagnetic Mn species. The magnitude of the XMCD effect relative to the XAS signal, moreover, shows that individual Mn impurities are strongly magnetic compared to Mn in (Ga1xMnx)As
films, where a much smaller dichroism is observed [73–76,83].
Further, the I–I+ amplitude scaled by the L3 absorption intensity
R þ
ðI þ I ÞdE (Fig. 5b) indicates that the Mn magnetic moment is
L3
different on Ge(1 0 0), Ge(1 1 1), and GaAs(1 1 0). In particular, it is
largest on Ge(1 0 0) and progressively reduced on GaAs(1 1 0) and
Ge(1 1 1). The XMCD sum rules allow in principle to determine
quantitatively both mS and mL; however, while mL is ‘‘safe” the derivation of mS depends on the ability to separate the L3 and L2 XMCD
integrated intensity, which may lead to errors as large as 50%
[82,41] in the case of Mn and the lighter 3d elements, due to the
reduced spin–orbit splitting of the 2p3/2 and 2p1/2 core levels. A
way around this problem is discussed in Ref. [13] and relies on
using the Mn/K XMCD as a reference for the known expectation va-
lue mS = 5lB for the 6S5/2 ground state. The values of mS estimated
in this way and the ones of mL are reported in Table 2.
We find that, whereas mS for Mn/GaAs(1 1 0) is close to the predicted 3.7–4.0 lB [77,78] and to the value of 4.5 lB recently derived
by XMCD in Ref. [82], mS on Ge surfaces is significantly larger than
the 1.4–1.9 lB measured in MnxGe1x films [67]. Ab-initio calculations for bulk MnxGe1x consistently indicate mS = 3 lB and an
e2g ð"Þt 22g ð"Þt12g ð#Þ Mn configuration [67,79,80], arising from strong
hybridization with the Ge 4p states. Interestingly, while the moment of Mn/Ge(1 1 1) is in good agreement with that calculated
for bulk impurities in Ge [67,79,80] and on Ge(1 1 1) [84], Mn/
Ge(1 0 0) presents a much larger mS. This difference is attributed
to the local coordination of Mn atoms on Ge(1 1 1) and Ge(1 0 0)
[85]. In particular, the presence of dangling bonds on the c(2 8)
reconstructed Ge(1 1 1) surface is likely to lead to stronger hybridization between the Mn 3d and Ge 4p states compared to Ge(1 0 0),
H. Brune, P. Gambardella / Surface Science 603 (2009) 1812–1830
Table 2
Spin (mS) and orbital magnetic moment (mL) for 0.01 ML Mn adatoms on K,
Ge(1 0 0), Ge(1 1 1), and GaAs(1 1 0) derived from Fig. 5 by applying the XMCD sum
rules. Total angular moment (J), and classical magnetic moment (m) obtained by
fitting the Mn L3 XMCD vs. applied magnetic field using a Brillouin and Langevin
function, respectively.
Mn/K
Mn/Ge(1 0 0)
Mn/Ge(1 1 1)
Mn/GaAs(1 1 0)
mS ( lB)
mL ( lB)
J
m ( lB)
5
4.8
3.3
4.0
0
0.07
0.13
0.07
2.5
2.4
–
–
–
–
3.0
3.7
and to the concomitant reduction of mS. We caution here that different adsorption sites may be occupied by Mn on semiconducting
substrates, but that site-dependent magnetic moments cannot be
distinguished in the present study. Both scanning tunnelling
microscopy and theoretical investigations, however, indicate a
strong preference for hollow adsorption sites on Ge(1 1 1) and
Ge(1 0 0) [84,85], whereas large energy barriers for diffusion and
subsequent incorporation prevent Mn to reach subsurface sites at
low temperature. We note also that small but positive mL (parallel
to mS) are observed, which reflect deviations from the ideal d5 case
with mL = 0. The larger mL found for Mn/Ge(1 1 1) is consistent with
the increased hybridization and related broadening of the XAS and
XMCD features for this surface relative to Mn/Ge(1 0 0) and Mn/
GaAs(1 1 0).
Finally, we have investigated the possibility of achieving ferromagnetism limited to one or a few surface atomic layers as a function of Mn concentration, an issue of fundamental as well as
practical interest to control spin-polarized electron transport
across heterogeneous interfaces. We remark that ferromagnetic
coupling would be expected in a Ruderman–Kittel–Kasuya–Yosida
picture of hole-mediated ferromagnetism and that the radial decay
of the impurity–impurity oscillatory interaction changes from 1/r3
in bulk to 1/r2 in a two-dimensional surface system. In contrast
with this expectation, however, we find that all samples with coverage in the range 0.006–0.35 ML display paramagnetic behavior,
independently of their extrinsic bulk doping [2 1018 cm3 ndoped Ge and GaAs, and 2 1019 cm3 p-doped Ge] and despite
the fact that Mn impurities typically act as acceptors in these
materials. The absence of magnetic coupling even for relatively
high Mn concentrations compared to bulk ferromagnetic
(Ga1xMnx)As and MnxGe1x is thus attributed to the different electronic properties of bulk and surface semiconductors and, tentatively, to a low carrier/dopant yield, as also observed for d-doped
Mn layers in GaAs [86]. Increasing the Mn coverage at temperatures below the surface diffusion threshold leads to the statistical
formation of Mn clusters of increasing size. The formation of Mn
metal clusters as a function of coverage is accompanied by the decrease of the XAS-normalized XMCD signal, which indicates a reduced magnetic moment per Mn atom relative to individual
impurities. By analyzing the concomitant trend of the linear
dichroism signal as well as temperature annealing effects, such a
decrease can be related to antiferromagnetic alignment in the
Mn clusters [13]. We believe that this is also the leading cause of
the magnetization deficit in bulk-like films of Ge1xMnx and
(Ga1xMnx)As.
As expected from such small orbital magnetization values, no
significant magnetic anisotropy was found for the Mn adatoms.
The shape of the XMCD magnetization curves in Fig. 5c thus depends only on the magnetic moment per Mn atom at a given field
and temperature. Remarkably, when superposed to each other, the
curves show only a very weak coverage dependence, consistent
with the fact that only the Mn moment of individual or uncompensated adatoms contributes to the XMCD. We find that the curves
1819
for Mn/K and Mn/Ge(1 0 0) can be fitted using a Brillouin function
with J values of 2.5 and 2.4, respectively, which gives a magnetic
moment for Mn/Ge(1 0 0) in very good agreement with the sum
rule estimate. On the other hand, a Brillouin fit of Mn/Ge(1 1 1)
and Mn/GaAs(1 1 0) yields magnetic moments that are a factor 3
or more smaller compared to the sum rule estimates. A Langevin
fit, in this case, is in much better agreement with the sum rule moments (Table 2). As the former reflects the quantization of the
angular moment expectation values and the latter the behavior
of a classical magnetization vector, we may conclude, as observed
also for Co/K and Co/Pt(1 1 1), that increasing the adatom–substrate
hybridization also means a stronger tendency of the magnetic moment to behave in a classical way.
3. Magnetism of individual surface adsorbed atoms probed by
STM
Since very recently, STM has become a mature technique for the
quantitative study of the magnetism of individual atoms adsorbed
on surfaces. The present section gives an account of the evolution
of this technique, from the first observations of the signatures of
magnetism of individual adatoms, to the quantitative determination of their effective spin moments, exchange, and anisotropy
energies.
We start this section with the detection of magnetism by transport measurements through atomic point contacts. The results
suggest that the spin degeneracy of the two conductance channels
is lifted for magnetic atoms (Section 3.1). We then describe STM
experiments where the LDOS features caused by the strong effect
of magnetic impurities on superconductivity were explored, first
with magnetic atoms placed on singe crystal surfaces of superconductors, and second with superconducting tips approaching magnetic atoms adsorbed on normal samples (Section 3.2). The first
STM measurements successful in quantifying the magnetic properties of adatoms are very recent. Magnetic anisotropy and exchange
coupling energies with the neighbors in atomic chains have been
deduced from the energies of spin excitations in inelastic electron
tunneling spectroscopy (IETS) and are described in Section 3.3. Entire magnetization curves could be recorded over single atoms
with spin-polarized (SP) STM (Section 3.4). Most recently, the combination of IETS and LDOS measurements has been used to reveal
the role of magnetic anisotropy in the Kondo effect (Section 3.5).
Our review of these examples intends to illustrate how the initial
satisfaction to detect signatures of magnetism in atoms with the
STM has now been replaced by the capacity of quantifying the
effective spin, the anisotropy energies, the magnetic ground and
excited state configurations, and of measuring entire magnetization curves. This evolution of STM as a sensor of atomic magnetism
moves on rapidly and is expected to make significant contributions
to our understanding of quantum magnetism, of magnetic impurities in solids and on thin films such as graphene, of molecular magnets, and of the magnetism of nanostructures in general.
In the literature, ample account has been given of the detection
of Kondo signatures of individual atoms with the STM [87,88]. We
therefore restrict ourselves to describe how these experiments are
performed and refer to the literature for the most recent examples
[89]. The differential conductance dI/dV is recorded at low temperature and with the STM tip positioned at constant height over the
magnetic atom. To a good approximation, dI/dV can be associated
with the sample LDOS which shows a sharp resonance at EF if
the atoms are Kondo screened. This resonance has been observed
in photo-electron spectroscopy (PES) [90–92]. However, due to
interference between electrons tunneling between substrate and
tip and between adsorbate and tip, a Fano line shape results in
the STM spectra [17,18]. The spatial resolution of STM enables to
1820
H. Brune, P. Gambardella / Surface Science 603 (2009) 1812–1830
study the lateral extent of the Kondo cloud and the effect of the
atomic environment onto the Kondo features, whereas angle-resolved (AR) PES has the advantage of k-resolution, which the
STM can only achieve for the in-plane components of k by looking
at quantum interference patterns of surface state electrons scattering off impurities or steps [93–95].
The spin polarization of a single atom can in principle be measured with STM by means of Andreev reflection, as done for ferromagnets in mesoscopic point contacts with superconductors
[96,97]. Single [98,99] and multiple [100] Andreev reflections have
been observed with the STM. However, this has so far not been
used to study single magnetic atoms, we therefore refer the reader
to the literature also on this subject.
3.1. Transport in single magnetic atom point contacts
Magnetic atoms or molecules are expected to lift the spin
degeneracy and therefore to exhibit characteristic transport properties when placed into atom point contacts distinguishing them
from nonmagnetic species. After an introduction to quantized conductance we describe experiments performed by L. Bürgi in the
laboratory of D. Eigler showing conductance through a single spin
channel for Gd/Cu(1 0 0) [101]. This observation is in accordance
with a calculation finding fully lifted spin degeneracy for ferromagnetic ballistic contacts [102].
The conductance G = rA/L of a wire with cross section A and
length L becomes ballistic and reaches a finite value for L < Lm
and L < LU, where Lm denotes the mean free path and LU the phase
relaxation length of electrons in the solid of interest [103]. The finite value is an integer multiple of the quantum of conductance
G0 = 2e2/h. This can be derived by assuming a free-electron gas confined in a wire along z by a potential U(x,y). Since the potential does
not vary along z the solutions of the Schrödinger equation are
transverse modes i, denoted by quantum numbers (nx,ny), each of
them creating a separate subband with free-electron dispersion
along kz, which we call k for simplicity. Upon connecting this gas
to two ideal reservoirs with potential difference V, each mode carries a current Ii = e(e Vqi(EF))v g,i(EF). The group velocity vg,i(E) cancels out since the density of states of a 1D free-electron gas is given
by qi(E) = 2m/p⁄2ki(E) = 2/hvg,i(E), and one finds the simple
expression
G¼
1X
2e2
Ii ¼
N ¼ NG0 ;
V i
h
ð2Þ
where N is the number of modes for which Ei < EF. A magnetic impurity may lift the spin degeneracy in the mode energies such that
modes close to EF may be moved above EF for one spin channel such
that the current is entirely carried by the other spin channel leading
to a conductance per transverse mode of only G0/2.
From Eq. (2) one expects conductance plateaus to appear for a
contact with increasing lateral dimension, each time new transverse modes cross EF. However, a necessary condition for the plateaus to be observed is that the lateral dimension of the contact
is of the same order of magnitude as the Fermi wave length kF,
otherwise scattering smears out the conductance steps.
Quantized conductance has been reported in experiments
where the high-mobility 2D electron gas (2DEG) located at semiconductor interfaces has been constricted by gate electrodes
[104,105]. For these systems LU and Lm reach lm values and
kF 500 Å. Therefore quantized conductance becomes apparent
in relatively large constrictions, implying very small transverse
mode energy separations DE < 1 meV necessitating sub-Kelvin
temperatures for them to be resolved. In metals kF 3 Å requires
atomic size constrictions for conductance quantization to be observed, but offers several eV level spacings and enables observation
of quantized conductance at room temperature. This has been realized in metallic break-junctions [106–109] even in classroom
experiments [110]. However, the conductance steps for N > 1 were
often observed at non-integer values of G0 and their height varied
significantly between subsequent experiments. Both observations
were explained by a combination of STM and atomic force microscopy (AFM) revealing that conductance steps beyond G0 were always accompanied by irreversible atomic rearrangements of the
contact [111,112]. Conductance measurements in junctions between STM tips and the atomic terraces of single crystal metal surfaces revealed the transition from tunneling to quantized
conductance [112–116], however, this transition was abrupt as it
has been accompanied by irreversible atomic rearrangements
when G0 was reached [117], similar to the observations in breakjunctions [118]. This ‘‘jump to contact” leads to ill defined restriction geometry.
Well defined single atom contacts with fully reversible electrical conductance changes could be achieved in low temperature
STM experiments making contact to isolated atoms adsorbed onto
single crystal terraces. Reversible opening and closure of such contacts has first been demonstrated for Xe atoms adsorbed onto a
Ni(1 1 0) surface contacted by a W tip with an apex onto which a
Xe atom has been transferred from the sample [114]. The resistance across the resulting two Xe atom ‘‘wire” leveled off at
10 MX. This high value compared to G1
0 ¼ 12:9 kX was explained
by conductance through the Xe 6s resonance lying far above EF.
The first reversible transition from tunneling to contact between single metallic atoms has been observed for a Au tip
approaching a Mn atom adsorbed onto Cu(1 0 0) [101]. The blue
curve in Fig. 6a shows the conductance trace upon approaching
the tip to the sample starting from the gap resistance of
Rt = 1.29 M X, where the tip has been stabilized before opening
the feed back loop and defining z = 0 Å. The conductance increases
exponentially with a slope corresponding to a tunnel barrier of
about 4 eV, as expected for clean metal electrodes. The curve flattens smoothly out at zc, from where the conductance takes on a
constant value very close to G0. The conductance trace for retracting the tip is shown in red and perfectly overlays with the one recorded during approach. Reversibility is further proven by the
constant current images in the inset recorded before and after having performed conductance measurements up to point contact on
both the Mn and the Gd atom. The apparent heights and positions
of the atoms did not change which is strong evidence for the absence of any atomic rearrangements on tip and sample. Reversible
and smooth transitions from tunneling to one quantum of conductance were also reported for W-tips on Ag/Ag(1 1 1) and Cu/
Cu(1 1 1) [115].
The conductance traces in Fig. 6b show electrical transport
through two Mn atoms in series, one adsorbed onto the Au tip
and the other on the Cu(1 0 0) surface [101]. Again, there is a
smooth transition from tunneling to point contact. The different
colors stand for different atomic configurations at the Au tip apex
before adsorbing the Mn atom onto it. The tip dependence was
found to be reduced significantly for two Mn atoms in series compared to contacts from the Au tip directly to the Mn adatom [101].
The plateau has an average value of (0.95 ± 0.04)G0. The most obvious interpretation of this result is that there is exactly one spin
degenerate conductance channel with almost perfect transmission.
Break-junction measurements and STM experiments where tipsample necks have been opened found the number of current carrying modes of one-atom contacts to be determined by the number
of available valence orbitals [109]. There are 7 in the case of Mn but
the data in Fig. 6b are suggestive of 6 contributing very little or not
at all, while one being the main and almost perfect channel. Conductances very close to G0 have also been reported for reversible
and well defined atomic STM contacts on Ag, Au, Cu, and Co ada-
H. Brune, P. Gambardella / Surface Science 603 (2009) 1812–1830
a
plateau values [101]. An average over 10 traces yields
(0.52 ± 0.10)G0 which is very close to half the quantum of conductance. However, there is significant scattering of the plateau values
and of the shape of the traces for different microscopic tip geometries. Due to time limitations the measurements were recorded
only with a Au tip. It would have been interesting to see whether
the scattering around G0/2 would have been reduced for two Gd
atoms in series, as in the case of Mn. Seen that all adatoms other
than Gd had conductances very close to G0 and therefore one spin
degenerate channel with almost perfect transmission, it is unlikely
that Gd has spin degenerate transport with a transmission of only
1/2. It is much more plausible to attribute this finding to spinpolarized transport caused by the 4f magnetism of Gd lifting the
spin degeneracy and thus leading to conductance through only
one spin channel.
In contrast to Gd, conduction through Co adatoms did show values very close to G0 and not G0/2 [119,120]. The substrates used for
the Co conductance traces were Cu(1 1 1) and Cu(1 0 0), which both
show Kondo screening with Co. The Kondo signatures prevail up to
contact, as seen in dI/dV-curves recorded in contact [119,120],
whereas such curves on Gd showed perfect Ohmic behavior
[101]. The adsorption complex composed of the Co adatom and
its screening cloud in the substrate forms a nonmagnetic manybody singlet ground state around EF and therefore lifting of spin
degeneracy is not expected, while the unscreened magnetism of
Gd does seem to lift the spin degeneracy. More measurements
are needed to ascertain this signature of magnetism in transport
across magnetic atoms adsorbed onto surfaces.
1
approaching
G (2e2/h)
retracting
zc
0.1
0.01
0
G (2e2/h)
b
-1
-2
-3
1.0
0.5
0.0
0
-1
-2
3.2. Subgap states caused by magnetic atoms in proximity of
superconductors
-3
G (2e2/h)
c
0.5
0.0
0
-1
-2
1821
-3
z (Å)
Fig. 6. (a) Electrical conductance during reversible closure and opening of a point
contact between a Au STM tip and a Mn atom adsorbed on Cu(1 0 0). Inset: constant
current STM images of Gd and Mn adatoms recorded before (top) and after (bottom)
conductance measurements on both atoms (36 Å 36 Å, apparent heights
DzGd = 2.2 Å and DzMn = 1.5 Å, Vt = 0.1 V, It = 1.0 nA). (b) Conductance through an
atomic junction of two Mn atoms, the first being adsorbed at the tip apex and the
second on a Cu(1 0 0) surface. (c) Conductance traces with a Au tip centered over a
Gd atom on Cu(1 0 0). (b) and (c) Traces with different atomic configurations at the
tip apex are displayed in different colors. In all cases z = 0 Å corresponds to a gap
resistance of 1.29 MX and the conductance is recorded by monitoring It(z) at
Vt = 2.58 mV and T = 5.6 K. From [101].
toms [119]. This strongly suggests the idea of a single conductance
channel with almost perfect transmission irrespective of the chemical identity of the metal atom in contrast with the main conclusion of Ref. [109]. Attempts to enhance the conductance beyond
this value lead to atomic rearrangements [101].
Conductance traces of a junction formed by a Gd atom adsorbed
onto Cu(1 0 0) and a Au tip (Fig. 6c) level off at significantly lower
Low lying bound quasiparticle excitations with electron-hole
asymmetry are distinctive signatures of magnetic impurities in
superconductors and can therefore be used to identify magnetism
of single magnetic atoms in contact with or in close vicinity of a
superconductor.
The strong effect of magnetic impurities on superconductivity
manifests itself by the large reduction of the transition temperature Tc caused by a reduction of the order parameter around the
impurities leading to the appearance of quasiparticle excitations
within the gap [121]. Such excitations have first been observed
in planar tunnel junctions doped with magnetic impurities
[122,123]. In such spatially averaging measurements, the electron-hole asymmetry vanishes and the features in the local density
of states (LDOS) become symmetric with respect to EF, leading to
the name mid-gap states.
The first spatially resolved measurement of the effect of magnetic impurities on the superconducting DOS has been reported
from low-T STM experiments with Au tips on a Nb(1 1 0) surface
[16]. Fig. 7a shows differential tunneling conductance measurements which can be associated with the quasiparticle LDOS of
the sample since tips with a featureless LDOS close to EF were used.
The spectrum over clean Nb(1 1 0) shows a gap which is perfectly
fitted by thermally broadened (T = 3.85 K in agreement with the
microscope operating temperature of T = 3.8 K) BCS density of
states yielding a gap of Dsurf = 1.48 meV very close to the bulk value of Dbulk = 1.53 meV (Tc,bulk = 9.3 K). Near magnetic impurities
the authors observed quasiparticle excitations inside the gap,
which were localized at a radius r < 12 Å around the impurity.
These are far shorter length scales than the superconducting coherence length of n0 = 390 Å. The Mn induced bound states are best
seen in the difference spectrum shown in Fig. 7b. There is an overall enhancement of the LDOS which is clearly asymmetric with respect to EF. It has its maximum intensity for the tip centered above
the Mn atom. Gd adatoms showed similar LDOS features within the
1822
H. Brune, P. Gambardella / Surface Science 603 (2009) 1812–1830
dI/dV (arb. units)
0.4
Mn
Ag
1.2
0.2
0.0
0.8
Au
-8
0.4
Mn
-6
-4
-4
Over Mn
Bare Nb
Nb (110)
0.0
-8
-6
-2
0
2
4
6
-2
0
2
4
6
dI/dV (arb. units)
b
a 1.6
-0.2
8
E (meV)
8
E (meV)
dI/dV (arb. units)
c
d
1.6
1.05
1.2
1.00
0.8
0.95
Au
Nb
0.4
Cu (100)
0.0
-8
-6
-4
-2
-8
Gd trimer
Cu before
Cu after
Gd
0
2
4
6
-6
-4
-2
0
2
4
6
8
E (meV)
8
E (meV)
Fig. 7. (a) Scanning tunneling spectra recorded with a Au tip once over bare Nb(1 1 0) and once centered above a Mn adatom. (b) Difference spectrum between bare Nb(1 1 0)
and Mn shows asymmetric bound state which is absent for Ag. Tip stabilization at Vt = 10 mV, It = 1.0 nA, T = 3.8 K, from [16]. (c) Spectra taken with a superconducting Nb
cluster at the apex of a Au tip over a Gd trimer adsorbed on Cu(1 0 0) compared with the reference spectra over bare Cu(1 0 0) taken before and after the Gd trimer spectrum.
(d) Spectrum over Gd trimer divided by reference spectrum showing again bound state, this time due to the magnetic cluster in proximity of the superconducting tip. Tip
stabilization at Rt = 2 MX, modulation amplitude Vmod = 0.35 mV for Lock-in detection of dI/dV, T = 5.6 K, from [101].
gap, however, with inverted asymmetry and with the maximum
intensity localized at r = 6 Å off the impurity center. As Fig. 7b
shows, Ag adatoms on Ni(1 1 0) have no LDOS features in the gap,
as expected for ostensibly nonmagnetic atoms.
The Mn induced LDOS in the superconducting gap could be
reproduced within a model introducing a spin-dependent exchange potential J and an ordinary scattering potential U, both having non-zero values inside a radius a around the impurity. The
order parameter was assumed to vanish for r < a and to take on
the Nb bulk value outside. The most important parameter is J as
it breaks the time-reversal symmetry between electron and holelike states and therefore produces the experimentally observed
asymmetry. The best agreement with the difference spectrum of
Fig. 7b was achieved for J = 4 eV and a = 2.5 Å. Variations of U from
0 to 0.15 EF, together with variations of J by ±5% around 4 eV, did all
fit the data equally well. Therefore J is well determined by the
experiments, while U is not. Note that J can only be retrieved from
the local measurements, since only they reveal the asymmetry.
Spatial averaging of the tunneling spectra over the surface spot
where the impurity showed its effect removed the asymmetry, in
agreement with observations from planar junctions. Bound state
excitations have also been observed in STS measurements on Ni
impurities located near the surface of a high-Tc superconductor,
where magnetic impurities have been proposed to contribute to
superconductivity, rather than to quench it [124].
The detection of individual magnetic atoms adsorbed on the
surface of a normal metal has been achieved by inverting the above
configuration of the electrodes [101]. For this purpose, Au tips with
a superconducting Nb cluster at their apex have been prepared,
and their superconducting properties have been characterized by
recording dI/dV-curves on normal and on superconducting surfaces. The spectra in Fig. 7c show the symmetric and thermally
broadened BCS gap (Dtip = 1.2 meV) of such a tip over Cu(1 0 0), together with an asymmetric spectrum recorded with the very same
tip above an adsorbed Gd trimer. Tip changes between the two
spectra can be excluded, since the control spectrum recorded afterwards on Cu(1 0 0) is identical to the one before. Fig. 7d shows the
Gd3/Cu(1 0 0) spectrum divided by the reference spectrum. It
clearly reveals the asymmetric subgap features reminiscent of
magnetic impurities in proximity of a superconductor. Test experiments with the Gd trimer on a superconductor (Nb(1 1 0)) and a
superconducting tip (Au wire with a Nb cluster on the apex)
showed that the Gd3-related LDOS features became more and more
symmetric as the tip was approached, until an entirely symmetric
spectrum was obtained at Rt = 500 kX [101]. At that point the effect of the magnetic impurity on both electrodes became identical
proving that an STM tip can be brought in sufficient proximity to a
magnetic impurity to induce the same effects as if the impurity
was adsorbed directly onto it. Therefore the subgap features in
Fig. 7d can unequivocally be attributed to the magnetic moment
H. Brune, P. Gambardella / Surface Science 603 (2009) 1812–1830
of the Gd trimer. According to Fig. 7b no such features are observed
for nonmagnetic atoms. Note that similar to the quantized transport measurements discussed above, no signatures of magnetism
are observed in superconductors in proximity of magnetic impurities which are Kondo screened. The difference spectra obtained
with Nb-tips above Co/Cu(1 1 1) showed asymmetric dips which
were perfectly described by a Fano function [89], and the spectrum
for Co/Ag(1 0 0) could be fitted by combining a BCS LDOS with a
Fano function [125].
There are several ways to prepare superconducting STM tips.
For instance, PtIr-tips have been covered by Pb layers and then
capped by proximity coupled Ag thin films [126], but also etched
or machined bulk Nb [127], Al [128], and Pb [98,128] tips have successfully been used. It has been shown that STM tips may remain
superconducting up to higher magnetic fields than bulk critical
fields [129]. Altogether, this encourages the use of superconducting tips for the detection of magnetism through the induced
asymmetric bound states. In addition, they may be used as source
for spin-polarized electrons [130,131]. Theoretically, a 100% polarized electron source could be created by adsorbing a magnetic
impurity onto a superconducting tip. Depending on the magnitude
of the exchange potential J the electronic spin of the subgap excitations can be parallel or anti-parallel to the one of the magnetic
impurity [132–134]. If this impurity has a stable moment it would
act as a stable source of polarized electrons at the excitation energy. This has first been proposed in Ref. [101] and realized in
Ref. [89], but unfortunately on a Kondo screened magnetic impurity calling for repetition of this experiment on unscreened magnetic
impurities.
A
final
promising
application
of
superconducting tips are scanning Josephson junctions, e.g., for
the study of lateral variations of the superconducting order
parameter.
3.3. Spin excitation spectroscopy with the STM
The group of A. Heinrich constituting the low-T STM lab
founded by D. Eigler at IBM Almaden has pioneered spin excitation
spectroscopy as a tool to quantify the magnetic properties of individual atoms or clusters [20,135,21]. The technique relies on
inelastic scanning tunneling spectroscopy (ISTS) measuring excitation energies with high lateral resolution and is inspired by inelastic electron tunneling spectroscopy (IETS) work on planar tunnel
junctions [136,137]. The excitations can be vibrations [138] or
changes in the magnetic state of atoms or molecules in the tunnel
junction [20,135,21], as well as surface magnons [139]. With
increasing tunnel voltage one observes a conductance step each
time the tunneling electrons reach the threshold energy needed
to excite the system since this opens a new inelastic conductance
channel. For magnetic atoms, the energies and amplitudes of the
conductance steps deliver valuable information on their magnetic
ground state and anisotropy, and in the case of clusters also on
the Heisenberg exchange coupling between the atoms in the cluster. Finally, the symmetry of the curves about EF bears information
on the spin polarization of the tip.
The first ISTS steps stemming from spin excitations were reported [20] for Mn atoms in an external magnetic field and adsorbed on the self-limiting Al10O13-layer formed by oxygen
exposure of a NiAl(1 1 0) surface [140]. Due to the small energies
involved, the measurements had to be performed at 0.6 K. The step
energies were proportional to the magnetic field, Estep = glBB,
yielding the Landé g-value for Mn atoms as a function of their
adsorption site. The results were close to the free-electron value
of 2.0023, with 5% variations caused by the atomic environment
of the Mn atoms. The amplitudes of the conductance steps were
very sensitive (20–60%) to the atomic environment. Mn atoms adsorbed directly onto NiAl(1 1 0) did not show the steps, signifying
1823
that either the insulating layer is needed to enhance the cross section for spin scattering, or that the Mn spin is modified by stronger
hybridization due to direct adsorption on the metal surface.
The spin excitation steps were also found placing the Mn atoms
on a different ultrathin insulator, namely on a Cu2N–c(2 2)-layer
on Cu(1 0 0) [135]. Fig. 8a shows an STM image of square Cu2N-islands coexisting with clean Cu rims appearing as narrow vertical
and wider horizontal ridges. The island pattern is typical for chemisorbed N on Cu(1 0 0) [141]. The island size is determined by an
optimum between strain and edge energy and they order by
long-range elastic interactions mediated by the substrate [142].
The insets in Fig. 8c and d show the topview of the c(2 2)-structure. DFT-calculations show that the N atoms are almost at the
same height as the first atomic Cu plane [21]. One therefore speaks
of a Cu2N-layer rather than of a N/Cu(1 0 0)–c(2 2) adlayer.
Vertical atom transfer [143,144] was used to assemble straight
Mnn chains with the STM. The chains displayed a striking parity
dependence in their ISTS steps. Chains with even number of atoms
n had no step close to 0 eV but large steps at several meV energy,
while chains with odd n displayed zero-energy steps together with
less pronounced ones at higher energy. The absence of low-energy
spin excitation in even chains implies a ground state with S = 0 and
their presence in odd chains an S – 0 groundstate. Therefore the
chains were anti-ferromagnetic (AF) and hence a realization of Heisenberg chains with finite length [145]. In contrast to Mn on alumina, the zero-energy step of Mn atoms and odd chains was
observed in the absence of an external magnetic field, which was
interpreted as a signature of magneto-crystalline anisotropy. The
dimer conductance steps split up into three in an external magnetic field. Accordingly, they were attributed to transitions from
the Stot = 0 singlet to the Stot = 1 triplet state with quantum numbers m = 0, ± 1. The step positions were used to derive the exchange energy J = 6.2 meV from a Heisenberg Hamiltonian. As
discussed above for the Landé values, also the coupling strength
varied for different locations on the Cu2N-island (by ±5%); placing
the whole chain on N instead of Cu adsorption sites led to
J = 3.0 meV. The spin per Mn atom could be inferred from the position of the IETS step of Mn3 to S = 5/2 which is also the spin of a free
Mn atom. From the known J and S values the spin transitions for all
chain lengths can be derived from a Heisenberg open-chain model
and the values were in excellent agreement with experiment for
chain length up to 6 atoms. From the fact that the trimer steps
did not split up in a magnetic field, the following empiric IETSselection rules were established. Conductance steps appear for
DS = 0, ± 1 and Dm = 0, ± 1, but not for Dm = ±2. These experiments
illustrate how textbook examples of low-dimensional magnetism,
such as finite Heisenberg chains, can be assembled and studied
by means of STM.
The adsorbates visible in Fig. 8a are Fe, Co, and Mn atoms. Spectra taken on an Fe atom adsorbed onto a Cu site on Cu2N are shown
in Fig. 8b at zero magnetic field and in Fig. 8c and d at finite fields
along the two non-equivalent in-plane directions. In Fig. 8b there
are three with respect to EF symmetric pairs of inelastic excitation
steps located at 0.2, 3.8, and 5.7 meV. The finding of multiple steps
for a single atom can only be rationalized by a high spin (S > 1/2)
subject to magneto-crystalline anisotropy. The spin-Hamiltonian
reads with the nomenclature of molecular magnets
b ¼ gl B b
S þ D Sbz 2 þ Eð Sbx 2 Sby 2 Þ:
H
B
ð3Þ
After the Zeeman energy, the second and third terms represent
the axial and transverse anisotropies D and E, respectively. The
assignment of the axes is by convention such as to maximize jDj
and to yield E > 0. By diagonalization of Eq. (3) one finds the eigenvectors and the spin excitation spectrum. Under the assumption of
a spin S = 2 all step positions for different field values and direc-
1824
H. Brune, P. Gambardella / Surface Science 603 (2009) 1812–1830
a
b0.15
0.10
0.05
0.00
-10
0
Voltage(mV)
5
10
d
c
0T
5T
0T
5T
0.10
hollow-direction
Magnetic field
Differential conductance (nA/mV)
-5
N
0.05
N-direction
Cu
Magnetic field
0.00
0
2
4
Voltage (mV)
6
8
0
2
4
Voltage(mV)
6
8
Fig. 8. (a) Constant current STM image showing square Cu2N-patches with a c(2 2) structure on Cu(1 0 0) appearing lower than the coexisting bare Cu ridges. The adatoms
are Fe, Co, and Mn and can be discerned by their characteristic spectroscopic features and apparent heights (500 Å 500 Å, Vt = 10 mV, It = 0.5 nA, T = 5 K). (b) Spectrum over
Fe atom adsorbed on a Cu site of Cu2N. Each time the electron energy reaches the threshold needed for an allowed transition of magnetic eigenstates, the differential
conductance abruptly increases (tip stabilization at Vt = 10 mV, It = 1.0 nA, Vmod,rms = 20 lV, fmod = 800 Hz, T = 0.5 K). Magnetic fields applied along the N-direction (c) shift the
magnetic excitation energies in a different way than fields along the hollow direction (d), from [21,168].
tions
could
perfectly
be
fitted
by
g = 2.11 ± 0.05,
D = 1.55 ± 0.01 meV, E = 0.32 ± 0.01 meV and with z along the
N-direction. The negative value of the axial anisotropy D signifies
that a large projection of the spin onto the z-axis is favored, i.e.,
Fe atoms have easy axis anisotropy on this surface. In order to
compare D with the uniaxial anisotropy K, used in bulk, thin films
and nanostructures and referred to in Section 2, one has to multiply D by S2 and thus obtains anisotropies almost as large as the
ones of Co/Pt(1 1 1) [11]. Easy axis anisotropy implies that the
zero-field ground state has large and identical weights in the
m = ±2 eigenstates. However, it is not entirely m = ±2, since the finite transverse E-term mixes states of different m.
In fact, each of the steps marked by the differently colored arrows in Fig. 8b implies more than a single change of m. Let us consider the third transition marked by a blue arrow in order to see
how the wave function changes for this excitation. The step shifts
up in energy when a field of 5 T is applied along the easy axis, as
becomes evident from Fig. 8c. In the absence of the field, the
ground state is a symmetric mixture of m = ±2, with very little
weight also in m = 0. The electron with an energy around 6 meV
can induce a transition to a state with equal weights in m = ±1
and no more weight in m = 0, ± 2. Therefore S2z gets reduced to zero,
i.e., in a classical image the moment gets fully turned away from
the easy axis. The energy required for this is K = D S2 = 6.2 meV,
as observed. The field breaks the symmetry along z and favors
m = 2, and an electron can make a transition to m = 1, but also
from the non-zero m = 0 and m = 2 components of the wave function to m = 1 and from m = 0 to m = 1. This time, the excited state
is not symmetric and has more weight in m = 1. Classically, this
corresponds again to tilting the moment away from the easy axis,
but this time it is even slightly reversed, shifting up the step by
more than 1 meV. Applying the field along the transverse direction
favors a reduction of Sz and therefore the very same step gets
shifted to lower energy in Fig. 8d. Knowing the eigenvalues in
ground and excited states also gives a clear picture of the selection
rules. Only transitions with Dm = 0, ±1 are allowed, consistent with
the electron being able to transfer a spin of one when inverting its
own spin. Also the step heights can be rationalized. For example,
the first excitation step disappears in Fig. 8c as the field is applied.
For this step the wave function changes from W0 with most weight
m = 2 to W1 with most weight in m = 2. Therefore it essentially
corresponds to spin reversal being only linked by the weak weight
in m = 2 before and in m = 2 after the excitation which makes the
peak disappear. DFT-calculations confirm the choice of S = 2, but
also show that Fe pushes the underlying Cu atom deep below the
first atomic plane and therefore Fe forms an adsorption complex
with the neighboring N atoms and the underlying Cu, having similarities with the configuration in molecular magnets [21]. As opposed to molecular magnets, in Fe/Cu2N quantum tunneling of
the magnetization is not allowed since in-plane anisotropy has or-
1825
H. Brune, P. Gambardella / Surface Science 603 (2009) 1812–1830
Spin-polarized (SP) STM has been pioneered by R. Wiesendanger [146] and is now a well established technique [147,148]. Its
magnetic contrast relies on the spin-valve effect. To name only a
few examples, SP–STM has revealed images of spin ground states
in thin films which would have been difficult to guess without spatial magnetic resolution [149], the role of adsorbates in the magneto-resistance of tunnel junctions has been addressed [150,151],
and our understanding of current-induced magnetization reversal
has been improved [152].
We discuss here magnetization curves recorded on single Co
atoms on Pt(1 1 1) which constitutes a hallmark in SP–STM [23].
The measurements have been performed in the so-called SP-STS
mode, where the differential conductance dI/dV is recorded at a given tunnel voltage as a function of the magnetic field with the tip
kept at constant height and centered above the magnetic impurity.
dI/dV is composed of a non-polarized (np) and a polarized (pol)
part, the latter being maximized for parallel and minimized for
anti-parallel alignment of tip and sample magnetization, thus
one can write dI/dV = (dI/dV)np + Mtip Msample(dI/dV)pol. In analogy
with the polarization of the current itself, P = (Ip–Iap)/(Ip + Iap),
where p denotes parallel and ap anti-parallel tip and sample magnetization, one defines a differential polarization p = ((dI/dV)p–(dI/
dV)ap)/((dI/dV)p + (dI/dV)ap). Co atoms adsorbed on the two nonequivalent threefold Pt(1 1 1) hollow sites have different electronic
structure close to EF [153]. Co has larger LDOS at 0.1 eV when on
an hcp compared with an fcc site [23]. In order to obtain comparable magnetic contrast for the two species, the M(H)-curves have
been recorded at a tunnel voltage minimizing the adsorption site
dependence of p, namely at Vt = 0.3 V. Maximum spin contrast
could have been achieved at Vt = 0.05 V, but with a large adsorption site difference caused by the variation of the non-polarized
part of the electronic structure, (dI/dV)np.
Fig. 9a and b shows a 3D representation of constant-current
STM images of individual Co atoms on Pt(1 1 1) color coded by
the dI/dV-signal at 0.3 V. Indeed, all the atoms switch their magnetization upon field reversal from (a) to (b) and the differences between the atoms are small compared to this change confirming
that the dI/dV-signal is dominated by magnetic and not by adsorption site contrast. As expected for magnetic tunnel junctions with
soft magnetic tips, the upper M(H)-curve in Fig. 9c has the shape
of a butterfly, resulting from magnetization reversal of both electrodes at different fields [23]. The tips were Cr-coated W-tips
which were dipped into a Co ML-film on Pt(1 1 1) in order to retain
strong out-of-plane spin polarization. The schematic drawings
indicate that a positive field sweep (red) starts at 2 T with the
magnetization of both electrodes pointing down, at 0.1 T one turns
up reducing dI/dV, until the second electrode turns up, too between
0.7 and 1.0 T recovering the initial dI/dV value which then stays
c
dI/dV (a.u.)
3.4. Magnetization curves taken by means of spin-polarized STM
b
a
d
dI/dV (a.u.)
der 4 and there are by symmetry no transverse terms. The same
analysis has been performed for Mn which again has easy axis
anisotropy, however, this time out-of-plane and with
D = 0.039 ± 0.001 meV a much smaller value (S = 5/2,
g = 1.90 ± 0.01, and E = 0.007 ± 0.001 meV).
The examples illustrate how quantitative information on the
magnetic quantum states of single atoms adsorbed onto surfaces
can be gained with spin excitation spectroscopy. The insulating
layers have been used to enhance the cross section but are not necessary by any physical principle for the spin excitations to occur.
Therefore spin excitation ISTS might in the future also address
magnetic atoms adsorbed directly onto metal surfaces and therefore establish the link with XMCD results. On the other hand,
XMCD measurements addressing Fe/Cu2N/Cu(1 0 0) have been performed and are currently analyzed.
-2.0
-1.0
0.0
B (T)
1.0
2.0
Fig. 9. (a) and (b) 3D view of constant current STM images of Co atoms on Pt(1 1 1).
Color code shows magnetic contrast from dI/dV for parallel (a) and antiparallel (b)
field direction and tip-magnetization (Vt = 0.3 V, Bz = ±0.5 T, T = 0.3 K). Magnetic
field-dependent differential conductance of (c) soft and (d) hard magnetic tip over a
Co atom on Pt(1 1 1). Red curves show up and blue ones down sweep of magnetic
field (It = 0.8 nA, Vt = 0.3 V, Vmod = 20 mV, T = 0.3 K). The insets indicate the relative
orientation of adatom and tip M. The soft tip leads to butterfly shaped curves since
it reverses its magnetization at around 0.8 T. The tip with high coercitivity shows
paramagnetic M(H)-curves reflecting the magnetization reversal of the atoms only.
The curves are shifted horizontally due to the stray field of the tip. For the soft tip
the shift depends on direction of field sweep and for the hard tip there is a right
shift for both sweep directions, from [23].
constant up to 2 T. The down sweep curve (blue) is symmetric with
respect to the zero-field line. From reference measurements on a
Co monolayer stripe on the same surface with the same tip, the
electrode switching at around 0.8 T is identified as being the tip.
The electrode switching at much lower fields is the Co adatom.
For symmetry reasons, switching takes place at exactly half way
between dI/dVp and dI/dVap, see the horizontal lines in Fig. 9c.
The atom investigated switches at ±0.1 T. Fig. 9d shows a curve recorded with a hard tip having stable magnetization throughout the
applied field sweep. The resulting paramagnetic M(H)-curve is
shifted slightly to the right for both sweep directions. The horizontal shifts are caused by the stray field of the tip, changing sign with
field sweep direction for magnetically soft tips, while remaining
H. Brune, P. Gambardella / Surface Science 603 (2009) 1812–1830
a
T = 4.2 K
fit
T = 0.3 K
fit
dI/dV (a.u.)
constant for the tip with high coercitivity. Stray field and tip reversal can be corrected for revealing that the atoms switch reversibly
at 0 T, i.e., they are paramagnetic at 0.6 K.
Quantitative information on magnetic moments has been obtained from M(H)-curves recorded at different temperatures and
over many different Co atoms. The curves at 4.2 and 0.3 K shown
in Fig. 10a are both reminiscent of paramagnetic atoms. They have
been obtained by recording dI/dV-images such as Fig. 9a and b for
many fields between 7.5 and 7.5 T and laterally averaging the signal over 5 Å 5 Å squares centered at the Co atoms. As expected,
the saturation field increases proportional with increasing temperature. The absence of hysteresis down to 0.3 K is not expected from
K = 9.3 ± 1.6 meV [11] and has been interpreted as due to quantum
tunneling of the magnetization. The full lines show that the curves
can perfectly be fitted with an energy given as function of field B
and its angle with respect to the atom moment m as
E(B,H) = m(B–Btip)cos(H)Kcos2(H). With K kept at the XMCD
value of 9.3 meV the essential fit parameter is m. The m-distributions recorded for about 80 Co atoms are narrow at 4.2 K and
rather broad at 0.3 K (2lB 6 m 6 6lB). Fig. 10b shows that also
the saturation field strongly varies from atom to atom (0.2 T
6 Bsat 6 0.7 T). In contrast, there is almost no difference in the
average m-values and their variance between Co atoms on fcc
hcp ¼ 3:9 0:2lB vs.
and hcp adsorption sites (mean values m
fcc ¼ 3:5 0:2lB at 0.3 K).
m
The wide Bsat and m-distributions have been attributed to magnetic interactions between the atoms and adsorbed ferromagnetic
Co stripes. Exchange energies in the order of J = m(0.7 T–0.2 T)/
2 = 50 leV (with m = 3.7lB) are needed to produce the observed
variance in Bsat. M(H)-curves of single adatoms taken as function
of their distance from a Co monolayer stripe showed oscillating
interactions changing from AF to FM and back to AF with increasing distance. Dipolar interactions would always be AF, and direct
exchange interactions can be excluded from the large distance between the atoms. The observed oscillatory behavior with decaying
strength is reminiscent of substrate mediated electronic Ruderman–Kittel–Kasuya–Yosida (RKKY) interactions [154–156]. The
interaction energy showed the expected distance dependence,
J(d) = J0cos(2kFd)/(2kFd)D, with the first data points located around
(14 Å, 180 leV) and the last one at (45 Å, 10 leV). Best agreement between experiment and this expression was obtained for
a dimension of D = 1. This can be rationalized by the fact that the
atoms are separated from a straight 1D interface, and integration
over 2D interactions between a fixed point and points located
along a straight line yield a decay close to D = 1. However, the
wave-length was with kF = 30 Å 2–6 times larger than typical values for Pt(1 1 1) [157].
These results show that single Co atoms on Pt(1 1 1) behave as
paramagnetic impurities when placed in an STM junction biased
at 0.3 V. They are subject to substrate mediated RKKY-interactions
which can be detected down to 10 leV resolution by recording the
exchange field stemming from a ferromagnetic monolayer high
stripe attached to a substrate step.
-7.5
- 5.0
- 2.5
0.0
2.5
5.0
7.5
b
hcp
fcc
dI/dV (a.u.)
1826
Bsat (T)
0.0
-1.0
0.5
-0.5
1.0
0.0
B (T)
0.5
1.0
Fig. 10. (a) M(H)-curves on the same atom at T = 4.2 and 0.3 K. Points represent
experimental data, solid lines are fits according to the function described in the text.
(b) M(H)-curves recorded at 0.3 K on four Co atoms, two on hcp (yellow) and two on
fcc (blue) sites, showing strongly differing saturation fields independent of
adsorption site. Inset: histogram of 0.3 K saturation fields for the two adsorption
sites. Parameters for all M(H)-curves It = 0.8 nA, Vt = 0.3 V, and Vmod = 20 mV, from
[23].
3.5. Simultaneous measurement of anisotropy energy and Kondo
properties
It is very difficult to predict which magnetic species will display
the Kondo effect in which host. A step forward was made for high
spin impurities by showing magneto-crystalline anisotropy energy
to play a decisive role. By analyzing spin excitations of single adatoms with ISTS, and simultaneously looking for a Kondo resonance
in their LDOS, easy plane anisotropy has been found to be a necessary condition for Kondo screening of an impurity with S > 1/2
[158]. In addition, it was confirmed that S = 1/2 impurities are
not at all subject to anisotropy.
Fig. 11a shows dI/dV-spectra over a Co atom adsorbed onto a Cu
site on Cu2N/Cu(1 0 0)–c(2 2). There are clear conductance steps
at around ±6 meV, moving inwards as a magnetic field is applied
into the direction where the Co atom has two hollow sites as
neighbors. Applying the field along the N-direction as well as perpendicular to the surface led to an outward shift of the steps, and
this shift was comparable for both directions. From this qualitative
behavior, one can conclude that Co has a high magneto-crystalline
anisotropy with hard axis along the hollow direction and easy
plane perpendicular to it. From a similar analysis as in Section
1827
H. Brune, P. Gambardella / Surface Science 603 (2009) 1812–1830
a
b
0.8
m = –3/2
7T
dI/dV (nA/mV)
0.6
2 meV
3T
m = +3/2
0.4
m = –1/2
0.2
0T
m = +1/2
0.0
-10
-5
0
5
10
0
2
Vt (mV)
4
6
B (T)
c
0.5
dI/dV (nA/mV)
7T
0.4
0.3
0.2
0T
0.1
0.0
-10
-5
0
5
10
Vt (mV)
Fig. 11. (a) Differential conductance measured with STM tip centered above a Co atom adsorbed on a Cu site of Cu2N/Cu(1 0 0)–c(2 2). The central Kondo resonance splits
for increasing magnetic field directed along the hollow-direction and the spin excitation conductance steps shift slightly inwards due to magneto-crystalline anisotropy
(T = 0.5 K, tip stabilized at Vt = 10 mV and It = 1.0 nA). Yellow curves represent calculated spin excitation spectrum. (b) Field dependence of spin excitation energies for
transitions from m = 1/2 to m = 1/2 and to m = +3/2, reminiscent of easy plane anisotropy (field along hollow-direction). (c) dI/dV for a Ti atom on Cu2N/Cu(1 0 0) showing the
central Kondo resonance, but no conductance steps since Ti is a spin 1/2 system and has no magnetic anisotropy. This is confirmed by the isotropic shifts of the Kondo
resonance for the field applied along three orthogonal directions (red and yellow in-plane, blue out-of-plane). All spectra recorded with Vmod = 50 lV rms-modulation at
745 Hz and at T = 0.5 K, from [158].
3.3, the total spin (S = 3/2) and the anisotropy energy
(D = 2.75 ± 0.05 meV) have been derived. The latter corresponds
to K = S2D = 6.2 ± 0.1 meV (g = 2.19 ± 0.09). Fig. 11b shows the
ground state to be m = ±1/2 since the easy plane anisotropy (equivalent to hard axis) wants to minimize the projection of S onto the
designated axis. The field splitting is larger for m = ±3/2 than for
m = ±1/2 and therefore the m = 1/2 ? 3/2 spin excitation shifts
down in energy.
In addition to the two conductance steps, the zero-field spectrum shows a prominent resonance at EF. This resonance has a
Fano lineshape with a very small interference term, making it appear almost Lorentzian. Its temperature dependence is the expected one for a Kondo resonance, and the asymptotic zero
Kelvin
width
determines
the
Kondo
temperature,
TK = FWHM(0 K)/2 kB = 2.6 ± 0.2 K [158]. Such Kondo resonances
have been observed with STM for surface adsorbed atoms [17,18]
and molecules [159,160].
Co on Cu2N/Cu(1 0 0)–c(2 2) displays the Kondo effect, while
Fe and Mn on the same substrate do not (see Fe spectra in Section
3.3 and Mn spectra in Ref. [135]). All three adatoms are high-spin
impurities as they have S > 1/2. They distinguish themselves by the
magneto-crystalline anisotropy. Co has a hard axis anisotropy
(D > 0) while Fe and Mn both have easy axis anisotropy (D < 0).
Both types of anisotropy create a twofold degenerate zero field
ground state. However, for easy axis this state is a doublet with
jmj > 1/2 which is linked by Dm > 1 excluding magnetic interactions with single host electrons and thus disabling first order Kondo scattering. Only for high-spin impurities with hard axis is there
an jmj = 1/2 doublet ground state enabling Kondo screening via
Dm = 1 single electron spin flips.
From the level scheme in Fig. 11b it is clear that low-energy
m = 1/2 ? 1/2 spin excitations are expected as the magnetic field
splits the two states in energy. These transitions are indeed found
in the spectra in Fig. 11a. The conductance steps are superimposed
onto the Kondo resonance, which splits in the magnetic field in the
very same way as the energy of the lowest lying spin excitation.
The pure Kondo features of the LDOS can be retrieved by subtracting the calculated conductance resulting from inelastic spin excita-
1828
H. Brune, P. Gambardella / Surface Science 603 (2009) 1812–1830
tions (yellow curves) from the spectra, leading to Zeemann split
Kondo resonances on an almost flat background [158]. Similar
field-induced splitting of the Kondo resonance has been observed
in electron droplets created by gate electrodes in 2DEGs [161], in
lithographically defined Coulomb blockaded quantum dots (QDs)
with odd number of electrons on them [162], and for surface impurities [20].
Crystal field effects are entirely absent for Ti on the same substrate, as shown in Fig. 11c. There are no conductance steps due
to spin excitations but a clear Kondo peak. Its splitting is identical
for all field directions. This is in agreement with Ti having S = 1/2.
According to Eq. (3) such an impurity can have no anisotropy since
the magnitude of m cannot change.
The results discussed in this section show that high-spin impurities exposed to crystal fields giving rise to D > 0 display the Kondo
effect, while those with D < 0 do not. For molecular magnets it has
been suggested that mixing of states by large E-values can lead to
ground state doublets linked by Dm = 1 even in the case of D < 0
[163]. One could therefore define a more general necessary condition for the anisotropy giving rise to the Kondo effect of high-spin
impurities, i.e., the magnetic anisotropy has to create a twofold
degenerate ground state linked by Dm = 1. Whether this is also a
sufficient condition has yet to be explored. Similar action of the
magnetic anisotropy as the one described above has been proposed
for high-spin impurities in bulk [164,165] showing the relevance of
the present results derived from surface science for bulk impurities, but also for molecular magnets.
E-terms in the anisotropy landscape seen by the moment, is this
relaxation slow or even absent if there is only a large D-term,
and if there is remanence, where is the magnetic energy dissipated? We note that the paramagnetic M(H)-curves for Co/
Pt(1 1 1) have been measured with SP-STS at electron energies far
beyond the threshold for spin excitations of that system opening
up the question whether such curves recorded at Vt < 9 meV would
display hysteresis. Very interesting future research directions are
opening up when the techniques described above begin to be applied to molecular magnets, to metal–organic networks containing
magnetic metal centers, or to magnetic impurities on graphene and
other thin films with interesting electronic properties.
Acknowledgements
We acknowledge the ESRF for provision of beamtime and financial support by the EUROCORES 05-SONS-FP-009 SANMAG project
of the European Science Foundation. PG acknowledges financial
support through the SYNSPIN MAT2007-62341 project of the Spanish Ministerio de Educación y Ciencia. We thank H.C. Siegmann and
W. Wulfhekel for fruitful discussions, R. Gusmeroli and C. Dallera
for providing open access to the Multiplet Inner-Shell Spectroscopy
INterective GUI of Cowan, Butler, and Thole’s multiplet calculation
code, L. Bürgi, D.M. Eigler, C.P. Lutz, A. Otte, A. Heinrich, and R.
Wiesendanger for allowing us to reproduce figures from their
work, and finally C.-L. Bandelier for preparation of the figures.
References
4. Conclusions and future directions
It is now possible with XMCD to determine K, mS, mL, and DmL
of isolated adatoms down to coverages of 0.002 ML. This has been
done for magnetic atoms on alkali and transition-metal, as well as
semiconductor surfaces. Experiments with magnetic atoms bound
to organic molecules [166] or on monolayer thick insulators are on
their way. With STM, a smooth and fully reversible transition from
tunneling to contact on single adatoms has become possible, enabling controlled quantized conductance measurements, in particular investigation of the possible blocking of one spin conduction
channel. Entire magnetization curves for single atoms have been
reported with SP–STM. They have to be corrected for the stray field
and magnetization reversal of the foremost tip atoms, and could already be used to map RKKY interaction energies through switching
field variations as function of distance from a monolayer high ferromagnetic stripe. Effective spin moments and the anisotropy values D and E could be inferred from spin excitation spectra. The
intensities of these inelastic transitions are high for adatoms on
thin insulating layers, however, detection of such transitions in
metal/metal systems may as well become feasible [167]. This
would establish direct comparison with the XMCD measurements.
The improved experimental access to the magnetism of adatoms
on single crystal surfaces described in this paper not only increases
our fundamental understanding of low-dimensional magnetism,
but has impact on the Physics of magnetic impurities in solids.
For instance, the necessary conditions for the Kondo effect of high
spin impurities have been identified, and solutions to open issues
in dilute magnetic semiconductors could be provided.
Future research will address the necessary conditions for remanence in small magnetic structures, such as single atoms or islands
composed of a few atoms only. The studies described above have
revealed the magnetic ground state of single atoms to be a superposition of several quantum numbers m. The atom can be prepared
by high fields in a state maximizing the amplitude for a single m
value. However, what happens when the field is turned off? How
fast does it relax, does this depend on the existence of tranverse
[1] G. Grosso, G.P. Parravicini, Solid State Physics, Academic Press, London, 2000.
[2] J.S. Griffith, The Theory of Transition-Metal Ions, Cambridge University Press,
Cambridge, 1961.
[3] H. Brune, Surf. Sci. Rep. 31 (1998) 121.
[4] D. Gatteschi, R. Sessoli, J. Villain, Molecular Nanomagnets, Oxford University
Press, Oxford, 2006.
[5] M.N. Leuenberger, D. Loss, Nature 410 (2001) 789.
[6] F. Meier, J. Levy, D. Loss, Phys. Rev. Lett. 90 (2003) 047901.
[7] G. Bergmann, Phys. Today 32 (1979) 25.
[8] G. Bergmann, J. Magn. Magn. Mater. 35 (1983) 68.
[9] J.S. Moodera, R. Meservey, Phys. Rev. B 34 (1986) 379.
[10] P. Gambardella, S.S. Dhesi, S. Gardonio, C. Grazioli, P. Ohresser, C. Carbone,
Phys. Rev. Lett. 88 (2002) 047202.
[11] P. Gambardella, S. Rusponi, M. Veronese, S.S. Dhesi, C. Grazioli, A. Dallmeyer,
I. Cabria, R. Zeller, P.H. Dederichs, K. Kern, C. Carbone, H. Brune, Science 300
(2003) 1130.
[12] P. Gambardella, A. Dallmeyer, K. Maiti, M.C. Malagoli, S. Rusponi, P. Ohresser,
W. Eberhardt, C. Carbone, K. Kern, Phys. Rev. Lett. 93 (2004) 077203.
[13] P. Gambardella, H. Brune, S.S. Dhesi, P. Bencok, S.R. Krishnakumar, S.
Gardonio, M. Veronese, C. Grazioli, C. Carbone, Phys. Rev. B 72 (2005)
045337.
[14] P. Ohresser, H. Bulou, S.S. Dhesi, C. Boeglin, B. Lazarovits, E. Gaudry, I. Chado, J.
Faerber, F. Scheurer, Phys. Rev. Lett. 95 (2005) 195901.
[15] J. Honolka, K. Kuhnke, L. Vitali, A. Enders, S. Gardonio, C. Carbone, K. Kern, P.
Bencok, S. Stepanow, P. Gambardella, Phys. Rev. B 76 (2007) 144412.
[16] A. Yazdani, B.A. Jones, C.P. Lutz, M.F. Crommie, D.M. Eigler, Science 275 (1997)
1767.
[17] J. Li, W.D. Schneider, R. Berndt, B. Delley, Phys. Rev. Lett. 80 (1998) 2893.
[18] V. Madhavan, W. Chen, T. Jamneala, M.F. Crommie, N.S. Wingreen, Science
280 (1998) 567.
[19] P. Wahl, L. Diekhöner, M.A. Schneider, L. Vitali, G. Wittich, K. Kern, Phys. Rev.
Lett. 93 (2004) 176603.
[20] A.J. Heinrich, J.A. Gupta, C.P. Lutz, D.M. Eigler, Science 306 (2004) 466.
[21] C.F. Hirjibehedin, C.Y. Lin, A.F. Otte, M. Ternes, C.P. Lutz, B.A. Jones, A.J.
Heinrich, Science 317 (2007) 1199.
[22] Y. Yayon, V.W. Brar, L. Senapati, S.C. Erwin, M.F. Crommie, Phys. Rev. Lett. 99
(2007) 067202.
[23] F. Meier, L. Zhou, J. Wiebe, R. Wiesendanger, Science 320 (2008) 82.
[24] J. Stöhr, H.C. Siegmann, Magnetism – from Fundamentals to Nanoscale
Dynamics, vol. 152, Springer, Berlin, 2006.
[25] B.T. Thole, P. Carra, F. Sette, G.v.d. Laan, Phys. Rev. Lett. 68 (1992) 1943.
[26] P. Carra, B.T. Thole, M. Altarelli, X. Wang, Phys. Rev. Lett. 70 (1993) 694.
[27] C.T. Chen, Y.U. Idzerda, H.J. Lin, N.V. Smith, G. Meigs, E. Chaban, G.H. Ho, E.
Pellegrin, F. Sette, Phys. Rev. Lett. 75 (1995) 152.
[28] J.P. Franck, F.D. Manchester, D.L. Martin, Proc. Roy. Soc. (London) A 263 (1961)
494.
[29] J. Friedel, Nuovo Cimento Suppl. 7 (1958) 287.
[30] P.W. Anderson, Phys. Rev. 124 (1961) 41.
H. Brune, P. Gambardella / Surface Science 603 (2009) 1812–1830
[31] D. Riegel, H.J. Barth, L. Büermann, H. Haas, C. Stenzel, Phys. Rev. Lett. 57
(1986) 388.
[32] R. Kowallik, H.H. Bertschat, K. Biedermann, H. Haas, W. Müller, B. Spellmeyer,
W.D. Zeitz, Phys. Rev. Lett. 63 (1989) 434.
[33] H. Beckmann, G. Bergmann, Phys. Rev. Lett. 83 (1999) 2417.
[34] M. Gruyters, D. Riegel, Phys. Rev. Lett. 85 (2000) 1582.
[35] P. Mohn, P. Weinberger, B. Ujfalussy, O. Eriksson, G. Gutierrez, R. Ahuja, B.
Johansson, Phys. Rev. Lett. 85 (2000) 1583.
[36] H. Beckmann, G. Bergmann, Phys. Rev. Lett. 85 (2000) 1584.
[37] G. Bergmann, M. Hossain, Phys. Rev. Lett. 86 (2001) 2138.
[38] F. Song, G. Bergmann, Phys. Rev. Lett. 88 (2002) 167202.
[39] S.K. Kwon, B.I. Min, Phys. Rev. Lett. 84 (2000) 3970.
[40] G.Y. Guo, Phys. Rev. B 62 (2000) 14609.
[41] G.v.d. Laan, B.T. Thole, Phys. Rev. B 43 (1991) 13401.
[42] P. Gambardella, A. Dallmeyer, K. Maiti, M.C. Malagoli, W. Eberhardt, K. Kern,
C. Carbone, Nature 416 (2002) 301.
[43] L.L. Hirst, Phys. Kondens. Materie 11 (1970) 255.
[44] M. Tischer, O. Hjortstam, D. Arvanitis, J.H. Dunn, F. May, K. Baberschke, J.
Trygg, J.M. Wills, B. Johansson, O. Eriksson, Phys. Rev. Lett. 75 (1995) 1602.
[45] D. Weller, J. Stöhr, R. Nakajima, A. Carl, M.G. Samant, C. Chappert, R. Mégy, P.
Beauvillain, P. Veillet, G.A. Held, Phys. Rev. Lett. 75 (1995) 3752.
[46] H.A. Dürr, S.S. Dhesi, E. Dudzik, D. Knabben, G.v.d. Laan, J.B. Goedkoop, F.U.
Hillebrecht, Phys. Rev. B 59 (1999) R701.
[47] T. Koide, H. Miyauchi, J. Okamoto, T. Shidara, A. Fujimori, H. Fukutani, K.
Amemiya, H. Takeshita, S. Yuasa, T. Katayama, Y. Suzuki, Phys. Rev. Lett. 87
(2001) 257201.
[48] V.S. Stepanyuk, W. Hergert, K. Wildberger, R. Zeller, P.H. Dederichs, Phys. Rev.
B 53 (1996) 2121.
[49] B. Lazarovits, L. Szunyogh, P. Weinberger, Phys. Rev. B 67 (2003) 024415.
[50] O. Sipr, S. Bornemann, J. Minár, S. Polesya, V. Popescu, A. Simunek, H. Ebert, J.
Phys. Condens. Matter 19 (2007) 096203.
[51] G.J. Nieuwenhuys, Adv. Phys. 24 (1975) 515.
[52] D. Weller, A. Moser, IEEE Trans. Magn. 35 (1999) 4423.
[53] N. Nakajima, T. Koide, T. Shidara, H. Miyauchi, H. Fukutani, A. Fujimori, K. Iio,
T. Katayama, M. Nyvlt, Y. Suzuki, Phys. Rev. Lett. 81 (1998) 5229.
[54] P. Bruno, Phys. Rev. B 39 (1989) 865.
[55] G.v.d. Laan, J. Phys.-Condens. Matter 10 (1998) 3239.
[56] I.V. Solovyev, P.H. Dederichs, I. Mertig, Phys. Rev. B 52 (1995) 13419.
[57] S. Chikazumi, Physics of Ferromagnetism, Clarendon Press, Oxford, 1997.
[58] I.M.L. Billas, A. Châtelain, W.A. d. Heer, Science 265 (1994) 1682.
[59] K.W. Edmonds, C. Binns, S.H. Baker, S.C. Thornton, C. Norris, J.B. Goedkoop, M.
Finazzi, N.B. Brookes, Phys. Rev. B 60 (1999) 472.
[60] J.T. Lau, A. Föhlisch, R. Nietubyc, M. Reif, W. Wurth, Phys. Rev. Lett. 89 (2002)
057201.
[61] J. Bansmann, S.H. Baker, C. Binns, J.A. Blackman, J.P. Bucher, J. DorantesDávila, V. Dupuis, L. Favre, D. Kechrakos, A. Kleibert, K.H. Meiwes-Broer, G.M.
Pastor, A. Perez, O. Toulemonde, K.N. Trohidou, J. Tuaillon, Y. Xie, Surf. Sci.
Rep. 56 (2005) 189.
[62] R. Wu, C. Li, A.J. Freeman, J. Magn. Magn. Mater. 99 (1991) 71.
[63] S. Rusponi, T. Cren, N. Weiss, M. Epple, P. Buluschek, L. Claude, H. Brune, Nat.
Mater. 2 (2003) 546.
[64] P. Gambardella, J. Phys.: Condens. Matter 15 (2003) S2533.
[65] A. Dallmeyer, C. Carbone, W. Eberhardt, C. Pampuch, O. Rader, W. Gudat, P.
Gambardella, K. Kern, Phy. Rev. B 61 (2000) R5133.
[66] H. Ohno, A. Shen, F. Matsukura, A. Oiwa, A. Endo, S. Katsumoto, Y. Iye, Appl.
Phys. Lett. 69 (1996) 363.
[67] Y.D. Park, A.T. Hanbicki, S.C. Erwin, C.S. Hellberg, J.M. Sullivan, J.E. Mattson,
T.F. Ambrose, A. Wilson, G. Spanos, B.T. Jonker, Science 295 (2002) 651.
[68] H. Shimizu, T. Hayashi, T. Nishinaga, M. Tanaka, Appl. Phys. Lett. 74 (1999)
398.
[69] T. Hayashi, Y. Hashimoto, S. Katsumoto, Y. Iye, Appl. Phys. Lett. 78 (2001)
1691.
[70] K.W. Edmonds, P. Boguslawski, K.Y. Wang, R.P. Campion, S.N. Novikov, N.R.S.
Farley, B.L. Gallagher, C.T. Foxon, M. Sawicki, T. Dietl, M.B. Nardelli, J.
Bernholc, Phys. Rev. Lett. 92 (2004) 037201.
[71] P. Gambardella, L. Claude, S. Rusponi, K.J. Franke, H. Brune, J. Raabe, F. Nolting,
P. Bencok, A.T. Hanbicki, B.T. Jonker, C. Grazioli, M. Veronese, C. Carbone,
Phys. Rev. B 75 (2007) 125211.
[72] S.J. Potashnik, K.C. Ku, R. Mahendiran, S.H. Chun, R.F. Wang, N. Samarth, P.
Schiffer, Phys. Rev. B 66 (2002) 012408.
[73] H. Ohldag, V. Solinus, F.U. Hillebrecht, J.B. Goedkoop, M. Finazzi, F. Matsukura,
H. Ohno, Appl. Phys. Lett. 76 (2000) 2928.
[74] S. Ueda, S. Imada, T. Muro, Y. Saitoh, S. Suga, F. Matsukura, H. Ohno, Physica E
10 (2001) 210.
[75] Y.L. Soo, G. Kioseoglou, S. Kim, X. Chen, H. Luo, Y.H. Kao, H.J. Lin, H.H. Hsieh,
T.Y. Hou, C.T. Chen, Y. Sasaki, X. Liu, J.K. Furdyna, Phys. Rev. B 67 (2003)
214401.
[76] K.W. Edmonds, N.R.S. Farley, R.P. Campion, C.T. Foxon, B.L. Gallagher, T.K.
Johal, G.v.d. Laan, M. MacKenzie, J.N. Chapman, E. Arenholz, Appl. Phys. Lett.
84 (2004) 4065.
[77] Y.J. Zhao, W.T. Geng, K.T. Park, A.J. Freeman, Phys. Rev. B 64 (2001) 035207.
[78] P. Mahadevan, A. Zunger, Phys. Rev. B 69 (2004) 115211.
[79] Y.J. Zhao, T. Shishidou, A.J. Freeman, Phys. Rev. Lett. 90 (2003) 047204.
[80] A. Stroppa, S. Picozzi, A. Continenza, A.J. Freeman, Phys. Rev. B 68 (2003)
155203.
1829
[81] H.A. Dürr, G.v.d. Laan, D. Spanke, F.U. Hillebrecht, N.B. Brookes, Phys. Rev. B
56 (1997) 8156.
[82] K.W. Edmonds, N.R.S. Farley, T.K. Johal, G.v.d. Laan, R.P. Campion, B.L.
Gallagher, C.T. Foxon, Phys. Rev. B 71 (2005) 064418.
[83] D.J. Keavney, D. Wu, J.W. Freeland, E. Johnston-Halperin, D.D. Awschalom, J.
Shi, Phys. Rev. Lett. 91 (2003) 187203.
[84] G. Profeta, S. Picozzi, A. Continenza, C. Franchini, Phys. Rev. B 70 (2004)
155307.
[85] W. Zhu, H.H. Weitering, E.G. Wang, E. Kaxiras, Z. Zhang, Phys. Rev. Lett. 93
(2004) 126102.
[86] A.M. Nazmul, S. Sugahara, M. Tanaka, Appl. Phys. Lett. 80 (2002) 3120.
[87] W.D. Schneider, R. Berndt, J. El. Spectr. Rel. Phen. 109 (2000) 19.
[88] M.F. Crommie, J. El. Spectr. Rel. Phen. 109 (2000) 1.
[89] M. Ternes, A.J. Heinrich, W.D. Schneider, J. Phys.: Condens. Matter 21 (2009)
053001.
[90] F. Patthey, J.M. Imer, W.D. Schneider, H. Beck, Y. Baer, B. Delley, Phys. Rev. B
42 (1990) 8864.
[91] D. Malterre, M. Grioni, Y. Baer, Adv. Phys. 45 (1996) 299.
[92] M. Garnier, K. Breuer, D. Purdie, M. Hengsberger, Y. Baer, B. Delley, Phys. Rev.
Lett. 78 (1997) 4127.
[93] L.E. Davis, M.P. Everson, R.C. Jaklevic, W. Shen, Phys. Rev. B 43 (1991) 3821.
[94] M.F. Crommie, C.P. Lutz, D.M. Eigler, Nature 363 (1993) 524.
[95] P. Avouris, I.W. Lyo, R.E. Walkup, Y. Hasegawa, J. Vac. Sci. Technol. B 12 (1994)
1447.
[96] S.K. Upadhyay, A. Palanisami, R.N. Louie, R.A. Buhrman, Phys. Rev. Lett. 81
(1998) 3247.
[97] R.J. Soulen, J.M. Byers, M.S. Osofsky, B. Nadgorny, T. Ambrose, C.F. Cheng, P.R.
Broussard, C.T. Tanaka, J. Nowak, J.S. Moodera, A. Barry, J.M.D. Coey, Science
282 (1998) 85.
[98] N. Agraı¨t, J.G. Rodrigo, S. Vieira, Phys. Rev. B 46 (1992) 5814.
[99] O. Naaman, R.C. Dynes, Sol. State Commun. 129 (2004) 299.
[100] M. Ternes, W.D. Schneider, J.C. Cuevas, C.P. Lutz, C.F. Hirjibehedin, A.J.
Heinrich, Phys. Rev. B 74 (2006) 132501.
[101] L. Bürgi, Ph.D. Thesis. Swiss Federal Institute of Technology, Lausanne, 1999.
[102] M.Y. Zhuravlev, E.Y. Tsymbal, S.S. Jaswal, A.V. Vedyayev, B. Dieny, Appl. Phys.
Lett. 83 (2003) 3534.
[103] R. Landauer, Z. Phys. B: Cond. Matter 68 (1987) 217.
[104] B.J.v. Wees, H.v. Houten, C.W.J. Beenakker, J.G. Williamson, L.P.
Kouwenhoven, D.v.d. Marel, C.T. Foxon, Phys. Rev. Lett. 60 (1988) 848.
[105] D.A. Wharam, T.J. Thornton, R. Newbury, M. Pepper, H. Ahmed, J.E.F. Frost,
D.G. Hasko, D.C. Peacock, D.A. Ritchie, G.A.C. Jones, J. Phys. C 21 (1988) L209.
[106] C.J. Muller, J.M.V. Ruitenbeek, L.J. d. Jong, Phys. Rev. Lett. 69 (1992) 140.
[107] J.M. Krans, J.M.V. Ruitenbeek, V.V. Fisun, I.K. Yanson, L.J. d. Jongh, Nature 375
(1995) 767.
[108] W.A.d. Heer, S. Frank, D. Ugarte, Z. Phys. B: Cond. Matter 104 (1997) 469.
[109] E. Scheer, N. Agraı¨t, J.C. Cuevas, A.L. Yeyati, B. Ludoph, A.M. Rodero, G.R.
Bollinger, J.M.V. Ruitenbeek, C. Urbina, Nature 394 (1998) 154.
[110] J.L. Costa-Krämer, N. Garcia, P. Garcia-Mochales, P.A. Serena, Surf. Sci. 342
(1995) L1144.
[111] N. Agraı¨t, G. Rubio, S. Vieira, Phys. Rev. Lett. 74 (1995) 3995.
[112] G. Rubio, N. Agraı¨t, S. Vieira, Phys. Rev. Lett. 76 (1996) 2302.
[113] L. Olesen, E. Lgsgaard, I. Stensgaard, F. Besenbacher, J. Schiøtz, P. Stoltze,
K.W. Jacobsen, J.K. Nørskov, Phys. Rev. Lett. 72 (1994) 2251.
[114] A. Yazdani, D.M. Eigler, N.D. Lang, Science 272 (1996) 1921.
[115] L. Limot, J. Kröger, R. Berndt, A. Garcia-Lekue, W.A. Hofer, Phys. Rev. Lett. 94
(2005) 126102.
[116] J. Kröger, H. Jensen, R. Berndt, N. J. Phys. 9 (2007) 153.
[117] J.K. Gimzewski, R. Möller, Phys. Rev. B 36 (1987) 1284.
[118] J.M. Krans, C.J. Muller, I.K. Yanson, T.C.M. Govaert, R. Hesper, J.M.V.
Ruitenbeek, Phys. Rev. B 48 (1993) 14721.
[119] J. Kröger, N. Néel, L. Limot, J. Phys. Cond. Mat. 20 (2008) 223001.
[120] L. Vitali, R. Ohmann, S. Stepanow, P. Gambardella, K. Tao, R. Huang, V.S.
Stepanyuk, P. Bruno, K. Kern, Phys. Rev. Lett. 101 (2008) 216802.
[121] A.A. Abrikosov, L.P. Gor’kov, Zh. Eksp. Teor. Fiz. 39 (1962) 1781.
[122] M.A. Woolf, F. Reif, Phys. Rev. 137 (1965) A557.
[123] W. Bauriedl, P. Ziemann, W. Buckel, Phys. Rev. Lett. 47 (1981) 1163.
[124] E.W. Hudson, K.M. Lang, V. Madhavan, S.H. Pan, H. Eisaki, S. Uchida, J.C. Davis,
Nature 411 (2001) 920.
[125] M. Ternes, Ph.D. Thesis. Swiss Federal Institute of Technology, Lausanne,
2006.
[126] O. Naaman, W. Teizer, R.C. Dynes, Rev. Sci. Instrum. 72 (2001) 1688.
[127] S.H. Pan, E.W. Hudson, J.C. Davis, Appl. Phys. Lett. 73 (1998) 2992.
[128] J.G. Rodrigo, H. Suderow, S. Vieira, Europ. Phys. J. B 40 (2004) 483.
[129] H. Suderow, E. Bascones, A. Izquierdo, F. Guinea, S. Vieira, Phys. Rev. B 65
(2002) 100519.
[130] R. Meservey, Phys. Scr. 38 (1988) 272.
[131] R. Meservey, P.M. Tedrow, Phys. Rep. 238 (1994) 173.
[132] T. Soda, T. Matsuura, Y. Nagaoka, Prog. Theor. Phys. 38 (1967) 551.
[133] H. Shiba, Prog. Theor. Phys. 40 (1968) 435.
[134] A. Sakurai, Prog. Theor. Phys. 44 (1970) 1472.
[135] C.F. Hirjibehedin, C.P. Lutz, A.J. Heinrich, Science 312 (2006) 1021.
[136] J. Lambe, R.C. Jaklevic, Phys. Rev. 165 (1968) 821.
[137] E.L. Wolf, Principles of Electron Tunneling Spectroscopy, Oxford University
Press, New York, 1989.
[138] B.C. Stipe, M.A. Rezaei, W. Ho, Science 280 (1998) 1732.
1830
H. Brune, P. Gambardella / Surface Science 603 (2009) 1812–1830
[139] T. Balashov, A.F. Takacs, W. Wulfhekel, J. Kirschner, Phys. Rev. Lett. 97 (2006)
187201.
[140] G. Kresse, M. Schmid, E. Napetschnig, M. Shishkin, L. Köhler, P. Varga, Science
308 (2005) 1440.
[141] H. Ellmer, V. Repain, M. Sotto, S. Rousset, Surf. Sci. 511 (2002) 183.
[142] B. Croset, Y. Girard, G. Prtvot, M. Sotto, Y. Garreau, R. Pinchaux, M. SauvageSimkin, Phys. Rev. Lett. 88 (2002) 56103.
[143] D.M. Eigler, C.P. Lutz, W.E. Rudge, Nature 352 (1991) 600.
[144] L. Bartels, G. Meyer, K.H. Rieder, Phys. Rev. Lett. 79 (1997) 697.
[145] H. Brune, Science 312 (2006) 1005.
[146] R. Wiesendanger, H.J. Güntherodt, G. Güntherodt, R.J. Gambino, R. Ruf, Phys.
Rev. Lett. 65 (1990) 247.
[147] M. Bode, Rep. Prog. Phys. 66 (2003) 523.
[148] W. Wulfhekel, J. Kirschner, Ann. Rev. Mater. Res. 37 (2007) 69.
[149] M. Bode, M. Heide, K.v. Bergmann, P. Ferriani, S. Heinze, G. Bihlmayer, A.
Kubetzka, O. Pietzsch, S. Blügel, R. Wiesendanger, Nature 447 (2007) 190.
[150] S. Rusponi, N. Weiss, T. Cren, M. Epple, H. Brune, Appl. Phys. Lett. 87 (2005)
162514.
[151] W.A. Hofer, K. Palotás, S. Rusponi, T. Cren, H. Brune, Phys. Rev. Lett. 100
(2008) 026806.
[152] S. Krause, L. Berbil-Bautista, G. Herzog, M. Bode, R. Wiesendanger, Science
317 (2007) 1537.
[153] Y. Yayon, X.H. Lu, M.F. Crommie, Phy. Rev. B 73 (2006) 155401.
[154] M.A. Ruderman, C. Kittel, Phys. Rev. 96 (1954) 99.
[155] T. Kasuya, Prog. Theor. Phys. 16 (1956) 45.
[156] K. Yosida, Phys. Rev. 106 (1957) 893.
[157] J. Wiebe, F. Meier, K. Hashimoto, G. Bihlmayer, S. Blügel, P. Ferriani, S. Heinze,
R. Wiesendanger, Phys. Rev. B 72 (2005) 193406.
[158] A.F. Otte, M. Ternes, K.V. Bergmann, S. Loth, H. Brune, C.P. Lutz, C.F.
Hirjibehedin, A.J. Heinrich, Nature Phys. 8 (2008) 847.
[159] A. Zhao, Q. Li, L. Chen, H. Xiang, W. Wang, S. Pan, B. Wang, X. Xiao, J. Yang, J.G.
Hou, Q. Zhu, Science 309 (2005) 1542.
[160] P. Wahl, L. Diekhöner, G. Wittich, L. Vitali, M.A. Schneider, K. Kern, Phys. Rev.
Lett. 95 (2005) 166601.
[161] D. Goldhaber-Gordon, H. Shtrikman, D. Mahalu, D. Abusch-Magder, U.
Meirav, M.A. Kastner, Nature 391 (1998) 156.
[162] S.M. Cronenwett, T.H. Oosterkamp, L.P. Kouwenhoven, Science 281 (1998)
540.
[163] C. Romeike, M.R. Wegewijs, W. Hofstetter, H. Schöller, Phys. Rev. Lett. 96
(2006) 196601.
[164] P. Schlottmann, Phys. Rev. B 30 (1984) 1454.
[165] B. Ujfalussy, L. Szunyogh, P. Bruno, P. Weinberger, Phys. Rev. Lett. 77 (1996)
1805.
[166] P. Gambardella, S. Stepanow, A. Dmitriev, J. Honolka, F.M.F. de Groot, M.
Lingenfelder, S.S. Gupta, D.D. Sarma, P. Bencok, S. Stanescu, S. Clair, S. Pons, N.
Lin, A.P. Seitsonen, H. Brune, J.V. Barth, K. Kern, Nat. Mater. 8 (2009) 189.
[167] W. Wulfhekel, private communication.
[168] A.F. Otte, Europhys. News 39 (2008) 31.
© Copyright 2026 Paperzz