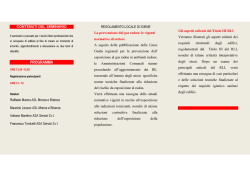
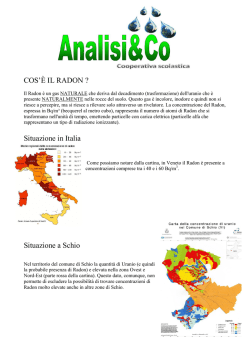
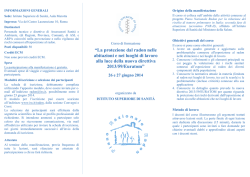
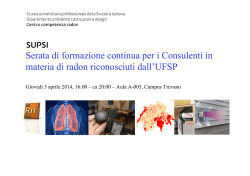
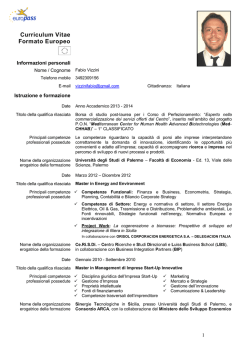
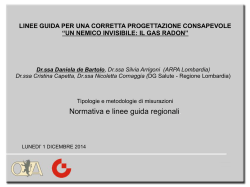
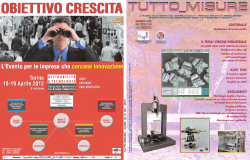
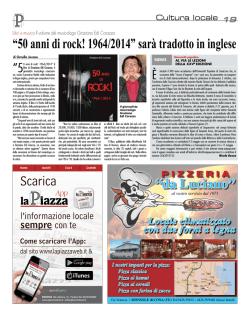
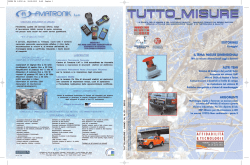
EPJ Web of Conferences 24, 05009 (2012)
DOI: 10.1051/epjconf/20122405009
C Owned by the authors, published by EDP Sciences - SIF , 2012
Radioactivity measurements in
volcano-tectonic area for geodynamic
process study
D. Morelli1,2,∗, G. Immé1,2 , S. Cammisa1 , R. Catalano1 ,
G. Mangano1 , S. La Delfa3 and G. Patanè3
1
2
Dipartimento di Fisica e Astronomia, Università di Catania
via S. Sofia, 64 I-95123 Catania, Italy
INFN, Sezione di Catania - via S. Sofia, 64 I-95123 Catania, Italy
3 Dipartimento di Scienze Geologiche, Università di Catania
Corso Italia, 57 I-95100 Catania, Italy
Abstract
In the last ten years we carried out several radioactivity investigations in the aetnean area, a peculiar site characterized by both tectonic
and volcanic features. In particular, continuous measurements in-soil
radon gas carried out from 2001 until 2006 in the eastern flank of Mt.
Etna, while several volcanic events occurred, showed a possible correlation between radon concentration and geodynamic activity, in particular magma uprising. We report in particular on the survey performed
in order to determine vertical radon concentration profiles at different
depths in sites near active faults in order to extract radon diffusion coefficients for the different sites. Moreover laboratory analysis allowed
determining radionuclide contents (via γ-spectroscopy) and radon exhalation rate (via Can-technique) for different rock samples from the
monitored sites. This study represents a contribution to better define
the radon transport process through fractured media, in particular in
volcanic area.
∗
E-mail: [email protected]
This is an Open Access article distributed under the terms of the Creative Commons Attribution License 2.0, which
permits unrestricted use, distribution, and reproduction in any medium, provided the original work is properly cited.
Article available at http://www.epj-conferences.org or http://dx.doi.org/10.1051/epjconf/20122405009
EPJ Web of Conferences
1.
Introduction
Since some years, variations of in-soil radon concentration are considered a
useful tool for geodynamical monitoring in active fault zones [1–5]; for surveillance in volcanic areas [1, 6–9] and for tracing neotectonic faults [10, 11].
Radon diffusion and transport through different media is a complex process and is affected by several factors [12–15]. Even if in the last years
several radon measurements were done for geophysical investigations, origin
and mechanism of the radon anomalies and their relationship to geodynamical events (seismic or volcanic ones) are, however, poorly understood.
According to proposed models [2, 4] radon anomalies are related to the
mechanical opening of new cracks, widening or closing of old cracks or,
alternatively, to compression mechanisms [16]. The diffusion coefficient of
radon in the rocks changes significantly in these models, an is affected by
several factors. Only a fraction of radon atoms can reach the Earth’s surface
and can exhale to atmosphere before decaying.
With the aim to better define the transport process of radon through
fractured media, we reconstructed vertical profiles at different depths near
active faults, determining in-soil radon diffusion coefficients in the Aetnean
sites. Laboratory measurements were carried out on different rock samples
in order to extract the exhalation rate.
2.
Experimental procedure
The investigated area is located on Mt. Etna, a complex volcano (more than
3300 m high and 40 km in diameter) with four summit craters (SC), more
than 300 lateral vents and cones on its flanks, and with several fault systems.
Since the actual volcanic activity prevalently concerns the eastern flank and
since our previous data [9, 17–21], continuously collected from 2001 to 2004
in the Etnean area, showed for the NE flank a possible correlation between
the radon trend and eruptive events, we carried out an investigation of insoil radon levels in the eastern region (see fig. 1), in particular near the
villages of Vena (V) [NE, 825 m a.s.l.], Cugno di Mezzo (CM) [E, 1400 m
a.s.l.], Santa Venerina (SV) [SE, 400 m a.s.l.].
All the three sites are located near fault systems that play an important
role when an eruption is approaching. In particular, Vena is near the crossing point between the Pernicana Fault (PF) and the Timpe della Naca Faults
(NF). Cugno di Mezzo is located on the southern edge of the eastern caldera
named “Valle del Bove”, characterized by very active faults. S. Venerina
05009-p.2
ER2010
14 50’
15 00’
15 10’
Mt. Etna
Y
-R
NE
NF
PF
S-R
IFT
3000
1500
VALLE
D
EL BOV
CM
500
E
SV
4
ea
37 40’
an S
N
0
37 50’
V
T
IF
8 Km
CATANIA
Ioni
SI
L
CI
37 30’
Figure 1: Etna map and location of investigation sites: Vena (white circle); Santa
Venerina (black circle); Cugno di Mezzo (square). NF = Naca Faults; PF = Pernicana Faults; TFS = Timpe Faults System; STF = Santa Tecla Faults; TF = Tremestieri Faults.
05009-p.3
EPJ Web of Conferences
is located close to two systems, the Timpe Faults System (TFS) and the S.
Tecla Fault (STF).
The three sites were simultaneously investigated for a long time under
the same meteorological conditions, in order to extract vertical radon profiles
and the diffusion coefficient.
Gamma-ray spectroscopy in laboratory and exhalation rate analysis on
rock samples collected in the investigated sites were performed, too.
2.1
Radon diffusion coefficient
In order to determine the vertical profile of the radon concentration at different depths, in-soil measurements were carried out using nuclear track
detectors (SSNTD-CR39). The detectors (active area: 25 × 25 mm2 ) were
placed inside a diffusion chamber that allows only 222 Rn entry. At each
measurement point detectors were vertically allocated, in 20 cm distance intervals, from 20 to 100 cm of depth, inside a closed PVC tube (l = 100 cm,
φ = 6.3 cm), uniformly pierced along all its length in order to allow the
radon entry. In order to avoid saturation effects the CR-39 detectors were
replaced every two weeks.
After the exposure the CR-39 detectors were chemically etched and read
by an optical microscope (connected to a CCD camera and a personal com-
Figure 2: Vertical radon concentration profiles in the Vena, Cugno di Mezzo and
Santa Venerina sites.
05009-p.4
ER2010
Table 1: In soil average Rn concentration at one meter depth; the diffusion coefficient D is extracted from the fit, for the three sites (V, CM, SV) (see text).
Site
Code
Rn
[kBq
D
m−3 ]
[10−3 cm2 s−1 ]
V
11 ± 3
14.3 ± 0.1
CM
14 ± 2
16.0 ± 0.3
SV
4±1
3.50 ± 0.01
puter) by means of a semiautomatic procedure for discriminating the tracks
according to minor and major axis and area.
The vertical profile of the radon concentration was determined by fitting
the measured values to an exponential relation [22]:
⎡
⎛
C(z) = C∞ ⎣1 − exp ⎝−z ·
⎞⎤
λ ⎠⎦
,
D
(1)
where C∞ is the radon concentration at profound depth, D is the diffusion
coefficient, λ the radon decay constant and z the depth.
In figure 2 the radon concentration vertical profiles, obtained in the
investigated sites, are plotted. Data refer to average values of in-soil radon
concentration at each depth over the investigation period. In table 1 the
values of the diffusion coefficient D obtained by data fit are reported.
2.2
Radionuclide amount
Rock samples collected from the investigated sites and together with
other rock samples (sedimentary and metamorphic) were radiometrically
characterized by means of γ-ray spectroscopy, performed using a high-purity
germanium (HPGe) detector with a relative efficiency of 30%.
In table 2 is reported the radionuclide concentration. The specific activity concentration of 238 U was determined using the gamma line of 214 Bi at
609 keV and 1120 keV. For 232 Th, the specific activity was calculated using
the gamma line of 228 Ac at 911 keV. The specific activity concentration of
40 K was estimated directly by its gamma line at 1461 keV [23].
The radionuclide distribution for different kinds of rock is shown in fig. 3.
Higher uranium and thorium concentration is observed in magmatic rocks.
05009-p.5
EPJ Web of Conferences
Table 2: Radionuclides concentration for different kinds of rock: Sedimentary rock
(from sample C01 to C05); Metamorphic rock (C06) and Magmatic rock (C07 Vena;
C08 Cugno di Mezzo; C09 Santa Venerina).
2.3
Site
238 U
232 Th
40 K
Code
[Bq kg−1 ]
[Bq kg−1 ]
[Bq kg−1 ]
C01
5±1
9±2
89 ± 6
C02
7±1
2±1
78 ± 5
C03
31 ± 3
14 ± 1
95 ± 6
C04
19 ± 3
11 ± 1
89 ± 7
C05
41 ± 5
8±1
250 ± 15
C06
31 ± 4
108 ± 10
100 ± 8
C07
56 ± 7
49 ± 7
110 ± 10
C08
80 ± 9
50 ± 7
180 ± 12
C09
40 ± 6
72 ± 8
85 ± 9
Radon exhalation rate
The radon exhalation rate was determined by means of the Can Technique
[24] using CR39 detectors. The rock samples, dried at 80 ◦ C and reduced
to about 300 g mass, were allocated in sealed cylindrical cans (φ = 8.6 cm;
h = 10.5 cm). A CR-39 detector was fixed, inside its diffusion chamber, on
the top inside each can and exposed for detecting alpha particles from the
decay of radon exhaled from the sample in the remaining volume of the can.
After three months exposure the detectors were etched and read for track
counting.
The mass exhalation rate εM was determined by the expression [25]:
εM =
CV λt
,
M [t + 1/λ(e−λt − 1)]
(2)
where C is the radon concentration measured by the track detector [Bq
m−3 ], V is the free volume of the can, λ is the radon decay constant; t is
the exposure time, M is the sample mass.
The obtained values of the exhalation rates, for the rock samples, are
shown in fig. 4. Generally, for volcanic rocks a correlation is found between
238 U concentration and exhalation rate.
05009-p.6
ER2010
Figure 3: Radionuclide distribution obtained via γ-spectroscopy for different kinds
of rock: Sedimentary rock (from sample C01 to C05); Metamorphic rock (C06) and
Magmatic rock (C07 Vena; C08 Cugno di Mezzo; C09 Santa Venerina).
Figure 4: Exhalation rate for kinds of different: Sedimentary rock (from sample
C01 to C05); Metamorphic rock (C06) and Magmatic rock (C07 Vena; C08 Cugno
di Mezzo; C09 Santa Venerina).
05009-p.7
EPJ Web of Conferences
3.
Conclusions
In order to better define the radon transport process through fractured media, an investigation was performed in sites located in the geodynamically
active area on the eastern flank of Mt. Etna.
The survey was performed using different methodologies for both short
and long-term measurements, and for reconstructing vertical radon profiles
at different depths near active faults, in order to determine the diffusivity
of radon.
Moreover, laboratory measurements on rock samples, collected from the
investigated sites, allowed to extract the radon exhalation rate under controlled physical conditions.
The comparison with results obtained using sedimentary and metamorphic sample rocks has shown that magmatic rocks have higher radionuclide
amounts and higher exhalation rate.
By comparing in-soil Radon concentration values, the Radon diffusion
coefficient, the amount of uranium, and the exhalation rate a good correlation was found, representing a further contribution to define radon transport
process, allowing in particular to shed light on the role of radon as precursor
of volcanic activity.
References
[1] Monnin M.M. and Seidel J., Radon and Volcanic Surveillance, in Radon
Measurements by Etched Track Detectors. Application in Radiation
Protection, Earth Science and the Environment, edited by Durrani S.A.
and Ilić R. (World Scientific, Singapore) 1997, pp. 301-318.
[2] Singh M., Kumar M., Jain R.K. and Chatrath R.P., Radon in ground
water related to seismic events. Rad. Meas., 30 (1999) 465-469.
[3] Walia V., Virk H.S., Bajwa B.S. and Sharma N., Relationships between
radon anomalies and seismic parameters in N-W Himalaya, India. Radiation Measurements, 36 (2003) 393-396.
[4] Planinić J., Radolic V. and Vukovic B., Radon as an earthquake precursor. Nucl. Instrum. Methods Phys. Res. A, 530 (2004) 568-574.
[5] Yasuoka Y., Ishii T., Tokonami S., Ishikawa T., Narazaki Y. and Shinogi
M., Radon anomaly related to the 1995 Kobe earthquake in Japan.
International Congress Series, 1276 (2005) 426-427.
05009-p.8
ER2010
[6] Connor C., Hill B., LaFemina P., Navarro M. and Conway M., Soil
222 Rn pulse during the initial phase of the June-August 1995 eruption
of Cerro Negro, Nicaragua. J. Volcanol. Geotherm. Res., 73 (1996) 119127.
[7] Segovia N., Mena M., Monnin M., Peňa P., Seidel J.L. and Tamez E.,
Radon-in-soil variations related to volcanic activity. Rad. Meas., 28(1-6)
(1997) 745-750.
[8] Segovia N., Armienta M.A., Valdes C., Mena M., Seidel J.L., Monnin
M., Peňa P., Lopez M.B.E. and Reyes A.V., Volacanic monitoring for
radon and chemical species in the soil and in spring water samples. Rad.
Meas., 36 (2003) 379-383.
[9] Immè G., La Delfa S., Lo Nigro S., Morelli D. and Patanè G., Soil
radon concentration and volcanic activity of Mt. Etna before and after
the 2002 eruption. Rad. Meas., 41 (2006) 241-245.
[10] Burton M., Neri M. and Condorelli D., High spatial resolution radon
measurements reveal hidden active faults on Mt. Etna. Geophys. Res.
Lett., 31 (2004) L07618.
[11] Brogna A., La Delfa S., La Monaca V., Lo Nigro S., Morelli D., Patanè
G. and Trincali G., Measurements of Radon concentration in houses of
a village characterized by volcanic and tectonic processes (eastern flank
of Mt. Etna). J. Volcanol. Geotherm. Res., 165 (2007) 71-75.
[12] Singh M., Ramola R.C., Singh B., Singh S. and Virk H.S., Radon
anomalies: correlation with seismic activities in northern India, Radon
Monitoring, in Radioprotection, Environmental and/or Earth Science,
edited by Durrani and Radomir (World Scientific) 1993, pp. 354-375.
[13] Virk H.S. Radon monitoring of microseismicity in the Kangra and
Chamba Valley of Himachal Pradesh, India, Nucl. Geophys., 9(2) (1995)
141-146.
[14] Virk H.S. and Sing B., Radon recording of Uttarkashi earthquakes,
Geophys. Res. Lett., 21(8) (1994) 737-740.
[15] Al-Hilal M., Sbeinati M.R. and Darawcheh R., Radon variation and
microearthquakes in western Syria, App. Rad. Isotopes, 49(1-2) (1998)
117-123.
05009-p.9
EPJ Web of Conferences
[16] King C.-H., King B.-S. and Evans W.C., Spatial Radon anomalies on
active faults in California. Appl. Geochem., 11 (1996) 497-510.
[17] Immè G., La Delfa S., Lo Nigro S., Morelli D. and Patanè G., Gas
Radon emission related to geodynamic activity of Mt. Etna. Ann. Geophys., 48(1) (2005) 65-71.
[18] Immè G., La Delfa S., Lo Nigro S., Morelli D. and Patanè G., Soil radon
monitoring in NE flank of Mt. Etna (Sicily). Appl. Rad. Isotopes, 64
(2006) 624-629.
[19] La Delfa S., Agostino I., Morelli D. and Patanè G., Soil Radon concentration and effective stress variation at Mt. Etna (Sicily) in the period
January 2003-April 2005. Rad. Meas., 43 (2008) 1299-1304.
[20] La Delfa S., Immè G., Lo Nigro S., Morelli D., Patanè G. and Vizzini
F., Radon measurements in the SE and NE flank of Mt. Etna (Italy).
Rad. Meas., 42 (2007) 1404-1408.
[21] Morelli D., Immè G., La Delfa S., Lo Nigro S. and Patanè G., Evidence
of soil radon as tracer of magma uprising at Mt. Etna. Rad. Meas., 41
(2006) 721-725.
[22] Jonsson G., Soil radon depth dependence. Rad. Meas., 34 (2001) 415418.
[23] IAEA, Measurement of radionuclides in food and environmental samples. IAEA Technical Report Series-295 (International Atomic Energy
Agency, Vienna, Austria) 1989.
[24] Abu-Jarad F., Application of nuclear track detectors for radon related
measurements. Nucl. Tracks Radiat. Meas., 15 (1998) 525-534.
[25] Grasty R., Radon emanation and soil moisture effects on airborne
gamma-ray measurements. Geophysics, 62(5) (1997) 1379-1385.
05009-p.10
© Copyright 2026 Paperzz