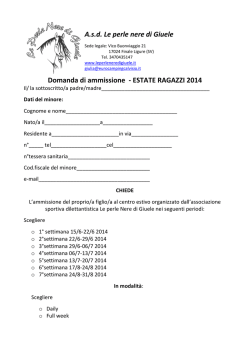
Dynamics of the Number of Trades of Financial Securities
arXiv:cond-mat/9912006v1 [cond-mat.stat-mech] 1 Dec 1999
Giovanni Bonanno, Fabrizio Lillo and Rosario N. Mantegna
Istituto Nazionale per la Fisica della Materia, Unità di Palermo
and
Dipartimento di Energetica ed Applicazioni di Fisica,Università di Palermo, Viale delle Scienze, I-90128, Palermo, Italia
We perform a parallel analysis of the spectral density of (i) the logarithm of price and (ii) the
daily number of trades of a set of stocks traded in the New York Stock Exchange. The stocks are
selected to be representative of a wide range of stock capitalization. The observed spectral densities
show a different power-law behavior. We confirm the 1/f 2 behavior for the spectral density of the
logarithm of stock price whereas we detect a 1/f -like behavior for the spectral density of the daily
number of trades.
89.90.+n
trum S(f ) ∝ 1/f γ deviates from the value γ = 1 and
moves to lower values for stocks with lower capitalization. The modeling of systems with 1/f power spectra
is still a theoretical unsolved problem. Hence the level
of activity of a given asset in a financial market presents
a statistical behavior whose theoretical modeling is certainly challenging. The paper is organized as follows: in
the next section we illustrate the analyses performed by
discussing the results obtained for one of the most capitalized stocks of the New York Stock Exchange. Section
3 presents the results obtained by investigating the selected set of stocks and in Section 4 we briefly state our
conclusions.
I. INTRODUCTION
In the field of econophysics [1] several empirical researches have been performed to investigate the statistical properties of stock price and volatility time series of
assets traded in financial markets (for a recent overview
see for example [2,3]). Comparably less attention has
been devoted to the investigation of statistical properties
of the dynamics of the number of trades of a given asset.
A similar investigation is relevant for the basic problem
of a quantitative assessment of the liquidity of the considered asset. There are two general aspects of liquidity
for an asset traded in a market. The first concerns how
easily assets can be converted back into cash in a market,
whereas the second refers to the general problem of the
ability of the market to absorb a given amount of buying and selling of shares of a given security at reasonable
price changes. In the present study we consider the statistical properties of trading related to the second aspect
of liquidity cited above. Specifically we investigate the
temporal dynamics of the number of daily trades of 88
stocks traded in the New York Stock Exchange. The 88
stocks are selected at different values of their capitalization to provide a set of stocks representative of different
levels of capitalizations. The interval of capitalization of
our set is spanning more than three orders of magnitude
in capitalization. With this choice we are able to investigate both heavily traded and less frequently traded
stocks. In the present study we focus our attention on the
time memory of the dynamics of the number of trades of a
set of financial securities. We find that most capitalized
stocks are characterized by a dynamics of the number
of trades having interesting statistical properties. The
time evolution of the number of trades has associated a
power spectrum which is well approximated by a 1/f like behavior. We interpret this result as a quantitative
evidence that the level of activity of highly capitalized
and frequently traded stocks in a financial market does
not possess a typical time scale. The same behavior is
also qualitatively detected in less capitalized stocks although the value of the exponent γ of the power spec-
II. SINGLE STOCK ANALYSIS
We analyze the number of daily trades for a selected
set of securities traded in the New York Stock Exchange
(NYSE). Our database is the trade and quote (TAQ)
database [4] for the three-year period from Jan. 1995
to Dec. 1997. The typical number of daily trades n(t)
depends on the stock considered and varies from a few
to few thousands units per day. We first analyze the
dynamics of the number of daily trades for the General
Electrics Co. (GE), which is one of the most capitalized
stocks in the NYSE in the investigated period. The time
series of the daily number of trades is shown in the inset
of Fig. 1. The number of daily trades fluctuates and
the time series is non-stationary. In order to test the
presence of long range correlation in this time series, we
determine its spectral density. The spectral density for
the time series of the number of trades of the GE is shown
in the upper curve of Fig. 1. For comparison we also show
the spectral density of the logarithm of the daily price of
the same security. We fit both spectral densities with
a power-law function S(f ) ∝ 1/f γ using a logarithmic
binnig in order to not overestimate the high-frequency
components. Our best estimation for the exponent γ
of the spectral density of the logarithm of the price is
γ = 1.93.
1
30
20
Spectral density (dB)
Spectral density (dB)
100
50
3
0
2
1
0
1995
−50
−30
1996
1997
0
−10
−20
30
20
10
0
−10
1998
−20
−10
10Log[f] (1/trading day)
10
−20
−30
0
−20
−10
0 −30
−20
−10
0
10Log[f] (1/trading day)
FIG. 1. Log-log plot of the spectral density S(f ) of the
logarithm of price (bottom curve) and of the number of daily
trades (top curve) of the General Electrics Co. (GE). The two
spectral densities are well approximated by a power-law behavior S(f ) ∝ 1/f γ with γ = 1.93 and γ = 1.19, respectively.
The two straight lines are our best fit performed as explained
in the text. In the inset we show the time evolution of the
number of daily trades of GE (in thousands of trades) in the
three-year investigated period.
FIG. 2. Spectral densities of the number of daily trades obtained by detrending the original time series. The detrending
is obtained by dividing the time series by the running average
in a time window of length L. In the four panels we show the
spectral densities obtained by detrending the original time
series with averaging windows of length L = 11 (top left),
L = 21 (top right), L = 41 (bottom left) and L = 81 (bottom right) trading days. In the regions not affected by the
detrending procedure (f > 1/L) a 1/f -like behavior is always
observed (solid line).
Hence, the spectral density is well approximated by
S(f ) ∼ 1/f 2 , which is the prediction for the spectral
density of a random walk. This form of the spectral density is related to the fact that returns of the price are
short time correlated. This result is well-established in
financial literature [5,6]. We observe a different behavior for the spectral density of the daily number of trades.
Our best fit for the exponent γ gives γ = 1.19. This value
of the exponent is compatible with a 1/f noise [7,8]. The
time series of the GE daily trades is non stationary and
shows a clear trend. We check the effect of these features
on the fitting of the spectral density by investigating surrogate data obtained removing the trend by evaluating
a running average of the original time series computed
using a window of length L. With this procedure, we
obtain a detrended time series by dividing the original
number of trades at a given day t by the average of the
number of trades in a period of length L centered in t.
We take the values of L equal to 11, 21, 41 and 81 trading
days. The new time series do not present a global trend.
In Fig. 2 we scomponents lower than 1/L are affected by
the running average procedure. We perform a power law
fit in the interval of frequency higher than 1/L and our
best fit for the exponent γ gives γ = 1.09, 0.85, 0.85, 0.91
for L = 11, 21, 41, 81, respectively. The estimation of
the exponent is weakly affected by the running averaging procedure. These results for the spectral density in
the original and detrended time series indicate that the
number of trades is intrinsically long-range correlated.
III. COMPARISON BETWEEN STOCKS
In this section we study the general validity of the results illustrated in the previous section by studying a
specific stock. In particular we determine the spectral
density of the logarithm of the price and of the number
of daily trades for a set of 88 selected stocks traded in the
NYSE. We select the stocks randomly in a wide range of
capitalization. The capitalization of our set ranges from
32 · 106 USD, which is the capitalization of the Sun Energy (SLP), to 80·109 USD for the GE. We determine the
spectral density for the ln Si (t) and of the ni (t), where
Si (t) and ni (t) are the closure price and the number of
trades of company i at day t, respectively. The subscript
i = 1, ..., 88 labels the company. For each spectral density
we perform a power-law fit S(f ) ∝ 1/f γ . We check the
robustness of our fittings by determining their correlation coefficient and we find absolute values ranging from
0.87 to 0.99 (average value 0.97) for the logarithm of the
price and from 0.56 to 0.96 (average value 0.86) for the
number of trades. In Fig. 3 we show the two exponents
as a function of the capitalization of the investigated security. The large majority of values of the exponent γ of
the spectral densities of the logarithm of the price is close
to the value γ = 2. On the other hand the large majority
of values of the exponent γ of the spectral densities of
the number of daily trades is close to the value γ = 1, in
particular for the most capitalized stocks. Moreover, the
exponent γ increases towards the value γ = 1 as far as
the capitalization increases. When we consider less cap2
trading activities in financial markets should take into
account this feature empirically observed.
italized stocks the typical number of daily trades can be
very small, of the order of 10 or less. This fact leads to
a problem of high digitalization noise of the time series,
V. ACKNOWLEDGEMENTS
2
The authors thank INFM and MURST for financial
support. This work is part of the FRA-INFM project
’Volatility in financial markets’. G. Bonanno and F. Lillo
acknowledge FSE-INFM for their fellowships.
γ
1.5
1
.5
10
7
10
8
10
9
10
10
10
[1] R. N. Mantegna and H. E. Stanley, An Introduction to
Econophysics: Correlations and Complexity in Finance,
(Cambridge Univ. Press, in press).
[2] R. N. Mantegna, ed., Proceedings of the International
Workshop on Econophysics and Statistical Finance, Physica A 269, Issue 1 (1999).
[3] J. P. Bouchaud, ed., Proceedings of the International Conference on Application of Physics in Financial Analysis,
International Journal of Theoretical and Applied Finance
in press (2000).
[4] The Trade and Quote Database, (New York Stock
Exchange, New York), http://www.nyse.com/ marketinfo/taqdatabase.html.
[5] P. H. Cootner, ed., The Random Character of Stock Market Prices, (MIT Press, 1964).
[6] P. A. Samuelson, Industrial Management Rev. 6, 41
(1965).
[7] W. H. Press, Comments Astrophys. 7, 103 (1978).
[8] B. B. Mandelbrot, Multifractals and 1/F Noise: Wild SelfAffinity in Physics (1963-1976), (Springer Verlag, 1999).
11
capitalization (USD)
FIG. 3. Plot of the exponent γ of the power-law fit
S(f ) ∝ 1/f γ of the spectral density of the number of trades
(filled circle) and of the logarithm of the price (empty circle)
as a function of the capitalization of the investigated company. The exponent γ for the logarithm of the price is almost
constant for the majority of stocks and clusters in the neighborhood of γ = 2. On the contrary, for the number of trades,
the exponent γ slowly increases by increasing the capitalization and clusters in the neighborhood of γ = 1 for the most
capitalized stocks.
because the number of trades is an integer and the
quantization noise is relevant. As a consequence the statistical analysis on these time series may present a non
negligible white noise contribution. This fact may be
one reason for the observed decreases of the value of the
exponent γ in less capitalized stocks.
IV. CONCLUSION
The statistical properties of (i) the logarithm of the
price and (ii) the number of daily trades of a security
traded in a financial market are quite different. Specifically, we confirm that the time series of the logarithm
of the price are characterized by a 1/f 2 spectral density,
whereas we observe that the time series of the daily number of trades show a 1/f -like spectral density. The 1/f 2
behavior observed in the time evolution of the logarithm
of the price reflects the short time temporal memory of
price returns. This kind of short-range time memory is
needed to ensure absence of arbitrage opportunities in
the market. On the other hand the 1/f -like behavior
observed in the daily number of trades manifests the
absence of a typical scale in the time memory of this
variable. In other words the activity of trading is not
constant in time even for most capitalized stocks and
its modeling needs to take into account phenomena occurring at a variety of time scales. Realistic models of
3
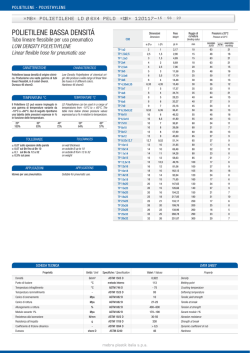
© Copyright 2026 Paperzz