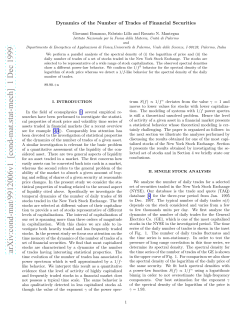
CROSS-CORRELATION BETWEEN STOCK PRICES IN
FINANCIAL MARKETS
R. N. MANTEGNA
Istituto Nazionale per la Fisica della Materia,
Unità di Palermo
and
Dipartimento di Energetica ed Applicazioni di Fisica,
Università di Palermo, Viale delle Scienze,
I-90128 Palermo, Italia
1. Introduction
Recently, physicists have become interested in the analysis and modelling of
financial systems. Several papers have been published in physics, economics
and interdisciplinary journals. Examples are: (i) the study of the statistical
properties of stock price changes (Mantegna, 1991; Mantegna & Stanley,
1994; Mantegna & Stanley, 1995); (ii) a novel approach to the option pricing
problem (Bouchaud & Sornette, 1994); (iii) the investigation of models of
artificial financial markets (Takayasu et al., 1992; Bak et al., 1993; Levy
& Solomon, 1996; Galluccio & Zhang, 1996; Bak et al., 1997) and (iv)
the comparison between price dynamics in financial markets and velocity
dynamics in turbulence (Ghashghaie et al., 1996; Mantegna & Stanley,
1996). Most of the above studies have focused on the time evolution of
stock prices or on problems related to it (as the option pricing problem).
Financial time series are modelled as stochastic processes (Samuelson,
1965). Empirical studies performed to quantify the degree of temporal correlation in the time evolution of stock price differences have shown (see,
for example (Lo, 1991)) that time correlation is rather weak or absent in
a time interval ranging from less than a trading day to several years. The
modelling of the time series of the discounted price of a financial asset in
terms of a stochastic process (specifically in terms of a martingale (Doob,
1953), which is, roughly speaking, a stochastic process with zero drift) may
seem paradoxical at first sight. The resolution of the above paradox lies
in the fact that time series which are rich in information are indeed in-
28
R. N. MANTEGNA
distinguishable from random processes. This last statement is one of the
conclusions of algorithm complexity theory.
When one attempts to model a stock exchange as a complex system,
taking into account the simultaneous presence of several stocks traded on
the same market, the simplest hypothesis is to consider stock prices as
an ensemble of random processes with no cross-correlation between them.
However, this naive approach is not consistent with the expectation that
common economic factors drive the time evolution of the prices of financial goods (Ross, 1976). The assumption that a varying degree of crosscorrelation between pairs of stock prices is present in financial markets is
a basic assumption in the theory of selecting the most efficient portfolio of
financial goods (Markowitz, 1959). Portfolio selection theory relies on the
property, observed in empirical data, that the covariance between different
stock price changes might be positive, negligible or negative in financial
markets.
In this paper, I present empirical results on the degree of cross-correlation
between pairs of stocks traded on the New York Stock Exchange and on
the long term temporal evolution of this cross-correlation. Specifically, I
investigate the correlation coefficient (Feller, 1971) for all pairs of stocks
used to compute the Dow Jones Industrial Average (DJIA) index and the
Standard and Poor’s 500 (S&P500) index. I confirm the presence of correlation and anti-correlation between pairs of stocks. The correlation and
anti-correlation is observed on a time scale of years and the values of correlation coefficients are slowly time dependent with characteristic times
longer than a year. I investigate the statistical properties of the ensemble
of correlation coefficients measured at different time periods. I detect a slow
temporal dynamics of the statistical properties of the ensemble, which is
consistent with the assumption that common economic factors affecting the
time evolution of stock prices are present in financial markets.
2. Correlation Coefficient Matrix
I analyze two portfolios of stocks of the New York Stock Exchange (NYSE):
(i) the 30 stocks used to compute the DJIA; (ii) the 500 stocks used to
compute the S&P500 index (in this last case some of the stocks used are
traded on the Over the Counter (OTC) market). The time period of the
investigated database ranges from July 3rd, 1989 to October 27th, 1995 .
For investigating the database I divide it up according to calendar years.
I investigate the synchronous correlation coefficient between the time
evolution of the logarithm of the daily closure price Yi = ln Pi (t)−ln Pi (t−1)
of a pair of stocks i and j, where i and j are the numerical labels of the stocks
and Pi (t) is the price of the stock i at the day t. I compute the correlation
CROSS-CORRELATION BETWEEN STOCK PRICES
29
Figure 1. Time evolution of the logarithm of price (daily closure data) of Coca Cola
Co. (bottom curve) and Procter & Gamble (top curve) for 1990. The time axis is the
trading time (in days). The synchronization between the two time series is apparent. The
correlation coefficient is ρ = 0.73.
coefficient by following the mathematical definition (Feller, 1971)
< Yi Yj > − < Yi >< Yj >
ρij = q
(< Yi2 > − < Yi >2 )(< Yj2 > − < Yj >2 )
(1)
The average is a temporal average performed on all the trading days of the
investigated time period. ρij quantifies the correlation observed between
the logarithm of the price of stock i and the logarithm of the price of stock
j. ρ varies from -1 to 1. ρ = 1 indicates full correlation between Yi and
Yj , ρ = −1 means full anti-correlation, while ρ = 0 is observed for an
uncorrelated pair of stocks. A portfolio of n stocks has an associated n × n
correlation coefficient matrix. The matrix is symmetric with 1’s in the main
diagonal. The number of correlation coefficients necessary to completely
describe the matrix is n(n − 1)/2.
DJIA
The number of ρij correlation coefficients for this set of stocks is 435. By
analyzing the correlation coefficient matrices obtained for the entire time
period and for the calendar years from 1990 to 1994, I observe that a strong
30
R. N. MANTEGNA
Figure 2. Average value of the non diagonal elements of the correlation coefficient matrix
versus time for the DJIA portfolio of stocks. The error bar indicates plus or minus one
standard deviation.
cross-correlation is present between pairs of stocks of this portfolio in several
cases. The highest correlation coefficient on a time scale of 1 year is observed
between Coca Cola and Procter & Gamble in 1990 (ρ = 0.73). The time
evolution of this pair of stocks is shown in Fig. 1. The synchronization
between the two stochastic processes is apparent.
A direct analysis of all pairs of stocks is, of course, unreasonable even for
moderately small portfolios. Hence, I investigate the statistical properties
of the elements of the correlation coefficient matrix. The probability density
function (pdf) P (ρ) empirically measured, namely the probability density
to find values of ρ within the interval (ρ − dρ, ρ + dρ) is a bell shaped curve,
which is approximately symmetrical with pronounced tails (especially when
ρ > 0). More detailed conclusions about the pdf cannot be drawn from the
empirical results obtained in this portfolio of stocks because the measured
pdfs are rather noisy due to the relatively limited number of correlation
coefficients present in this portfolio. In Fig. 2 I show the average value
and standard deviation of ρ in the time intervals investigated. The time
evolution of the pdf of the correlation coefficients is clearly observed. This
finding is consistent with the assumption that stock returns are affected,
to some degree, by the same common economic factors (Ross, 1976).
The values of ρ are slowly time dependent. For example, in the case
CROSS-CORRELATION BETWEEN STOCK PRICES
31
of Coca Cola and Procter & Gamble the values of ρ in different calendar
years are 0.73 (1990), 0.47 (1991), 0.28 (1992), 0.33 (1993) and 0.39 (1994).
The values of ρ are not fully indicative because the average values of ρ are
also time dependent. A better observable is the distance of ρij of the pair
of stocks from the average value of ρ given in units of standard deviations
(δ = (ρ− < ρ >)/σρ ). In this units, I measure 2.62 (1990), 1.73 (1991), 1.25
(1992), 2.44 (1993) and 2.27 (1994), for the pair Coca Cola and Procter &
Gamble . The distance from the average value is always larger than one,
ranging from 1.25 to 2.62 in units of standard deviations.
Moderately low anti-correlations between pairs of stocks with values of
ρ in the range −0.16 < ρ < 0 are also detected. The highest degree of anticorrelation is observed between Philip Morris and Exxon Corp (ρ = −0.163)
in 1993.
STANDARD & POOR’S 500
The same analysis may also be performed in the portfolio of stocks used
to compute the S&P500 index. In this case the number of independent
correlation coefficients of the correlation coefficient matrix is of the order
of 105 . This implies that the empirical determination of the pdf P (ρ) and
of its low moments is rather accurate. P (ρ), measured in the overall time
interval, is a double peaked pdf with the main peak observed at ρ ≈ 0.15 and
the second peak observed at ρ ≈ −0.05 (see Fig. 3). The ratio between the
heights of the two peaks is approximately 30. In the portfolio of stocks used
to compute the S&P500 index there are several stocks which are moderately
correlated and a relatively small number of stocks which are anti-correlated.
High values of ρ are measured and the occurrences of these observations are
much higher than predicted by assuming a Gaussian distribution for the
P (ρ). The tail observed for high values of ρ is apparently non-Gaussian.
In the analyses performed for the calendar years, I observe that the
pdf of the correlation coefficient slightly changes its shape depending on
the investigated time period. Fig. 4 shows the measured distributions in a
semilogarithmic plot to put emphasis on the tails of the distributions. The
pdfs always show an approximate bell shaped curve around the average
value of ρ but prominent tails are observed in the intervals 0.4 < ρ < 0.9.
Anti-correlated pairs of stocks are present in all the calendar years investigated and a behavior reminiscent of the two peaks observed in the analysis
of the time period from 7/89 to 10/95 is observed in the 1990 and 1991 pdfs.
The average value and standard deviation of ρ, measured in the calendar
years from 1990 to 1994, is given in Fig. 5. The time dependence of the average value of ρ for the S&P500 set of data is qualitatively the same as that
observed for the stocks of the DJIA (see Fig. 2). Specifically, a minimum
32
R. N. MANTEGNA
Figure 3. Probability density function of the elements of the correlation coefficient
matrix determined for the S&P500 portfolio of stocks in the time period form July 1989
to October 1995. The plot is semilogarithmic to show the tails of the distribution. Two
peaks are observed, the most intense for correlated pairs of stocks ρ ≈ 0.15 and the
second one for anti-correlated pairs of stocks ρ ≈ −0.05. The right tail of the distribution
is markedly non-Gaussian.
is observed in 1993 and a maximum is observed in 1990 for both sets of
stocks. Even for this portfolio of stocks, it is then possible to conclude that
the time evolution of < ρ > is consistent with the assumption that common
economic factors affect the time evolution of the price of several stocks in
a financial market (Ross, 1976). However, with the tools of statistical analysis used in the present investigation it is not possible to conclude whether
the economic common factors affecting the portfolio of DJIA stocks are
also exactly the same common economic factors affecting the portfolio of
S&P500 stocks. In this set of stocks, the highest correlation between a pair
of stocks on a time scale of 1 year is observed between Homestake Mining
and Placer Dome Inc. in 1994 (ρ = 0.82) while the highest anti-correlation
is observed between Barrick Gold and Nynex Corp (ρ = −0.30) in 1990.
As for the DJIA stock set, the values of ρ are slowly time dependent. As
an example, let us consider the correlation coefficient of Barrick Gold and
Nynex Corp. The correlation coefficient between these two stocks working
in the industry sectors of gold & silver ores and telecommunications are
-0.30 (1990), -0.10 (1991), -0.05 (1992), -0.13 (1993) and +0.01 (1994). The
correlation coefficient between Barrick Gold and Nynex Corp is always well
CROSS-CORRELATION BETWEEN STOCK PRICES
33
Figure 4. Probability density functions of the elements of the correlation coefficient
matrix determined for the S&P500 portfolio of stocks in the calendar years from 1990
to 1994. The plot is semilogarithmic in order to show the tails of the distributions.
Pronounced non-Gaussian right tails are always detected.
below the average value of ρ for of the S&P500 portfolio. The distance from
the average value ranges from -1.55 to -4.83 in units of standard deviations.
This behavior is not specific to this pair of stocks. It is indeed observed for
other pairs of stocks. This means that several pairs of stocks maintain a
certain degree of correlation on a long time scale.
Discussion
The analysis reported in this paper shows that pairs of stock prices are
correlated, uncorrelated or weakly anti-correlated on the New York Stock
Exchange. The correlation coefficient between a pair of stocks is slowly
time dependent on a time scale of years. The probability density function
of the correlation coefficient P (ρ) slowly evolves also in time. The time
evolution of < ρ > shows a similar behavior in the DJIA and in the S&P
500 portfolios of stocks on a yearly time scale .
Are these findings of moderately strong and relatively stable correlations
and anti-correlations observed between pairs of stocks consistent with the
34
R. N. MANTEGNA
Figure 5. Average value of the non diagonal elements of the correlation coefficient matrix
versus time for the portfolio of stocks used to compute the S&P500 index. The error bar
indicates plus or minus one standard deviation from the average value.
paradigm of an efficient market? Are they consistent with the assumption
that discounted stock prices are uncorrelated in time? To answer this last
question note that even if one can extract from the market time series
information about the degree of cross-correlation between pairs of stocks
of a given portfolio, this information cannot be used to predict the future
value of each single stock price.
The result of these analyses show that a picture based on the assumption that all stock prices are uncorrelated is not a realistic one. The stock
exchange is far more “complex” than a collection of several independent
random processes and the presence of cross-correlation between pairs of
stocks supports the assumption that common economic factors are affecting the time evolution of stock prices in financial markets.
Acknowledgments
Financial support from MURST and INFM is gratefully acknowledged.
References
Bak, P., Chen, K., Scheinkman, J. A. and Woodford, M. (1993) Aggregate fluctuations
from independent sectoral shocks: self-organized criticality in a model of production
CROSS-CORRELATION BETWEEN STOCK PRICES
35
and inventory dynamics, Ricerche Economiche 47 pp. 3–30.
Bak, P., Paczuski, M., and Shubik, M. (1997) Price variations in a stock market with
many agents, Physica A 246 pp. 430–453.
Bouchaud, J.-P. and Sornette, D. (1994) , The Black-Scholes option pricing problem in
mathematical finance: generalization and extensions for a large class of stochastic
processes, J. Phys. I France 4 pp. 863–881.
Doob, J. L. (1953) Stochastic Processes. John Wiley, New York.
Feller, W. (1971) An Introduction to Probability Theory and Its Applications. Wiley, New
York.
Galluccio, S., and Zhang, Y.-C. (1996) Products of random matrices and investment
strategies, Phys. Rev. E54 pp. R4516–R4519.
Ghashghaie, S., Breymann, B., Peinke, J., Talkner, P., and Dodge Y. (1996) Turbulent
cascades in foreign exchange markets, Nature 381 pp. 767–770.
Levy, M., and Solomon, S. (1996) Power laws are logarithmic Boltzmann laws, Int. J.
Mod. Phys. C7 pp. 595–601.
Lo, A. W. (1991) Long-term memory in stock market prices, Econometrica 59, pp. 1279–
1313.
Mantegna, R. N. (1991) Lévy walks and enhanced diffusion in Milan stock exchange,
Physica A 179 pp. 232–242.
Mantegna, R. N., and Stanley H. E. (1994) Stochastic process with ultraslow convergence
to a Gaussian: The truncated Lévy flight, Phys. Rev. Lett. 73 pp. 2946–2949.
Mantegna, R. N. and Stanley, H. E. (1995) Scaling behaviour in the dynamics of an
economic index, Nature 376 pp. 46–49.
Mantegna, R. N., and Stanley, H. E. (1996) Turbulence and financial markets, Nature
383 pp. 587–588.
Markowitz, H. (1959) Portfolio Selection: Efficient Diversification of Investment. John
Wiley, New York.
Ross, S. A. (1976) Arbitrage Theory of Capital Asset Pricing, Journal of Economic
Theory 13, pp. 341–360.
Samuelson, P. A. (1965) Proof that Properly Anticipated Prices Fluctuate Randomly,
Industrial Management Review 6 pp. 41-49; reproduced as Chapter 198 in Samuelson,
Collected Scientific Papers, Volume III, Cambridge, M.I.T. Press, 1972.
Takayasu, H., Miura, H., Hirabayashi, T. and Hamada, K. (1992) Statistical properties
of deterministic threshold elements – the case of market price, Physica A184 pp.
127–134.
© Copyright 2026 Paperzz