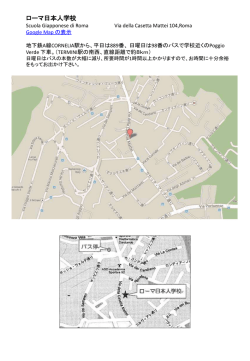
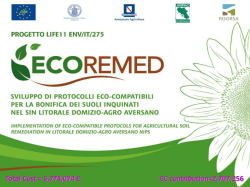
File: L:/3b2/RIVISTE/GeoActa/7055_2007/011-024_Sammartino.3d Ð Pagina: 11
GeoActa, vol. 6, 2007, pp. 11-23, Bologna
The Pedogeochemical Map of Parma alluvial plain:
contribution of soil studies to geochemical mapping
IRENE SAMMARTINO1, ALESSANDRO AMOROSI1, MARINA GUERMANDI2 and NAZARIA MARCHI2
1
Á di Bologna, Via Zamboni 67, 40127 Bologna, Italy. E-mail:[email protected]; alessanDipartimento di Scienze della Terra e Geologico-Ambientali, Universita
[email protected]
Servizio Geologico, Sismico e dei Suoli, Regione Emilia-Romagna, Viale Silvani 4/3, 40122. Bologna, Italy.
2
Abstract
The last decades have recorded a growing interest in geochemical mapping, and refined statistical techniques
have been used in order to define the pedogeochemical content of potentially toxic metals in soils, following
definition by ISO/DIS 19258. Advances in sedimentological and soil research provide today the opportunity to
examine distribution of pedogeochemical contents of selected elements within a mixed pedological and sedimentological framework, through integration of geochemical data with detailed soil characterization.
Pedological and geochemical analyses of 200 soil samples from 100 sites of Parma alluvial plain (Sheet 181 of
Soil Map to 1:50,000 scale), collected within depths of 20-30 cm and 90-100 cm, respectively, enable precise
identification of the pedogeochemical content of selected geochemical elements as a function of soil maturity
and sediment provenance. Increasing soil evolution invariably results in Ti, Zr, V, Fe2O3 and Al2O3 enrichment.
In contrast, Ca is strongly depleted in highly mature soils, in response to leaching processes.
Similarly to what recently documented from the Po Delta area, sediment supplied by Po River to Parma
alluvial plain is characterized by remarkably high natural concentrations of Cr and Ni, reflecting erosion of
ultramafic complexes cropping out in the Po drainage basin. A striking similar composition is recorded within
sediments supplied by Taro River, which also hosts ultramafic rocks in its drainage basin. In contrast, a markedly
different composition, with significantly lower Cr and Ni values, is recorded within sediments supplied from
other Apenninic (Stirone, Parma and Ongina) rivers. Soil distribution of other metals, such as Cu, Zn and Pb,
does not reflect important differences in sediment provenance.
In order to obtain a realistic view of the pollution status of the study area, the pedogeochemical content,
measured at 90-100 cm depth, was matched against metal content recorded in topsoil units (20-30 cm). Despite
their locally very high concentrations, nickel and chromium do not show enrichments due to anthropogenic
disturbance. In contrast, a diffuse (although moderate) soil contamination is observed for copper, lead and zinc.
The Pedogeochemical map illustrated here, including a Map of Pedogeochemical Content and a Map of
Geochemical Anomalies, represents a novel approach to geochemical mapping. This map constitutes a powerful
tool to assess the anthropogenic impact on alluvial plains, which can be of use for legislative purposes and for
planning strategies for environmental protection.
Keywords: Pedogeochemical map, Heavy metals, Sediment Provenance, Geochemical anomalies, Po Plain
Introduction
In order to provide a reliable estimate of the
pollution status of soils relative to its metal content, natural metal concentrations (pedogeochemical values) for different soil types should be
established (ISO/DIS 19258). Once pedogeochemical content of metals is defined, geochemical anomalies can be assessed as deviations of
measured metal content from the norm (Reimann
and Garrett, 2005).
According to Italian legislation (D.lgs. 152/06),
samples representative of background values for a
study site are samples collected close to the investigated site, in which there is certainty of nonpollution in the same soil type''. However, in presence of strong and widespread anthropogenic
influence, or a varied geologic framework, determination of pedogeochemical content strictly
following this definition may provide highly unreliable results.
Lack of information about geochemical composition of local substrates has led in many instances to adoption of international reference
values, instead of actual background concentrations (Rubio et al., 2000; Rapant and Kordik,
2003). These, however, may represent unreliable
approximations of pedogeochemical values and
lead, consequently, to incorrect estimates of geochemical anomalies. In other instances, geochemical mapping has been based upon interpolation of ``baseline values'' (Salminen et al.,
1998; Plant et al., 2001; Albanese et al., 2007). The
geochemical baseline, however, differs sub11
File: L:/3b2/RIVISTE/GeoActa/7055_2007/011-024_Sammartino.3d Ð Pagina: 12
Irene Sammartino, Alessandro Amorosi, Marina Guermandi and Nazaria Marchi
Fig. 1 - Schematic map of Northern Italy, with indication of the major ultramafic complexes of Western Alps and Northern Apennines (outcrops
of ultramafic rocks after CNR, 1990). Figure 2 is shown in box.
stantially from the pedogeochemical content, in
that it represents the total metal concentration
measured in soils, irrespective of its natural versus
anthropogenic contribution.
Recent studies (Darnley, 1997; Salminen and
Tarvainen, 1997; Amorosi and Sammartino, 2005,
2007) have shown that the major factors controlling geochemical composition of sediments are: i)
sediment provenance, which in turn is related to
drainage-basin composition, and is a function of
the geochemistry of the source material; ii) grain
size, which depends on transport and selection
processes taking place within different depositional environments.
The complex interaction between these factors
allows for local yield of high natural concentrations of potentially toxic metals in soils, which may
exceed the threshold limits designated for contaminated areas (Miller, 1997; Box and Wallis,
2000; Myers and Thorbjornsen, 2004). For instance, high natural Cr and Ni concentrations
have been reported from core samples of Po River
Basin, up to 200 m depth, within sediments supplied by Po River (Amorosi et al., 2002; 2007).
12
These high values have been attributed to erosion,
by the Po river and its tributaries, of widespread
chromium- and nickel-rich ultramafic complexes
cropping out in several areas of the western Alps
and the northern Apennines (Fig. 1).
Geochemical interpretation of core data is
consistent with geochemical studies from stream
Á et
sediments (Dinelli and Lucchini, 1999; Vigano
al., 2003), and has been recently supported by
geochemical characterization of superficial sediments from the Romagna coastal plain, where a
strong relationship between natural soil distribution of heavy metals and sedimentologic characteristics has been detected (Amorosi and Sammartino, 2007). Particularly, high natural pedogeochemical values of Cr and Ni, commonly exceeding the maximum values admitted for residential and park areas by D.lgs. 152/06, have
been recorded within sediments of Po River provenance. In contrast, low Cr and Ni concentrations characterize sediments supplied by Romagna Apenninic rivers. Despite their high concentrations, chromium and nickel of geogenic
origin are strongly linked to the mineral fraction
File: L:/3b2/RIVISTE/GeoActa/7055_2007/011-024_Sammartino.3d Ð Pagina: 13
The Pedogeochemical Map of Parma alluvial plain: contribution of soil studies to geochemical mapping
Fig. 2 - Close-up of Figure 1, with indication of the study area. Note ultramaphic rocks cropping out in Taro and Ceno drainage basins (dark
grey), and lack of ophiolitic complexes in Ongina, Stirone, Baganza and Parma drainage basins (light grey).
and are not significantly bioavailable (Sammartino, 2004). This has led to the generation of a
conceptually new type of geochemical map, in
which natural metal distribution is depicted as a
function of the sedimentological characteristics of
the geological units (Amorosi and Sammartino,
2005).
Soil types developed on different substrates are
also likely to be fingerprinted by distinctive geochemical compositions. In addition to sediment
provenance and grain size, processes of soil formation and development may also play a fundamental role in determining the geochemical
composition of soils, through selective element
enrichment or depletion. These concepts, however, have been developed in few studies only
(Facchinelli et al., 2001; Baize and TerceÁ , 2002;
Sartori et al., 2004; Spadoni, 2006), and have not
been taken into account within an official geochemical map, so far.
As part of a joint project between Regione
Emilia-Romagna and University of Bologna
(``Valutazione di caratteri del suolo in rapporto alla
Á di conutilizzazione degli effluenti e alle modalita
duzione dei terreni, e monitoraggio degli effetti e
degli spandimenti protratti nel medio periodo''), financially supported by Servizio Sviluppo Agroalimentare and carried out in conjunction with
Servizio Geologico, Sismico e dei Suoli, we investigated the natural pedogeochemical content
of five metals (Cr, Ni, Pb, Cu and Zn) within soils
of a pilot area.
The study area, located in SW Po Plain, between the Apenninic chain and Po River, corresponds to Sheet 181 (``Parma Nord'') of Soil Map
of Italy to 1:50,000 scale (Figs. 1 and 2). The primary aim of this study is the construction of a
prototypal map, which is called here Pedogeochemical Map, aimed at defining a realistic representation of the natural content of heavy metals in soils, providing preliminary information
about their pollution state. Specific goal is the
definition of the major factors controlling elements distribution in different soil types. The five
13
File: L:/3b2/RIVISTE/GeoActa/7055_2007/011-024_Sammartino.3d Ð Pagina: 14
Irene Sammartino, Alessandro Amorosi, Marina Guermandi and Nazaria Marchi
metals considered in this study correspond to
those included in Italian D.lgs. 99/92, which provides directives about the use of sewage sludge in
agricultural soils.
Superficial geology and pedological setting of
Sheet 181
Sheet 181 is located at the southern margin of
the Po Plain, NW of the town of Parma. The area
is not heavily urbanized, with the exception of its
SE part, corresponding to Parma suburbs. The
main soil use is for agricultural practice, while
industrial activities are subordinate. A series of
roughly parallel, SW-NE trending rivers, namely,
from west to east, Ongina, Stirone, Taro and
Parma, cross the study area, flowing into Po River.
Drainage-basin composition of these rivers is
varied, and its description is beyond the scope of
this paper. Given, however, the important role of
Ni and Cr as provenance indicators (Amorosi et
al., 2002; 2007; Amorosi and Sammartino, 2005;
2007), we stress here the presence, in the northern
Apennines, of ultramafic rocks cropping out extensively within the Taro River drainage basin,
whereas Ongina, Stirone, and Parma drainage
basins are virtually ophiolite-free (see Fig. 2).
The major geological features of the study area
are: i) fluvial terrace and alluvial fan deposits of
the Apennines foothills, cropping out in the SW
portion of Sheet 181, close to the basin margin; ii)
alluvial plain deposits of Apenninic provenance,
representing the bulk of the study area; iii) fluvial
deposits related to the Po River, which flows in
the NE portion of Sheet 181.
Single terrace units are observed at distinct topographic heights, and generally include thin fining-upward fluvial sequences, capped by a variable
thickness of colluvial material. Alluvial-fan deposits consist predominantly of thick successions
of fluvial-channel gravels and sands, generally with
fining-upward tendencies and upward transition to
fine overbank and/or colluvial material.
The alluvial plain depositional system can be
subdivided into two major facies associations:
channel/levee and floodplain deposits, respectively. Channel deposits consist predominantly of
medium to coarse sand, whereas crevasse and levee deposits are made up of sandy silt to fine sand.
Floodplain deposits, corresponding to overbank
fines, consist of silt and clay, with rare, thin sand
intercalations.
14
The pedological framework for the study area is
provided by the Geological Survey of Regione
Emilia-Romagna Soil Map to 1:50,000 scale
(Sheet 181), where 31 different soil units have
been mapped. For purposes of geochemical
characterization, soil units were assembled, on the
basis of their different degree of soil weathering,
into three major groups, which are shown in Figure 3:
i) Soils with high degree of weathering. These
soils, which are restricted to the SW part of
the study area, developed at top of comparatively old (pre-Holocene) substrates,
corresponding to fluvial terrace deposits
cropping out at the Apennines foothills.
ii) Soils with moderate degree of weathering,
developed on top of Holocene sediments of
pre-Roman age. This group includes soils of
both Apenninic and Po River provenance.
iii) Soils with low degree of weathering, developed on alluvial plain sediments of postRoman age. This group includes soils of
both Apenninic and Po River provenance.
Methods
A total of 200 samples were collected in 100
selected sites by hand-drillings, using Eijkelkamp
Agrisearch equipment. Two different sets of
samples were collected at each site, within depths
of 20-30 cm and 90-100 cm, respectively. Selection
of sampling sites was not performed through
regular grids, but finalized to cover the wide
spectrum of individual soil units reported by the
Soil Map, following the indications of ISO/DIS
19258.
Chemical analyses were conducted up to standard indications ISO/DIS 19528 on 90-100 cm
deep samples, using X-ray fluorescence spectrometry (XRF), for determination of total pedogeochemical content. For the estimation of geochemical anomalies, analyses of samples collected
within a depth of 20-30 cm were duplicated, using
both XRF and inductively coupled plasma mass
spectrometry (ICP-MS), with aqua regia digestion
(Als Chemex Laboratories, Vancouver, Canada,
code ME-MS41).
XRF analyses, including major and trace elements, were conducted at Dipartimento di Scienze della Terra e Geologico-Ambientali of Bologna University. Soil samples, pressed into tablets, were analyzed for major and trace elements
File: L:/3b2/RIVISTE/GeoActa/7055_2007/011-024_Sammartino.3d Ð Pagina: 15
The Pedogeochemical Map of Parma alluvial plain: contribution of soil studies to geochemical mapping
Fig. 3 - Synthetic Soil Map of Sheet 181 (``Parma Nord''), showing location of sampling sites. Different provenance domains are distinguished
uniquely for soils with low degree of weathering. On: Ongina River, Pa: St: Stirone River, Ta: Taro River, Po: Po River, Parma River.
15
File: L:/3b2/RIVISTE/GeoActa/7055_2007/011-024_Sammartino.3d Ð Pagina: 16
Irene Sammartino, Alessandro Amorosi, Marina Guermandi and Nazaria Marchi
Fig. 4 - Scatterplot diagrams of selected geochemical indicators, showing changes in geochemical composition as a function of soil maturity.
in a Philips PW1480 spectrometry with a Rh tube,
using matrix correction methods of Franzini et al.
(1972), Leoni and Saitta (1976) and Leoni et al.
(1982). Reference samples, such as sample JB-1A
(GSJ reference sample, Imai et al., 1995) were
also analyzed. The accuracy of determinations for
trace-elements is 5% (<3% for Cr, <2% for Ni,
about 2% for Cu, about 3% for Zn), except for
elements with concentration of 10 ppm or lower,
where the accuracy is 10-15%.
Geochemical characterization of soils
The following sections explore the major geochemical features of soils in the study area,
through a selection of diagrams that summarize
peculiar geochemical characteristics as a function
of degree of weathering and sediment provenance.
Soil composition as a function of weathering
A set of scatterplot diagrams shows that soils
with peculiar degree of weathering can be distinguished on the basis of distinctive geochemical
16
attributes, with very few exceptions (Fig. 4). Specifically, soils with high degree of weathering invariably display the highest concentrations of Zr,
V, TiO2, Al2O3 and Fe2O3. These geochemical
indicators are reciprocally characterized by strong
positive correlation and show progressive decreasing values with decreasing soil maturity (Fig.
4). In contrast, soils with low degree of weathering
display the highest CaO concentrations.
The abundance of Ti, Zr and V within highmaturity soils indicates that these elements are
immobile within the soil profile and resistant to
eluviation processes (Boyle, 2007). High Al2O3
and Fe2O3 values are likely to be due to accumulation of clays and Fe/Al hydrous oxides within
illuvial deposits. The positive correlation between
these geochemical indicators reflects their affiliation to the same mineral phases, and the tendency
of selected minerals to concentrate as part of the
same deposit. On the other hand, the inverse
correlation between CaO values and soil maturity
can be interpreted to reflect calcium loss due to
leaching processes during pedogenesis.
The very scarce overlap between the three
groups of soils documents the suitability of the
scatterplots of Figure 4 to provide a geochemical
File: L:/3b2/RIVISTE/GeoActa/7055_2007/011-024_Sammartino.3d Ð Pagina: 17
The Pedogeochemical Map of Parma alluvial plain: contribution of soil studies to geochemical mapping
Fig. 5 - Scatterplot diagrams, showing increase in natural Cr and Ni concentrations as a function of increasing soil maturity.
characterization of soils as a function of soil maturity. In particular, soils with high degree of
weathering have a marked tendency to plot into
distinct fields of the scatterplot diagrams, while
soils with moderate and low degree of weathering
tend to coalesce. This is probably due to stronger
pedologic differences between Pleistocene and
Holocene soils, rather than between pre-Roman
and post-Roman soils. Rare deviations from these
trends (see a couple of black dots in Fig. 4) could
reflect sampling inaccuracy (local sampling of
colluvial material) or possible local errors in the
soil map.
Metal distribution as a function of sediment provenance
Previous work on soil samples from the Po Plain
has shown that chromium, nickel and magnesium,
which reflect the ultramafic fraction of sediment,
can be regarded as reliable provenance indicators
for this area, providing an obvious distinction
between a Po River-related (Cr, Ni and Mg-rich)
province and an Apenninic (Cr, Ni and Mg-poor)
province (Amorosi and Sammartino, 2005; 2007).
These studies, however, dealt almost uniquely
with deposits of post-Roman age (i.e., soils with
low degree of weathering).
In order to account for the relative effect of soil
maturity and sediment provenance on natural Cr
and Ni concentrations in the study area, we plotted first our data into two binary diagrams (Cr/
MgO and Ni/MgO), with a subdivision into soils of
post-Roman age and soils developed on older
deposits (Fig .5). It is apparent that Cr, Ni and Mg
display clear positive relationships in samples
from soils with low degree of weathering, whereas
relative metal enrichments are observed within
higher-maturity soils. Particularly, remarkable Cr
concentrations are observed within pre-Roman
soils, which are invariably enriched in this metal
with respect to their younger counterparts. This
specific distribution suggests an affinity of Cr for
mineral phases resistant to weathering processes,
such as those belonging to the chromium-bearing
spinel group (chromite) or the garnet group
(uvarovite).
A set of boxplots (Fig. 6) can be used to depict
geochemical attributes of soils with low degree of
weathering, and thus emphasize the role played by
sediment provenance on pedogeochemical content. As expected, Cr, Ni and MgO display remarkable differences as a function of the different
sediment sources, and enable the identification,
within the study area, of distinct provenance domains. Sediments supplied by Po River show the
highest Cr, Ni and Mg contents. Among the
Apenninic rivers, Taro River sediments are considerably enriched in Cr, Ni and Mg, although
with slightly lower values than Po sediments. On
the other hand, very low values of these geochemical indicators characterize Parma, Stirone
and Ongina deposits.
Strontium mirrors the geochemical behaviour
of Cr, Ni and Mg, showing the lowest value for Po
River sediments, and increasing concentrations
from Taro to Parma river sediments (Fig. 6).
Natural concentrations of other potentially
toxic metals, such as Cu, Zn and Pb, exhibit a
considerably different behaviour (Fig. 7). In these
instances, except for relatively lower Cu values in
sediments from Po River and higher Zn concentrations in sediments from Ongina River, the
boxplots show substantial overlap, irrespective of
17
File: L:/3b2/RIVISTE/GeoActa/7055_2007/011-024_Sammartino.3d Ð Pagina: 18
Irene Sammartino, Alessandro Amorosi, Marina Guermandi and Nazaria Marchi
Fig. 6 - Boxplots of selected geochemical indicators from soils with low degree of weathering, showing the influence of sediment provenance
on natural metal distribution. Each provenance domain is clearly fingerprinted by a peculiar geochemical composition (see text). The lower
boundary of the box is the 25th percentile, the upper boundary is the 75th percentile, the bold line within the box corresponds to the median,
the ``whiskers'' define the minimum and maximum values. Pa: Parma River, St: Stirone River, On: Ongina River, Ta: Taro River, Po: Po River.
concentrations admitted by Italian legislation for
parks and residential areas (150 ppm for Cr and
120 ppm for Ni).
Higher CaO values of Parma and Stirone river
sediments are interpreted to reflect the peculiar
lithologic composition of the related drainage
basins, which include abundant carbonate rocks.
Similar contents of Cu, Zn and Pb indicate that
sediment provenance did not exerted a significant
control on spatial distribution of these metals
across the study area.
Fig. 7 - Boxplots of selected geochemical elements from soils with
low degree of weathering, showing scarce (Cu, Zn) or no influence
(Pb) of sediment provenance on natural metal distribution. Keys as
in Fig. 5.
the different sediment sources. This can be especially seen for Pb.
This study confirms previous hypotheses about
soil metal distribution in the Po Plain. The very
high Cr, Ni and Mg contents observed in Po-derived sediments, combined with the slightly lower
values observed in sediments from Taro River,
support the interpretation of a natural provenance from ultramafic complexes (see distribution
of ophiolitic rocks in Fig. 2). Chromium and nickel
concentrations in Po River sediments average 217
and 151 ppm, respectively, while 192 and 134 ppm
are recorded for sediments of Taro River. These
values are significantly higher than maximum
18
The Pedogeochemical Map of Sheet 181
The Pedogeochemical Map of Sheet 181 is
composed chiefly of two geochemical maps that
summarize the results illustrated in the previous
sections: i) Map of Pedogeochemical Content,
and ii) Map of Geochemical Anomalies. Pedogeochemical maps of two selected metals (Ni and
Cu), with opposite behaviour, are shown in Figures 8 and 9 for comparison.
Map of Pedogeochemical Content
This map (Fig. 8) results from the geochemical
characterization of soils shown in the previous
sections and is based on XRF data from 100 soil
samples collected within a depth of 90-100 cm
(black dots in Fig. 8). This map represents an in-
File: L:/3b2/RIVISTE/GeoActa/7055_2007/011-024_Sammartino.3d Ð Pagina: 19
The Pedogeochemical Map of Parma alluvial plain: contribution of soil studies to geochemical mapping
Fig. 8 - Map of Pedogeochemical Content of Ni and Cu, based upon metal contents at 90-100 cm depth.
19
File: L:/3b2/RIVISTE/GeoActa/7055_2007/011-024_Sammartino.3d Ð Pagina: 20
Irene Sammartino, Alessandro Amorosi, Marina Guermandi and Nazaria Marchi
controlled by sediment provenance. This is the
case for Cu, Zn and Pb (see also the boxplots of
Fig. 7), where Maps of Pedogeochemical Content
do not show an important overlap with the soil
map, and are traced mostly according to traditional statistical methods (Fig. 8b). Lead distribution, however, displays relative concentration
within soils with higher degree of weathering.
Table 1 - Soil quality evaluation on the basis of the Index of
geoaccumulation of MuÈller (1979) and FoÈrstner and MuÈller (1981).
novative product in the field of geochemical
mapping, combining soil and sedimentological
features with traditional statistical interpolation
methods, such as kriging (see discussion in
Amorosi and Sammartino, 2005).
Different metal contents are indicated by tones
of the same colour, darker shades corresponding
to higher concentrations. Four classes are mapped
for each metal, and boundaries between classes
are calculated on a statistical basis on the whole
data set (25th, 50th, 75th percentile concentrations,
expressed as mg/kg), following recommendations
of ISO/DIS 19258.
The geochemical characterization of soil units
constitutes the guide to the construction of these
maps. The boundaries for each class represent the
lowest and the highest metal concentrations, respectively, which are expected for a specific soil
type in a given site. As a consequence, metal
concentrations higher than those predicted by the
Map of Pedogeochemical Content are very likely
to reflect an anthropogenic influence.
Comparison between the Map of Pedogeochemical Content and the soil map (see Fig. 3)
allows prompt interpretation of metal distribution
on a pedological basis, as a function of sediment
provenance and soil weathering. In the case of Ni
(Fig. 8a), the very good overlap observed between
these two maps, with the highest Ni contents recorded in coincidence of alluvial sediments supplied by Po and Taro rivers, is fully consistent with
interpretation of Ni provenance from the ultramafic complexes of the related drainage basins
(Figs. 1 and 2). On the other hand, remarkably
lower Ni values are observed for Ongina, Stirone
and Parma rivers, whose drainage basins do not
include ophiolites.
A totally different picture is observed where
natural metal distribution does not appear to be
20
Map of Geochemical Anomalies
For a reliable estimate of the anthropogenic
disturbance, the natural pedogeochemical content
resulting from samples at 90-100 cm depth was
matched against metal concentrations observed
within topsoil samples (20-30 cm depth) collected
at the same sites. To this purpose, chemical analyses were conducted using the same analytical
procedure (XRF), and metal pollution evaluated
using the Index of geoaccumulation (Igeo) proposed by Mu
Èrstner and Mu
Èller (1979) and Fo
Èller
(1981):
Igeo = log 2 Cn / (1.5*Bn)
where Cn is the content of the element n at 2030 cm depth and Bn is the pedogeochemical content of the same element at 90-100 cm depth.
On the basis of Igeo, the pollution status of soils
can be differentiated into seven classes (Table 1),
from <0 to 6 (Mu
Èller, 1981; Banat et al., 2005;
Sainz and Ruiz, 2006). The highest value of Igeo (6
in Table 1) reveals metal concentrations 100 times
higher than background concentrations.
The index of geoaccumulation provides an obvious indication of the pollution status of the study
sites, with reference to a specific metal (Fig. 9).
Soil quality is indicated by dots, the colours of
which reflect the classification scheme of Mu
Èller
(1981). Green colours are indicative of non-contamination, while yellow and red dots correspond
to slightly- to moderately polluted soils. Two values of metal concentration are reported for each
sampling site: both are related to 20-30 cm deep
samples, and expressed in mg/kg. Numbers in
upper position reflect metal concentrations obtained by ICP-MS analysis, while values in lower
position, are derived from XRF analysis.
When metal contents exceed maximum concentrations admitted by the law (D.M. 471/99 and
D. lgs. 99/92), they are shown in red. Metal concentrations measured by XRF analysis are generally higher than those calculated on the same
File: L:/3b2/RIVISTE/GeoActa/7055_2007/011-024_Sammartino.3d Ð Pagina: 21
The Pedogeochemical Map of Parma alluvial plain: contribution of soil studies to geochemical mapping
Fig. 9 - Map of Geochemical Anomalies of Ni and Cu, based upon metal contents at 20-30 cm depth versus 90-100 cm depth. Metal
concentrations exceeding threshold limits (in red) may reflect either natural (Ni) or anthropogenic (Cu) origin.
21
File: L:/3b2/RIVISTE/GeoActa/7055_2007/011-024_Sammartino.3d Ð Pagina: 22
Irene Sammartino, Alessandro Amorosi, Marina Guermandi and Nazaria Marchi
samples by ICP-MS, which involves incomplete
digestion (Rauret, 1998; Ianni et al., 2001), especially for Cr and Ni.
There is no indication of contamination from Ni
(and Cr) in the study area (Fig. 9a), whereas a
diffuse moderate contamination by Cu (Pb and
Zn) can be observed, especially in areas subjected
to agricultural practice (Fig. 9b). It should be kept
in mind, however, that point information obtained
from the 100 study sites can not be extrapolated
outside these areas, and that specific, local studies
should be undertaken in order to detect precisely
sources of anthropogenic contamination.
Practical use of the Pedogeochemical Map
In summary, the Pedogeochemical Map represents a powerful tool which can be used pragmatically: i) to understand soil metal distribution
as a function of soil maturity and sediment provenance; ii) to separate the anthropogenic contribution from pedogeochemical content, and thus
delineate geochemical anomalies. Specifically,
accurate intersection of the Map of Pedogeochemical Content with the Map of Geochemical
Anomalies enables precise interpretation of metal
distribution and may be of help in making sound
environmental decisions.
The Map of Geochemical Anomalies of Ni and
Cr (Fig. 9a) show uniform low Igeo values in all the
study stations (green dots), which is a clear indication of unpolluted soils. The abundance of red
numbers, indicating Ni contents exceeding
threshold limits, is not by itself diagnostic of soil
contamination. Being coupled with green dots
(which means that no metal enrichment is recorded in topsoil samples with respect to local
pedogeochemical content), the red numbers indicate that the high Ni contents recorded in the Po
and Taro river areas are not related to anthropogenic disturbance, but simply reflect high
background concentrations of this metal in soils,
owing to geogenic factors (see Fig. 8a). As documented by Sammartino (2004) in the Romagna
coastal plain, high natural amounts of Cr and Ni,
resulting from erosion of ultrafemic complexes,
are not bioavailable, and thus not dangerous for
human health.
Copper displays an opposite behaviour (Figs.
8b and 9b). Despite its relatively low concentrations, shown by black numbers on the Map of
Geochemical Anomalies (indicating values below
threshold limits for Cu), half of the study sites
appear as slightly contaminated (yellow dots). In
two cases (Soragna and San Secondo Parmense
areas, respectively), soils are defined as ``moderately polluted'' (red dots) and Cu concentrations
are beyond threshold limits. These areas require
specific attention for environmental protection.
Acknowledgements
This study was supported by Servizio Agroalimentare of Regione Emilia-Romagna. We are strongly indebted to Dr. Andrea
Giapponesi, who made this study possible.
References
ALBANESE S., DE VIVO B., LIMA A. and CICCHELLA D., 2007.
Geochemical background and baseline values of toxic elements
in stream sediments of Campania region (Italy). Journal of
Geochemical Exploration 93, 21-34.
AMOROSI A., CENTINEO M.C., DINELLI E., LUCCHINI F. and TATEO
F., 2002. Geochemical variations as indicators of provenance
changes in Late Quaternary deposits of SE Po Plain. Sedimentary Geology 151, 273-292.
AMOROSI A. and SAMMARTINO I., 2007. Influence of sediment
provenance on background values of potentially toxic metals
from near-surface sediments of Po coastal plain (Italy). International Journal of Earth Sciences 96, 389-396.
AMOROSI A., COLALONGO M.L., DINELLI E., LUCCHINI F. and VAIANI
S.C., 2007. Cyclic variations in sediment provenance from late
Pleistocene deposits of the eastern Po Plain, Italy. In: Arribas J.,
Critelli S. and Johnsson M.J. (eds.). Sedimentary Provenance and
Petrogenesis: Perspectives from Petrography and Geochemistry.
Geological Society of America Special Paper 420, 13-24.
BAIZE D. and TERCeÁ M., 2002. Les eÂleÂments traces meÂtalliques
dans les sols. INRA, Paris, 565 pages.
22
BANAT K.M., HOWARI F.M. and AL-HAMAD A.A., 2005. Heavy
metals in urban soils of central Jordan: Should we worry about
their environmental risks? Environmental Research 97, 258-273.
CNR-Progetto Finalizzato Geodinamica, 1990. Structural Model
of Italy , scale 1:500.000 and Gravity Map. Quad. Ric. Scient. 3,
S.E.L.C.A., Firenze.
BOX S. and WALLIS J.C., 2002. Surficial geology along the Spokane
River, Washington and its relationship to the metal content of
sediments. US Geol Survey, Open-File Report 02-126, 1-16.
BOYLE J.F., 2007. Simulating loss of primary silicate minerals from
soil due to long-term weathering using Allogen: Comparison
with soil chronosequence, lake sediment and river solute flux
data. Geomorphology 83, 121-135.
DARNLEY A.G., 1997. A global geochemical reference network:
the foundation for geochemical baselines. Journal of Geochemical Exploration 60, 1-5.
DECRETO LEGISLATIVO 27/01/1992, Në 99. Attuazione della direttiva 86/278/Cee concernente la protezione dell'ambiente in
particolare del suolo, nell'utilizzazione dei fanghi di depurazione in agricoltura. G.U. 39, 15/02/1992.
File: L:/3b2/RIVISTE/GeoActa/7055_2007/011-024_Sammartino.3d Ð Pagina: 23
The Pedogeochemical Map of Parma alluvial plain: contribution of soil studies to geochemical mapping
DECRETO LEGISLATIVO 03/04/2006, Në 152. Norme in materia ambientale. G.U. 88, 14/04/2006.
DECRETO MINISTERIALE 25/10/1999, Në 471. Regolamento recante
criteri, procedure e modalitaÁ per la messa in sicurezza, la bonifica e il ripristino ambientale dei siti inquinati. G.U. 293, 15/
12/1999.
DINELLI E. and LUCCHINI F., 1999. Sediment supply to the Adriatic
sea basin from the Italian rivers: geochemical features and
environmental constraints. Giornale di Geologia 61, 121-132.
FACCHINELLI A., SACCHI E., and MALLEN L., 2001. Multivariate
statistical and GIS-based approach to identify heavy metal
sources in soils. Environmental Pollution 114, 313-324.
FOÈRSTNER U. and Mu
ÈLLER G., 1981. Concentrations of heavy
metals and polyciclic aromatic hydrocarbons in river sediments:
geochemica background, man's influence and environmental
impact. Geojournal 5, 417-432.
FRANZINI M., LEONI L. and SAITTA M., 1972. A simple method to
evaluate the matrix effects in X-ray fluorescence analysis. XRay Spectrometry 1, 151-154.
IANNI C., RUGGIERI N., RIVARO P. and FRACHE R., 2001. Evaluation and comparison of two selective extraction procedures for
heavy etals speciations in sediments. Analytical Sciences 17,
1273-1278.
ISO/DIS 19258, 2005. Soil quality - Guidance on the determination of background values. ISO/TC 190/SC 7- 19258.
LEONI L. and SAITTA M., 1976. X-ray fluorescence analysis of 29
Á
race elements in rock and mineral standard. Rendiconti Societa
Italiana Mineralogica e Petrologica 32, 497-510.
LEONI L., MENICHINI M. and SAITTA M., 1982. Determination of S,
Cl and F in silicate rocks by X-ray fluorescence analysis. X-Ray
Spectrometry 11, 156-158.
MILLER J.R., 1997. The role of fluvial geomorphic processes in the
dispersal of heavy metals from mine sites. Journal of Geochemical Exploration 58, 101-118.
MUÈLLER G., 1979. Schwermetalle in den sedimenten des RheinsVeraÈndergunten seit 1971. Umschan 79, 778-783.
MUÈLLER G., 1981. Die Schwermetallbelastung der Sedimente des
Neckars und seiner Nebenflusse: eine Bestandsaufnahme.
Chemie in unserer Zeit,105, 157±164.
MYERS A. and THORBJORNSEN J., 2004. Identifying Metals Contamination in Soil: A Geochemical Approach. Soil and Sediment Contamination 13, 1-16.
PLANT J., SMITH D., SMITH B. and WILLIAMS L., 2001. Environmental geochemistry at the global scale. Applied Geochemistry 16, 1291-1308.
RAPANT S. and KORDIK J., 2003. An environmental risk assessment
map of the Slovak Republic: application of data from geochemical atlases. Environmental Geology 44, 400-407.
RAURET G., 1998. Extraction procedures for the determination of
heavy metals in contaminated soil and sediment. Talanta 46,
449-455.
REGIONE EMILIA-ROMAGNA, 2005. Carta dei Suoli della pianura a
scala 1:50.000 - versione digitale 2005. Servizio Geologico, Sismico e dei Suoli.
REIMANN C. and GARRETT R.G., 2005. Geochemical background concept and reality. Science Total Environment 350, 12-27.
RUBIO B., NOMBELA M.A. and VILAS F., 2000. Geochemistry of
major and trace elements in sediments of the Ria de Vigo (NW
Spain): an assessment of metal pollution. Marine Pollution
Bulletin 40, 968-980.
SAINZ A. and RUIZ F., 2006. Influence of the very polluted inputs
of the Tinto-Odiel system on the adjacent littoral sediments of
southwestern Spain: A statistical approach. Chemosphere 62,
1612-1622.
SALMINEN R. and TARVAINEN T., 1997. The problem of defining
geochemical baselines A case study of selected elements and
geological materials in Finland. Journal of Geochemical Exploration 60, 91-98.
SALMINEN R., TARVAINEN T., DEMETRIADES A., DURIS M., FORDYCE
F.M., GREGORAUSKIENE V., KAHELIN H., KIVISILLA J.,. KLAVER
G, KLEIN H., LARSON J.O., LIS J., LOCUTURA J., MARSINA K.,
MJARTANOVA H., MOUVET C., O'CONNOR P., ODOR L., OTTONELLO G., PAUKOLA T., PLANT J.A., REIMANN C., SCHERMANN O.,
SIEWERS U., STEENFELT A., VAN DER SLUYS J., DE VIVO B. and
WILLIAMS L., 1998. FOREGS geochemical mapping. Field
manual. Geological Survey of Finland, Guide 47, 36 pages.
SAMMARTINO I., 2004. Heavy-metal anomalies and bioavailability
from soils of southeastern Po Plain. GeoActa 3, 35-42.
SARTORI G., CORRADINI F., BINI C., GEMIGNANI S. and MANCABELLI
A., 2004. Contenuto di metalli pesanti nei suoli del Trentino.
Studi Trentini di Scienze Naturali. Acta Geologica 79, 75-117.
SPADONI M., 2006. Geochemical mapping using a geomorphologic
approach based on catchments. Journal of Geochemical Exploration 90, 183-196.
Á L., ARILLO A, BUFFAGNI A., CAMUSO M., CIANNARELLA R.,
VIGANo
CROSA G., FALUGI C., GALASSI S., GAZZELLA L., LOPEZ A.,
MINGAZZINI M., PAGNOTTA R., PATROLECCO L., TARTARI G. and
VALSECCHI S., 2003. Quality assessment of bed sediments of the
Po River (Italy) Water Research 37, 501-518.
23
File: L:/3b2/RIVISTE/GeoActa/7055_2007/011-024_Sammartino.3d Ð Pagina: 24
© Copyright 2026 Paperzz