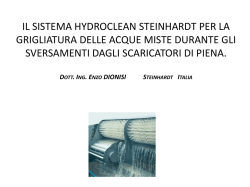
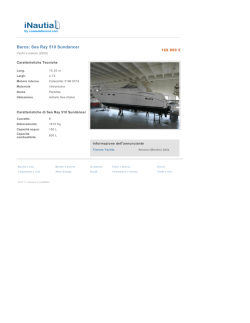
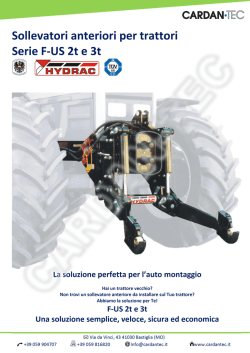
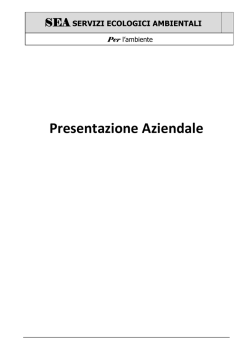
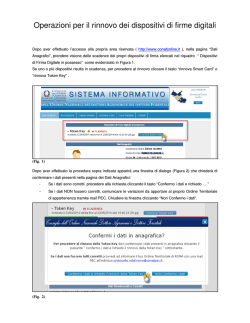
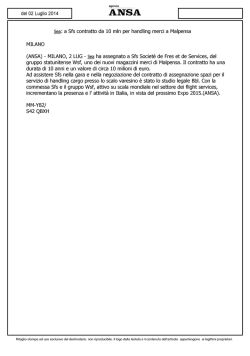
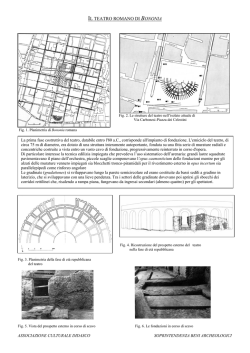
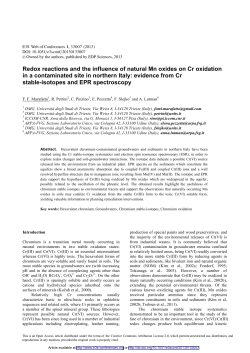
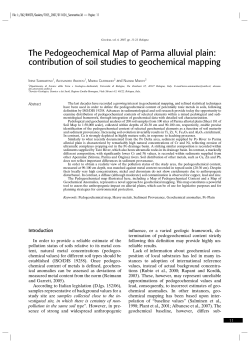
This article appeared in a journal published by Elsevier. The attached
copy is furnished to the author for internal non-commercial research
and education use, including for instruction at the authors institution
and sharing with colleagues.
Other uses, including reproduction and distribution, or selling or
licensing copies, or posting to personal, institutional or third party
websites are prohibited.
In most cases authors are permitted to post their version of the
article (e.g. in Word or Tex form) to their personal website or
institutional repository. Authors requiring further information
regarding Elsevier’s archiving and manuscript policies are
encouraged to visit:
http://www.elsevier.com/copyright
Author's personal copy
Journal of Geochemical Exploration 105 (2010) 19–33
Contents lists available at ScienceDirect
Journal of Geochemical Exploration
j o u r n a l h o m e p a g e : w w w. e l s e v i e r. c o m / l o c a t e / j g e o e x p
Geochemical baselines and risk assessment of the Bagnoli brownfield site coastal sea
sediments (Naples, Italy)
Stefano Albanese a,⁎, Benedetto De Vivo a, Annamaria Lima a, Domenico Cicchella c,
Diego Civitillo a, Antonio Cosenza b
a
b
c
Dipartimento di Scienze della Terra, Università di Napoli ‘Federico II’, Via Mezzocannone 8, 80134 Napoli, Italy
Dipartimento di Scienze degli Alimenti e dell'Ambiente, Università degli Studi di Messina, Via Salita Sperone, 31 - Contrada Papardo, Sant'Agata, 98167 Messina, Italy
Dipartimento di Studi Geologici ed Ambientali, Università del Sannio, Via dei Mulini 59/A, 82100 Benevento, Italy
a r t i c l e
i n f o
Article history:
Received 7 October 2009
Accepted 19 January 2010
Available online 29 January 2010
Keywords:
Geochemical baseline
Toxic elements
PAHs
PCBs
Brownfield site
Sea sediments
a b s t r a c t
The Bagnoli brownfield site, one of the largest Italian dismantled industrial areas undergoing remediation, is
located in the western sector of the urban territory of the city of Naples (Southern Italy) inside the active
volcanic field of Campi Flegrei. The remediation project, funded by the Italian government, started in 1996
and was extended to the coastal area sea sediments facing the brownfield site in 2001.
A total of 384 sea sediment samples were collected from 128 boreholes at different depths (0–20 cm, 20–30 cm,
30–50 cm, 100–120 cm, 150–180 cm, 180–200 cm, 280–300 cm, and 380–400 cm) down the seabed along the
coastline. Analyzed samples show that the coastal area facing the Bagnoli brownfield site is strongly contaminated
by metals whose distribution seems to be controlled by the grain size of the sea sediments, and by the presence of
organic compounds (PAHs and PCBs).
Geochemical mapping and R-mode factor score analysis allowed us to identify the groundwaters, emanating from
the brownfield site to the sea across an artificial structure (“Colmata a mare”) limited by two piers and filled by
scum, slag and landfill material, as the main source of contaminants.
Since the groundwaters metal contamination was proven to be mostly dependent on a natural hydrothermal
enrichment process related to the volcanic activity of Campi Flegrei, a remediation project would be needed
primarily for PAHs and PCBs, which occur well above the concentration levels permitted by the Italian Law in the
sea sediments facing the Bagnoli coastline.
© 2010 Elsevier B.V. All rights reserved.
1. Introduction
The assessment of risk to public health associated with land
contamination from industrial sources is a common topic in many
developed countries (US Environmental Protection Agency, 1996a;
Edelgaard and Dahlström, 1999; Bieber, 2000; Quercia, 2001). In the
last century, the Bagnoli urban district, located at the western outskirts
of the city of Naples, on the eastern side of the active volcanic complex
of Campi Flegrei, has been affected by a strong industrialization process
lead by factories such as Italsider (ILVA) (steel production), Eternit
(asbestos materials manufacturing), Cementir (cement production),
and Federconsorzi (fertilizers production) (Fig. 1). During the decade
between 1990 and 2000, these industrial activities were all closed.
With the aim of recovering and reusing the areas formerly occupied
by the ILVA and the Eternit factories, the Italian Government funded in
1994 (CIPE, 1994) a remediation plan for the brownfield site, in the
⁎ Corresponding author.
E-mail address: [email protected] (S. Albanese).
0375-6742/$ – see front matter © 2010 Elsevier B.V. All rights reserved.
doi:10.1016/j.gexplo.2010.01.007
framework of the new urban development plan of the Naples City
Council.
The Federconsorzi area was acquired by the IDIS Foundation to be
converted into an exhibition centre for sciences (City of Sciences),
while the area occupied by the closed Cementir factory has not yet
undergone any remediation programme.
In 1996, a full-scale investigation of soils, scums, slags and landfill
materials was planned by the Government for the ILVA and Eternit
areas, with the purpose of characterizing the pollution and to set up a
plan for recovery.
In 2000, the Bagnoli brownfield site was classified as a SNI (Site of
National Interest) by the Italian Parliament (Parlamento Italiano,
2000) and in 2001 the coastal area facing the brownfield site was also
included in the areas to be characterized and possibly recovered
(Ministero dell'Ambiente e della Tutela del Territorio, 2001).
De Vivo and Lima (2008) discuss, in detail, the characterization of
the brownfield site and the results of the remediation project. In
accordance with the results of isotopic investigations carried out by
Tarzia et al. (2002) on soil and landfill samples from the brownfield site,
two components were identified as the source of the high concentrations of heavy metals and As found in soils and waters: 1) hydrothermal
Author's personal copy
S. Albanese et al. / Journal of Geochemical Exploration 105 (2010) 19–33
Fig. 1. The Bagnoli brownfield site and coastal area sketch map.
20
Author's personal copy
S. Albanese et al. / Journal of Geochemical Exploration 105 (2010) 19–33
fluids related to the volcanic activity of the Campi Flegrei (i.e. natural),
and 2) fossil fuel use, scums and slags from steel production, and
emission of industrial fumes (i.e. anthropogenic).
21
The results of leach tests carried out on industrial materials (scum,
slag and landfill material) from the brownfield site showed that their
microstructural configuration is stable and heavy metals are most likely
Fig. 2. Geomorphological map of Gulf of Pozzuoli (After De Pippo et al., 1988). 1) Würmian shelf; 2) sediment accumulation area; 3) post-Würmian terrace; 4) Roman age Beach;
5) basin border; 6) internal basin area; 7) regional fault scarp; 8) volcano-tectonic scarp; 9) buried volcano-tectonic scarp (probably Caldera borders); 10) crater border;
11) volcanic bank; 12) canyon; 13) gas sources.
Author's personal copy
22
S. Albanese et al. / Journal of Geochemical Exploration 105 (2010) 19–33
trapped in the lattice of the insoluble microstructure phase. Since
industrial materials are unlikely to contribute metallic pollution to local
groundwaters, De Vivo and Lima (2008) point out the need of a
remediation plan focused mainly on removing the polycyclic aromatic
hydrocarbons (PAHs) found along the shoreline, whose location
corresponds with a filling structure (“Colmata a mare”) delimited by
two piers and filled by scum, slag and landfill material from the
brownfield site during the period 1962–1964.
Investigations on pollutants released to the marine environment
from the brownfield site were carried on by I.C.R.A.M. (Istituto Centrale
per la Ricerca scientifica e tecnologica Applicata al Mare) (ICRAM,
2005), a governmental research institute supervised by the Ministry for
the Environment, Land and Sea. The ICRAM provides institutional
support for the policies of the central government and local authorities
in the resolution of marine environmental problems.
In this paper we will focus on the results of characterization
activities carried out on the coastal sea sediments facing the brownfield
site and in particular on the “Colmata a mare” structure.
The spatial variability of contaminant concentrations in sea
sediments will be evaluated down to a depth of 5 m from the seabed.
Univariate and multivariate geostatistical analyses will be performed
on geochemical data to assess the nature (anthropic or/and geogenic)
and the extent of contamination sources for the sea sediments.
2. Study area
Bagnoli is located in the south-eastern sector of the Gulf of Pozzuoli
which is part of the Campi Flegrei volcanic complex (Fig. 2). Volcanic
products related to Campi Flegrei activity are part of the K-series of the
Roman co-magmatic province (Peccerillo, 1985; Washington, 1906)
and their composition varies from trachybasalts to phonolitic and
peralkaline trachytes (Di Girolamo, 1978; Armienti et al., 1983).
The coastal area in front of the Bagnoli brownfield site is part of a
shelf facing the entire shoreline of the Gulf of Pozzuoli. The shelf
extends from the coastline toward the 50 m bathymetry and borders a
central recently collapsed area (12–10 kyr bp) (De Pippo et al., 1988).
Volcanic banks (Nisida, Pentapalummo and Miseno) bordered by an
external Würmian shelf are present on the southern side of the
collapsed area (De Pippo et al., 1988; Fig. 2).
The presence of submarine hydrothermal springs located along a
NW–SE axis, in the eastern sector of the Gulf of Pozzuoli (Sharp and
Nardi, 1987), is clearly related to the secondary volcanic activity of the
Campi Flegrei area. On the seabed surface sediment grain size is
mostly sandy becoming silty in correspondence with some sheltered
areas along the coastline, that are characterized by low energy for
sediment transport (Cocco et al., 1988).
In the Bagnoli–Fuorigrotta area, the water table is found slightly
above sea level and can be intercepted at shallow depths, especially on
the south side of the local railroad (Fig. 3). The groundwater of the
Bagnoli plain, resupplied directly by rainfall, is part of a wider
groundwater body which spans the whole Campi Flegrei area and
discharges directly to the sea (Celico and Habetswallner, 1999a,b,
2000).
De Vivo and Lima (2008) showed that metal pollution of the Bagnoli
brownfield groundwaters is due mostly to the upwelling of hydrothermal fluids occurring for the major part along Neogenic fractures and
Fig. 3. Morphology of the piezometric surface obtained from surface and deep boreholes piezometers (After De Vivo and Lima, 2008).
Author's personal copy
S. Albanese et al. / Journal of Geochemical Exploration 105 (2010) 19–33
23
Fig. 4. Bagnoli sea sediments sampling sectors and borehole location map.
faults. These fluids contain heavy and potentially toxic metals such as
As, Hg, Cu, Pb, and Cd. In contrast, hydrocarbons (mostly PAHs) are
leached by rain fall percolating through soils and landfills contaminated
by industrial activities.
3. Field activities and sampling
Sampling activities of sea sediments have been carried out by I.C.R.
A.M. (ICRAM, 2005) in 4 distinct sectors to characterize geochemically
the Bagnoli coastal area and the sea sediments facing the brownfield
site.
The sectors have been delimited based on the expected contamination, as a function of the proximity to the brownfield site (Fig. 4):
• Sector 1: from the W seashore (Pozzuoli–Dazio) to 30 m sea bathymetry.
• Sector 2: from the Bagnoli–Coroglio seashore to 30 m sea bathymetry (this is the sector closest the brownfield site where the highest
contamination is to be expected).
• Sector 3: from the area around Nisida Island to Posillipo coast (this
area is not directly affected by industrial contamination).
• Sector 4: from 30 m to 50 m sea bathymetry coastal area in front of
the brownfield site (4a) and from the 50 m sea bathymetry to the
external limit defined by the Italian Government for the “Site of
National Interest (SNI)” of Bagnoli (4b).
384 sea sediment samples (between November 2004 and March
2005) were collected in the 4 sectors from 128 boreholes at different
depths down the seabed along the coastline (0–20 cm, 20–30 cm,
30–50 cm, 100–120 cm, 150–180 cm, 180–200 cm, 280–300 cm, and
380–400 cm) with a sampling density decreasing at increasing
depths and distances respectively from the seabed surface and from
the coastline. In the sector closest to the brownfield site (sector 2), a
150 m × 150 m cell sampling grid was used to locate boreholes,
whereas, in the other sectors a 500 m × 500 m cell sampling grid was
used (Fig. 4).
Sampling operations were carried out using a pontoon which was
moved with the help of two tugboats. 3 containers were positioned
on the pontoon and one of them used as a refrigerator for storage of
cores.
The placement of sampling stations, established with a portable
DGPS instrument, was performed prior to the arrival of the pontoon
and sampling activities was carried on by means of a vibrating drill,
Table 1
Detection limits for ICP-OES and AAS analyses of metals in sea sediments.
Element
Al
As
Be
Cd
Cr
Co
Mn
Fe
Hg
Ni
Pb
Cu
V
Zn
ICP-OES
AAS
mg/kg
mg/kg
3
3.5
0.02
0.4
0.4
0.4
1
1
–
1
2.5
0.3
0.5
0.1
0.2
0.1
0.02
0.01
0.1
0.1
0.1
0.1
0.01
0.1
0.1
0.1
0.3
0.01
Author's personal copy
24
S. Albanese et al. / Journal of Geochemical Exploration 105 (2010) 19–33
with a large base ensuring its vertical position during the coring
(ICRAM, 2005).
In order to collect uncontaminated sediment, an internal liner was
used during drilling operations and, subsequently, collected cores
were transported on the pontoon and opened lengthwise using a
circular saw. From each core, subsamples were collected in correspondence of established depths (see above), labelled and stowed in
the refrigerator until their daily delivery to the ICRAM laboratories.
Samples were also collected along the seashore on the northern
and southern side of the “Colmata a mare”, the structure filled by
scum, slags and landfill materials artificially created between two
piers. The seashore characterization was carried out in a first phase
by means of 20 shallow boreholes from which sediments (mostly
sands) were collected at different depths. Since on the northern side
of seashore, analyses carried out by ICRAM, indicated very high
concentration levels of PAHs, a second phase of characterization was
planned to collect 22 additional sand samples only from this area.
4. Methods
4.1. Chemical analyses and granulometry
Analyses of metals (Al, As, Be, Cd, Co, Cr, Fe, Hg, Mn, Ni, Pb, Cu, Sn, V,
and Zn) and organic compounds (PAHs — Polycyclic Aromatic Hydrocarbons, both single compounds and total, and PCBs — Polychlorinated
biphenyls ) on the Bagnoli sea sediment samples were performed at
ICRAM laboratories.
For metallic elements, microwave assisted acid digestion for a total
decomposition of matrices was applied to sediment samples according
to EPA Method 3052 (US Environmental Protection Agency, 1996b).
Table 2A
Statistical parameters for sea sediment sample at different sampling depths (0–20 cm, 20–30 cm, 30–50 cm).
Element/compound
N
Mean
Median
Min
Max
Depth 0–20 cm
Al (%)
As (mg/kg)
Be (mg/kg)
Cd (mg/kg)
Co (mg/kg)
Cr (mg/kg)
Cu (mg/kg)
Fe (%)
Hg (mg/kg)
Mn (mg/kg)
Ni (mg/kg)
Pb (mg/kg)
Sn (mg/kg)
V (mg/kg)
Zn (mg/kg)
PAH (mg/kg)
PCB's (µg/kg)
125
125
125
125
125
125
125
125
125
125
125
125
125
125
125
125
125
0.48
11.7
3.6
0.76
7
16.4
47
4.5
0.57
1330
71
292
17.35
74.44
593
165
108
0.38
8.5
3.3
0.39
6.8
12.7
31
4.1
0.36
940
74
221
14
64
386
37
23
0.07
2.2
0.01
0.01
1.3
4
5.88
0.7
0.01
277
3.41
21
2.2
26
93
0.1
0.8
2.1
55
11.7
7.4
28
103
236
10.8
3.5
8070
181
1773
88
575
2829
2947
6665
Depth 20–30 cm
Al (%)
As (mg/kg)
Be (mg/kg)
Cd (mg/kg)
Co (mg/kg)
Cr (mg/kg)
Cu (mg/kg)
Fe (%)
Hg (mg/kg)
Mn (mg/kg)
Ni (mg/kg)
Pb (mg/kg)
Sn (mg/kg)
V (mg/kg)
Zn (mg/kg)
PAH (mg/kg)
PCB's (µg/kg)
85
85
85
85
85
85
85
85
85
85
85
85
85
85
85
85
85
0.6
9.1
4.4
1.4
9.2
14.5
59
5.2
0.72
1803
105
393
20
68
827
159
56
0.45
7.3
3.9
0.9
7.3
11.5
48
4.7
0.37
1212
109
316
16
65
613
48
29
0.14
1.8
0.05
0.06
2.1
4.8
5.82
0.6
0.01
378
31.04
34.69
0.05
23
90
0.08
1
Depth 30–50 cm
Al (%)
As (mg/kg)
Be (mg/kg)
Cd (mg/kg)
Co (mg/kg)
Cr (mg/kg)
Cu (mg/kg)
Fe (%)
Hg (mg/kg)
Mn (mg/kg)
Ni (mg/kg)
Pb (mg/kg)
Sn (mg/kg)
V (mg/kg)
Zn (mg/kg)
PAH (mg/kg)
PCB's (µg/kg)
85
85
85
85
85
85
85
85
85
85
85
85
85
85
85
85
85
0.64
8.9
4.6
2.19
9
13
56
4.6
1
1703
98.1
412
23
71
886
212
55
0.48
7
4.2
0.72
7.1
9.2
38
3.5
0.3
1056
101
207
11.1
60
512
29
6.4
0.12
3.3
0.03
0.05
3.3
3.3
5.51
1.1
0.01
407
21
35
0.05
15.6
102
0.05
0.07
Skewness
Kurtosis
St. dev.
1.9
2.3
0.71
3
1.7
3.3
1.9
1
2.4
2.9
0.11
2.44
2.6
6.32
1.8
4.2
10.8
4.3
6.9
0.97
12.2
3.9
16
4.2
− 0.3
5.9
9.3
− 1.4
8.7
8.6
44
3.9
20
119
0.4
8
2.1
1.1
5
13.2
42
2.6
0.7
1293
50
267
15
63
517
417
599
2.6
26
13.3
9
26
61
210
11.6
6.3
10,779
280
2220
79
221
3200
1806
458
2.5
1.6
1
2.6
1.5
2.5
1.3
0.65
3.2
2.7
1
2.4
1.5
2.6
1.5
3.5
2.7
10.6
2.6
1.2
7.5
2.1
7.6
1
− 0.37
11.7
7.6
4.6
8.9
2.5
13.7
1.9
13
7.7
0.4
4.7
2.8
1.7
4.9
9.9
50
2.5
1.1
1920
38
346
17
26
706
323
87
3.9
37
12.1
44
37
142
222
11.2
8.3
11,458
184
3446
177
557
5185
2265
726
3.2
2.6
1
6.6
2.5
5.3
1.26
0.87
2.6
2.9
−0.3
3.23
2.9
6.80
2.1
2.8
3.7
14
8.4
0.3
51
7.7
31
0.95
− 0.5
7.8
10
−0.6
13.63
9.3
54
5.3
7
18
0.6
5.6
3
5.3
5.6
19
52
2.5
1.5
1929
36
534
34
60
1018
490
109
Author's personal copy
S. Albanese et al. / Journal of Geochemical Exploration 105 (2010) 19–33
Each sample was digested in an HCl and HNO3 (1:3) solution for
15 min. The sample was placed in an inert polymeric vessel, sealed and
heated in a microwave system. A 4-step heating cycle was performed
prior to adding HF to the cooled solution. After a second heating cycle,
H3BO3 was added to the solution. Finally, the solution was filtered and
brought to a final volume of 100 ml with the addition of ultrapure
water. As, Cd, Cu, Pb and Zn were analyzed by ICP-OES (Inductively
Coupled Plasma-Optical Emission Spectrometry), Hg (and other
elements, if characterized by concentrations below the ICP-OES
detection limits) were analyzed by AAS (Atomic Absorption Spectroscopy) (Table 1).
25
For PAHs determinations, freeze-dried samples were extracted from
the pulp using a mixture of methanol and acetone. After centrifugation
the supernatant was filtered at 0.2 μm and then analyzed by HPLC-FLD
(High-Performance Liquid Chromatography whit Fluorescence Detector) according to EPA Method 8310 (US Environmental Protection
Agency, 1986). Detection limits are 0.5 µg/kg for each PAH. For PCBs
determinations, dry samples were placed in a glass thimble with the
addition of a solution of dichloromethane/hexane (1:1) and centrifuged
after sonication. The organic fraction was collected in a flask. After
repeating the operation, the two fractions were combined and treated
with activated copper and then the solution was evaporated up to 1
Table 2B
Statistical parameters for sea sediment sample at different sampling depths (100–120 cm, 180–200 cm, 280–300 cm, 380–400 cm).
Element/compound
N
Mean
Median
Min
Max
Depth 100–120 cm
Al (%)
As (mg/kg)
Be (mg/kg)
Cd (mg/kg)
Co (mg/kg)
Cr (mg/kg)
Cu (mg/kg)
Fe (%)
Hg (mg/kg)
Mn (mg/kg)
Ni (mg/kg)
Pb (mg/kg)
Sn (mg/kg)
V (mg/kg)
Zn (mg/kg)
PAH (mg/kg)
PCB's (µg/kg)
44
44
44
44
44
44
44
44
44
44
44
44
44
44
44
44
44
0.45
7.3
5.6
1
7.3
8.6
34
3.4
0.52
991
105
212
11.5
66
500
105
68
0.38
6.6
5.2
0.5
6.7
6.2
14.6
2.8
0.09
599
119
114
5.7
61
221
5.2
1.6
0.12
2.8
0.4
0.01
2.8
1.9
5.4
1.8
0.01
433
15
30
2
35
93
0.05
0.05
1.3
18
12
5.9
18
66
355
8.4
4.8
9709
157
1131
88
141
1779
1654
2186
1.6
1.9
0.6
2.2
1.9
5.1
4.7
2
3.2
5.41
−0.81
2.4
3.2
2.2
1.3
3.9
6.4
2.8
4.7
− 0.2
4.9
4.5
30
26
3.4
11
32
−0.11
6.3
11.9
6.6
0.4
16
41
0.3
2.8
3
1.3
3
9.7
56
1.5
1
1449
35
237
16
20
515
322
331
Depth 180–200 cm
Al (%)
As (mg/kg)
Be (mg/kg)
Cd (mg/kg)
Co (mg/kg)
Cr (mg/kg)
Cu (mg/kg)
Fe (%)
Hg (mg/kg)
Mn (mg/kg)
Ni (mg/kg)
Pb (mg/kg)
Sn (mg/kg)
V (mg/kg)
Zn (mg/kg)
PAH (mg/kg)
PCB's (µg/kg)
33
33
33
33
33
33
33
33
33
33
33
33
33
33
33
33
33
0.57
8.2
6.1
1
8.2
7.7
36
3.2
0.29
865
114
282
26
62
570
110
76
0.5
6.2
5.2
0.3
6.2
6.8
10.6
2.6
0.03
526
125
99
5.5
60
195
1
1.46
0.18
1.4
0.9
0.05
1.4
2.0
2.9
1.4
0.01
325
12.8
25
2.2
35
100
0.07
0.34
1.6
73
14.1
9.4
73
38
408
10.5
3.4
6505
171
2061
358
99
4229
2514
1244
1.41
5.6
0.5
3.2
5.5
4.1
4.4
2.9
3.6
4.3
−1
2.7
4.2
0.5
2.7
5
4.1
2.51
31
− 0.43
10.1
31
20
22
9.3
12.2
21
1.1
6.2
19
1
6.8
26
18
0.3
11.9
3.6
2.1
11.9
6
73
1.8
0.83
1125
34
510
68
14
999
457
241
Depth 280–300 cm*
Skewness
Kurtosis
St. dev.
Depth 380–400 cm*
Element/compound
N
Mean
Median
Min
Max
Element/
compound
N
Mean
Median
Min
Max
Al (%)
As (mg/kg)
Be (mg/kg)
Cd (mg/kg)
Co (mg/kg)
Cr (mg/kg)
Cu (mg/kg)
Fe (%)
Hg (mg/kg)
Mn (mg/kg)
Ni (mg/kg)
Pb (mg/kg)
Sn (mg/kg)
V (mg/kg)
Zn (mg/kg)
PAH (mg/kg)
PCB's (µg/kg)
7
7
7
7
7
7
7
7
7
7
7
7
7
7
7
7
7
0.69
8.4
6.8
0.2
8.4
7.5
8.4
4.1
0.02
684
122
208
6.4
80
264
4.0
1.2
0.7
8.3
7.1
0.2
8.3
7.6
9.1
3.2
0.02
600
124
120
2.7
79
159
1.5
0.9
0.43
6.3
4.2
0.1
6.3
4.5
4.9
2.4
0.01
431
104
89
2.1
62
128
0.1
0
1
10.5
11.7
0.4
10.5
11.7
11.2
10
0.07
1733
144
755
22
107
910
8.4
3.6
Al (%)
As (mg/kg)
Be (mg/kg)
Cd (mg/kg)
Co (mg/kg)
Cr (mg/kg)
Cu (mg/kg)
Fe (%)
Hg (mg/kg)
Mn (mg/kg)
Ni (mg/kg)
Pb (mg/kg)
Sn (mg/kg)
V (mg/kg)
Zn (mg/kg)
PAH (mg/kg)
PCB's (µg/kg)
5
5
5
5
5
5
5
5
5
5
5
5
5
5
5
5
5
0.59
9
3
0.2
8.7
9.6
11
3.3
0.0146
935
128
238
8.9
83
438
3
0.6
0.52
9
3.5
0.2
9
8.1
7
2.8
0.015
582
128
105
4.8
80
173
3.5
0.7
0.46
6
0.5
0.1
6
4.8
5.7
2.2
0.011
365
121
75
3.9
74
133
0.1
0.1
0.87
12
4.4
0.5
12
18
28
5.8
0.019
2731
137
818
27
98
1546
6.4
1
*Due to the lack of a statistically significant number of samples, only basic statistics are reported.
Author's personal copy
26
S. Albanese et al. / Journal of Geochemical Exploration 105 (2010) 19–33
Table 3
Varimax-rotated factor (two-factor) model for 128 samples of sea sediments collected
at a depth of 0–20 cm. Bold entries report loading values over 0.5; underlined entries
report negative loadings below − 0.5.
Element/compound
The certified reference materials for marine sediment (PACS-2, NRC,
Canada) were used to control accuracy of the analytical method for
sediments. Recovery values found were 101% for sediments (ICRAM,
2005).
Factors
Sand
Pelite
As
Cd
Co
Cr
Cu
Fe
Hg
Mn
Ni
Pb
Sn
Zn
PAH
PCBs
Variance % (Total data)
F1
F2
−0.02
0.75
0.02
0.87
0.40
0.37
0.74
0.53
0.83
0.47
−0.04
0.85
0.85
0.91
0.38
0.10
65.5
0.94
−0.10
−0.52
0.19
0.63
−0.14
0.19
0.59
−0.04
0.17
0.90
0.33
0.11
0.25
−0.03
0.07
34.5
drop left. After purification, the samples were passed through an active
carbon column to separate Dioxins and Furans from PCBs and analyzed
by means of a gas chromatograph equipped with an electron capture
detector (according to EPA Method 8082 (US Environmental Protection
Agency, 1996c) with a detection limit of 0.1 µg/kg for each PCB
congener.
For the evaluation of granulometry, the sediment samples were
prepared following the method of Romano and Gabellini (2001). After
sieving, the finest fraction (<63 μm) was dried at 40 °C and suspended
in a solution with distilled water and sodium hexametaphosphate
(0.05%) to be analyzed with an X ray sedigraph (Micromeritics
Sedigraph 5.100). The coarser fraction (>63 μm) was examined under
a stereo microscope to qualitatively determine the presence of nongeological materials. Granulometry data were expressed as percent of
gravel (>2 mm), sand (2 mm> × > 0.063 mm), silt (0.063 mm> ×
> 0.004 mm), clay (<0.004 mm) and pelite (<0.063 mm), which
includes both silt and clay fractions.
The quality of all data was assessed by estimations of accuracy and
precision. Instrument calibration utilised calibration solutions included
at the beginning and end of an analytical run. Spiking of the digestion
solution with a tracer element controlled internal standardization.
Precision was calculated on in-house replicates. Precision is ±100% at
the detection limits and increases to better than ±10% at concentrations of 50 times the detection limit or higher.
4.2. Statistical analysis and geochemical mapping
Chemical and granulometry data were stored in 7 separate
databases, depending on the sampling depth of the corresponding
sample. In order to show the single-element geochemical distribution, a
detailed univariate analysis was performed on each of produced
databases. A value corresponding to 80% of the instrumental detection
limit (IDL) was assigned to all data reported as below the IDL in order to
allow their inclusion in the statistical analysis. Table 2A and 2B present
all the calculated statistical parameters for each sampling depth.
Maps showing chemical data distributions were generated using the
ArcView™ and GeoDas™ softwares (Cheng, 2003). The multifractal
inverse distance weighted (MIDW) algorithm was used as the
interpolation method to compile the geochemical maps (Cheng, 1999a,
b; Lima et al., 2003) and the C-A (Concentration-Area) method was used
to define concentration intervals on maps (Cheng et al., 1994; Lima et al.,
2003). Intervention maps were also produced reclassifying the interpolated values surfaces using the intervention limits (I.L.) established by the
Italian Environmental Law for sea sediments (Ministero dell'Ambiente e
della Tutela del Territorio, 2003) and for soils (Parlamento Italiano, 2006)
(Table 3). R-mode factor analysis was performed on data produced for
the 0–20 sampling depth, using G-RFAC (Miesch Programs, 1990)
software on a matrix containing 12 elements, 2 organic compounds and
granulometric fraction data for sand and pelite.
In order to facilitate the interpretation of factor analysis results, a
Varimax rotation was applied to minimize the number of variables with
high loadings on each factor. This process simplifies the transformed
data matrix and eases the final interpretation of the data. A two-factor
model which accounts for 56% of data variability was deemed
appropriate for the sea sediments facing the Bagnoli brownfield area
(Table 4) Variables with loadings over 0.5 were considered to describe
quite effectively the composition of each factor. The associations of the
two-factor model are F1: Zn, Cd, Sn, Pb, Hg, pelite, Cu, Fe; F2: Sand, Co,
Fe, Ni, (− As).
5. Results and discussion
Granulometric data reclassified according to Nota (1958) show a
wide spatial variability which is clearly evident in Fig. 5 that also
shows the spatial distribution of granulometric classes for the depth
interval from 0 to 50 cm below the seabed. Sand and pelitic sand are
Table 4
Intervention limits (I.L.) established by Italian Law for soils (D.M. 152/06) (Parlamento Italiano, 2006) band sea sediments (D.M. 367/03) (Ministero dell'Ambiente e della Tutela del
Territorio, 2003). Geochemical background values determined for sea sediment of the Pozzuoli Bay (Damiani et al., 1987) (Column A), for stream sediments on volcanoclastic
deposits (Albanese et al., 2007) (Column B) of Campania region and for neapolitan volcanic soils (Cicchella et al., 2005) (Column C) are reported, where possible.
Element/compound
As (mg/kg)
Be (mg/kg)
Cd (mg/kg)
Co (mg/kg)
Cr (mg/kg)
Cu (mg/kg)
Hg (mg/kg)
Ni (mg/kg)
Pb (mg/kg)
Sn (mg/kg)
Zn (mg/kg)
V (mg/)kg
PCB's (µg/kg)
PAH (mg/kg)
I.L. soils D. Lgs 152/06
Residential use
Industrial use
20
2
2
20
150
120
1
120
100
1
150
90
0.06
10
50
10
15
250
800
600
5
500
1000
350
1500
250
5
100
I.L. sea sediments
D.M. 367/03
A
B
C
Damiani et al., 1987
Albanese et al., 2007
Cicchella et al., 2005
12
–
0.3
–
50
–
0.3
30
30
–
–
–
4
0.2
–
–
–
–
30
20
0.25
20
60
–
80
–
–
–
10.2–13.9
–
0.43–0.69
–
12–28
19–40
0.067–0.2
–
29–51
–
82–156
–
–
–
5–15
–
0.1–0.5
–
5–15
20–120
0.05–0.2
–
30–85
–
–
–
–
–
Author's personal copy
S. Albanese et al. / Journal of Geochemical Exploration 105 (2010) 19–33
Fig. 5. Map of granulometric data distribution in the 0–50 sampling depth interval, reclassified according to Nota (1958).
Fig. 6. Geochemical map of As in sea sediments. Baseline (A) and intervention (B) map for the 0–20 sampling depth.
27
Author's personal copy
28
S. Albanese et al. / Journal of Geochemical Exploration 105 (2010) 19–33
mostly concentrated along the shorelines and in a wide strip oriented
N–S on the southern side of Nisida.
Finer sediments, mostly pelitic with a considerable amount of
sand (decreasing toward the open sea), are concentrated in
proximity to the front side of the filling structure (“Colmata a
mare”), due to the low energy of marine currents locally diverted by
the presence of the two bordering piers and influenced by the
presence of the Nisida promontory. Microscopic observation of the
coarser fraction of sediments sampled in proximity of the “Colmata a
mare” and along the shoreline facing the Bagnoli brownfield site
revealed the presence of a large amount of anthropogenic grains
mostly made of tar and oil residues, blast furnace slag and iron
pellets.
We discuss, in detail, only the distribution of As, Pb and Ni, as these
elements have the most relevance to potential human health issues.
Maps showing the distribution of the balance of studied elements are
given as a file repository (Appendix A).
Arsenic concentration values in the upper sampled layer (0–20 cm)
range between 2.3 and 55 mg/kg (Fig. 6A). Higher concentrations
(>14 mg/kg), as established by the C-A method applied to interpolated
map, show a strong spatial correspondence with the presence of some
submarine thermal springs scattered along a NW–SE axis connected to
the active volcanic field of Campi Flegrei. Lower concentrations (between
2.3 and 14 mg/kg) are mostly concentrated in the sea sediments
facing the “Colmata a mare” and the shorelines of the brownfield site.
In the upper sampled layer (0–20 cm) As I.L. for sea sediments
(12 mg/kg) are exceeded in correspondence with the submarine thermal
springs in the Pozzuoli Bay (Fig. 6B), as well.
Arsenic concentrations decrease in the lower sampled layers
(Table 2A and 2B), probably due to the higher temperatures of the
Fig. 7. Geochemical map of Pb and Ni in sea sediments. Baseline (A, C) and intervention (B, D) maps for the 0–20 sampling depth.
Author's personal copy
S. Albanese et al. / Journal of Geochemical Exploration 105 (2010) 19–33
upwelling thermal fluids limiting the precipitation process. At the 30–
50 cm sampling depth layer, As concentrations range between 1.8 and
26 mg/kg and the I.L. for sea sediments (Ministero dell'Ambiente e della
Tutela del Territorio, 2003) are exceeded in the sediments adjacent to
Nisida. At a 100–120 cm sampling depth layer, As concentration ranges
between 3.3 and 18 mg/kg and I.L. (Ministero dell'Ambiente e della
Tutela del Territorio, 2003) are exceeded only in a small area in front of
the Dazio coastline. In the lower sampled layers, As concentrations are
generally below the I.L. established by the Italian Law (D.M. 367/03)
and only at the 180–200 cm sampling depth a single sea sediment
sample, collected in front of the “Colmata a mare” structure, reached
the concentration of 73.5 mg/kg. Although As concentrations in the
topmost sampling layers tend to exceed the I.L. established by Italian
Law (Ministero dell'Ambiente e della Tutela del Territorio, 2003) for sea
sediments (Fig. 6B), any remediation concerning As would be of little
use in the study area, due to the source of As from natural thermal
springs. This holds true for all other metals associated with thermal
volcanic activity in the Campi Flegrei (De Vivo and Lima, 2008).
Lead concentrations in the upper sampling layer (0–20 cm)
(Fig. 7A), range between 21 and 1765 mg/kg. According to the I.L.
established by the Italian Law (Ministero dell'Ambiente e della Tutela
del Territorio, 2003) for sea sediments (30 mg/kg), almost the entire
study area should undergo remediation (Fig. 7B). The latter condition is
also true for the remaining of the sampled layers (Table 2A and 2B)
since at the 30–50 sampling depth, Pb concentrations range between
50 and 2739 mg/kg; at 100–120 cm sampling depth they range
between 30 and 1131 mg/kg; at the 180–200 cm sampling depth
they range between 25 and 2061 mg/kg; and at the lower sampling
depths (280–300 cm and 380–400 cm) they range, respectively,
between 89 and 755, and 75 and 818 mg/kg . For all sampling layers,
the higher concentrations of Pb in the sea sediments are located in
relation to the “Colmata a mare” structure. Thus, it is reasonable to
assume that the higher Pb concentrations are due probably to the
discharge of the brownfield groundwaters to the sea across the filling
structure.
If dredged sediments from sector 2 were to be reused inland, the
major part could be transferred to an industrial area, in accordance
with I.L. established by Italian law (Parlamento Italiano, 2006) for
industrial land use (<1000 mg/kg); however, only a small part would
be suitable for residential/recreational land use (I.L. < 100 mg/kg)
29
(Fig. 7B) such as the urban park planned to be located in the Bagnoli
brownfield area after its remediation).
The highest concentrations of Ni found in the upper sampled layer
(0–20 cm) (Fig. 7C) are mostly located in sediments sampled on both
the northern and southern side of the “Colmata a mare” structure
occupying the Bagnoli–Coroglio coastline. Values for Ni range between
2 and 177 mg/kg and strict application of the I.L. for sea sediments
(30 mg/kg) (Ministero dell'Ambiente e della Tutela del Territorio,
2003) would require the whole area facing the brownfield to undergo
remediation (Fig. 7D). At the other sampling depths (Table 2A and 2B)
Ni concentrations range respectively between 31 and 280 mg/kg in the
20–30 cm sampling layer, between 21 and 184 mg/kg in the 30–50
sampling layer, between 15 and 157 mg/kg in the 30–50 sampling
layer, between 13 and 171 mg/kg in the 180–200 cm sampling layer,
between 104 and 144 mg/kg in the 280–300 cm sampling layer, and
between 121 and 137 mg/kg in the 380–400 cm sampling layer.
Although Ni concentrations show a general decrease at increasing
depths suggesting the anthropogenic nature of the source, sediments
sampled at lower depths in the area that face the entire Bagnoli–
Coroglio shoreline exceed the I.L. (30 mg/kg) established by Italian Law
for sea sediments (Ministero dell'Ambiente e della Tutela del Territorio,
2003).
Metallic elements in the Bagnoli coastline sea sediments follow
two different distribution patterns, as the two-factor model generated
by the R-mode factor analysis clearly shows (Table 4).
The factor scores of association F1 accounts for 65.5% of total data
variability and show that Zn, Cd, Sn, Pb, Hg, Cu and Fe have a strong
spatial relationship with pelitic sea sediments facing the “Colmata a
mare” structure and the Bagnoli–Coroglio coastline (Fig. 8A). Since the
mobility of metals is generally strongly influenced by adsorption
processes linked to the presence of fine-grain sized sediments, it is very
likely that concentration values of these metals are significantly
increased by the presence of pelite along the wide belt (E–W oriented)
which connects the “Colmata a mare” structure to the open sea (Fig. 5).
In the northern and southern sector of Bagnoli–Coroglio coastline,
the association F2, accounting for 34.5% of total data variability,
apparently correlate the presence of Co, Fe and Ni to the sea sediment
sandy texture (Fig. 8B). Actually this element association is more
influenced by the anthropogenic origin of sands (from tar and oil
residues, blast furnace slag and iron pellets) than by the grain size. The
Fig. 8. Factor score association map for the 0–20 sampling depth.
Author's personal copy
30
S. Albanese et al. / Journal of Geochemical Exploration 105 (2010) 19–33
Fig. 9. Geochemical map of PAHs in sea sediments. Baseline (A, C, E) and intervention (B, D, F) maps, respectively, for the 0–20, 30–50 and 100–120 sampling depths.
Author's personal copy
S. Albanese et al. / Journal of Geochemical Exploration 105 (2010) 19–33
Fig. 10. Geochemical map of PCBs in sea sediments. Baseline (A, C, E) and intervention (B, D, F) maps, respectively, for the 0–20, 30–50 and 100–120 sampling depths.
31
Author's personal copy
32
S. Albanese et al. / Journal of Geochemical Exploration 105 (2010) 19–33
negative loading of As (− 0.52) in this element association also can be
assumed to represent a marker that distinguishes the anthropogenic
nature of these sediments.
PAHs (Fig. 9A, C, and E) and PCBs (Fig. 10A, C, and E) spatial
distribution patterns at the different depths in the sea sediments of
the study area are characterized by the highest concentration values
in sea sediments facing both the “Colmata a mare” structure and the
fossil fuel area located on the north-western sector of the brownfield
site (Sector 2 of the sampling plan) (Fig. 4). PAHs and PCBs are
manmade, hence the logical source for these compounds found in the
sea sediments in our area, are the groundwaters from the brownfield
site. In fact, the groundwater drainage axis goes across the fossil area
and the oil by-product deposits (Fig. 3). In the topmost sampling layer
(0–20 cm) (Fig. 9A) PAHs concentrations range between 0.19 and
2087 mg/kg. The PAHs intervention map for this layer (Fig. 9B) clearly
show that the whole study area should undergo remediation
according to I.L. (0.2 mg/kg) established by Italian Environmental
Law for sea sediments (Ministero dell'Ambiente e della Tutela del
Territorio, 2003). Reuse of dredged sediments in residential or
industrial areas with respect to the I.L. established by Italian
Environmental Law (Parlamento Italiano, 2006) is unfeasible, since
the sea sediments nearby the coastline (Sector 2, Fig. 4) are
characterized by PAHs concentrations >100 mg/kg (Fig. 9B). This is
true also for the 20–30 cm, 30–50 cm (Fig. 9C), 100–120 cm (Fig. 9E)
and 180–200 cm depth sampling layers. In all these layers in most of
Sector 2 the I.L. (10 mg/kg) for a potential inland reuse in residential
areas (Parlamento Italiano, 2006) of sea sediments are generally
exceeded, as shown for both the 30–50 cm depth (Fig. 9D) and the
100–120 cm depth sampling layers (Fig. 9F), even though a general
decrease of concentrations occurs (Table 2A and 2B). PAHs concentrations in the 280–300 cm and the 380–400 cm depth sampling
layers range between 0.1 and 8.4 mg/kg and between 0.1 and
6.4 mg/kg, respectively (Table 2A and 2B), not exceeding the I.L.
established by Italian Law for a potential inland reuse (residential or
industrial) (Parlamento Italiano, 2006) (Table 3) of sea sediments.
PCBs concentrations range between 1.2 and 5897 μg/kg in the upper
sampling layer (0–20 cm) (Fig. 10A). The intervention map for this
layer (Fig. 10B) shows that the whole study area should undergo
remediation regardless of the I.L. established for sea sediments (4 μg/kg)
(Ministero dell'Ambiente e della Tutela del Territorio, 2003), for soil
residential (0.06 μg/kg) or industrial land use (5 μg/kg) (Parlamento
Italiano, 2006). In the 20–30 cm depth, 30–50 cm depth (Fig. 10C and D),
100–120 cm depth (Fig. 10E and F) and 180–200 cm depth sampling
layers, sea sediments in Sector 2 (Fig. 4) are characterized by PCBs values
higher than 5 μg/kg and must undergo remediation since they are not
suitable even for an industrial inland reuse. PCBs concentrations in the
280–300 cm depth and in the 380–400 cm depth sampling layer range
between 0 and 3.6 μg/kg and between 0.1 and 1 μg/kg, respectively. I.L.
established for sea sediments by Italian Law (Ministero dell'Ambiente e
della Tutela del Territorio, 2003) are not exceeded for these levels.
The physical transport processes of wind or human activities of
metallic slag and production scoria particles from the inland towards
the coastline plays an important role in sediment contamination related
to Co, Fe and Ni distribution.
Sea sediments closer the Bagnoli–Coroglio coastline are generally
more contaminated than the open sea sediments. They are characterized by concentration values of metals and organic compounds
exceeding not only the I.L. established for sea sediment (Ministero
dell'Ambiente e della Tutela del Territorio, 2003) but also the I.L. for
soils (Parlamento Italiano, 2006), excluding a potential inland reuse in
residential and industrial areas.
Although metallic elements have been proven to be enriched in
groundwaters from hydrothermal sources occurring both in the
brownfield site and in the sea shelf facing the brownfield site (De
Vivo and Lima, 2008 and ref. therein), contamination of sea sediments
by PAHs and PCBs has to be ascribed solely to the past industrial
activities in the Bagnoli–Coroglio area.
Generic Hazard Quotient (HQ) (maximum measured pollutant
concentration divided by a selected reference value representing the
predicted “no effect concentration”) has been calculated for As, Cd,
Cr, Hg, Ni, Pb, PAHs and PCBs in seabed sediments (0–20 sampling
depth) (Table 5) with the aim of performing an Ecological Risk
Assessment (ERA). ERA evaluates the possibility and the grade of
occurrence of adverse ecological effects due to environmental
contamination with the purpose of protecting populations and
communities belonging to different species (Campbell and Bartell,
1998; Khairy et al., 2009).
I.L. established for sea sediments by Italian law (Ministero
dell'Ambiente e della Tutela del Territorio, 2003) were assumed as
predicted “no effect concentrations” (PNEC) (Maggi et al., 2007).
Result obtained showed that the Bagnoli brownfield site coastal sea
sediments are always characterized by HQ> 1 up to the remarkable
values of 14,737 and 1666 respectively for PAHs and PCBs.
Since the higher the HQ, the more frequent adverse ecological
effects are expected, a remediation project should be planned for the
PAHs and PCBs found in the sea sediments facing the coastline, since the
area in the summer time is crowded by family and children. This area
should be closed to any bathing activity until a recovery of the entire
area is completed.
Removal of contaminated sediments from the seabed down to a
depth of 2 m, only from the area closer to the Bagnoli–Coroglio
coastline (Sector 2, Fig. 4) could be considered as a solution. This
operation would require dredging and moving a volume of
1,660,000 m3 of material. After removal, the contaminated sediments
should either undergo remediation or be stored indefinitely in a special
waste depository. The option of inland reuse of dredged sediments is
not be feasible because of the very high PAHs and PCBs contamination
levels.
Before any action is taken to remediate the sea sediments it is
necessary to check the permeability/impermeability conditions of the
“Colmata a mare” structure and to check the release of organic
6. Conclusions
In the studied area, metallic elements, some potentially harmful (Al,
As, Be, Cd, Co, Cr, Fe, Hg, Mn, Ni, Pb, Cu, Sn, V, and Zn), and organic
(PAHs and PCBs) compounds in sea sediments are characterized by
high concentration values that exceed both local and regional
geochemical backgrounds and, in most cases, I.L. established by Italian
Law (Ministero dell'Ambiente e della Tutela del Territorio, 2003) for sea
sediments (Table 4).
Except for As (mostly introduced in the environment by submarine
thermal springs), metallic elements and organic compounds (PAHs and
PCBs) are brought to the sea by the discharge of the brownfield
groundwaters across the “Colmata a mare” structure facing the
brownfield site.
Table 5
Ecological hazard quotient (HQ) calculated for seabed sediments (0–20 sampling depth)
assuming as reference value for the “no effect concentration” (PNEC) Intervention Limits
(I.L.) established by Italian Law D.M. 367/03 (Ministero dell'Ambiente e della Tutela del
Territorio, 2003).
Element/compound
PNEC I.L. sea sedimets
Max (Depth 0–20 cm)
HQ
As (mg/kg)
Cd (mg/kg)
Cr (mg/kg)
Hg (mg/kg)
Ni (mg/kg)
Pb (mg/kg)
PAH (mg/kg)
PCB's (µg/kg)
12
0.3
50
0.3
30
30
0.2
4
55
7.4
103
3.5
181
1773
2947
6665
4.5
25
2.1
11.5
6
59
14,737
1666
Author's personal copy
S. Albanese et al. / Journal of Geochemical Exploration 105 (2010) 19–33
pollutants (PAHs and PCBs) from the fossil and oil by-product area of
the brownfield site to the underlying groundwaters.
Appendix A. Supplementary data
Supplementary data associated with this article can be found, in
the online version, at doi:10.1016/j.gexplo.2010.01.007.
References
Albanese, S., Cicchella, D., De Vivo, B., Lima, A., 2007. Geochemical background and
baseline values of toxic elements in stream sediments of Campania region (Italy).
J. Geochem. Explor. 93, 21–34.
Armienti, P., Barberi, F., Bizouard, H., Clocchiatti, R., Innocenti, F., Metrich, N., Rossi, M.,
Sbrana, A., 1983. The Phlegraean Fields: magma evolution within a shallow magma
chamber. J. Volcanol. Geotherm. Res. 17, 289–311.
Bieber, A., 2000. CLARINET——the Contaminated Land Rehabilitation Network for
Environmental Technologies in Europe. Policy: Contaminated Land Approaches in
16 European Countries. Germany (http://www.clarinet.at/).
Campbell, K.R., Bartell, S.M., 1998. Ecological models and ecological risk assessment. In:
Newman, M.C., Trojan, C.L. (Eds.), Risk Assessment: Logic and Measurement. Ann
Arbor Press, Chelsea, Michigan, USA, pp. 69–100.
Celico, P., Habetswallner, F., 1999a. Prime considerazioni idrogeologiche sull'area dell'ex
Ilva di Bagnoli. Società Bagnoli S.p.A., Napoli.
Celico, P., Habetswallner, F., 1999b. Considerazioni idrogeologiche sull'area dell'ex Ilva
di Bagnoli. Società Bagnoli S.p.A., Napoli.
Celico, P., Habetswallner, F., 2000. Problematiche idrogeologiche relative all'area di
colmata. Sintesi dei risultati delle indagini e soluzioni progettuali per la messa in
sicurezza. Società Bagnoli S.p.A., Napoli.
Cheng, Q., 1999a. Multifractality and spatial statistics. Comput. Geosci. 25 (10), 946–961.
Cheng, Q., 1999b. Spatial and scaling modelling for geochemical anomaly separation.
J. Geochem. Explor. 65 (3), 175–194.
Cheng, Q., 2003. GeoData Analysis System (GeoDAS) for Mineral Exploration and
Environmental Assessment, User's Guide (GeoDAS Phase III). York University,
Toronto, Ontario, Canada.
Cheng, Q., Agterberg, F.P., Ballantyne, S.B., 1994. The separation of geochemical
anomalies from background by fractal methods. J. Geochem. Explor. 51, 109–130.
Cicchella, D., De Vivo, B., Lima, A., 2005. Background and baseline concentration values
of elements harmful to human health in the volcanic soils of the metropolitan and
provincial area of Naples (Italy). Geochem. Explor. Environ. Anal. 5, 29–40.
CIPE (Comitato Interministeriale per la Programmazione Economica), 1994. Delibera n.
145 del 20/12/1994. Provvedimenti attuativi per il Piano di Sviluppo Triennale della
Campania (Legge n. 80/849).
Cocco, E., De Magistris, M.A., De Pippo, T., 1988. Distribuzione e dispersione dei sedimenti
nella piattaforma costiera del golfo di Pozzuoli. Mem. Soc. Geol. It. 41, 983–993.
Damiani, V., Baudo, R., De Rosa, S., De Simone, R., Ferretti, O., Izzo, G., Serena, F., 1987. A
case study: Bay of Pozzuoli (Gulf of Naples, Italy). Hydrobiologia 149, 210–211.
De Pippo, T., Pescatore, T., Vecchione, C., 1988. Caratteri granulometrici dei sedimenti
dei terrazzi del golfo di Pozzuoli. Mem. Soc. Geol. It. 41, 1005–1014.
De Vivo, B., Lima, A., 2008. Characterization and remediation of a brownfield site: the
Bagnoli case in Italy. In: De Vivo, B., Belkin, H.E., Lima, A. (Eds.), Environmental
Geochemistry: Site Characterization, data Analysis and Case histories. Elsevier,
pp. 355–385.
Di Girolamo, P., 1978. Geotectonic setting of Miocene–Quaternary volcanism in and
around the eastern Tyrrhenian sea border (Italy) as deduced from major element
geochemistry. Bull. Volcanol. 41, 229–250.
Edelgaard, I., Dahlström, K., 1999. Denmark. In: Ferguson, C., Kasamas, H. (Eds.), Risk
Assessment for Contaminated Sites in Europe, vol. 2. Policy Frameworks. LQM
Press, Nottingham, UK, pp. 29–39.
33
ICRAM, 2005. Caratterizzazione ambientale dei fondali e degli arenili inclusi nella
perimetrazione del sito di bonifica di Bagnoli–Coroglio.
Khairy, M.A., Kolb, M., Mostafa, A.R., EL-Fiky, A., Bahadir, M., 2009. Risk assessment of
polycyclic aromatic hydrocarbons in a Mediterranean semi-enclosed basin affected
by human activities (Abu Qir Bay, Egypt). J. Hazard. Mater. 170, 389–397.
Lima, A., De Vivo, B., Cicchella, D., Cortini, M., Albanese, S., 2003. Multifractal IDW
interpolation and fractal filtering method in environmental studies: an application on
regional stream sediments of Campania region (Italy). Appl. Geochem. 18,
1853–1865.
Maggi, C., Onorati, F., Virno Lamberti, C., Cicero, A.M., 2007. The hazardous priority
substances in Italy: national rules and environmental quality standard in marine
environment. Environ. Impact Assess. Rev. 28, 1–6.
Miesch Programs, 1990. G-RFAC. Grand Junction, CO, USA.
Ministero dell'Ambiente e della Tutela del Territorio, 2001. D.M. 31/08/2001. Perimetrazione del sito di interesse nazionale di Bagnoli–Coroglio. Gazzetta Ufficiale della
Repubblica Italiana n. 250 del 26 Ottobre 2001.
Ministero dell'Ambiente e della Tutela del Territorio, 2003. D.M. 06/11/2003, n. 367.
Regolamento concernente la fissazione di standard di qualità nell'ambiente acquatico
per le sostanze pericolose, ai sensi dell'articolo 3, comma 4, del decreto legislativo 11
maggio 1999, n. 152. Gazzetta Ufficiale della Repubblica Italiana n. 5 del 08 Gennaio
2004.
Nota, D.J.G., 1958. Sediments of western Guiana shelf. Report of Orinoco shelf expedition,
2 Landbomvhogedrool, Wegeningen, 58, 98 pp.
Parlamento Italiano, 2000. Legge 23 Dicembre 2000, n. 388. Disposizioni per la formazione
del bilancio annuale e pluriennale dello Stato (legge finanziaria 2001). Gazzetta
Ufficiale della Repubblica Italiana n. 302, Supplemento Ordinario n. 219, del 29
dicembre 2000.
Parlamento Italiano, 2006. Decreto Legislativo 3 Aprile 2006, n. 152. Norme in materia
ambientale. Gazzetta Ufficiale della Repubblica Italiana n. 88, Supplemento Ordinario
n. 96, del 14 Aprile 2006.
Peccerillo, A., 1985. Roman comagmatic province (Central Italy): evidence for subductionrelated magma genesis. Geology 13, 103–106.
Quercia, F., 2001. CLARINET—the Contaminated Land Rehabilitation Network for
Environmental Technologies in Europe. Policy: Contaminated Land Approaches in
16 European Countries. Italy (http://www.clarinet.at/).
Romano, E., Gabellini, M., 2001. Analisi delle caratteristiche granulometriche —
Sedimenti, scheda 3. In: Cicero, A.M., Di Girolamo, I. (Eds.), Metodologie Analitiche
di Riferimento del Programma di Monitoraggio per il controllo dell'ambiente
marino costiero (triennio 2001–2003). Ministero dell'Ambiente e della Tutela del
Territorio, ICRAM.
Sharp, W.E., Nardi, G., 1987. A study of the heavy metal pollution in the bottom
sediments at Porto di Bagnoli (Naples), Italy. J. Geochem. Explor. 29, 49–73.
Tarzia, M., De Vivo, B., Somma, R., Ayuso, R.A., McGill, R.A.R., Parrish, R.R., 2002.
Anthropogenic vs. natural pollution: an environmental study of an industrial site
under remediation (Naples, Italy). Geochem. Explor. Environ. Anal. 2, 45–56.
US Environmental Protection Agency, 1986. SW-846 EPA Method 8310, Polinuclear
Aromatic Hydrocarbons. Test Methods for Evaluating Solid Waste, 3rd Edition, 3rd
Update. US-EPA, Washington DC, USA.
US Environmental Protection Agency, 1996a. Soil Screening Guidance: Technical
Background Document, 9355.4-17A, EPA/540/R-95/128, PB96- 963502. Office of
Emergency and Remedial Response, US Environmental Protection Agency, Washington, DC.
US Environmental Protection Agency, 1996b. SW-846 EPA Method 3052, Microwave
assisted acid digestion of siliceous and organically based matrices. Test Methods for
Evaluating Solid Waste, 3rd Edition, 3rd Update. US-EPA, Washington DC, USA.
US Environmental Protection Agency, 1996c. SW-846 EPA Method 8082, Polychlorinated Biphenyls (PCBs) by Gas Chromatography. Test Methods for Evaluating Solid
Waste, 3rd Edition, 3rd Update. US-EPA, Washington DC, USA.
Washington, H.S., 1906. The Roman Comagmatic Region. Carnegie Inst. Of Washington,
vol. 57, p. 199.
© Copyright 2026 Paperzz