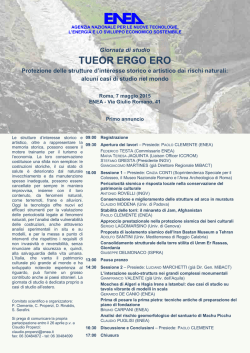
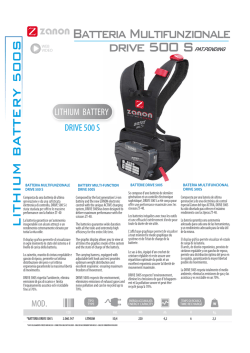
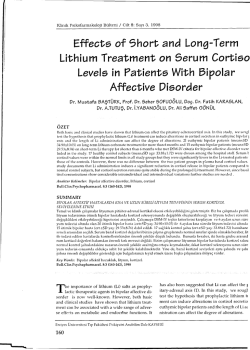
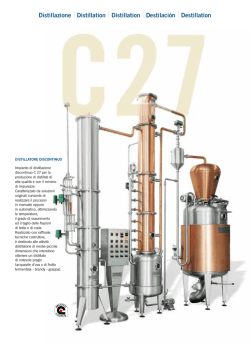
Agenzia nazionale per le nuove tecnologie, l’energia e lo sviluppo economico sostenibile MINISTERO DELLO SVILUPPO ECONOMICO Rapporto sulla procedura offline di analisi chimica della concentrazione di azoto in litio Paolo Favuzza Andrea Antonelli Report RdS/2013/126 RAPPORTO SULLA PROCEDURA OFFLINE DI ANALISI CHIMICA DELLA CONCENTRAZIONE DI AZOTO IN LITIO Paolo Favuzza (UTIS-CPM, ENEA Firenze) Andrea Antonelli (UTIS-CPM, ENEA Brasimone) Settembre 2013 Report Ricerca di Sistema Elettrico Accordo di Programma Ministero dello Sviluppo Economico - ENEA Piano Annuale di Realizzazione 2012 Area: Produzione di energia elettrica e protezione dell’ambiente Progetto: Attività di fisica della fusione complementari a ITER Obiettivo: Fornitura ed implementazioni comuni per sperimentazioni di corrosione ed erosione per IFMIF – Fornitura ed implementazioni comuni per la qualifica del sistema di purificazione del litio per IFMIF Responsabile del Progetto: Ing. Aldo Pizzuto, ENEA Si ringrazia il Dipartimento di Chimica “Ugo Schiff” dell’Università degli Studi di Firenze per il supporto fornito nell’analisi cromatografica (IC-HPLC) di soluzioni di ione Ammonio, nelle persone della dott.ssa Rita Traversi e del dott. Mirko Severi Indice SOMMARIO ......................................................................................................................................................................... 4 1 INTRODUZIONE .......................................................................................................................................................... 5 2 DESCRIZIONE DELLE ATTIVITÀ SVOLTE E RISULTATI ................................................................................................... 6 2.1 2.2 2.3 2.4 2.5 2.6 2.7 2.8 SAMPLING OF LITHIUM FROM LIFUS 6 PLANT ............................................................................................................... 6 TRANSFER OF LITHIUM FROM THE SAMPLER TO THE GLASS APPARATUS FOR THE CHEMICAL REACTION ..................................... 7 THE CHEMICAL REACTION AND THE NITROGEN DETERMINATION ...................................................................................... 8 + QUANTITATIVE CONSIDERATIONS ON THE EXPECTED NH4 CONCENTRATION .................................................................... 10 OPTIMIZATION OF THE IC-HPLC TECHNIQUE ............................................................................................................. 10 FIRST DISTILLATION EXPERIMENTS ............................................................................................................................ 11 NEXT STEPS TO PERFORM ....................................................................................................................................... 13 REPRODUCIBILITY CONSIDERATIONS AND ROUND ROBIN ANALYSIS ................................................................................. 13 3 CONCLUSIONI ........................................................................................................................................................... 14 4 RIFERIMENTI BIBLIOGRAFICI .................................................................................................................................... 15 5 ABBREVIAZIONI ED ACRONIMI ................................................................................................................................. 15 3 ACCORDO DI PROGRAMMA MSE-ENEA Sommario This document deals with the chemical analysis procedure employed to quantify the concentration of Nitrogen in the Lithium flowing inside Lifus 6 plant. This procedure is of fundamental importance, since Nitrogen impurities contained inside Lithium strongly enhance the corrosive behavior of Lithium itself and affect the outcome of the related corrosion-erosion experimental tests: the check of the Nitrogen concentration is therefore mandatory, both before starting the tests and during the whole experimental campaign. The adopted procedure provides offline, discontinues values of Nitrogen concentration, in fact requires sampling of Lithium from the plant and batch analysis on it. The document details all the steps which compose the procedure: sampling of Lithium, with the description of the design and the functioning of the employed samplers; transferring of Lithium, in safety conditions, from the sampler to the apparatus for the chemical transformation; the chemical reaction which allows to completely convert all the Nitrogen into Ammonia (NH3); the distillation of the produced Ammonia leading to a diluted Ammonium ion (NH4+) water solution; the quantitative determination of the Ammonium ion concentration, via the ionic chromatography technique. This last step, differently from all the previous ones (performed by ENEA staff in the Brasimone research centre), is executed by the Chemistry Department of the University of Firenze (I), with whom a collaboration has been activated. The optimization of the procedure is also subject of this report. The chromatographic technique has been investigated for its intrinsic precision and accuracy; the effect of possible additional impurities (contained in the chemical reactants, in the atmosphere, in the glassware apparatus….) has been examined; the experimental settings for the optimal distillation process have been searched for. Up to now, the results obtained in each single phase are encouraging and suggest a meaningful application of the procedure. This optimization is anyway far to be complete, since other aspects require further inspection. A complete validation of the overall procedure will be possible only in the next months, when a dedicated glovebox will be available in ENEA lab for the Lithium safe handling and when many more quantitative results will be achieved and correlated. To this extent, it has been also envisaged to compare the Nitrogen concentration results independently got by ENEA and JAEA (Japanese Atomic Energy Agency) on the same kind of Lithium sample, each institute employing its own laboratory and its own specific procedure: a good agreement could prove the soundness of both the procedures, a bad one could anyway indicate in which direction improve them. The activities above reported have been carried out during the PAR 2012. 4 1 Introduzione Lifus 6 plant, the revised version of Lifus 3, is a plant aimed at the evaluation of materials resistance to the erosion-corrosion mechanism exerted by flowing liquid Lithium. This experimental investigation constitutes one of the validation activities underlying the future IFMIF facility (EVEDA phase of the IFMIF project, which is part of the Broader Approach). ENEA is in charge of the design and construction of Lifus 6 plant, as well as the execution of the erosion-corrosion tests, in its research centre of Brasimone. At the moment, the plant realization is almost complete; its commissioning within two months; the corrosion tests in December. One of the fundamental requisites of these tests is the high purity degree of the flowing liquid Lithium: the presence of non metals impurities in fact (Carbon, Oxygen, Hydrogen and particularly Nitrogen [1,2]), in the form of anions solved by Lithium, greatly enhances the corrosion behavior of the liquid metal. For this reason, Lifus 6 plant must also be equipped with solutions and devices able to perform the purification of the liquid Lithium, so to reduce non metals concentration as close as possible to IFMIF requirement ( 10 wppm). Clearly, it is in parallel necessary to be able to determine the real value of concentration in Lithium of these elements, to guarantee the target degree of purity has been actually achieved and kept during the tests. The evaluation of Nitrogen concentration is made possible by a specific chemical analysis performed on a small ( 1 g) Lithium sample taken from the plant. For this reason, two Lithium samplers have been introduced inside Lifus 6. Operating in safety conditions (inside a glove box, excluding the metal contact with air), the Lithium taken from the plant is involved in a chemical reaction which provides the opportunity to determine its Nitrogen content as Ammonium Ion through a Chromatographic Analysis. Therefore, the analysis delivers an offline result, not continuous, but at time spans which are defined by the operator, according to the overall validation procedure of the purification system (subject of “Rapporto sulla validazione del sistema di purificazione del litio all’interno di Lifus 6 e del sistema di monitoring online di tali impurezze”, Rds/2013) and to the possible need of occasional checks during the experimental corrosion tests. To this end, it is important to underline that the offline chemical analysis has to integrate with the online answer of the Resistivity Meter. This device, even if not very sensitive in quantitative terms to impurities concentrations and not chemically specific to Nitrogen, has to advantage of providing a continuous output and, once calibrated, is able to indicate if the impurities level has increased [3]: in this case, a new sampling of Lithium is required, followed by an offline chemical analysis to precisely check the real value of Nitrogen concentration. 5 ACCORDO DI PROGRAMMA MSE-ENEA 2 Descrizione delle attività svolte e risultati 2.1 Sampling of Lithium from Lifus 6 plant The first step of the offline chemical analysis is the sampling of a small amount of Lithium from Lifus 6 plant. In order to accomplish this action, Lifus 6 sampling has been equipped with two different samplers. The first one is located in a bypass of the purification loop, which is a secondary loop (devoted to the purification purpose) working in parallel with the main loop, as illustrated in Figure 1 below. Figure 1: 3D design of Lifus 6 dedicated “purification loop”. The sampler (red) is in position 15. The purification loop is connected to main loop in correspondence of position 1 and 13; Lithium flow from position 1 to position 13. Pneumatic valves (9) in the bottom branch are closed during normal operations, so the pipe between them (blue + red pipe) is prevented from liquid metal circulation and is kept empty; only at the time of sampling, these valves are opened and the inner pipe is filled by the flowing Lithium. After closing the valves, the pipe is then cooled to about room temperature (Lithium solidifies) and the red U-tube (15), characterized by an inner volume of about 25 mL, is disconnected from the rest of pipe through the T-Svagelok joints (22). Once removed, the sampler is replaced by a similar one. The presence of T-joints (22) both upstream and downstream of the sampler, instead of simple Svagelok joints, allows to interface to a pump and hence to evacuate the new sampler, before the circuit is reopened at the time of the next sampling. 6 This sampling points is employed for taking Lithium directly from the plant, to monitor Lithium that is circulating in normal operative conditions (350°C, 15 m/s) inside the plant. As previously mentioned, a second, additional sampler, is employed too; its design is shown in Figure 2. The sampler, initially hosting a known Argon pressure (the top pipe is linked to a gas line), is then filled by Lithium from the bottom pipe by raising the external pressure. The subsequent decrease of the external pressure produces the reverse effect, emptying the sampler, a part from the Lithium that remains trapped in the annular volume around the bottom pipe. Once closed the valves upstream of both the two pipes and cooled the sampler to about room temperature, it is possible to detach it: this way, no Lithium will remain exposed to atmosphere, nor in contact with the external valves. Figure 2: design of the new (additional) sampler for taking Lithium from Lifus 6 Differently from the first sampler, this second sampler is directly connected to the Hot Trap (outside the Lifus 6 loop), so to check the outcome of a just performed purification, without having to refill the plant with Lithium, and eventually to repeat the purification step, until the Nitrogen content matches the desired value. 2.2 Transfer of Lithium from the sampler to the glass apparatus for the chemical reaction The second step of the offline chemical analysis procedure is the transfer of Lithium from the sampler to the glass apparatus. Both in case we are transferring from sampler 1 and from sampler 2, since Lithium is in solid state and hence very sticky, it is necessary, for an easy and fast removal, to raise again its temperature so to produce its melting and its passage to the liquid state. The operation must be conducted carefully, employing a glovebox filled with Argon to avoid the contact of Lithium with the external atmosphere (Oxygen and Nitrogen), both for safety and contamination troubles. The sampler is heated through electrical wires above Lithium melting point, and the liquid Lithium is quickly poured in an empty glass flask (volume = 500 mL, equipped with two or three necks), in turn heated to at 7 ACCORDO DI PROGRAMMA MSE-ENEA least 100-150°C (if hot melted Lithium was put in contact with quartz at room temperature, the risk of quartz cracking or breaking would be substantial). The exact mass of Lithium transferred may be evaluated by weighing by difference. Once the flask (and Lithium inside) has come back to room temperature, it is closed with stopcock adapters and transferred inside the chemical hood, for its connection to the whole apparatus for the chemical transformation (shown in Figure 3 and Figure 4). This apparatus has been arranged in a lab close to Lifus 6 room. 2.3 The chemical reaction and the Nitrogen determination Lithium inside the glass flask has to be analyzed for its Nitrogen concentration (Nitrogen is actually in the form of Li3N, Lithium Nitride) [4,5]. For this reason, the flask is joined to both an inlet for Argon gas (left neck in Fig. 3) and to a dropping funnel (central neck). Operating under an Argon atmosphere, demineralized water is slowly added to Lithium from the above dropping funnel, paying attention to the possible violence of the reactions. The main reactions which take places are: 2 Li + 2H2O 2 LiOH + H2 Li3N + 3H2O 3 LiOH + NH3 A part from the formation of large H2 volumes, the important aspect is that all the Nitride is converted into Ammonia (NH3). Under an Argon flow, the Ammonia is distilled away (exiting from the right neck in Fig.3) and then quantitatively collected into a water solution of Boric Acid (H3BO3) in excess, transforming into the stable Ammonium (NH4+) ion. The NH4+ concentration in the obtained solution is finally evaluated by IC-HPLC (Ionic ChromatographyHigh Performance Liquid Chromatography), a rather fast and simple determination and with a relative precision of some %, taking into account that the absolute amount of Nitrogen so determined corresponds quantitatively to the total amount of Nitrogen inside the starting Lithium sampled from the plant. Thanks to the high sensitivity of this chromatographic technique, is it possible to measure down to few wppm of Nitrogen in the starting Lithium. Figure 3: Scheme of the apparatus for the production and distillation of NH 3 (MFC: Mass Flow Controller) 8 The HPLC analysis is not performed inside ENEA Brasimone laboratory, but it is performed by the Chemistry Department of the University of Firenze (I), with which a collaboration has been activated. The investigated Ammonium solutions can in fact be easily handled (they are diluted water solutions, which don’t contain Lithium or other hazardous agents), therefore they are delivered to the University in closed glass vessels and analyzed within 1 day. Figure 4 shows the real apparatus employed in ENEA laboratory for the described chemical reaction. Figure 4: glassware apparatus for the offline chemical analysis of sampled Lithium, inside the chemical hood. In respect to scheme depicted in Fig.3, a slight improvement is present: the main flask (holding the sampled Lithium) is equipped with only two necks, not three. With this arrangement, the Argon gas enters the flask from the top of the dropping funnel, passing through a lateral channel of the funnel, which allows a continuous flow, even with the stopcock closed. This way, also the atmosphere above the water inside the funnel is constituted by Argon, hence the amount of Nitrogen and Oxygen solved in the added water is minimized. The teflon pipe, supplying the Argon and hosting also a pressure gauge, is visible on the left side of the hood; the flow is regulated by a digital Mass Flow Controller. Thanks to the pressure gauge, it is possible to verify all the seals of the glassware plant: after setting an internal Argon static pressure of 1.5 bar (by closing all the teflon stopcocks), if no pressure loss is detected with time, no leak is present. This even more so excludes air entering from outside. This check has to be done each time, after assembling all the parts of 9 ACCORDO DI PROGRAMMA MSE-ENEA the plant, before the start of the chemical reaction: if no leak is detected, Argon pressure inside may be brought back to room pressure by reopening all the stopcocks along the gas line and the addition of water may starts. 2.4 Quantitative considerations on the expected NH4+ concentration With the instrumental setting selected, the IC-HPLC gives the best results if the NH4+ concentration of the analyzed solution doesn’t exceed the value of few ppm. A NH4+ concentration > 5 ppm could in fact introduce a rather large error in the data analysis, due to a significant deviation from the fitting curve employed to calibrate the experimental measurements. On the other side, it’s better not to reduce NH4+ concentration below 0.1 ppm, otherwise the effect of even minimal external impurities (due to NH3 or NH4+ present in the atmosphere, in the glass apparatus, in water or in boric acid…) or imprecise human operator may introduce an error which is large in relative terms. For this reason, it is important to adjust the amount of Lithium reacted and the volume of the final solution, so to get a Nitrogen Concentration falling approximately within this range (0.1-5 ppm). Let’s consider to fix the volume of the final (analyzed) NH4+ solution to 250 mL; according to the desired NH4+ concentration range, NH4+ mass in this solution should be in the range: (0.1-5)*0.250 = (0.025 – 1.25) mg, which corresponds to a starting Nitrogen mass of (0.020 – 1.00) mg. If the Nitrogen concentration in the sampled Lithium was 1500 wppm (very high value, corresponding to the solubility of Nitrogen at 200°C, the Cold Trap temperature), the amount of Lithium to react should be in the range of (0.020 – 1.00) / 1.5 (0.013 – 0.67) g. Conversely, if Nitrogen concentration in the starting Lithium was 30 wppm (a low value, corresponding to the target purity degree for the corrosion tests), the required amount of reacted Lithium should fall in the range (0.020 – 1.00) / 0.03 (0.067 - 33)1 g. Therefore, it appears that the reaction with water of 1g of Lithium is able to produce a suitable value of final NH4+ concentration in almost all cases of Nitrogen impurity in Lithium: 1g of Lithium could be hence considered a reference value for the chemical reaction. Clearly, if this value produced a final NH4+ concentration too high/too low, it would be possible to repeat the chemical transformation and the following chromatographic analysis employing respectively a small/larger Lithium mass. In case of slightly large NH4+ concentration, it is also possible, for time opportunity, to perform only a prior dilution of the final solution, to lower it at the optimal value, and analyze it again, even if we must be aware that this operation (dilution) may introduces an additional error in the result of the analysis. 2.5 Optimization of the IC-HPLC technique In order to get meaningful results from the IC-HPLC analysis, a preliminary investigation of the intrinsic precision and accuracy of the technique has been performed. NH4Cl water solutions characterized by exactly known values of concentration (NH4+ standard solutions), up to 3.3 ppm, have been prepared in the University laboratory and directly analyzed through IC-HPLC. The experimental points (conductivity, which is output of the instrument detector, vs concentration), together with the best fitting curve, are reported in Figure 5. Results show a relative error 3.6% in the range of NH4+ concentration 0.1 - 3.3 ppm. 1 In any case, it is not possible to react more than 10-12 g of Lithium, corresponding to the total mass of Lithium filling the sampler (both 1 and 2). 10 + Figure 5: experimental points, relating known NH4 concentrations (STD) with their measured conductivity values, together with the best fitting curve Similar standard samples have been prepared in ENEA laboratory, adding also a variable Boric Acid amount, to reproduce the conditions of the samples at the end of the distillation. Results (in case of H3BO3concentration = 4g/L in the final solution to analyze) show a relative error < 5% in the range of NH4+ concentration (0.1-5) ppm, with a good reproducibility (Standard Deviation = 0.3%). Better precision, especially for less concentrated samples, is obtained employing a fitting curve replicating the «matrix», i.e. constructed with standards containing the same demineralized water and the same amount of H3BO3 of the samples, since it has been observed that the impurities present in 4g/L of commercial H3BO3 introduce 24 ppb of NH4+ in the analyzed solution. The optimization of the chromatographic analysis is anyway still ongoing, in order to minimize as much as possible the intrinsic error of the analysis as well as all any other source of Ammonium, a part from what is actually coming from Lithium. To this end, the possible limitation of Boric Acid quantity necessary to quantitatively block the condensed Ammonia is under investigation; a different, purer commercial Acid Boric could be employed; a different, purer commercial NH4Cl could be employed too, in order to get more precise information from the standards; the instrumental settings of the chromatographic instrument (mainly the volume of solution injected inside it) may be changed. 2.6 First distillation experiments The next step in the route to the optimization of the overall procedure is the study of the distillation process and the analysis of samples obtained after the distillation. First of all, a distillation experiment of water alone has been performed, in order to find out the best experimental setting for the process. About 250 mL of demineralized water have been dropped in the main flask (bottom left of the apparatus shown in Figure 4) from the above dropping funnel; the flask was empty, with no Lithium inside. Under an Argon flow of 60 mL/min and setting the heating power of the mantle to 7 on its graduate 1-9 scale (corresponding to a temperature of its internal heating element of 275°C), it was possible to produce the distillation of about 100 mL of water in about 50 minutes, collecting them into 90 mL of a 20g/L Boric Acid solution. The final 190 mL solution was then diluted to 250 mL and analyzed through the ionic chromatography, giving as result a NH4+ concentration value of about 30 ppb. Since the NH4+ concentration was instead < 3 ppb in the starting water, it appeared that the distillation process 11 ACCORDO DI PROGRAMMA MSE-ENEA produced a little increase in NH4+ concentration. Some other inspection will be conducted in next future in order to assess if this increase in NH4+ concentration (even if not large, in absolute terms) may be ascribed to just a little mistake in the analysis or the operator, or actually reflects some Ammonia impurity collected during the distillation process, due for instance to a not perfectly clean glassware, or to the hood atmosphere. Employing the same settings (for the Argon flow and the heating element temperature), the distillation of Ammonia solutions has been then conducted. Up to now, since the glovebox is not available yet in ENEA Brasimone Centre (its delivery is scheduled by the half of September) and the handling of Lithium is hence not possible, we produced the Ammonia solutions not by reaction of Lithium with water (as explained in section 2.3), but replacing it with the reaction of NH4Cl with Sodium Hydroxide (NaOH). Three experiments were performed, characterized by different values of Nitrogen concentration in the starting solution: 3.5 ppm, 2 ppm and 1 ppm. In all these experiments, 100 mL of NH4Cl water solution having the proper concentration value have been putted inside the distilling flask; 150 mL of NaOH 1M2 have been dropped slowly from the above funnel, quantitatively transforming NH4+ into NH3; NH3 has been then distilled and collected in the usual Boric Acid solution, then analyzed. Table 1 reports the results of the chromatographic analysis, in term of Nitrogen concentration, performed both on the starting solutions (before addition of NaOH and distillation; diluted to 250 mL) and the corresponding final ones (after distillation and condensation; diluted to 250 mL). Table 1: results of the chromatographic analysis performed on samples at the beginning and at the end of the distillation procedure Experiment Starting N concentration (ppm) Final N concentration (ppm) 0 (water) < 0.003 0.03 1 3.52 3.57 + 1.48 % 2 1.88 1.74 - 7.5 % 3 0.906 0.878 - 3.03 % Relative variation Table 1 shows that the Nitrogen concentration evaluated at the end of the overall procedure is in good agreement with the corresponding value at the beginning of the process: the maximum absolute relative variation (experiment 2) is 7.5%. This appears as a good results, since it indicates that NH3 loss during the distillation is absent or very small, and that no significant error has been done during the addition, dilution and transfer operations; consequently, it assures that the final chromatographic result actually reflects the physical situation of the system. Some additional experiments will be anyway executed in next future, trying to optimize more the whole process and minimize the difference between starting and final concentration values. 2 1M = 1 mol/L (molar concentration) = 40g NaOH/L 12 2.7 Next steps to perform As soon as the glovebox will be available in the ENEA laboratory, it will be possible to safely hande the Lithium (transferring it from the sampler to the glass flask) and proceed with the evaluation of its Nitrogen impurity content, as explained in section 2.3. Before any quantitative consideration, it will be necessary anyway to perform a preliminary study of the reaction of Lithium with water, both in terms of efficiency, kinetics, and safety. This reaction is in fact very exothermic and requires therefore to be conducted in controlled conditions, to avoid potential hazard. The speed of water addition should be very slow; the opportunity of disposing of a cooling bath around the distilling flask should also be considered. Only after this preliminary investigation, it will be possible to go to the next step, the distillation of the Ammonia produced in the reaction and the following chromatographic analysis. The final step will be the validation of the overall procedure (meaningful analysis of the Nitrogen contained inside a real sample of Lithium). The best way to achieve this goal would be to analyze a sample of Lithium characterized by a known value of Nitrogen concentration. Unfortunately, it’s not possible to dispose of such a Lithium: the supplier only declares, for the commercial product, a maximum Nitrogen concentration of 300 wppm, but not the precise value, so we cannot use it for a precise verification/calibration of the analysis. What we can do is to proceed along the path below: 1) Determine N amount in a Lithium sample (sample A) 2) Prepare a solution, adding not simple demineralized water but a known amount of NH4Cl solution to the same type and amount of the previous Lithium sample, so to create an higher N concentration. 3) Determine total N amount in this new solution (sample B). If the difference in N amount between new sample (B) and first sample (A) corresponds to the known amount of N introduced with the added NH4Cl solution, we can be confident that the absolute value of N concentration in (A) is correct. On the other hand, if the difference is slightly smaller, we can anyway calculate the ratio of the measured difference to theoretical one, and divide the measured concentration of (A) by this value (a corrective factor), to achieve the real one. Clearly, if the difference is instead significant, we have to search for possible theoretical/experimental mistakes or troubles originating it, and possibly eliminate them, varying also the amount of the added NH4Cl solution. 2.8 Reproducibility considerations and Round Robin Analysis Taking into account that the amount of Lithium taken from Lifus 6 plant with the samplers is about 12 g and that for each offline chemical analysis about 1 to few grams of Lithium are required, it is evident that it will be in any case possible to perform at least a double analysis of each Lithium sample. This allows to check the reproducibility of the analysis. Moreover, a Round Robin Analysis is going to be activated, involving ENEA and JAEA (Japanese Atomic Energy Agency, partner of the IFMIF project and in charge of Lithium purification as well). JAEA has developed, during last months, a technique for the evaluation of the Nitrogen contained inside Lithium, which is actually very similar to ENEA procedure. According to the agreement between ENEA and JAEA, during the next year JAEA will ship to ENEA some samples of Lithium. ENEA, JAEA and also the University of Tokyo (cooperating with JAEA) will analyze the same kind of sample, each institute in his own laboratory and with his own selected procedure. The different results obtained from the different institutes will be compared: this will give more information about the soundness of the chosen analytical technique and will be, also for ENEA, an additional way to 13 ACCORDO DI PROGRAMMA MSE-ENEA validate the procedure or, in case of bad agreement, to discover some intrinsic limit of it. In parallel, also ENEA will ship some samples to JAEA, to perform the same crossed check of the results got by the different institutes. 3 Conclusioni A procedure has been defined for the quantitative evaluation of the Nitrogen concentration in Lithium flowing inside Lifus 6 plant. The plant, whose construction has been almost complete and which will be employed for the experimental corrosion tests from the next December, is for this reason equipped with two different (and differently located) samplers, each one able to take about 12 g of Lithium. A specific chemical reaction has been conceived in order to transform, in safety conditions, all the Nitrogen in the sampled Lithium into Ammonium Ion (NH4+) , which, in an environment no more containing Lithium, can be analyzed by the IC-HPLC technique (ionic chromatography). A glassware apparatus, interfaced with a controlled flow of Argon, has been arranged in ENEA laboratory, in order to accomplish this chemical reaction. The chromatographic technique has been investigated for its intrinsic precision and accuracy: employing standard NH4Cl solutions, the relative error of the analysis has been shown lower than 3.6%, in the range of concentration of 0.1-3.3 ppm. The effect of the purity degree of the various reactants employed (NH4Cl, H3BO3, water itself) has been considered too: as a general rule, it appeared that a better precision in the analysis result can be obtained employing a fitting curve which replicates the «matrix», i.e. constructed with standards containing the same kind of mineralized water and the same amount of H3BO3 of the real samples. Since the ENEA laboratory doesn’t dispose yet of a dedicated glovebox for the safety handling of Lithium (its delivery is scheduled by the half of September), it has not been possible for the moment to perform the analysis of real Lithium samples. In order to emulate them, and to be able to somehow investigate the process of distillation of the Ammonia (NH3) formed during the chemical transformation, NH3 solutions have been prepared by the reaction between NH4Cl and concentrated Sodium Hydroxide (NaOH) solutions. The comparison of the analysis results of these NH3 solutions, before and after the distillation, has evidenced that the distillation process is quantitative, with very small NH3, hence small Nitrogen, losses: some optimization is anyway possible, to reduce them to 0. As soon as the glovebox will be available, it will be possible to go ahead in the validation of the overall procedure. Firstly, a preliminary study of the reaction of Lithium with water, in terms of efficiency, kinetics, and safety will be conducted. Then, the quantitative evaluation of Nitrogen contained inside real Lithium samples will be executed. Finally the soundness of the overall procedure will be checked, not only via the internal verification of known N amounts, but also via the comparison of the results got by different institutes (ENEA, JAEA, University of Tokyo) on the same kind of Lithium samples, each institute employing its own laboratory and its own specific procedure. 14 4 Riferimenti bibliografici 1. K. Natesan, “Influence of nonmetallic elements on the compatibility of structural materials with liquid alkali metals”, Journal of Nuclear Materials, 115 (1983), 251-262 2. O.K. Chopra and D.L. Smith, “Influence of Temperature and Lithium purity on corrosion of ferrous alloys in a flowing lithium environment” Journal of Nuclear Materials, 141-143 (1986), 584-591 3. A.S. Bailey, D.H. Gregory and P.Hubberstey “Design, technical specification and proof of concept of the nitrogen resistivity meter” Tech. report N°5 for contract proposal N°64 (2004) 4. C.H. Ward, R.D. Gardner, W.H. Ashley and A.Zerwekh, “The titrimetric determination of Traces of Nitride Nitrogen in Sodium Metal” LA-2892, Los Alamos Scientific Laboratory (1963) 5. R.J. Schlager, D.L. Olson and W.L. Bradley “Analytical determination of Nitride Nitrogen in Lithium coolants” Nuclear Technology, 27 (1975), 439-441 5 Abbreviazioni ed acronimi Ar EVEDA H2 H3BO3 HPLC IC IFMIF JAEA Li3N MFC NaOH NH3 NH4+ NH4Cl nS ppb ppm wppm Argon Engineering Validation and Engineering Design Activities Hydrogen Molecule (gas) Boric Acid High Performance Liquid Chromatography Ionic Chromatography International Fusion Materials Irradiation Facility Japanese Atomic Energy Agency Lithium Nitride Mass Flow Controller Sodium Hydroxide Ammonia Ammonium ion Ammonium Chloride NanoSiemens Part Per Billion (in solution = µg/L) Part Per Million (in solution = mg/L) Weight Part Per Million (= mg/Kg) 15
© Copyright 2026 Paperzz