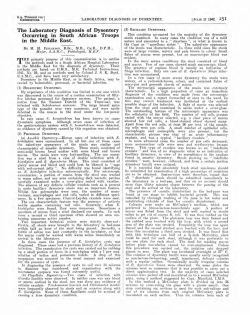
by Marie Dvorak Christ, Ph.D Michal Kliman, Ph.D. Mass Spec Lab For questions or info call or e-mail 949-872-2724 or [email protected] www.massspeclab.com Outline Biomedical Device Industry Overview Regulatory Aspects Extractables and Leachables (E&L) Analysis High Resolution Mass Spectrometry Instrumentation Time of Flight (TOF) Mass Spectrometers MS Data Overview Resolution and Accuracy Case Studies L&E Contaminant Analysis Surfactant Analysis Study of Polyurethane Acrylic Adhesive Hydrolytic Stability Medical Devices Medical Device - any healthcare product that does not achieve its principal intended purpose by chemical action or by being metabolized. Biomedical Device- Regulatory Background Regulations, like drugs, defined in CFR Title 21 Biomedical Device regulated by CDRH (Center for Device and Radiological Health) Division of FDA Three Biomedical Device Classes – Class I, Class II and Class III Class I and II – 510K regulatory route (no clinical trial based on substantial equivalence to predicate device) Class III – IDE/PMA (involves clinical trial ; requires testing to demonstrate safety and efficacy of new product) Chemical Testing of Biomedical Devices required to demonstrate safety or equivalence, i.e. “Extractables and Leachables” (E&L) Objective of E&L Testing Identify and Quantitate “leachates” - chemical compounds that might leach from the material under simulated physiological conditions Identify and Quantitate “extractables” chemical compounds that could potentially migrate from the material under more extreme conditions of temperature and solvent. Leachable and Extractable Testing Aspects Leachables and Extractables (L&E) Test Guidance ISO 10993-12:2002 “Sample Preparation and Reference Materials” ISO 10993-18:2005 “Chemical Characterization of Materials” ISO 10993-13:2010 “Identification and Quantification of Degradation Products from Polymeric Medical Devices Extraction Conditions Solvent Solvent:Mass ratio Time and Temperature Mode of Extraction Soxhlet Extraction in swellable solvent (for crosslinked (elastomeric) materials such as butyl rubber, silicones, polyurethane) Repeated soak with heat and shaking Polymer Dissolution (for non-cross linked polymers) ISO 10993 Guided Chemical Analysis –Identification and Quantification Select analytical method justifying sensitivity and selectivity GC/MS and LC/UV and LC/MS required Typically require analytical method with ppm sensitivity for plastics monomers and plastics additives. Semi-targeted screen – many possible analytes known (plastics monomers) but many unknown (degradants and contaminants, polymerization byproducts) If a polar analyte detected by UV (many chemicals are detectable at 1100ppm concentrations by UV), it must be chemically identified, preferably source reported and amount quantified. The specificity of UV spectra is not sufficient enough for chemical id. If a volatile analyte detected by GC/FID or GC/MS, it must be identified. NIST library is a great aid to id but often analyte is not in the library. Significant Challenges of Leachable and Extractable Testing of Biomedical Device Device is a multiplicity of diverse materials Different plastics Adhesives Metals Lubricants Manufacturing aids (surfactants) Coatings Unknown Degradant Profile Process effects on diverse materials yielding unknown degradants Sterilization, molding, laser etching Device Aging Effects Shelf Life, hydrolytic aging, photoaging Raw material variability Each raw material source has potentially different impurity composition All plastics contain a significant proportion of processing additives E.g. antioxidants, heat stabilizers, UV absorbers, mold release agents and dispersants Same plastic, e.g. polypropylene, but different additives package. Not all polypropylenes are equivalent UPLC Coupled to G2-S (Waters) Q-Tof High Resolution Mass Spectrometer ANALYTICAL FUNCTION: Chemical and Structural Identification of unknown component analytes comprising a complex mixture. UPLC Function : Separation of a complex liquid mixture into pure components Mass Spectrometer Function: Determine the molecular mass of each pure component Molecular Mass , if accurate enough, can be a powerful tool for chemical identification! Definitions - Mass Carbon 6C12 isotope = 12 Da = 12 g/mole 1 atomic mass unit (amu) = 1 Dalton = 1.660538921(73) × 10−27 kg Cholesterol Elemental composition: C27H46O Theoretical exact monoisotopic mass (C12, H1, O16 ) = 386.35486 Da (uses isotope of maximum abundance) Molecular weight (based on natural isotopic abundance = 386.65 g/mole Nominal mass = 386 Da Definitions – Mass to Charge (M/Z) Mass spectrometer does not detect mass but mass to charge (m/z) at various levels of accuracy depending on instrument design Cholesterol Singly Positively Charged Ion Singly Negatively Charged Ion + H+ 386 + 1 1 = 387 2+ - + m/z = Doubly Positively Charged Ion + 2H+ H+ m/z = 386 − 1 = 1 m/z = 385 386 + 2 2 = 194 Nominal Masses m/z = 386.3549 + 1.0072 m/z = = 387.3549 1 386.3549 − 1.0072 1 Accurate Masses = 385.3477 m/z = 386.3549 + 2.0144 2 = 194.1847 Full Scan (Positive Mode) High Resolution MS Operation Ion UPLC Charge Ana Ion Mass Mass m/z TOF Analyte of Mass 500 amu CL+ +1(H+) 500 1001 1001 longest + +1(Na+) 500 523 523 +1(H+) 500 501 501 +2 (2H+) 500 502 251 shortest ++ Photodiode Array UV Detector CL+ + + Relationship between TOF (time of flight) and m/z m/z=k(TOF)2 ++ CL+ + CL+ ++ ++ CL+ + 20keV impulse ++ • Total Ion Chromatogram and Mass Spectra Output Time of flight (TOF) data yields the mass of Detected Ion Data • • spectrum, a plot of ion Intensity as a function of TOF which is proportional to m/z. Each push yields a mass spectrum Many (20,000) mass spectra are added to yield a Scan point intensity represents total ion count Mass Spectra Total Ion Chromatogram (TIC) 1 Intensity Intensity Total ion count @ each Scan point 1 2 Extracted m/z ion count @ each Scan point Retention time (min) Chromatographic peaks not resolved in TIC are often resolvable in XIC using TOF mass selectivity 2 Intensity Intensity Extracted Ion Chromatogram (XIC) Mass to charge (m/z) Intensity Definition - Mass Resolution m TOF z Resolution whh TOF whh Mass to charge(m/z) Detected mass to charge (m/z) 2 MS Instrument Res Whh @ m/z= 500 Tof High 30,000 Res 0.0167 Quadrupole Low Res 0.5-1.0 5001000 Definition - Mass Accuracy Mass Accuracy = + (m/z−theoretical m/z) theoretical m/z + H+ Intensity Theoretical monoisotopic mass to charge Detected mass to charge (m/z) Theoretical m/z = 386.3549 Example detected m/z = 386.3599 Mass Accuracy = Mass to charge (m/z) (386.3599 − 386.3549) = 1.29 x 10⁻⁵ 386.3549 Mass Accuracy = 1.29 x 10-5 x 1,000,000 = 12.9 parts per million (ppm) Plastics Additive UV Data 4-Allyloxy-2Hydroxybenzophenone CAS 2549-87-3 Octabenzone CAS 1843-05-6 3.0e-1 8.0e-2 2.5e-1 6.0e-2 287.7583 1.5e-1 AU UV Spectrum AU 2.0e-1 288.7583 4.0e-2 1.0e-1 2.0e-2 5.0e-2 nm 200 250 300 350 400 nm 200 450 250 300 350 400 450 1.8e+1 4.0e+1 1.6e+1 1.4e+1 3.0e+1 1.2e+1 AU AU Total photodiode array UV chromatogram 1.0e+1 2.0e+1 8.0 6.0 1.0e+1 4.0 Time 2.55 2.60 2.65 2.70 2.0 Time 3.55 3.60 3.65 3.70 Plastics Additive MS Data Structural characterization is limited with UV data. Two related benzophenone chromophores yield equivalent UV spectra (previous slide) but very different mass spectra in this slide 4-Allyloxy-2Hydroxybenzophenone CAS 2549-87-3 % Mass spectrum C13H11N3O monoisotopic neutral mass 254.0943 Da 327.1960 C21H26O3 monoisotopic neutral mass 326.1882 Da % 255.1023 Octabenzone CAS 1843-05-6 358.3680 200 250 300 350 400 450 m/z 500 0 100 405.3590 215.0708 150 200 250 300 350 400 450 m/z 500 % Total ion chromatogram 188.0530 150 % 0 100 15 Time 2.55 2.60 2.65 2.70 21 Time 3.55 3.60 3.65 3.70 MSMS High Resolution MS Operation Ion Charge CL+ + UPLC ++ Ana Ion Mass Mass m/z TOF +1(H+) 500 1001 1001 +1(Na+) 500 523 523 +1(H+) 500 501 501 +2 (2H+) 500 502 251 shortest +1(H+) 1200 1201 1201 longest Analyte of Mass 500 amu Analyte of Mass 1200 amu Photodiode Array UV Detector + Filters specific Ions with EM Fields 1-2 amu narrow bandwidth filtering possible Filter the 1201 ion only ++ CL+ CL+ ++ + Collision Induced Dissociation (CID) – “Fragmentation” Low Pressure Argon Gas Filled Chamber MSMS High Resolution MS Operation Ion Charge CL+ + UPLC ++ Ana Ion Mass Mass m/z TOF +1(H+) 500 1001 1001 +1(Na+) 500 523 523 +1(H+) 500 501 501 +2 (2H+) 500 502 251 shortest +1(H+) 1200 1201 1201 longest Analyte of Mass 500 amu Analyte of Mass 1200 amu Photodiode Array UV Detector F1 + Filters specific Ions with EM Fields 1-2 amu narrow bandwidth filtering possible Filter the 1201 ion only ++ F2 CL+ F3 CL+ ++ F1 F2 F3 F4 F4 + Collision Induced Dissociation (CID) – “Fragmentation” Low Pressure Argon Gas Filled Chamber Intensity Mass spectrum of fragments of selected ion (m/z) Ion Fragmentation In Collision Cell Ar +M+ eV F+ + N + Ar M+= Molecular Ion N= neutral fragment F+= ion fragment M>F1>F2>F3>F4 Fragmentation – Collision Induced Dissociation (CID) Site Specificity -Preferential fragmentation at polar bonds, clusters Structural Information Encoded in Fragments Searchable MSMS Fragmentation Libraries (Similar to EI GC/MS libraries, e.g. NIST) generated with characteristic spectra. (Platform dependent) chemically identify fragments Fragments can fragment (F3->F4) F3 F3 F2 F3 F4 F2 F4 F2 F3 F3 F1 F1 F1 N N N F1 Triphenyl Phosphate High Energy MSMS of Dimer MS/MS of 653 m/z 20 - 35 eV Collision energy can be used to break up clusters (dimer) and simplify mass spectrum 327.0801 % [M+H]+ Triphenyl Phosphate Dimer absent in spectrum with collision energy on 0 100 MS Full Scan Low Energy 200 300 400 500 327.0803 600 700 m/z 800 Dimer [2M+H]+ % [M+H]+ 653.1522 0 100 200 300 400 500 600 700 m/z 800 MSE High Resolution MS Operation MSE Advantages • In same time required for MS alone, can acquire both MS and MSMS scans for all ions in sample. 1. No quad selection • MSMS might ultimately be 2. No collision energy required for problem. But MSE is 3. Low energy mass spectrum a great screening tool. CL + + ++ + + CL+ ++ ++ Mass to charge (m/z) In MSE mode collision cell energy is rapidly alternating between on and off. Two mass spectra are acquired; 1) low energy spectrum with molecular ions 2) High energy spectrum with fragments + 1. No quad selection 2. Collision energy ON yields fragment 3. High energy mass spectrum with fragment ions of all molecular ions F1 +F2 CL + + ++ CL + + ++ F3 F1 F2 F3 F4 +++ F4 Intensity + ++ CL + Intensity CL + Mass to charge (m/z) Two related benzophenone chromophores yield common fragments in red due to their structural similarity. But fragmentation pathways are so sensitive to structure that distinguishing fragments circled in green below are also acquired Plastics Additive MSE Data 4-Allyloxy-2Hydroxybenzophenone CAS 2549-87-3 105.0340 137.0313 Octabenzone CAS 1843-05-6 High Energy 105.0340 % % High Energy 215.0731 77.0388 0 50 75 100 137.0241 125 150 293.0481 175 200 225 250 275 300 325 m/z 350 0 50 75 100 125 150 175 200 225 250 275 300 255.1025 Low Energy 100 125 150 175 200 339.0525 225 250 275 300 325 m/z 350 0 50 Low Energy C21H26O3 monoisotopic neutral mass 326.1882 Da % 139.0556 188.0548 75 m/z 350 327.1960 C13H11N3O monoisotopic neutral mass 254.0943 Da % 0 50 325 75 100 125 150 284.2946 215.0709 137.0233 175 200 225 250 275 300 325 m/z 350 Plastics Additive MSE Data C21H26O3 monoisotopic neutral mass 326.1882 Da Octabenzone CAS 1843-05-6 Positive Mode MS Negative Mode MS 137.0313 High Energy 211.0416 105.0340 % % High Energy Fragments produced by positive and negative ions can be significantly different as shown. In fact, positive mode and negative mode spectra of Octabenzone share no common fragments. 215.0731 169.0659 256.0260 0 m/z 100 120 140 160 180 200 220 240 260 280 300 320 340 Low Energy 0 50 75 100 125 150 175 200 225 250 275 300 325 m/z 350 327.1960 325.1808 % % Low Energy 211.0387 255.3548 0 m/z 100 120 140 160 180 200 220 240 260 280 300 320 340 0 50 75 100 125 150 284.2946 215.0709 137.0233 175 200 225 250 275 300 325 m/z 350 Theoretical Prediction of Plastic Additive Fragment Ions in MassFrontier (Thermo) Software Mass Frontier when used with accurate mass data is an effective tool in structural interpretation of fragmentation spectra 4-Allyloxy-2Hydroxybenzophenone CAS 2549-87-3 Octabenzone CAS 1843-05-6 O HO O O 105.0340 OH 137.0313 OH OH % O % HO O H2 O 105.0361 O O OH 215.0761 137.0241 293.0481 77.0388 0 50 75 100 125 150 175 200 225 250 275 300 325 m/z 350 0 50 75 100 125 150 175 200 225 250 275 300 325 m/z 350 Contaminant Structure Verification Using Mass Frontier Software (MFS) Mass Frontier (Thermo Scientific) Small Molecule Structural Elucidation Software MassFrontier is a predictive software that generates structures of expected fragments from a given precursor ion Mass Frontier generates fragments using predictive algorithms based on rules of ionization, fragmentation and rearrangement MSMS Collision Induced Dissociation (CID) Fragmentation library based on 120,000 published small molecule fragmentation mechanisms The software predicts fragments as well as the pathways of their formation and so yields precursor/fragment pairs. Case Study I E&L Study of Acrylic Intraocular Lens (IOL) Device Chemical Identification of Low Level UV Absorber Contaminant in Hydrophobic Acrylic Intraocular Lens (IOL) Extract • IOL replaces crystalline lens in cataract surgery • Over 15 million implants worldwide per year. Hydrophobic Soft Acrylic IOL Acrylic Chemistry Lens Acrylic Components Acrylic Monomers Initiator (Azoisobutyronitrile) Acrylic Crosslinker Benzotriazole (UV absorber) monomer H O Cl N N N R= short chain hydrocarbon or UV absorber Elastomeric Polymer (acrylics, polyurethane, EPDM rubber, silicone, PVC) Elastomer swells in a chemically compatible solvent; it does not dissolve Acrylics swell in alcohols, e.g. isopropanol (IPA) UV Chromatogram of Lens E&L Extract UV Absorber Standard 5ppm IPA E&L Extract IPA Blank 330 nm UV Chromatograms 2.0e-2 0.0 1.80 2.00 2.20 2.40 2.60 2.80 3.00 3.20 3.40 3.60 3.80 4.00 1.80 2.00 2.20 2.40 2.60 2.80 3.00 3.20 3.40 3.60 3.80 4.00 -4.0e-3 -5.0e-3 1.80 2.00 2.20 2.40 2.60 2.80 3.00 3.20 3.40 3.60 3.80 4.00 -4.0e-3 Time UV absorber monomer Unknown residual analyte elutes at 3.68 minutes detected at RT 3.45 minutes 330nm absorbance characteristic of UV absorber, so and related. But not UV absorber monomer (no coelution). probably UV absorber Possible sources of ipa extractable UV absorber related analyte A) generated from the monomer as a degradant in production or storage. B) Introduced with UV absorber monomer (as a contaminant) Contaminant Investigation – Analyte Source We identified an impurity in a high concentration UV absorber standard that matched the device impurity in UPLC retention time, UV response, and mass spectrum Contaminant Chemical Characterization Using Accurate Mass • Accurate Mass was essential for this structural characterization Experimental accurate monoisotopic mass of UV absorber = 328.1204amu of UV absorber impurity = 330.1021amu Software aided chemical formula determination Assumed element content C, O, H, N, Cl one chlorine containing chemical formula, C17H16ClN3O2 (monoisotopic mass 330.1009amu) matched the accurate experimental mass within 5 ppm Chemical deduction suggested the impurity structure with an aldehyde group replacing the vinyl group Theoretical = 330.1009amu Experimental= 330.1021 amu Mass accuracy =3.6ppm =1.9793 +O -CH2 UV Absorber Monomer Contaminant Comparison of Experimental MSE High Energy Spectral Fragments and MFS Theoretical Predicted Fragments 100 A. Cl HO N 119.0489 Cl N N N N HO N % HO UV Absorber H 272.0564 H2O 328.1160 274.0508 119.0868 147.1186 126.0089 0 100 120 140 175.1144 160 209.0784 198.9491 221.1139 180 200 220 286.0280 243.0501 240 260 280 330.1088 331.1131 314.0667 300 320 m/z 340 H HO 100 246.0443 H2O B. Cl Cl N N N HO N N N 274.0373 O Contaminant % 330.0977 CO loss loss of t-butyl O 248.0410 183.0693 121.0639 121.1022 0 100 120 140 276.0355 CO loss 155.0739 160 249.0375 217.0295 180 200 220 302.1070 314.0667 240 260 280 300 320 m/z 340 • With the experimental mass accuracy of 5 ppm we were able to unambiguously match up theoretically predicted fragment masses with experimental data Application of High Resolution MS to Surfactant Fingerprinting Surfactant Uses in Biomedical and Pharmaceutical Applications Formulation Solubilization or Compatibilization OTC drugs, cosmetics, pharmaceutical formulations) Foam Control Drug Delivery Application Wipe down of clean room surfaces Final package (e.g. cap and closure) critical cleaning Process equipment cleaning Final cleaning of biomedical devices prior to final packaging Non-ionic Surfactant Chemistry Non-ionic General Architecture Linear Polymeric Surfactant Molecule Hydrophobic Tail Hydrophilic Head R=cetyl, undecyl PEG (polyethylene glycol) ( CH2CH2O )n High mass Liquids, paste, waxes PPG (polypropylene oxide repeat unit) PBO (polybutylene oxide) • • • TICs of Several Non-ionic Surfactants Surfactants Often Coelute in LC due to chemical similarity (See Brijs below) Polymeric chains are not chromatographically resolved. Broad chromatographic peaks encompass surfactant molecules covering a range of molecular weights (polydisperse) All surfactants shown not UV detectable at 20-200 ppm concentration % average Mn ~4,670 1 0.10 One Unsat bond 0.20 0.30 0.40 0.50 0.60 0.70 Brij S100 0.80 0.90 1.00 1.10 1.20 1.30 1.40 1.50 1.60 1.70 1.80 1.90 2.00 2.10 2.20 2.30 2.40 2.50 2.60 2.70 % avg. Mn ~1,150 2.80 2.90 3.00 3.10 3.20 3.30 3.40 3.50 3.60 3.70 3.80 3.90 3.00 3.10 3.20 3.30 3.40 3.50 3.60 3.70 3.80 3.90 2.90 3.00 3.10 3.20 3.30 3.40 3.50 3.60 3.70 3.80 3.90 2.90 3.00 3.10 3.20 3.30 3.40 3.50 3.60 3.70 3.80 3.90 2.90 3.00 3.10 3.20 3.30 3.40 3.50 3.60 3.70 3.80 3.90 Brij O20 1 0.10 0.20 0.30 0.40 0.50 0.60 0.70 0.80 0.90 1.00 1.10 1.20 1.30 1.40 1.50 1.60 1.70 1.80 1.90 2.00 2.10 2.20 2.30 2.40 2.50 2.60 2.70 2.90 Brij 58 avg. Mn ~1,120 % 2.80 1 0.10 0.20 0.30 0.40 0.50 0.60 0.70 0.80 0.90 1.00 1.10 1.20 1.30 1.40 1.50 1.60 1.70 1.80 1.90 2.00 2.10 2.20 2.30 2.40 2.50 % avg. Mn ~800 2.60 2.70 2.80 Valtron 1 0.10 0.20 0.30 0.40 0.50 0.60 0.70 0.80 0.90 1.00 1.10 1.20 1.30 1.40 1.50 1.60 1.70 1.80 1.90 2.00 2.10 2.20 2.30 2.40 2.50 2.70 2.80 Micro 90 avg. Mn ~600 % 2.60 1 0.10 0.20 0.30 0.40 0.50 0.60 0.70 0.80 0.90 1.00 1.10 1.20 1.30 1.40 1.50 1.60 1.70 1.80 1.90 2.00 2.10 2.20 2.30 2.40 2.50 2.60 2.70 2.80 PPG-PEG-PPG (Poloxamer) % avg. Mn ~2000 1 0.10 0.20 0.30 0.40 0.50 0.60 0.70 0.80 0.90 1.00 1.10 1.20 1.30 1.40 1.50 1.60 1.70 1.80 2.00 2.10 2.20 2.30 2.40 2.50 2.60 2.70 2.80 2.90 3.00 3.10 3.20 3.30 3.40 3.50 3.60 3.70 3.80 3.90 2.20 2.30 2.40 2.50 2.60 2.70 2.80 2.90 3.00 3.10 3.20 3.30 3.40 3.50 3.60 3.70 3.80 Time 3.90 Tween 80 avg. M.W. ~1310 % 1.90 1 0.10 0.20 0.30 0.40 0.50 0.60 0.70 0.80 0.90 1.00 1.10 1.20 1.30 1.40 1.50 1.60 1.70 1.80 1.90 2.00 2.10 Combined Mass Spectra of Surfactants % • • • % 0 50 0 50 Higher Molecular Weight Surfactants Tend to Multiply Charge in ESI (see Brij S100) Molecular weight distribution can be experimentally estimated from mass spectral data Each surfactant displays a unique mass spectral fingerprint despite similarity in structure Mixed +1, +2, +3 and higher charges 100 150 200 250 +4 300 350 400 450 500 550 600 650 700 750 800 850 900 +3 950 1000 1050 1100 1150 1200 +3 1250 1300 1350 1400 1450 1500 1550 1600 𝑚𝑎𝑠𝑠 = 1000 → 𝑚𝑎𝑠𝑠 = 2000𝑎𝑚𝑢 2 m/z 1650 1700 1750 150 200 250 300 350 400 450 500 550 600 650 700 750 800 850 900 950 1000 1050 1950 2000 2050 2100 2150 2200 2250 2300 2350 2400 2450 PPG-PEG-PPG +1 1100 1150 1200 1250 1300 1350 1400 1450 1500 1550 1600 1650 1700 1750 +1 Mixed +1 and +2 charges 100 150 200 250 300 1800 1850 1900 1950 2000 2050 2100 2150 2200 2250 2300 2350 2400 2450 avg. Mn ~1,150 Brij O20 (C18 unsat) m/z 350 400 450 500 550 600 650 700 750 800 850 900 950 1000 1050 1100 1150 1200 1250 1300 1350 1400 1450 1500 1550 1600 1650 1700 1750 +2 1800 1850 1900 1950 2000 2050 2100 2150 2200 2250 2300 2350 2400 2450 Brij 58 (C16) avg. Mn ~1,120 +1 m/z 100 150 200 250 300 350 400 450 500 550 600 650 700 750 800 850 900 950 1000 1050 1100 1150 1200 1250 1300 1350 1400 1450 1500 1550 1600 1650 1700 1800 1850 1900 1950 2000 2050 2100 2150 2200 2250 2300 2350 2400 2450 Tween 80 avg. M.W. ~1310 +1 % 1750 m/z 100 150 200 250 300 350 400 450 500 550 600 650 700 750 800 850 900 950 1000 1050 1100 1150 1200 1250 1300 1350 1400 1450 1500 1550 1600 1650 1700 1750 +1 100 150 200 250 1850 1900 1950 2000 2050 2100 2150 2200 2250 2300 2350 avg. Mn ~800 % Singly charged 1800 2400 2450 Valtron m/z 300 350 400 450 500 550 600 650 700 750 800 850 900 950 1000 1050 1100 1150 1200 1250 1300 1350 1400 1450 1500 1550 1600 1650 1700 1750 +1 1800 1850 1900 1950 2000 2050 2100 2150 2200 2250 2300 2350 2400 2450 Micro 90 avg. Mn ~600 % 0 50 1900 m/z 100 +2 0 50 1850 avg. Mn ~2000 % % 0 50 1800 +2 +2 0 50 Brij S100 (C18 sat) average Mn ~4,670 +2 0 50 m/z 100 150 200 250 300 350 400 450 500 550 600 650 700 750 800 850 900 950 1000 1050 1100 1150 1200 1250 1300 1350 1400 1450 1500 1550 1600 1650 1700 1750 1800 1850 1900 1950 2000 2050 2100 2150 2200 2250 2300 2350 2400 2450 High Resolution Essential for Identification of Multiply Charged Species • The carbon 13 isotope +6 peaks of a molecule with one positive charge are spaced 1 Da. The spacing is 0.5 Da for two charges and 0.33 Da for three charges. 1356.2906 1355.9536 Brij S100 1356.6245 0.33 2016.3560 1356.9546 2016.8531 0.5 % % +5 0 1356 % +4 2017.3572 2015.3567 m/z 1357 2017.8481 +3 0 2015 2016 m/z 2018 2017 +2 0 400 m/z 450 500 550 600 650 700 750 800 850 900 950 1000 1050 1100 1150 1200 1250 1300 1350 1400 1450 1500 1550 1600 +3 PPG-PEG-PPG 1650 1700 1750 1815.3431 1800 1850 1900 1950 2000 2050 2100 2150 2200 2250 2300 2350 2400 2450 2500 2550 2600 2650 2350 2400 2450 2500 2550 2600 2650 1816.3470 1 1817.3558 % +2 % 1818.3522 0 1815 1816 1817 m/z 1819 1818 +1 0 400 m/z 450 500 550 600 650 700 750 800 850 900 950 1000 1050 1100 1150 1200 1250 1300 1350 1400 1450 1500 1550 1600 1650 1700 1750 1800 1850 1900 1950 2000 2050 2100 2150 2200 2250 2300 Brij 58 vs Brij O20 Surfactant MS Peak Separation • High resolution and accurate mass capability of TOF spectrometer enables unequivocal identification of C2H2 chemical difference between the two different Brij surfactants. 1122.8079 Brij O20 44.0262 Δ=C2H4O =44.0272 =26.0113 avg. Mn ~1,150 % HO(CH2CH2O)20C18H35 1166.8351 =26.0082 1099.7109 n 1143.7368 C18H35 1106.8162 0 1090 1100 1110 1187.7667 1150.8370 1120 1130 1140 1150 1194.8678 1160 1170 1180 1190 m/z 1200 1096.7966 Brij 58 =44.0303 HO(CH2CH2O)20C16H33 n Δ=C2H2 1140.8269 =44.0237 avg. Mn ~1,120 1184.8506 % 26.0157 1117.7290 1161.7550 C16H33 1124.8235 0 1090 1100 1110 1120 1130 1168.8549 1140 1150 1160 1170 1180 1190 m/z 1200 Water Soluble Wax Analysis • Hard wax is used to block acrylic blanks during lathing operation in contact lens or IOL production. • Hard wax is water soluble and is removed from the lens after lathing by soaking in water. • Wax must be completely removed for contact lens comfort and IOL biocompatibility. Water Soluble Wax Analysis - Accurate Mass Extracted Ion Chromatogram Improves Detection Limit • • • • TOF is highly sensitive for high molecule weight waxy surfactant molecules 100ppb detection Limit achieved using accurate mass extracted ion chromatograms Highly specific extraction of accurate masses of wax peaks is an excellent background noise filter. Good example of how selectivity achieved with mass accuracy can enhance sensitivity Wax Standard Concentration Accurate Mass (+/- 0.01 Da) Extracted Ion Chromatogram Areas Total Ion Chromatogram 0 0 0.50 1.00 1.50 2.00 2.50 0.50 1.00 1.50 2.00 1.00 1.50 2.00 2.50 1.00 1.50 2.00 2.00 2.50 2.50 1.50 2.00 2.50 S/N:PtP=16.17 % 0 0.50 1.00 1.50 2.00 0.50 2.50 100 100 % 1.50 1.00 100 % % % 1.00 0.50 2.50 0 0.50 2.00 % 0.50 100 79 1.50 0 0 0.50 1.00 S/N:PtP=228.48 100 % % 59 0.50 2.50 100 1 ppm 100 ppb % % 14 S/N:PtP=2691.57 100 % 10 ppm % 100 Signal to Noise Calculation 1.00 1.50 2.00 S/N:PtP=2.50 2.50 Adhesive Hydrolytic Stability Adhesives have widespread uses in biomedical devices. Adhesive bond must remain stable over time in physiological environment if a device is to remain safe and effective. Adhesives are complex reactive mixtures whose chemical composition is often not revealed by suppliers. Formulations are often trade secrets. Adhesive stability requires early investigation. Investigated the chemical stability of photocured acrylic-based adhesive used in adhesion two acrylic parts of long-term biomedical device implant. Exposed adhesive bond to Long term hydrolytic exposure. Analyzed hydrolysate. Accelerated aging in water at 85C for 2 months equivalent to five years real time at physiological conditions (35C ) with 10grams water/gram material. Adhesive Chemistry Macromer + Acrylic Crosslinker photoinitiator Adhesive Network Polyetherurethane Acrylic Macromer Architecture Crosslinked Adhesive PU Polyurethane PE polybutoxyether Polyetherurethane macromer MW ? Total Ion Chromatograms of 5 Year Equivalent Aged Hydrolysates Normalized Ion Count • The hydrolysate displayed analyte peaks that were related to the adhesive. • “What is the solution concentration of these analytes? • Is the analyte source a residual fraction of the adhesive or a degraded fraction? Time, Minutes Total Ion Chromatograms – Macromer Std vs. Aged Hydrolysate • There was no evidence that the hydrolysate fraction was a contaminant of the macromer material. • Both chromatograms share a quartet repeat structure that was found to be a fingerprint of the macromer. Standard Solution Normalized Ion Count quartets 10 ppm Time, Minutes Combined Mass Spectra– Macromer Std vs. Aged Hydrolysate 72 Adhesive Macromer 1005.6 100 % Normalized Ion Count 1006.6 730.5 766.5 767.0 694.4 802.5 803.0 658.4 413.3 0 200 300 400 500 469.3 100 1365.9 700 1294.9 1367.9 1440.0 923.1 934.5 800 1079.7 1151.7 900 1512.0 1582.1 1223.8 1295.9 1007.6 983.6 622.4 600 1078.7 1150.7 1510.0 1511.0 933.5 850.6 511.3 547.3 295.2 1438.0 1149.7 1221.8 1293.8 • No overlapping masses in mass spectra either 411.3 1077.7 1000 1091.7 1163.7 1235.8 1307.9 1368.9 1441.0 1513.0 1100 1200 1300 1400 1500 1606.0 1678.1 1750.2 1608.0 1680.1 1600 1700 m/z 57D device hydrolysate 397.2 541.4 583.4 483.3 655.4 PE polybutoxyether 369.2 % 613.4 271.2 343.2 329.2 425.3 727.5 699.4 741.4 257.2 255.2 0 200 • Polybutoxyether repeat unit was determined with mass spectrometry. Reverse engineering possible =72 Dalton 785.4 300 400 500 600 700 800 829.4 873.5 959.5 900 1000 Mass/Charge 1100 1200 1300 1400 1500 1600 1700 m/z Total Ion Chromatograms – Adhesive Puck vs. Aged Hydrolysate Normalized Ion Count • Hydrolysis of cured adhesive puck was performed to investigate kinetics of process independent of other device components. • Puck was heated in water at 100deg C for 100 hours. • TIC of puck hydrolysate was remarkably similar to device hydrolysate. • Puck peaks did not increase with exposure beyond 100 hours. Time, Minutes Mass Spectra -Adhesive Puck vs. Aged Hydrolysate 727.5 % 57D device hydrolysate • Same masses aptly highlights chemical similarity of puck and device hydrolysates 699.4 685.5 713.5 557.4 602.4 617.4 645.4 653.4 543.4 0 500 100 510 520 530 540 550 560 570 580 600 610 620 588.4 Adhesive puck hydrolysate 543.4 590 677.5 631.4 630 640 650 670 714.5 680 690 700 710 557.4 730 742.5 740 750 760 770 780 790 m/z 800 780 790 m/z 800 727.5 639.4 603.4 714.5 686.4 645.4 589.4 544.4 509.3 0 500 720 729.5 713.5 685.4 631.4 741.5 687.5 663.5 660 728.5 705.5 686.5 588.4 % Normalized Ion Count 100 510 529.4 522.3 520 530 545.4 540 550 611.4 617.4 558.4 571.3 560 570 625.4 590.4 580 590 600 610 620 728.5 653.4 655.4 630 640 650 660 699.5 705.5 670 Mass/Charge 680 690 700 741.4 742.4 715.5 687.5 663.5 710 720 730 740 750 771.5 760 770 Summary of Adhesive Case Study Results Macromer adhesive is not UV active and thus not detectable by conventional UV analysis. Mass detection provided sensitive detection and mass spectral data rich in chemical structure information. The adhesive related analyte concentration in the device hydrolyate was estimated to be 45 ppm using the MS response of adhesive macromer standard solution for quantification. Low concentration equivalent to only 1% of the total macromer applied in the adhesive joint Prolonged hydrolysis of the adhesive puck at 100C beyond 170 hours did not result in an increase in the adhesive analyte solution concentration suggesting that hydrolysis was limited to a labile macromer fraction. Summary of Key Points Versatility of Waters G2-S QTOF as a highly effective Qual/Quan Instrument High Resolution Mass Spectrometry required for all three case studies. No other method has both the sensitivity and selectivity that was needed. Fragment data acquired with QTOF MSMS is mandatory for structural elucidation of small molecules. The performance of Mass Frontier software in fragment prediction was impressive. Its an important tool for successful small molecule structural elucidation. Mass Spec Lab’s fragment library built rapidly with MSE technology is expected to be a superior tool for plastics and packaging additive identification in E&L studies performed for pharma and biomedical Acknowledgements Richard Christ Sandy Wong Michelle Tran Thermo Scientific & High Chem Dr. Robert Mistrik Waters Company Bobbie Frye, Keith Hermann, Paul Salafia
© Copyright 2026 Paperzz