Paper
zz
Explore Categories
Log in
Create new account
No category
Knowledge-based economy and social exclusion
Download
Report
LA STORIA INCONTRA IL DESIGN Aeterna Design
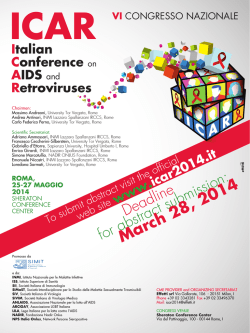
Locandina - ICAR 2014
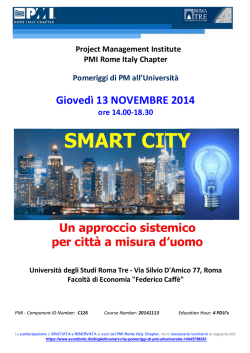
2014-11-13 - Special Event Smart City
Giulia Pavan – Curriculum Vitae
GIOCHI SPORTIVI STUDENTESCHI 2014
Cliccando qui potete scaricare la locandina del seminario
HOT TOPICS IN GASTROENTEROLOGY - Emec-roma
I hope this may be helpful
Download File
Iscrizione al Gruppo
© Copyright 2026 Paperzz
About Paperzz
DMCA / GDPR
Report