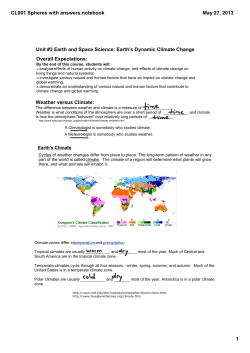
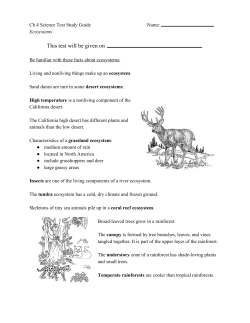
SYSTEMS ANALYSIS AND MODELING OF INTEGRATED WORLD SYSTEMS - Vol. II - Models of Biosphere Processes A.M. Tarko
MODELS OF BIOSPHERE PROCESSES
A.M. Tarko
Computing Center of the Russian Academy of Sciences, Moscow, Russia
Keywords: mathematical modeling, biosphere, anthropogenic actions, Le Chatelier
principle, deforestation, soil erosion, Kyoto protocol, carbon dioxide budget, seasonal
fluctuations, zones of plant degradation
Contents
U
SA NE
M SC
PL O
E –
C EO
H
AP LS
TE S
R
S
1. Introduction
2. Modeling of the Global Biosphere Cycles in the Biosphere
3. A Spatial Model of the Global Carbon Cycles in Atmosphere - Plants - Soil System
3.1 Description of the model
3.2 Computer Realization of the Model- Pre-industrial State of the Biosphere
3.3 Le Chatelier Principle and Stability of the Biosphere- Sustainable Development of
the Biosphere
3.4. Biosphere Dynamics under the Impact of Industrial CO2 Emissions, Deforestation,
and Soil Erosion
3.5. Carbon Dioxide Budget of Countries in 1995
3.6. Carbon Dioxide Budget of Biosphere
3.7. Estimation of Performance of the Kyoto Protocol to the UN Framework Convention
on Climate Change
3.8. Application the Control Theory in the Modeling
4. Modeling the Global Carbon and Nitrogen Cycle in Atmosphere - Ocean System
4.1. Description of the Spatial Carbon Cycle Model
4.2. Exchange Between Ocean and Atmosphere
4.3. Biotic Components
4.4. Complete Model
4.5. Results of Modeling
5. Modeling the Impact of Air Contamination on Forest Ecosystems
5.1. Description of the Model
5.2. Results of the Modeling
6. Conclusion
Glossary
Bibliography
Biographical Sketch
Summary
This paper presents the current state and perspective of mathematical modeling of the
biosphere. One of the models which are considered in the paper is a spatial model of
global carbon cycle in the atmospheric system of plants and soil. In this model
biosphere dynamics under the impact of industrial CO2 emissions, deforestation, and
soil erosion is investigated. Carbon dioxide budget of the whole biosphere in 1860-1995
and budget of countries in 1995 is calculated. It is shown that delay of beginning to
implement the Kyoto protocol to the UN Framework Convention on climate change for
©Encyclopedia of Life Support Systems (EOLSS)
SYSTEMS ANALYSIS AND MODELING OF INTEGRATED WORLD SYSTEMS - Vol. II - Models of Biosphere Processes A.M. Tarko
10 years does not have a significant role. Fulfillment of the Le Chatelier principle is
investigated. It is shown that if atmospheric carbon dioxide concentration is large
enough it is possible that this principle will not be carried out. In this case terrestrial
ecosystems will become the sink of carbon dioxide. The next model which is presented
here is a spatial model of carbon and nitrogen cycle in Atmosphere - Ocean system.
Spatial distribution of the seasonal fluctuations of carbon content as far as the partial
pressure of carbon dioxide is estimated. Finally a model is considered for contaminant
impact on ecosystems in a region. Birth and dynamics of zones of degradation for forty
years were reconstructed in modeling.
1. Introduction
U
SA NE
M SC
PL O
E –
C EO
H
AP LS
TE S
R
S
Now activity of mankind has resulted in a sharp global change of processes in the
biosphere. The change in nature spreads over the whoe globe and is obviously
irreversible in character. The pollution of three environments, air, land and water in
which live matter exists, aggravates:. There is a global increase of quantity of
greenhouse gases, carbon dioxide, methane, and chlorofluorocarbons (CFCs), in the
atmosphere, climate warming increases, functioning of ecosystems is been broken, the
landscapes head to a collapse, there is a cutting down of forests, and soil erosion.
It is clear now that if humankind does not change modern rates and technological
methods of biosphere resources usage it will result in a catastrophe for humankind. The
problem is to find the ecological, technological, economic, demographic preconditions
for overcoming the crisis.
In the finding acceptable ways of development in harmony with nature, mathematical
models are important. There are three main types of biosphere models: models of
biogeochemical cycles (such as models of global carbon cycle), models of shifting the
borders of plant communities (such as Holdridge life zone model), and models of
contaminant impacts on ecosystems. Three modern simulating models describing
dynamics of biosphere and its parts which are influenced by results of human economic
activity will be presented. Two of them are models of global biogeochemical cycles and
the third is model of contaminant impact on ecosystems in a region.
2. Modeling of the Global Biosphere Cycles in the Biosphere
Investigation of the global carbon cycle in the biosphere is important. On the one hand,
carbon is a component of live and dead organic matter of the biosphere and hence is the
indicator of ecological processes. On the other hand, it is present in the atmosphere as
carbon dioxide that defines the greenhouse effect and is a factor influencing the climate
of the planet. The next in importance is the nitrogen cycle.
The first mathematical model of global biogeochemical cycles is the model of V.A.
Kostizin which was published in 1935. In this model the global cycle of oxygen and
carbon in the system Atmosphere - Terrestrial Biota - Ocean - Crust is considered. The
model represents a system of seven ordinary nonlinear differential equations and is
investigated analytically.
©Encyclopedia of Life Support Systems (EOLSS)
SYSTEMS ANALYSIS AND MODELING OF INTEGRATED WORLD SYSTEMS - Vol. II - Models of Biosphere Processes A.M. Tarko
In the system of the equations it is possible to allocate two independent subsystems.
One of them represents the classical Volterra Predator-Prey system. Its analysis shows
the periodic solutions with "fast" fluctuations of weight of plants and animals with a
period 15-140 years. Other subsystem at the chosen parameters gives the solution of a
type "steady focus" and demonstrates "long" fading fluctuations in the atmosphere ocean system with the period of millions years. The amplitude of fluctuations is
increased with amplification of volcanic activity.
U
SA NE
M SC
PL O
E –
C EO
H
AP LS
TE S
R
S
It may be said that the modern models of global cycles of elements have appeared after
H.E. Suess who measured the ratio of radioactive carbon C14 to stable C12 in wood rings
and on this basis made a conclusion that the concentration CO2 in the atmosphere over
the last decades increased. Suess found out that the ratio of the atmospheric radioactive
C14, which is constantly formed in the atmosphere due to the action of space particles, to
stable C12 is changed as a result of "dilution" of atmospheric CO2 by a flow of CO2 from
fossil fuels which practically do not contain C14 (the period of the half-decay of C14 is
equal to 5730 years).
Early models of global carbon cycle described the dynamics of both C12, and C14. They
took into account of a very simple form (small amount of «boxes» - variables) of
processes in the Atmosphere - Ocean and Atmosphere - Terrestrial Vegetation systems.
In the later models the number of boxes was increased: horizontal and vertical dividing
of ocean and spatial dividing of land ecosystems were taken into account. Then
appeared models which took into account other biogeochemical cycles: nitrogen etc.
The majority of early models focused on calculation the forecasts of CO2 concentration
in the atmosphere. Qualitative research was carried out only in connection with the
analysis of accuracy of atmospheric CO2 and temperature forecasts. In contrast,
nowadays research is directed to investigate the role of separate terrestrial ecosystems or
separate regions of ocean in the absorption of CO2. The feedback of terrestrial
ecosystems changes to atmospheric CO2 and climate change is of interest now.
Modern models are focused either on detailed description of elements of
biogeochemical cycles such as increasing the spatial and/or time resolution or on
investigation of new data of measurements such as investigation of fluctuations of the
atmospheric CO2 concentration.
Here we consider two global models. One of them is the spatial model of global carbon
cycle in the Atmosphere - Plants - Soil (APS) system. The next is a spatial model of
carbon and nitrogen cycle in the Atmosphere - Ocean (AO) system. The behavior of
complete Atmosphere - Plants -Soil – Ocean system influenced by results of
anthropogenic activity will also be investigated.
3. A Spatial Model of the Global Carbon Cycles in Atmosphere - Plants - Soil
System
3.1 Description of the model
This model was developed by A.M. Tarko. In the APS model all land territory is
©Encyclopedia of Life Support Systems (EOLSS)
SYSTEMS ANALYSIS AND MODELING OF INTEGRATED WORLD SYSTEMS - Vol. II - Models of Biosphere Processes A.M. Tarko
divided to into cells of size 0.5x0.5o of a geographical grid. It is supposed that in each
cell there is vegetation of one type according to the chosen classification. Two kinds of
classification are used: 1. N.I. Bazilevich and L.E. Rodin. 2. J.S. Olson. Processes of
plant growth and death, soil forming and decomposition are taken into consideration.
These processes are expressed as carbon exchange flows between atmosphere, plants,
and soil in each cell of the land.
The model is described by system of ordinary nonlinear differential equations. In each
cell of land with a number i ( i = 1,..., I ) the ecosystem is characterized by quantity of
carbon per unit area in phytomass of living plants Bi and in humus of soil Di . Let the
area of the cell be denoted by σ i . A time unit accepted in the model is one year.
U
SA NE
M SC
PL O
E –
C EO
H
AP LS
TE S
R
S
The total quantity of carbon in the atmosphere is denoted by C . The climate in a given
cell is characterized by annual surface air temperature Ti and annual precipitation Pi .
The initial values of Bi , Di , Ti , Pi and Ci will be denoted by Bio , Dio , Tio , Pio and Cio .
The values of Ti and Pi for each cell of land depend on the quantity of CO 2 in
atmosphere because of the greenhouse effect and are calculated with the help of a
General Circulation Model (GCM).
Let us assume that annual production of vegetation in each cell depends on the
atmospheric CO2 concentration, temperature, and precipitation in a given cell and does
not depend on the ecosystem type.
The dependence of humus decomposition rate on temperature and precipitation in a
given cell was also taken into account. According to the model the quantity of humus in
each cell in a steady state does not depend on the ecosystem type and is a function H of
Ti and Pi : H = H (Ti , Pi ) , so that Dio = H (Tio , Pio ) . The specific rate of humus
decomposition h is a function of Ti and Pi : h = h(Ti , Pi ) .
It is supposed that in the absence of anthropogenic CO2 emissions into the atmosphere
the quantity of carbon in the biosphere is constant. Prior to the beginning of
anthropogenic influences the system was in a steady state (usually 1860 is accepted as
the year when the industrial era began).
Three anthropogenic impacts on the biosphere resulting in CO2 growth in atmosphere
are taken into consideration. The first source is fossil fuel burning (industrial releases).
Let V be industrial releases of carbon flow into the atmosphere. The second
anthropogenic source of emissions is cutting down of the trees. The phytomass of trees
which are cut is decomposed with some delay and its carbon in the form of CO2 goes to
the atmosphere. Let Bd be the amount of carbon in trees that are cut down. The third
source is soil erosion resulting from improper land use. In the model the dead organic
matter of the soil which is decomposed with some delay and its carbon as CO2 goes into
the atmosphere. Part of the decomposed carbon goes to the rivers and then to the ocean.
Let De be the sum of carbon which was carried out because of land use.
©Encyclopedia of Life Support Systems (EOLSS)
SYSTEMS ANALYSIS AND MODELING OF INTEGRATED WORLD SYSTEMS - Vol. II - Models of Biosphere Processes A.M. Tarko
Dynamics of carbon in a system APS is described by the following system of equations:
dBi / dt =ν i Qi − mi Bi − k di Bi ,
dDi / dt = ε (mi Bi + (1 − ν i ) Qi ) − h(Ti , Pi ) Di − k ei Di ,
I
dBd / dt = ∑ (k di Biσ i ) − qd Bd ,
(1)
i =1
I
dDe / dt = ∑ (k ei Diσ i ) − qe De − qm De ,
i =1
I
dC / dt = −∑ ((1 − ε i )(mi Bi + (1 − ν i )Qi ) − h(Ti , Pi ) Di )σ i + qd Bd + qe De + V ,
i =1
U
SA NE
M SC
PL O
E –
C EO
H
AP LS
TE S
R
S
i = 1,..., I .
Here, mi , ε i , kei , k di , qd , qe , qm are coefficients, Qi = Q(C , Ti , Pi , Bi ) = Q is annual
production of the plants per unit area.
There are two kinds of dependencies of annual production. The first dependence was
developed by C.D. Keeling. In this case annual production depends on atmospheric CO2
concentration and on plants phytomass:
Q = Fo (1 + β ln(C / C o ))( B / B o ) 2 / 3 .
(2)
Here Fo is annual production at the initial state, B is plants phytomass, expressed in
carbon units, C o , B o are initial values of corresponding variables, and β is a coefficient.
The second kind of dependence was developed by A.M. Tarko. In this case annual
production also depends on atmospheric CO2 concentration but does not depend on
plants phytomass and depends on temperature and precipitation:
Q = F (T , P)(1 +
δ
10
(C / C o − 1)) .
(3)
These two kinds of dependencies define different dynamic properties of the system but
in position of variables which are not far from a steady state simulating experiments
show that difference is not large.
The Dependence of annual production F (T , P) on temperature and precipitation, which
was developed by A.M. Tarko, will be used. It expresses in a tabulated form the
nonlinear dependence of annual production on temperature and precipitation.
Coefficient ν i expresses part of annual production, which goes to trees. So flow ν i Qi
expresses flow of carbon to the trees and (1 − ν i )Qi is a foliage fall down. If ν i = 0 ,
then foliage fall down is equal to annual production and in a given cell there is a
grassland ecosystem so variable Bi is a quasi variable.
©Encyclopedia of Life Support Systems (EOLSS)
SYSTEMS ANALYSIS AND MODELING OF INTEGRATED WORLD SYSTEMS - Vol. II - Models of Biosphere Processes A.M. Tarko
Let k di Bi be a flow of carbon of cut down plants, kei Di is soil erosion. Flow qd Bd is
decomposed part of trees which were cut down, flow qm De is decomposed part of dead
organic matter which was carried out due to erosion, flow qo De is a flow from
decomposed soil to the ocean.
3.2 Computer Realization of the Model- Pre-industrial State of the Biosphere
A computer program complex was developed to make calculations on the model. It
works under the control of Windows 95/98/NT. In the case of 0.5x0.5o resolution the
number of terrestrial cells equals to about 60,000 and so about 120,000 differential
equations were solved.
U
SA NE
M SC
PL O
E –
C EO
H
AP LS
TE S
R
S
Validation of the model was performed according to procedure that is traditional in
global CO2 cycle models. In different simulation experiments coefficient δ was varied
until the curve of atmospheric CO2 matches the data from measurements: in 1860 (ice
cores data) and in 1959-1997 (direct measurements at different CO2 monitoring
stations). In the result of identification, the chosen value of δ appeared to correspond to
its values in experiments in plant laboratories.
Dividing the territory into cells 0.5x0.5o allowed allocating all countries of the world
with size larger than 50x50 km.
The computer map of annual production of the world vegetation at its pre-industrial
state is shown in Figure 1. The map is based on the annual production dependence of
A.M. Tarko. Comparison of observed values at different points of the Earth and
calculated ones shows that their differences do not exceed the accuracy of
measurements.
Figure 1. Computer map of annual production,
kg C/(m2 yr.)
©Encyclopedia of Life Support Systems (EOLSS)
SYSTEMS ANALYSIS AND MODELING OF INTEGRATED WORLD SYSTEMS - Vol. II - Models of Biosphere Processes A.M. Tarko
A computer calculated map humus storage adequately reproduces its distribution all
over the Earth. The maximum values of humus are reproduced in grassland ecosystems,
containing chernozems.
-
TO ACCESS ALL THE 22 PAGES OF THIS CHAPTER,
Visit: http://www.eolss.net/Eolss-sampleAllChapter.aspx
U
SA NE
M SC
PL O
E –
C EO
H
AP LS
TE S
R
S
Bibliography
Begelman G.Z., Tarko A.M. (1999). Model of the Global Biosphere Carbon Cycle with High Spatial
Resolution 0.5x0.5 degree. Transactions on Applied Mathematics, Computing Center of the Russian Ac.
Sc. Moscow, 26 pp. (in Russian). [This paper presents the present day version of the model of the global
spatial carbon cycle in the Atmosphere - Plant Soil system developed by A.M. Tarko].
Chan Y.H., Olson J.S., Emanuel W.R. (1979). Simulation of land-use patterns affecting the global carbon
cycle. Environmental Sciences Division Publication N 1273. Oak Ridge National Laboratory. [This report
contains description of the model of global carbon cycle].
Bazilevich N.I., Rodin L.E. (1967). Maps of Productivity and Biological Turnover of the Main Land
Vegetation Types. Report of the All-Union Geographical Society, V.99 N 3, 190-194. (in Russian). [This
paper contains well known world classifications of terrestrial vegetation and corresponding maps].
Eriksson E., Welander P. (1956). On a mathematical model of the carbon cycle in nature. Tellus. V. 8,
155-175. [One of the first simulating models of global carbon cycle is described in this paper].
Marland G., Boden T., Brenkert A., Andres R. J., and Johnston C. (1999). Global, Regional, and National
Annual CO2-Emissions from Fossil-Fuel Burning, Hydraulic Cement Production, and Gas Flaring:
1751-1996. NDP-030. Oak Ridge National Laboratory. [This Numeric Data Package presents data on
CO2 releases from mentioned in its title sources. These data are very useful for modeling spatial carbon
cycle].
Nefedova E.I. Pervanyuk V.S., and Tarko A.M. (1998). A Spatially Distributed Model of Global Carbon
Cycle in System Atmosphere - Ocean System. Moscow, Transactions on Applied Mathematics,
Computing Center of the Russian Ac. Sc. Moscow, 25 pp. (in Russian). [This contains the spatial model
of global carbon cycle in the Atmosphere - Ocean system]
Olson J. S., Watts J. A., and Allison L. J. Major World Ecosystem Complexes Ranked by Carbon in Live
Vegetation: A Data Base. NDP-017 (1985), Oak Ridge National Laboratory. [This data base contains well
known world classifications of terrestrial vegetation. They characterize the use and vegetative cover of
the Earth's land surface with a 0.5 degree x 0.5 degree grid].
Biographical Sketch
Alexander M. Tarko, Dr. Sci. (1992), Ph.D. (1978) is a Senior Research Fellow of Computing Center of
the Russian Academy of Sciences, Moscow, Russia. He is a Professor of Mathematical Cybernetics at
Moscow Institute of Physics and Technology and since 1993 gives lectures on System Analysis,
Mathematical Ecology, and Problems of Environment. In 1995 he was elected as Academician of
International Informatization Academy and in 1996 as Academician of Russian Academy of Natural
©Encyclopedia of Life Support Systems (EOLSS)
SYSTEMS ANALYSIS AND MODELING OF INTEGRATED WORLD SYSTEMS - Vol. II - Models of Biosphere Processes A.M. Tarko
Sciences. Also since 1991 he is a Scientific Secretary of Russian National Committee for SCOPE
(Scientific Committee on the Problems of the Environment).
Since 1975 he has been dealing with problems of human impacts on the biosphere. His particular field of
research was modeling global and regional biogeochemical cycles of carbon dioxide and nitrogen in
biosphere. He developed a mathematical approach to investigate the biosphere stability, created a set of
mathematical models of the biosphere and received forecasts of biosphere dynamics.
Now his research focuses on developing high resolution spatially distributed models of global
biogeochemical cycles, simulating the spatial regional atmospheric pollution impact on forest ecosystems,
investigating the principles of biosphere and society self-regulation, and the sustainable biosphere
development principle. He also works in understanding the evolution of human civilization under the
degradation of biosphere resources, and its renewal as the result of scientific and technical progress.
U
SA NE
M SC
PL O
E –
C EO
H
AP LS
TE S
R
S
Principal investigator of several governmental grants, expert in the Expert Committee of the Russian
Ministry of Nature Resources, he divides his time between fundamental science, environmental
consulting, and teaching. His research is reported in more than 150 publications.
©Encyclopedia of Life Support Systems (EOLSS)
© Copyright 2026 Paperzz