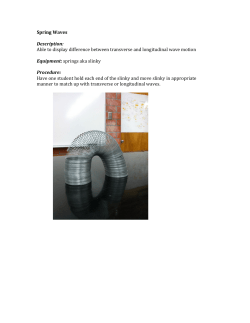
Constructing Adjusted Net
National Income
Presented by: Esther Naikal, World Bank
Date: April 6-8, 2015
WAVES © 2014
Wealth Accounting and the Valuation of Ecosystem Services
www.wavespartnership.org
Title Date
1
Adjusting National Accounts
Aggregates
How can the costs of using up or damaging the
environment be reflected in national accounts
aggregates (e.g., GDP, GNI, Gross Saving)?
One measure that the World Bank calculates:
•  Adjusted Net National Income (ANNI)
WAVES © 2014
Title Date
2
Adjusted Net National Income
ANNI =
Gross National Income
– Consumption of Fixed Capital
– Depletion of Natural Capital (Energy, Minerals, Timber)
ANNI is a measure of the available income that can be
consumed or invested to increase the nation’s future
consumption
ANNI is within the SNA asset boundaries
WAVES © 2014
Title Date
3
Measuring Adjusted Net National Income
Gross National Income
Sum of value added by all resident producers plus
any product taxes (less subsidies) not included in the
valuation of output plus net receipts of primary
income (compensation of employees and property
income) from abroad.
Consumption of Fixed
Capital
Replacement value of capital used up in the process
of production.
Depletion of Natural
Capital
Subsoil Depletion
(10 minerals, 4 energy resources)
Estimated
directly
Net Forest Depletion
Estimated
directly
Adjusted Net National
Income (ANNI)
WAVES © 2014
ANNI = Gross National Income – Consumption of
Fixed Capital – Depletion of Natural Capital
Title Date
4
Gross National Income
Definition: GNI (formerly GNP) is the sum of value added by all
resident producers plus any product taxes (less subsidies) not
included in the valuation of output plus net receipts of primary
income (compensation of employees and property income) from
abroad.
Data Requirements
Data Source
Gross National Income World Development Indicators, WDI
http://data.worldbank.org/indicator/NY.GNP.MKTP.CD.
Source: World Bank national accounts data, and OECD National
Accounts data files.
WAVES © 2014
Title Date
5
Gross National Income
GNI vs. GDP
•  GNI = GDP + net income from abroad.
•  GNI includes the value of all goods and services
produced by nationals whether in the country or not.
WB uses national income rather than domestic product, as
GNI is a more appropriate income measure in countries
where largely foreign-operated extractive industries are
substantial because payments to foreign-owned factors are
often considerable
WAVES © 2014
Title Date
6
Gross National Income: Philippines
Philippines: GNI data available for 1960-2013
Metadata from WDI for the Philippines:
•  Source for GNI and net income from abroad is changed to national
statistical office from central bank.
•  April 2012 database update: National accounts data were revised for
1998 onward. Because intellectual property products are now
reported as a part of gross fixed capital formation, gross domestic
product (GDP) in current prices averaged 4 percent higher than
previous estimates.
WAVES © 2014
Title Date
7
Consumption of Fixed Capital
Definition: Replacement value of capital used up in the
process of production.
•  A standard item in the SNA, consumption of fixed capital (CFC)
represents the “decline…in the current value of the stock of fixed
assets owned and used by a producer as a result of physical
deterioration, normal obsolescence or normal accidental
damage” (UN 2008: 123). Fixed assets are limited to manufactured
capital used in the production process and exclude natural assets
such as land.
Data Requirements
Primary Data Source
Consumption of Fixed Capital
UN Statistics Division, National Accounts Official
Country Data, Tables 1.3 and 4.1, http://
data.un.org
WAVES © 2014
Title Date
8
Consumption of Fixed Capital: Philippines
Philippines: CFC data available (UNData Table 1.3) for
1963-2012
•  WB gap-fills estimate for year 2013 by mimicking year-on-year
trends in the Penn World Table (PWT) estimates of CFC/GDP.
World Bank Methodology for Gap-Filling
•  Country-reported data from the UN and OECD are given first priority.
•  Where UN/OECD data are unavailable, the Penn World Table
(PWT) estimates are used.
•  Where PWT estimates are unavailable, regression-based estimates
are used.
WAVES © 2014
Title Date
9
Depletion of Natural Capital
What natural resources are included in the 2008 SNA asset
boundary?
•  Land
•  Mineral and energy resources
•  Non-cultivated biological resources (e.g., timber, fisheries)
•  Water resources
•  Other natural resources (e.g., radio spectra)
World Bank approach for ANNI covers:
•  Mineral and energy resources (i.e., subsoil assets)
•  Timber resources
WAVES © 2014
Title Date
10
What is Depletion?
(Monetary) depletion of natural resources:
•  (Non-Renewable) The depletion of natural resources covers the
reduction in the value of deposits of subsoil assets as a result of the
physical removal and using up of the assets.
•  (Renewable) The depletion of natural forests, fish stocks in the open
seas and other uncultivated biological resources included in the
asset boundary as a result of harvesting, forest clearance, or other
use beyond sustainable levels of extraction should be included here.
Source: SNA 2008.
WAVES © 2014
Title Date
11
Why Measure Depletion?
•  The SNA treats the gradual using up of produced capital buildings, structures, machines and other equipment - as a
cost of production
•  However, in standard measures of income, the using up
(depletion) of natural capital (e.g., mineral resources,
forests, fish stocks), is not regarded as a cost of production
•  Incomes generated from exploiting natural capital may
appear high in the short term, but may not be sustainable in
the long run
WAVES © 2014
Title Date
12
Depletion, a Component of Resource Rent
Source: SEEA, 2012
WAVES © 2014
Title Date
13
Natural Capital Depletion: WB Approach
As illustrated in following slides, WB takes a
simplified approach to measuring depletion of
natural capital.
•  WB methodology is constrained by the following objectives:
•  Produce annual estimates
•  Global country coverage
•  Publically available datasets
WAVES © 2014
Title Date
14
[WB] Energy and Mineral Resources
Energy Resources
Metal and Mineral Resources
•  Oil
•  Bauxite
•  Natural Gas
•  Hard Coal
•  Soft Coal
•  Copper
•  Gold
•  Iron Ore
•  Lead
•  Nickel
Note on omitted resources:
We are limited by data availability,
especially information on reserves and
production costs, as well as time
constraints in producing a global and
annual data series.
WAVES © 2014
•  Phosphate
•  Silver
•  Tin
•  Zinc
Title Date
15
[WB] Energy/Mineral: Methodology
Calculations per commodity:
•  Resource Rents = Production x Unit Rent
= Production x (Unit Price – Unit Cost)
•
If Unit Rent < 0, then cap at 0.
•  Exhaustion time = years to depletion (or, life of resource)
(reserves/current production), capped at 25 years
•  “Wealth” = Net Present Value of Resource Rents,
discounted at 4%, over exhaustion time
•
Assumes that future rents are constant and equal to current rent
•  Depletion = “Wealth” / Exhaustion time
WAVES © 2014
Title Date
16
[WB] Energy/Mineral : Data, Assumptions
Data Requirements (Annual)
Data Source (WB Methodology)
Production
See following slides.
Unit price
Unit cost of production
Cost trend
Proven reserves
Assumptions
WB Methodology
Cap on exhaustion time of
resource
Twenty-five years (consistent across all
wealth components)
Discount rate
4%
WAVES © 2014
Title Date
17
[WB] Energy/Mineral : Excel Exercise
See tab “Oil Exercise” [ANNI_Philippines.xlsx]
Instructions: With data provided, calculate oil depletion
•
Helpful tip: Use Excel’s PV function
•  Question: What is the impact of capping the exhaustion time or
keeping as is?
See tab “Phosphate Exercise” [ANNI_Philippines.xlsx]
Instructions: With data provided, calculate phosphate
depletion
•  What issues arise in this example?
WAVES © 2014
Title Date
18
[WB] Energy/Mineral : Data – Production
PRODUCTION
Frequency Coverage
Data Source(s)
Oil, Natural Gas
Updated
annually
Countryspecific
International
Energy Agency
(IEA), British
Petroleum (BP),
United Nations
Monthly Bulletin of
Statistics
(UNMBS)
Hard Coal, Soft Coal
Updated
annually
Countryspecific
IEA, UNMBS
Metals and Minerals:
Updated
annually
Countryspecific
USGS Minerals
Yearbook
Bauxite, Copper, Gold, Iron Ore,
Lead, Nickel, Phosphate, Silver,
Tin, Zinc
WAVES © 2014
Title Date
19
[WB] Energy/Mineral : Data – Price
UNIT PRICE
Frequency Coverage
Data Source(s)
Oil, Natural Gas
Updated
annually
World price
World Bank’s
Global Economic
Prospects (DEC)
Hard Coal, Soft Coal
Updated
annually
World price
World Bank’s
Global Economic
Prospects (DEC)
Metals and Minerals:
Updated
annually
World price
World Bank’s
Global Economic
Prospects (DEC)
Bauxite, Copper, Gold, Iron Ore,
Lead, Nickel, Phosphate, Silver,
Tin, Zinc
WAVES © 2014
Title Date
20
[WB] Energy/Mineral : Data – Cost
UNIT COST
Frequency Coverage
Data Source(s)
Oil, Natural Gas
Estimates
derived from lit
review; not
updated
Country-specific
(limited), and
region-specific
OPEC Review AlAttar and Alomair
(2005), IMF World
Economic Outlook
2005
Hard Coal, Soft Coal
Estimates
derived from lit
review; not
updated
Country-specific
(limited), and
region-specific
Various country case
studies
Metals and Minerals:
Estimates
derived from lit
review; not
updated
Country-specific
(limited), and
region-specific or
country proxy
U.S. Bureau of
Mines: various
country estimates
Bauxite, Copper, Gold, Iron Ore,
Lead, Nickel, Phosphate, Silver, Tin,
Zinc
Cost trend (Energy): Trend in
average costs from 5 major oil and
gas companies
Updated
annually
Cost trend (Minerals):
Manufactures Unit Value (MUV)
index
Updated
annually
WAVES © 2014
OPEC Annual
Statistical Bulletin
World index
World Bank’s Global
Economic Prospects
Title Date
21
[WB] Energy/Mineral : Data – Reserves
RESERVES (proven)
Frequency Coverage
Oil, Natural Gas
Updated
annually
Country-specific BP Statistical
(major
Review of World
producers);
Energy
missing countries
use regional
figures
Hard Coal, Soft Coal
Years
2005,
2008, 2011
Country-specific
U.S. Energy
Information
Administration
(EIA)
Metals and Minerals:
Updated
annually
Country-specific
(major
producers);
missing countries
use “Other”
category
USGS Minerals
Yearbook/
Commodity
Summaries
Bauxite, Copper, Gold, Iron Ore,
Lead, Nickel, Phosphate, Silver,
Tin, Zinc
WAVES © 2014
Data Source(s)
Title Date
22
Energy/Mineral Reserves
SEEA: Mineral deposits are classified according to:
•  Economic and social viability
•  Field project status and feasibility
•  Geological knowledge
Knowledge deposits are categorized into three classes:
•  Class A: Commercially Recoverable Resources
•  Class B: Potentially Commercially Recoverable Resources
•  Class C: Non-Commercial and Other Known Deposits
For valuation, SEEA methodology uses Class A: Commercial
Recoverable Resources. WB also uses proven reserves
WAVES © 2014
Title Date
23
[WB] Energy and Mineral Depletion:
Suggested Improvements
Extraction costs ideally assessed at the mine-level
•
Problems with unit cost (average) approach
•
But significant data challenges for WB objectives of annual estimates
Expand beyond proven reserves for estimation of exhaustion
time
•
BUT careful to be consistent with SEEA
Remove 25 year cap on exhaustion time
Expand list of commodities (e.g., diamonds, platinum metals)
Further analysis and recommendations:
•  Recent Scoping Report
WAVES © 2014
Title Date
24
Energy and Mineral Depletion: Philippines
In WB database, production data (therefore valued) for:
Oil, natural gas, hard coal, soft coal
Copper, gold, nickel, phosphate, silver, zinc
WAVES: Mineral Accounts
Status and progress?
WAVES © 2014
Title Date
25
Timber Resources
Forest resources are renewable, making them
fundamentally different from non-renewable
resources.
• Because forests can regrow, the extraction of wood is
not necessarily a disinvestment in the future.
• What is a disinvestment is unsustainable extraction of
wood beyond natural rates of forest growth and
resource replacement
WAVES © 2014
Title Date
26
Depletion of Timber Resources
Depletion of forest resources is the value of that portion of
wood extraction which exceeded natural incremental
growth in the country for a particular year.
• If natural incremental growth is greater than timber
harvest in a given year, then net forest depletion is zero.
Forest depletion should not be confused as being a
monetary value of deforestation. The harvesting of timber
is different from deforestation, which represents a
permanent change in land use.
WAVES © 2014
Title Date
27
[WB] Net Forest Depletion: Methodology
Calculations:
Revenue ($) = Production x Unit Price
Resource Rent ($) = Revenue x Rental Rate, where
•  Rental Rate = (Unit Price – Unit Cost) / Unit Price
Unit rent ($/m3) = Resource Rent / Production
Natural Growth (m3) = annual commercial increment x forest
productive area
Overharvest (m3) = Production – Natural Growth
•  If negative, then replaced with 0.
Depletion ($) = Overharvest x Unit Rent
WAVES © 2014
Title Date
28
[WB] Net Forest Depletion: Data
RENT
Frequency
Annual Production
(3 categories: industrial
roundwood (coniferous),
industrial roundwood
(non-coniferous), wood
fuel) (m3)
Unit Price per wood
category (export value/
export quantity) ($/m3)
Rental Rate
Updated Annually All countries
FAO
Updated Annually All countries
FAO
Based on
Regional
previous literature (derived averages
review
of country case
studies)
Fortech, 1997;
Whiteman, 1996; Tay et
al, 2001; Lopina et al,
2003: Haripriya, 1998;
Global Witness, 2001;
Eurostat, 2002.
(PHL: 39.2%)
WAVES © 2014
Coverage
Data Source(s)
Title Date
29
[WB] Net Forest Depletion: Data
NATURAL GROWTH
Frequency Coverage
Data Source(s)
Forest Productive Area
(ha)
Updated every
five years
All countries
Table 7: Designated functions of
forest – total area with function 2005.
Source: Global Forest Resources
Assessment (FRA), FAO
Annual Commercial
Increment (m3/ha/yr)
Based on
previous
literature
review; not
updated since
All countries
Source: "Potential Productivity" map
(Figure 2.3, A. Mather, Global Forest
Resources, Belhaven Press,
London, 1990) and other country
specific studies and data sources;
under the guidance of a WB forestry
expert.
(PHL: 1.5)
WAVES © 2014
Title Date
30
[WB] Net Forest Depletion: Excel Exercise
See tab “Net Forest Exercise” [ANNI_Philippines.xlsx]
Instructions: With data provided, calculate net forest depletion
•  Question: If countries have zero net forest depletion by our
methodology, does this mean there is zero deforestation?
•  Question: Within this simple framework, what actions (aside
changes in prices and costs) would reduce net forest depletion?
WAVES © 2014
Title Date
31
[WB] Net Forest Depletion:
Suggested Improvements (near future)
Improve price estimates associated with timber
production
• Use country domestic prices
Improve country-specific rental rates
• GTAP model results
Further analysis and recommendations:
•  Recent Scoping Report
WAVES © 2014
Title Date
32
WB Estimates for Philippines (prelim)
2010 US$,
million
Gross National Income and Adjusted Net National Income
300000
250000
200000
150000
100000
50000
0
2000
2001
2002
2003
2004
2005
2006
2007
2008
2009
2010
2011
2012
2013
-50000
Net forest depletion
Mineral depletion
Energy depletion
Consumption of fixed capital
Gross National Income
Adjusted Net National Income
WAVES © 2014
Title Date
33
Questions?
WAVES © 2014
Title Date
34
© Copyright 2026 Paperzz