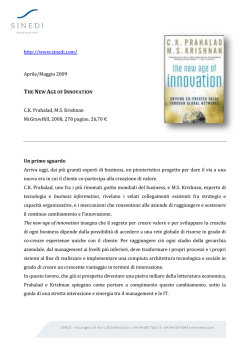
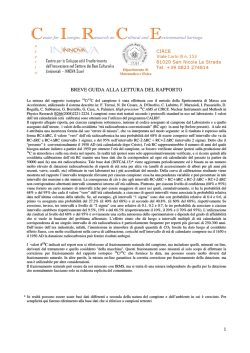
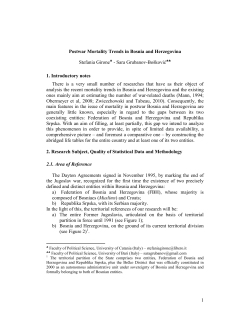
STATISTICA, anno LXXI, n. 1, 2011
AGE AND CAUSE MORTALITY STRUCTURE IN THE ITALIAN REGIONS
AT THE BEGINNING OF THE HEALTH TRANSITION:
A RESEARCH PROJECT
L. Del Panta, L. Pozzi
1. INTRODUCTION AND BACKGROUND
In this paper we present the first preliminary results of a broader project aiming at exploring Italian mortality structure (by age and cause of death) at the regional level in the last decades of the 19th Century. These years, corresponding to
the beginning of the health transition process, were crucial in the Italian experience. Up to now, scholars’ attention (Caselli, 1990, 2007; Pozzi, 2000; Del Panta,
1990, 1996) has been mainly devoted to identify the factors responsible for the
different territorial trends recorded during that process.
Del Panta (1996, pp. 176-77) has noted increasing geographical disparities in
terms of both levels and structure by age and cause in the first phase of mortality
decline. Indeed, the most developed areas of the country more rapidly succeeded
in implementing effectively and efficaciously various hygienic and prophylactic
interventions suggested by the new discoveries in bacteriology and medicine. On
the opposite, the economically and socially backward regions were not able to fill
the historical gap with the rest of the country until the second half of the 20th
century.
The study of the transition process and the interpretation of the determinants
of the regional differences require a deepen analysis of mortality structure by age
and cause. The Italian official statistical data for the years immediately after the
national unification enable us to obtain good estimates of the overall level and
age structure of mortality, at the national, regional and also provincial (even if
with some limitations)1 level. More serious obstacles have to be challenged in the
study of cause mortality structure.
The collection of statistical data on causes of death started in Italy in 1881, but
it was limited, until 1886, to the main cities of the provinces and districts. Since
1 At the regional level, a diachronic annual estimate of life expectancy at birth for each region
since 1861 was carried out (Breschi, Pozzi, Rettaroli 1994) with the technique of inverse projection.
It is also possible to construct regional (and in some cases provincial) life tables on the dates of censuses (Del Panta 1998).
24
L. Del Panta, L. Pozzi
1887, on the contrary, these data became available for the whole country (Pozzi,
2000). Starting from that date, information on causes of death allows for a complete and detailed analysis only at the national level. Indeed, while at the country
level the General Directorate of Statistics published yearly death statistics classified according to age and cause, regional and provincial data are classified only by
cause or alternatively by age.
The unique and notable exception refers to 1888. For this year, in fact, the
combined classification by age and cause is available also at the regional level2.
The principal aim of our project is therefore a detailed analysis of mortality patterns at the regional level, based on a careful exploitation of this exceptional statistical source, which has never been used in a systematic way up to now.
Nevertheless we must emphasize that our analysis could take advantage of the
significant results referring to Italian regional mortality differentials carried out in
previous studies, whose authors were able to exploit, using appropriate methods,
the limited information available on mortality by cause at the regional (Caselli,
1997) and provincial (Pozzi, 2000) level.
The mentioned volume includes regional tables with the combined classification by age and cause for the year 1888. Deaths are distributed under 169 items3,
according to a list proposed by a medical Commission in 1881, and revised by
another Commission in 18834. Finally, for each cause item, the data are classified
by sex and age groups, which are very detailed in case of children deaths5.
We do not intend here to deal with the many problems encountered in the use
of the statistical data on causes of death and refer to a previous larger discussion
on this subject proposed by Lucia Pozzi (2000)6. In any case, in our analysis, the
comparisons between the different regions refer to a single period, and this
avoids having to solve the more serious problem of comparability over time that
Bernabeu Mestre (1993, p. 14) called “the diachronic problem”.
We should rather mention a more relevant problem affecting the statistical
data on causes of death particularly in the first years of data collection. As it is
well known, the proportion of deaths due to unknown or poorly defined causes is
considered an appropriate indicator of the quality of these kind of data. We
should recall here that in 1888 this proportion (about 2,6 per cent at the national
level), was highly differentiated at the territorial level. The highest proportion was
recorded in Sardinia, where deaths from unknown causes exceed 10 percent.
Even in Piemonte the proportion was very high (6.4 percent), and in other three
regions (Abruzzi, Basilicata and Calabria), the percentage was more elevated than
the national average. The official sources of the time (Ministero Agricoltura, In2 Ministero
di Agricoltura, Industria e Commercio 1890.
addition, another item includes deaths whose cause is undetermined.
4 Ministero di Agricoltura, Industria e Commercio 1892, p. V.
5 The deaths within the first year of life are divided into two groups: from 0 to 30 days; from 30
to 365 days. Afterwards, the classification (in complete years) is as follows: 1-4, 5-9, 10-14, 15-19,
20-29, 30-39, 40-49, 50-59, 60-79, 80+, unknown age, total. Besides, as far as the first five years of
life are concerned, deaths are also broken down according to legitimacy.
6 We refer in particular to paragraph II.2 of the cited volume, whose title is “Le fonti statistiche
sulle cause di morte”.
3 In
Age and cause mortality structure in the Italian regions etc.
25
dustria e Commercio, 1890) attested that the major number of unknown causes
of deaths referred to infants and very young children dead without medical assistance in the mountain villages of the country. Thus, a certain caution is required
in the interpretation of regional differences that emerge from the analysis of our
data. This is particularly true for Sardinia which had a fairly unique cause mortality structure, characterized by an exceptionally high incidence of malaria and a
surprisingly moderate frequency of many other causes.
In view of a preliminary analysis, we have decided to group the 169 items according to the 18 categories of the International Nosological Classification established in 1938 and adopted by the Istituto Centrale di Statistica in 19427. As we
shall see in the discussion of the results, we have also provided a combination of
items whose figures did not justify a separate analysis.
Furthermore, in order to analyze and compare regional mortality structures, we
had to address the problem of calculating age8 and cause specific mortality rates.
In fact, we were obliged to estimate the denominators of the probabilities of
death and mortality rates, as we did not have census data for 1888. We have
solved this problem by performing some interpolations between 1881 and 1901
census data. Only for children, we used a different criterion to estimate the population living at 30 June 1888. Starting from the annual quota of births, year by
year, we applied the respective survival probabilities drawn from the 1881-82 regional life tables9.
In conclusion, we have reconstructed, for each region and for the country, a
matrix of specific death rates by age groups and causes. From these matrices we
have extracted the data allowing the first analyses whose results will be presented
in the next sections.
7 See Istituto Centrale di Statistica del Regno d’Italia (1942). Below are the abbreviated names of
the categories: I. Infectious and parasitic diseases; II. Cancer and other malignant neoplasms; III.
Rheumatic diseases and nutritional diseases; IV. Blood disorders; V. Chronic poisoning; VI. Diseases of the nervous system; VII. Diseases of the circulatory system; VIII. Diseases of the respiratory system; IX. Digestive diseases; X. Diseases of the urinary and genital system; XI. Maternal
conditions; XII. Skin diseases; XIII. Bone diseases; XIV. Congenital anomalies; XV. Perinatal conditions; XVI. Senility; XVII. Violent and accidental deaths; XVIII. Not determined causes of death.
The cited volume contains a “Dictionary of diseases” which has enabled the grouping of the 169
items in the 18 categories that were listed above.
8 As regards the first year of life, we calculated the probability of dying within the first month
and within the next eleven months. For the following ages we calculated specific mortality rates for
the groups: 1-4, 5-19, 20-39, 40-59, 60+.
9 The survival probabilities drawn from the 1881-82 life tables might slightly overestimate the
mortality of the cohorts examined. These cohorts were born in the immediately following years,
characterized by a slight decline in infant and child mortality. We supposed that this alleged minor
error could be compensated by emigration that has not been considered. In fact, emigration could
have reduced, even if minimally, the children cohorts between the birth and the date of 30 June
1888.
26
L. Del Panta, L. Pozzi
2.
A FIRST LOOK AT THE TERRITORIAL MORTALITY DIFFERENCES DURING THE LAST TWO
DECADES OF THE NINETEENTH CENTURY
First of all, let us consider some mortality and survival indicators for the Italian
population (both sexes together), drawn from the life tables referred to 1881-82,
1888 and 1900-01 (table 1). A considerable increase in the overall survival (e0) can
be observed between 1881-82 and 1900-01, but it is well known (Caselli, 1990,
1991, 2007; Pozzi 2000; Del Panta 1990, 1996) that the increase was mainly
caused by the notable reduction in infant and child mortality.
TABLE 1
Mortality and survival indicators in Italy (both sexes), 1881-1901
e0
e5
5q0
55q5
l60
e60
1881-82
35,50
50,20
0,3648
0,4716
33564
13,21
1888
36,5
51,1
0,3579
0,4464
35549
13,5
1900-01
42,6
54,2
0,2856
0,3917
43460
13,5
The decrease in child mortality was nearly 30 per cent, while the corresponding
decline between the fifth and the sixtieth birthday hardly reached 20 per cent.
Lastly, above the age of sixty, the overall improvement was absolutely minimal10.
It is important to note that between 1881-82 and 1888 the increase in survival
is still quite slow, while an acceleration of the process can be discerned between
1888 and 1900-01. If we consider the children (0-4years old), the annual variation
is lower than 3 per thousand between 1881-82 and 1888, while it nearly reaches
19 per thousand between 1888 and 1900-01.
Therefore, we can assume that in 1888, our year of reference, the long phase of
irreversible decline in mortality had only just started, even if we cannot exclude
different regional starting points and trends. Anyhow, as far as the sanitary and
epidemiological situation is concerned, the conditions of the Italian population in
1888 were probably similar to those prevailing, on average, well before the beginning of the demographic transition.
As mentioned, the aim of our research is mainly to describe the territorial
variation of mortality conditions in the period under consideration. In order to
document these differentials, at first we are going to analyze the regional mortality differences in terms of overall level and age structure. This investigation will
provide a useful introduction to the analysis of regional mortality by cause, which
constitutes the core of the research. Italy was characterized, both before the beginning of the mortality decline and during a large part of the long health transition, by a relevant territorial variability in the levels of overall mortality and especially of infant and child mortality (Del Panta 1990, p.250). As already mentioned,
in the period we are considering overall mortality was strongly conditioned by in10 Mortality risks above 80 years were even increasing in Italy (and in nearly all the Italian regions) between 1881 and 1901 (Del Panta, Calò, Belotti 2009).
Age and cause mortality structure in the Italian regions etc.
27
fant and child mortality. Consequently, particular attention will be dedicated to
these first age groups. As for the factors which conditioned infant and child mortality in the past and which were probably the main responsible for its territorial
differences, we have already (Del Panta, 1990, p. 247 sgg.; Pozzi, 2000, pp. 60
sgg.) stated the opinion that the link between economic backwardness of some
geographical areas (mainly Southern ones) and high infant/child mortality rates
emerges and becomes stronger during the health transition process (that is to say
by the end of the 19th Century). Previous to this, we believe that other factors
have to be considered, mainly those directly linked to climate and natural environment, and also other aspects which can be broadly defined cultural (mainly the
traditional ways of nursing and raising very young children).
Therefore, it is again important to note that in 1888 the regional mortality
conditions were still very similar to those which prevailed before the beginning of
the mortality decline. Owing to the slight variation of mortality level between
1881-82 and 1888 (see again the values of table 1), we decided to base our analysis of the regional age mortality differences on the complete 1881-82 regional life
tables, which are far more accurate than the abridged life tables we constructed
for 188811.
Data in table 2 show the rankings of the Italian regions according to life expectancy at birth (both sexes) and the probability of dying between birth and the fifth
birthday (from 0 to 4 years). If we consider the overall survival (e0), we can remark
that the Northern and the Central regions12 were characterized, aside from some
relevant exceptions, by a clear advantage in comparison to the Southern regions.
Nevertheless, we can observe on the one hand the position of Sardegna, by far the
best among the Southern regions, but also one of the first in the general ranking,
owing to a very low level of infant mortality. It is worthy of notice that the position
of Sardegna in the ranking of e0 (as well as in the ranking of 4q0) is very close to that
of other regions (Liguria and Piemonte) which had been part of the Kingdom of
Sardegna before the political unification of the country in 1861. The second relevant exception is Lazio, which was characterized by the lowest life expectancy
among all the Italian regions, though it belonged geographically to the Centre. In
fact, very different situations coexisted within that region13: on the one hand Rome,
the capital town of the Kingdom14, and on the other, the large, but thinly populated
11 In fact, 1881-82 complete life tables are based on the population age distribution drawn from
the census of 1881 (December 31). As for 1888 (June 30), we were obliged, as already mentioned, to
estimate the age and sex distribution of the population of each region, and we are able to obtain
only abridged life tables. For the procedure of construction of the regional 1881-82 life tables, see
Del Panta, Calò, Belotti (2009).
12 In 1881-82 (as well as in 1888) the territory of the Italian Kingdom was divided in 16 regions:
Piemonte, Liguria, Lombardia, Veneto and Emilia belong to the North; Toscana, Marche, Umbria and
Lazio to the Center; Abruzzi, Campania, Puglia, Basilicata, Calabria, Sicilia and Sardegna to the South.
13 This is not the only case of strong territorial differentiations inside the regions, as we shall
emphasize further on.
14 We are not able to evaluate the level of life expectancy of the commune of Rome in 1881. In
any case, the population of Rome was a consistent part (about 275000 inhabitants) of the whole
population of Lazio (around 900.000).
28
L. Del Panta, L. Pozzi
territory of the Agro Romano and Agro Pontino, where the presence of malaria
was responsible for very high mortality rates.
TABLE 2
Distribution of Italian regions according to the values of e0 and 5q0 drawn from 1881-82 life table (both sexes)
Veneto
Piemonte
Sardegna
Liguria
Umbria
Toscana
Marche
Lombardia
Italy
Emilia
Sicilia
Abruzzi
Calabria
Puglia
Campania
Basilicata
Lazio
e0
38,96
37,75
37,72
37,67
37,41
36,51
36,43
36,08
35,50
35,42
35,12
35,01
33,43
33,28
32,78
30,82
29,85
Veneto
Piemonte
Sardegna
Liguria
Lombardia
Umbria
Emilia
Toscana
Italy
Marche
Calabria
Abruzzi
Sicilia
Lazio
Campania
Puglia
Basilicata
5q0
0,3113
0,3126
0,3152
0,3363
0,3373
0,3487
0,3567
0,3569
0,3648
0,3762
0,3786
0,3924
0,3937
0,4043
0,4124
0,4310
0,4530
Both the anomalous positions of Sardegna and Lazio in the regional ranking
and the quite sharp gradient North-Centre/South, as far as e0 is concerned, can
be explained in large part by infant and child mortality levels, as it appears with
evidence if we look at the regional ranking of 5q0 , very similar to that of e0 . Indeed, G. Caselli (1990) had calculated that about 60 per cent of the overall increase in the life expectancy at birth (about 7 years both for males and for females) from 1881-82 to 1899-1902 can be attributed to the decline in mortality
between 0 and 4 years of age.
Nevertheless, it is well known that the Italian regions, at the beginning of the
health transition, were characterized by very different situations as far as neonatal,
post-neonatal and child mortality are concerned. Many studies deal with this subject, and it should suffice to cite here some of them (Bellettini, 1987; Del Panta,
1984; Pozzi, 2000). Figures 1a, 1b and 1c emphasize the fact that the regional geography of neonatal mortality is completely different from that of post-neonatal
mortality. On the contrary, the geography of post-neonatal mortality is much
more similar to that of child mortality.
For instance we can underline the position of Veneto, characterized by the
highest level of neonatal mortality risk and, on the contrary, by the lowest level of
post-neonatal and child mortality. On the opposite side, we find Sardegna, whose
neonatal mortality risk was the lowest in Italy15. Nevertheless, in this region also
post-neonatal and child mortality were moderate, especially in comparison with
the remaining Southern Italian regions.
15 However recent analyses of Sardinian neonatal mortality rates, at the municipal level, in the
last decades of 19th Century (Breschi et al. 2007, 2010) have pointed out a possible underestimation
of the risk of dying immediately after birth which might have affected the Sardinian data. These results are still provisional and require further analyses to be confirmed.
29
Age and cause mortality structure in the Italian regions etc.
0,70
0,70-0,80
0,81-0,92
t 0,93
Figura 1a – Neonatal mortality in the Italian regions, 1881-1882.
0,111
0,111-0,117
0,118-0,149
t 0,150
Figura 1b – Post- neonatal mortality in the Italian regions, 1881-1882.
0,180
0,180-0,204
0,205-0,239
t 0,240
Figura 1c – Child mortality in the Italian regions, 1881-1882.
30
L. Del Panta, L. Pozzi
In general, it seems well founded to indicate the climate and the environment
as the main cause of the differences in mortality among the regions during the
first month of life, as a consequence of the incidence of respiratory diseases. The
disparities beyond the first month, mainly deriving from the diverse frequency of
digestive diseases, should be instead ascribed more often to economic and social
factors. The extreme regional cases just mentioned appear worthy of particular
attention in the following analysis of mortality by cause (and age).
As far as the mortality risks beyond the fifth birthday are concerned, let us
consider, within this preliminary analysis, only two broad indicators: mortality risk
between 5 and 60 years of age and life expectancy at 60 years. The regional rankings of 55q5 and of e60 (table 3) do not show a clear North/South gradient, like the
one we had remarked as for e0 and 5q0 . Only through an analysis of the causes of
death could the regional differences in the adult and elderly mortality perhaps be
partly clarified. In any cases, it is notable to remark a considerable likeness between the rankings of 55q5 and of e60. A majority of regions whose mortality risks
between 5 and 60 were lower than the national level had also a higher expectation
of life at 60 years, and vice versa.
TABLE 3
Distribution of Italian regions according to the values of 55q5, and e60 drawn from 1881-82 life tables (both sexes)
Marche
Puglia
Abruzzi
Umbria
Toscana
Sicilia
Veneto
Liguria
Italy
Basilicata
Campania
Emilia
Piemonte
Sardegna
Lombardia
Calabria
Lazio
55q5
0,4113
0,4281
0,4311
0,4312
0,4507
0,4510
0,4542
0,4544
0,4716
0,4749
0,4750
0,4804
0,4817
0,4894
0,4945
0,5366
0,5983
Liguria
Puglia
Sicilia
Toscana
Abruzzi
Umbria
Marche
Basilicata
Campania
Veneto
ITALY
Piemonte
Emilia
Calabria
Lazio
Lombardia
Sardegna
e60
15,19
14,34
14,14
14,05
14,03
13,99
13,96
13,56
13,41
13,40
13,21
12,63
12,61
12,54
12,23
11,84
11,27
In any case, if we analyze in more detail (figure 2) the age mortality rates of the
four regions in the first two positions (Veneto and Piemonte) or conversely in the
last two ones (Basilicata and Lazio) in the ranking of e0 , we obtain a further confirmation of the weight of the first two age groups (and especially the (1-4) class).
On the opposite side, mortality differences in the following age groups are of minor importance and had a low impact on the overall survival level.
31
Age and cause mortality structure in the Italian regions etc.
Figura 2 – Age specific mortality rates (both sexes) in four Italian regions (1888).
If we now consider, for each age group, at the country level and for five
selected regions the ratio between male and female mortality (table 4), we can
easily appreciate16 a certain disadvantage for women in the Northern regions
and, on the contrary, a male disadvantage quite generalized in the Southern regions17 .
Even as far as gender mortality differences are concerned, only the analysis of
cause mortality could give some ideas for explaining the different situations of the
various regions. We can anticipate that these gender differences could be partly
attributed to the non-homogeneous geographical incidence of two important diseases (malaria and tuberculosis).
TABLE 4
Ratios between male and female age specific mortality rates in Italy and in some selected regions (1881-1882)
q0
m(1-4)
m(5-19)
m(20-39)
m(40-59)
m(60+)
Italy
1,11
1,00
0,92
0,89
1,12
0,98
Piemonte
1,18
1,04
0,90
0,78
0,98
0,97
Veneto
1,14
0,99
0,93
0,81
1,13
1,00
Lazio
1,12
0,99
1,08
1,13
1,35
1,02
Basilicata
1,15
0,96
1,04
1,23
1,26
0,99
Sardegna
1,14
1,04
1,00
0,92
1,11
0,97
Leaving aside the first age group, where a male over mortality is expected.
We have already remarked that Lazio was characterized by mortality patterns quite similar to
Southern regions.
16
17
32
L. Del Panta, L. Pozzi
3.
CAUSE MORTALITY STRUCTURE IN ITALY IN 1888: A FIRST GLANCE AT TERRITORIAL DIFFERENCES
In this section, our aim is to point out the relevance of the analysis of the
causes of death to explain territorial mortality differences in terms of age and sex.
The descriptive results we are presenting here will help us to illustrate the complexity of the underlying determinants affecting the geography of mortality in Italy at the beginning of the health transition.
Before analyzing our results, we shall briefly discuss the difficulties encountered in this kind of investigation, due to the statistical information and the quality of the data we have at our disposal.
Let us compare, for instance, (fig. 3a) the age distribution of mortality according to malaria in two Southern regions, Calabria and Sardegna, were the presence
of malaria was endemic at the end of the 19th Century. Especially as far as very
young children are concerned, malaria struck much more severely in Sardegna
than in Calabria.
Figure 3a – Malaria age specific mortality rates (both sexes) in Calabria and Sardegna, 1888.
Nevertheless, if we consider (figure 3b) mortality rates for pneumonia, we can
suppose that even in Calabria malaria was able to produce very serious, even if
indirect, effects. In fact, mortality for pneumonia appears to have been higher in
Calabria than in Sardegna in every age group18, and especially among children. At
least part of this over-mortality due to pneumonia might have been indirectly
caused by malaria. It is, indeed, well known that individuals who are affected by
malaria are particularly exposed to serious respiratory diseases19. This is just a
18 Pneumonia mortality rate (all ages) is 3,31 per thousand in Calabria and 2,18 in Sardegna. As
far as malaria is concerned, the rate is 1,51 in Calabria and 2,93 in Sardegna.
19 We can put forward the hypothesis that the population of Sardinia, affected by a very high
mortality caused by the first malaria attacks just in the very first ages of life, could benefit, during
Age and cause mortality structure in the Italian regions etc.
33
simple example to show that in order to ascertain the effective weight of one disease, like malaria, we have to take into account also other causes of death which
might have been connected with the disease we intend to examine20.
Figure 3b – Pneumonia age specific mortality rates (both sexes) in Calabria and Sardegna, 1888.
An additional and very significant limit of the statistical data at our disposal, already mentioned, consists in the absence of combined cause and age death statistics at the provincial level21 which obliges us to eventually analyse separately age
mortality differences and cause mortality differences.
We should take into account the fact that most of the Italian regions were not
homogeneous units in terms of mortality level and structure by age and cause.
Just to give an example, we can observe for some selected regions respectively the
maximum and minimum provincial value of life expectancy at birth together with
the corresponding regional indicator22 (table 5).
We can easily appreciate that Italian provinces, within the same region, could
be characterized by very different levels of e0. The highest contrast was found in
the Abruzzi and Molise region, where nearly 9 years of difference separated the
province of Teramo from the province of Campobasso.
the rest of their life span, by a higher resistance to severe diseases like pneumonia, in comparison
with the population of Calabria (and of other Southern Italian regions affected by malaria in a
milder form than in Sardegna).
20 To this regard is worth mentioning the need of considering the reciprocal influences and interactions between the various diseases, according to the concept of “pathocenosis”, introduced by
Grmek in 1969. See also Grmeck 2005.
21 In the period of our analysis (1888) most of the Italian regions were divided into two or more
provinces. The General Directorate of Statistics (DIRSTAT) never published death statistics by age
and cause of death at the provincial level.
22 The provincial values of e0 are drawn from the abridged life tables constructed around the
census of December 31st 1881 by L. Del Panta (1998).
34
L. Del Panta, L. Pozzi
TABLE 5
Maximum and minimum provincial values of e0 in some Italian regions, 1881-82 (both sexes)
Regions and Provinces
VENETO
Rovigo
Verona
e0
38,96
34,40
42,44
max-min
8,04
max/min
1,23
EMILIA
Ferrara
Parma
35,42
30,47
38,68
8,21
1,27
TOSCANA
Grosseto
Pisa
36,51
33,15
39,68
6,53
1,20
ABRUZZI E MOLISE
Campobasso
Teramo
35,01
31,00
39,95
8,95
1,29
SICILIA
Caltanissetta
Trapani
35,12
31,79
39,10
7,31
1,23
ITALY
35,50
Again as an example, we refer here to the Tuscan provinces of Pisa and Grosseto, which were respectively characterized by the maximum and the minimum
level in life expectancy at birth23.
Let us now compare (figure 4a) the age specific mortality rates of the mentioned provinces of Pisa and Grosseto. The first one was characterized by higher
mortality rates from childhood and through the adult stages of life, up to 65-69
years. Only in the last age groups (starting from 75-79 years) do we observe a
turnabout. In fact, in the eldest age groups the province of Pisa seems to be disadvantaged.
We can probably ascribe to malaria, together with several correlated diseases,
the different age mortality structure of Grosseto in comparison with Pisa. The
relative advantage of Grosseto among the elderly could be put down to a selection effect. In fact, very few individuals did survive in the province of Grosseto
beyond 70 years of age, and they were probably those who had overcome the extremely high mortality risks that were able to eliminate a very high percentage of
the birth cohorts during their life.
23 It is interesting to point out that since the first part of the Nineteenth century in many communes of the province of Pisa we can always find very high levels of life expectancy at birth. In fact,
we were able to construct abridged life tables at the level of the communes by means of the vital
statistics of the “Stato Civile Toscano” and the population age structure that we can draw from the
1841 Tuscan Census. On the contrary, in most of the communes of the Grosseto province, an area
which has been overrun by malaria during many centuries, we can observe at the same date (1841)
the lowest levels of life expectancy at birth within the Tuscan Grand Duchy.
Age and cause mortality structure in the Italian regions etc.
35
Figure 4a – Age specific mortality rates (both sexes) in the provinces of Grosseto and Pisa, 1881-82.
Indeed if we consider cause mortality structure for these two provinces (figure
4b)24 we can find further support for the hypothesis that malaria, still widely present
in the province of Grosseto and nearly absent in the province of Pisa, was directly
or indirectly responsible for the overall mortality level and structure by age.
Figure 4b – Age standardized cause mortality rates (both sexes) in the provinces of Grosseto and
Pisa, 1888-91 (per 1.000.000).
1 Congenital anomalies and perinatal conditions; 2 Measles; 3 Scarlet fever; 4 Typhoid and paratyphoid fever; 5
Diphtheria; 6 Whooping cough; 7 Flu; 8 Malaria; 9 Syphilis; 10 Tuberculosis in all forms; 11 Pellagra; 12 Bronchitis; 13 Pleurisy; 14 Pneumonia; 15 Cardiovascular diseases; 16 Diseases of the stomach and duodenum; 17
Cirrhosis of the liver and hepatitis; 18 Gastro-enteritis; 19 Appendicitis and peritonitis; 20 Maternal conditions;
21 Vascular lesions of the central nervous system; 22 Meningitis; 23 Convulsions; 24 Senility; 25 Malignant cancers in all locations.
24 The values of the standardized cause mortality rates depicted in figure 4b, referred to the
provinces of Pisa and Grosseto, were drawn from Pozzi (2000), who carried out an exhaustive
analysis of cause mortality geography at the provincial level between the 19th and 20th.
36
L. Del Panta, L. Pozzi
We can actually observe, for the Grosseto province population, a sharp disadvantage, in addition to malaria, also for pneumonia, gastro-enteritis and diarrhoea.
It is well known that people who were affected by malaria were particularly exposed to mortality risks from these diseases. On the contrary, the province of
Pisa was characterized by a disadvantage as far as the mortality risk for tuberculosis is concerned. Moreover mortality risks concerning the diseases of the circulatory system and the cerebrovascular diseases were also higher. In conclusion, in
1888-91 Pisa seems to have been characterized by a more modern mortality structure in comparison with Grosseto.
Let us now go back to national data in order to consider Italian age and cause
mortality structure in 1888. Data in the appendix table show, for the Italian population, age and cause specific mortality rates. As for the age groups, we have kept
a detailed classification for children, since we have already pointed out the relevance of infant and child mortality on the overall survival. We have then considered some large groups of causes that are jointly responsible of nearly the eighty
per cent of the overall mortality. Besides we have also isolated, within these
groups, some major items whose separate analysis is worth considering.
Looking at the mentioned rates in the appendix table, it is clear that for many
specific causes and also, jointly, for the group of the infectious diseases, mortality
reaches the highest values in the ages of infancy and childhood. Therefore, we
shall focus mainly on these age groups in the next section.
For many causes, such the respiratory diseases and, among those highlighted in
the table, apoplexy and cerebral congestion, as well as children, older people encountered the highest rates. Finally for other causes, such as tuberculosis25, the
rates are very elevated for both children and young adults.
Let us now consider cause mortality rates (all ages) in the regions for three
more relevant distinct groups: infectious and parasitic diseases, respiratory diseases, digestive diseases (Table 6). Altogether, these three groups are responsible
for 60 per cent of the overall mortality.
Regional values of the overall mortality rate highlight a clear North/South gradient, with few exceptions, as we have already described in the previous section
(table 2) on the basis of the values of life expectancy at birth referred to 1881-82,
a few years before the date to which the data of table 6 refer. Even if the two indicators (rate of mortality in table 6, life expectancy at birth in table 2) are not
strictly comparable, we can still notice that the position of Lazio (in relative
terms) has largely improved: in 1881-82 Lazio was the last region in the rank of e0
(its level was lower than the national one of about 5 years and a half), while in
1888 Lazio mortality rate was almost the same that the national one.
On the contrary, the positions of the other regions are essentially confirmed.
The Veneto region maintains the most favourable position, while Sardegna, in
1888, results closer to Northern regions, although it belongs to the South from
the geographical point of view. However the most interesting aspect that emerges
25 Actually the voice “tuberculosis in all forms” hides very different situations, as we shall highlight in the following pages.
37
Age and cause mortality structure in the Italian regions etc.
from the analysis of table 6 is the high variability within each group of causes,
with a maximum (0.294) in the case of infectious diseases. It may be noted that
the mortality rate from infectious diseases is lower than 4 per thousand in the
most favoured region (Marche) while the same rate is close to 10 per thousand or
even higher in several Southern regions. Even with regard to digestive diseases
the Southern regions, with the exception of Sardegna, are disadvantaged, but the
differences are less pronounced. A similar comment can be replicated for the respiratory diseases: the highest values can be observed in a wide Southern area
from Abruzzi to Calabria.
TABLE 6
Death rates (p. 1000) by cause groups (both sexes) in Italian regions, 1888
Piemonte
Liguria
Lombardia
Veneto
Emilia
Toscana
Marche
Umbria
Lazio
Abruzzi
Campania
Puglia
Basilicata
Calabria
Sicilia
Sardegna
ITALY
cv
Infectious
diseases
4,65
5,29
5,42
4,56
5,43
6,11
3,89
5,63
6,85
8,24
6,73
9,16
9,88
9,96
10,08
8,10
Respiratory
diseases
5,00
5,58
4,82
4,34
5,45
4,64
5,77
5,73
4,81
6,69
7,92
6,65
7,51
7,61
5,24
4,28
Digestive
Diseases
3,74
3,61
4,03
2,80
4,11
3,58
3,97
3,32
4,02
5,79
4,76
5,91
5,79
5,15
6,60
3,97
Other causes
and Undetermined
11,41
9,95
11,30
11,58
11,94
11,26
13,30
12,43
11,75
12,12
10,29
9,31
9,94
9,99
9,15
10,51
All causes
of death
24,81
24,43
25,56
23,28
26,93
25,59
26,93
27,12
27,43
32,84
29,70
31,03
33,12
32,72
31,07
26,86
6,61
0,294
5,60
0,199
4,43
0,237
10,94
0,104
27,57
0,111
It is clear that the search of factors underling the differences in the age and
cause structure of mortality among the regions may be addressed only after having completed a detailed statistical analysis which is still ongoing.
Here we can furnish some hypotheses thanks to the examination of infant and
child mortality differentials according to the most relevant causes of death. The relevance of these differentials in determining the geography of overall survival in Italy
is well known and has been discussed also in this paper in the previous sections.
Then we shall restrict ourselves to some preliminary observations on specific
diseases, with special attention to tuberculosis.
Let us first consider neonatal mortality rates whose geographic variation was
very different from that which prevails in the immediately following ages (figures
1a, 1b, 1c), as shown in the previous section. In figure 5 we have represented for
each region the levels of mortality for the most relevant causes of deaths in the
first 30 days of life. The attention should be focused on “infantile atrophy”, as
that cause of death is far too prevalent on the two items immediately following in
order of importance (bronchitis26, enteritis and diarrhoea).
26
In the group of respiratory diseases, bronchitis significantly outweigh pneumonia in the age
38
L. Del Panta, L. Pozzi
Figure 5 – Neonatal mortality rates (per 1,000) for some causes of death in Italy and in the regions
(1888).
In the international classification of diseases “infantile atrophy” is included in
the grouping “perinatal conditions”, and it is the far more important cause of the
group (about 85 per cent of cases). We shouldn’t forget that its meaning is largely
unclear: the physicians of the time talked from time to time of a clinical pattern
characterised by immaturity, low birth weight, respiratory difficulties. Problems of
hypothermia were also frequently cited (Pozzi, 2000, pp. 46-47). It is important to
remember here that hypothermia has (Dalla Zuanna, Rosina 2008, 2010) been recently named as the main cause of the very high mortality in the first week after
birth that characterized the population of Veneto until mid-nineteenth century.
Dalla Zuanna and Rosina analysed, at the individual level, the association between
external temperature and the risk of dying of the very young infants (first days
and weeks of life) in several Veneto parishes and proposed an explanation linking
maternal malnutrition, low birth weight, susceptibility to cold, and neonatal mortality. However, this causal chain has been partially challenged by Derosas (2009,
2010) who, at least for the urban population of Venice, did not verify any association between maternal malnutrition and high risk of dying from hypothermia in
wintertime. In any case we can easily verify (figure 5) that mortality level in the
first month, mainly caused by “infantile atrophy”, was extremely high especially in
some regions (like Veneto) where the climate is colder during the winter. Moreover other studies (Bellettini,1987; Breschi and Livi Bacci, 1986) have indicated
group up to 30 days and, although to a lesser extent, until the fifth birthday, even if there are differences among regions. For all the following ages, mortality for pneumonia is higher (see again the
appendix table). Apart from the different age structure, the weight of the two diseases in 1888 was
roughly the same, at least at the national level. It is interesting to remember that a sharp decline in
mortality due to bronchitis was recorded from the early 20th Century. Mortality rate for pneumonia
instead remained high (even with a slight increase until about 1920) for a much longer period
(Caselli 1990). Infant and child mortality indeed declined much more rapidly than mortality of
adults and elderly, who were mostly affected by pneumonia.
Age and cause mortality structure in the Italian regions etc.
39
that, in many Northern Italian regions, the season of birth had a strong influence
on the survival of the newborns, since those who were born during cold months
had much higher mortality risks.
As we have already reported, the geography of post-neonatal (30 to 365 days)
and child mortality were very similar. For this reason, we analyze here only the
conditions of mortality beyond the first birthday. So let us consider figure 6
where, for six Italian regions, we have represented mortality rates according to
large categories of causes in the age group 1-4.
Figure 6 – Cause specific mortality rates (ages 1-4 years) in some Italian regions (1888).
We had already noted (see again figure 2) that in this age group the regional
differences in mortality were particularly pronounced. We have selected here the
regions with the lowest rates (Veneto and Piemonte), then three Southern regions
with very high overall and child mortality (Puglia, Basilicata and Calabria) and finally Sardegna, due to its anomalous position in relation to its geographical location. The strong difference in the levels of child mortality from infectious diseases between the mentioned Southern regions (Calabria, Basilicata and Puglia,
with mortality rates of 35-40 per thousand) and the two Northern ones
(Piemonte and especially Veneto, with mortality rates scarcely over 10 per thousand) is evident. Sardegna occupies an intermediate position, but for these causes
of death it is closer to the Southern regions.
As far as the respiratory diseases and the digestive diseases are concerned, the
situation is somewhat similar. In fact, even for these groups of causes Veneto and
Piemonte have low mortality rates, but it is surprising to note that for respiratory
diseases the lowest level is recorded in Sardegna. In the previous section we have
pointed out the strong difference in the mortality from pneumonia between
Calabria and Sardegna (see again the figure 3b), and we hypothesized a link with
the different incidence in the two regions of malaria in the very first years of age.
40
L. Del Panta, L. Pozzi
Finally, we can observe that Calabria, where we can find the highest level of
child mortality both for infectious and parasitic diseases and for respiratory diseases, we find a lower mortality rate for digestive diseases. The impression one
gets from these data is that each region, even if according to a more general gradient North-South, had its specific characteristics whose determinants are difficult to discern at this stage of the research.
However the following analysis of regional child mortality rates for some specific causes (Table 7), which were included in the already mentioned groupings
(infectious, respiratory and digestive diseases) may provide further elements to
understand these determinants. The first notation concerns the relevant geographic variability in the incidence of different diseases responsible for children
deaths.
In particular, we observe very high values, and very far from the national average, in Sardegna with regard to malaria, in Calabria for measles, and in Basilicata
for diphtheria. Leaving aside for the moment tuberculosis, on which we shall return shortly, we can first point out that malaria, at least as far as child mortality is
concerned, was a disease, at the date of 1888, almost confined in the Southern
regions27.
TABLE 7
Age and cause specific child mortality rates (per thousand) in the Italian regions, 1888
Tuberculosis
Malaria
Measles
Diphtheria
Pneumonia
Bronchitis
Piemonte
Liguria
Lombardia
Veneto
Emilia
Toscana
Marche
Umbria
Lazio
Abruzzi
Campania
Puglia
Basilicata
Calabria
Sicilia
Sardegna
1,97
2,85
3,77
3,11
3,20
4,16
2,86
4,35
8,11
5,83
6,12
6,13
4,39
2,54
2,73
3,11
0,26
0,06
0,21
0,38
0,25
0,23
0,06
0,12
2,50
1,93
1,35
1,94
3,55
3,21
4,07
9,75
3,32
4,71
3,29
1,50
2,27
2,19
0,93
4,06
2,62
11,29
5,81
3,52
3,97
17,56
6,37
1,38
3,65
3,90
2,72
2,11
2,42
4,00
1,27
2,82
4,34
2,40
4,04
9,00
12,11
5,93
6,22
2,71
2,12
3,38
2,75
1,90
2,59
1,76
2,17
2,51
3,13
4,12
6,36
3,20
2,60
4,11
3,36
1,43
3,27
6,39
4,36
3,62
6,50
5,73
6,14
6,89
5,30
7,01
9,39
7,27
6,79
9,89
4,86
1,99
Gastroenteritis
6,23
9,15
8,11
5,14
6,68
12,45
12,90
9,24
15,11
17,57
12,07
19,86
15,85
12,10
16,46
7,33
ITALY
CV
3,88
0,399
1,45
1,304
4,49
0,881
4,05
0,625
3,05
0,390
5,70
0,337
11,00
0,370
The case of Sardegna is of great interest, and should be carefully considered in
future research. Here a high malaria mortality rate was accompanied by much
lower rates for other diseases (not only for children). As a result, Sardegna had
one of the most favourable positions among the Italian regions, in terms of overall survival.
Also the data of the table show that Sardinian children had, between the first
and the fifth birthday, a significantly lower mortality than the national average for
27
As already mentioned, in this respect, the region of Lazio was comparable to the Southern ones.
Age and cause mortality structure in the Italian regions etc.
41
all the other causes considered. As far as pneumonia and bronchitis are concerned, the values are actually the lowest among all regions. Anyhow we shouldn’t
forget that in Sardegna 1888 data show the highest percentage of deaths whose
cause is unknown. This fact suggests to use great caution in comparisons with
other regions28.
As for measles, the Southern regions are clearly very disadvantaged even if we
have to mention the tremendous difference between the extremely high values of
Calabria and Abruzzi and the correspondent ones (below the national average)
recorded in Puglia and Basilicata. We have to remember that the pattern of measles is characterized by the presence of epidemic peaks in specific years. Consequently the regional cause specific rates that we have calculated on the basis of a
single calendar year could be misleading: the very high rates recorded in some regions (mainly Calabria and Abruzzi) might have been the consequence of an epidemic peak which, in other regions, could have been reached in previous or subsequent years. The examination of the regional annual series of the total numbers
of deaths caused by measles from 1887 (ISTAT, 1958, 192) supports this hypothesis29. Anyhow the analysis of this series as well as previous studies on provincial mortality differentials by cause (Pozzi, 2000) confirmed a Southern pronounced disadvantage, as far as mortality from measles is concerned.
The relationship between nutritional level and mortality caused by measles, in
the case of children, is commonly accepted (Livi Bacci, 1993; Mc Keown, 1979),
although there are also different opinions to this regard (Aaby et al., 1983). In any
case, it is likely that, in the case of measles, the nutritional level affects mainly the
fatality rate and much less the morbidity from the disease. In fact, measles morbidity (and thus also mortality) usually shows a cyclical pattern with an interval,
between two successive peaks, of about 3-5 years (Del Panta, Forini, 1994).
It is however important to remark that mortality caused by measles, despite the
absence of specific treatment, decreased rapidly, in Italy, after the first World
War, while in 1888 that disease was still one of the most important causes of
death for children in many Italian regions.
It is not possible here to go into details about regional child mortality differences according to each disease considered, nor discuss the factors underlying
these differences. In general, in order to examine these issues we should first consider the mode of transmission of individual diseases30. For example, in the case
28 The caution should be probably reinforced considering the results of the already mentioned
recent analyses of Sardinian neonatal mortality rates in the last decades of 19th Century (Breschi et
al., 2007, 2010) which have pointed out a possible problem of underestimation (see note 15).
29 In Abruzzi and Calabria the total number of deaths caused by measles in 1888 were respectively 2.535 and 3,811, while during the year before they were only 1,471 and 746. The opposite
situation is observed for Puglia and Basilicata, where the corresponding figures for 1887 were 2,395
and 908, while for 1888 they were 948 and 343.
30 As far as measles, diphtheria, pneumonia and bronchitis are concerned, we can talk about airborne diseases (Mc Keown, 1979). As far as enteritis, the transmission occurs through water and
food. Malaria is, as it is well known, caused by a microorganism (plasmodium) and requires a carrier,
the anopheles mosquito (Bruce-Chwatt and De Zulueta, 1980). In the case of tuberculosis it is necessary to distinguish between different forms. In particular, the pulmonary form is transmitted by
42
L. Del Panta, L. Pozzi
of forms of enteritis and infant diarrhoea it is reasonable to assume that the very
high mortality levels of several Southern regions (in particular Puglia, Abruzzi,
Sicilia and Basilicata) were linked to the widespread economic insecurity and the
poor personal and domestic hygiene that made it very risky for children the difficult period of weaning.
The case of tuberculosis deserves special attention and requires an analysis extended to all the age groups. Indeed, the disease, whose causative agent was isolated by Koch in 1882 (Mc Keown, 1979, p. 130), manifests itself in various
forms which affect different age groups as well as may have different modes of
transmission31.
In figure 7 we can appreciate, for each region, the death rate32 from tuberculosis
in all forms and respectively from the two most common forms: pulmonary and
abdominal. The mortality rate from tuberculosis (all forms) was, with few exceptions, somewhat higher in the Northern and Central regions. In particular, the lowest values were found in three Southern regions: Basilicata, Calabria and Sicilia.
Should however be noted that especially in the case of tuberculosis it is very
difficult to investigate the possible factors of these regional mortality differences
analyzing a single calendar year33.
Figure 7 – Mortality rates for tuberculosis (both sexes, per 1,000) in the Italian regions in 1888.
air, while for the abdominal form (which mainly affected children) the most common transmission
is through the cow’s milk.
31 Nine of the 169 items in the “Statistica delle cause di morte” of 1888, have to be included, according to the 1942 edition of the Nomenclature nosologiche ...cit. (Istituto di Statistica del Regno
d’Italia 1942), in the broader item “tuberculosis in all forms”. However, the two items including the
largest number of cases are, in order, the pulmonary and the abdominal form.
32 With no distinction of age.
33 Even for measles we have made a similar comment. In that case, however, we tried to explain
that it would perhaps be sufficient a series of data for some years in order to appreciate, for each
region, any epidemic peaks of mortality.
Age and cause mortality structure in the Italian regions etc.
43
At the end of the second-last decade of the Nineteenth century in fact, at least
in the Northern and Central regions, a downturn in the epidemic cycle of the disease that had probably reached its climax between 1870 and 1880 had already begun34. Due to the lack of cause mortality statistics until 1881, this trend has been
postulated (Borro, 1984, pp. 862 sgg.) on the basis of the examination of the
causes of discharge from military service. In any case, it is not possible, at the
moment, to establish with confidence whether the epidemic cycle took place, at
least partially, in different periods of time in each regional area. If this were true,
it could be the cause of the different level of mortality from tuberculosis that can
be detected in 1888 in the single regions.
Nevertheless if we observe, in figure 7, also the levels of mortality rates for the
two main forms of tuberculosis (pulmonary and abdominal), it is clear that the
regional patterns were completely different. Pulmonary tuberculosis was largely
prevailing in Northern regions35, in agreement with the idea that the transmission
could be favoured by the urban density and above all by the chances of infection
in the factories yet present in these areas were a first industrial development had
already occurred, especially in the textile sector. The geographical diffusion of the
abdominal form was completely different. Indeed this form had a very high incidence in particular in a contiguous group of Southern mainland regions, while the
Northern regions (with the partial exception of Lombardia) seem to have been
rather spared.
We should take into account that while the medical diagnosis of pulmonary
and bone tuberculosis in the last decades of the 19th Century was already possible
by means of X ray and bacteriological technologies able to identify the Koch’s
bacillus, the abdominal forms were mostly identified by clinical symptoms and
therefore under the diagnosis of abdominal tuberculosis other intestinal diseases
could also be included.
To this regard, it is important to stress that also the age and sex mortality incidence respectively of the pulmonary and the abdominal tuberculosis was very different. The first one reached the highest level among the young adults, and both
teenagers and young adults females were largely penalized (Figure 8).
On the contrary, mortality from abdominal tuberculosis (figure 9) was essentially limited to the first age groups. This could be a confirmation of the hypothe34 Borro, 1984. In a previous research, dedicated to the analysis of the evolution of gender mortality differentials in the infant and young adult ages in Italy, during the health transition process,
Pozzi (2007) supported the idea that the Italian statistics of the causes of death cover the complete
tuberculosis cycle, articulated in three phases: epidemic, transitional and endemic, only for the region of Sardegna . For the rest of the country, and in particular in the Northern and Central regions
the statistical information permit to analyse only the last two phases.
35 A special notation would be necessary as for the very high level of mortality from tuberculosis
in all forms that can be detected in Lazio. As we can easily see from the graphics, Lazio was characterized by high values of mortality both for the pulmonary and for the abdominal form. We must
specify that in Lazio also the rate of mortality from the tubercular meningitis (that mostly affected
part children until the fifth year of life) was more than double of the national average. Further specific analyses are necessary to clarify the reasons of this intense mortality rates from tuberculosis in
the region.
44
L. Del Panta, L. Pozzi
Figure 8 – Age and sex specific death rates for pulmonary tuberculosis in Italy (1888).
Figure 9 – Age and sex specific death rates for abdominal tuberculosis in Italy (1888).
sis that the most frequent carrier of the infection for this form was the cow’s contaminated milk36, but it could be also an additional proof that this diagnosis included also other infantile abdominal infections.
36 As far as Lombardia is concerned, a link between the diffusion of female work (which supports the tubercular infection) and a high level of infant and child mortality has been stressed
(Pozzi, Rosina 2000). The early weaning and consequently the assumption of cow’s contaminated
milk could explain the high level of mortality from abdominal tuberculosis and intestinal diseases
that can be registered among children in that region.
Age and cause mortality structure in the Italian regions etc.
45
In the period 1887-1914 the mortality rate from abdominal tuberculosis significantly declined (Ministero per l’Industria, il Commercio e il Lavoro 1918), especially in some regions where in 1888 the highest values had been registered, as
Campania, Lazio and Abruzzi. On the contrary, in the same period the mortality
rate from pulmonary tuberculosis had a quite less favourable trend. It seems likely
that the adoption of simple measures of prophylaxis (in particular, the practice of
boiling the cow’s milk) had a crucial influence on the decline of mortality from
the abdominal tuberculosis.
CONCLUDING REMARKS
The main objective of this paper has been exploring regional mortality differentials in the last two decades of the 19th Century, corresponding to the first
phase of the Italian health transition process, which was characterized by wide
geographical differences.
After reconsidering these differentials in terms of overall level and age structure, we have examined the regional distribution of the causes of death, which
constitutes the primary focus of this contribution.
The second part of this paper is indeed based on a careful exploitation of the
volume “Statistica delle cause delle morti 1888”, published in 1890, by the Italian
General Directorate of Statistics. This volume constitutes a unique source in the
Italian statistical panorama; indeed it is the only one which contains regional tables on deaths jointly classified according to age and cause for the year 1888. As
mentioned, the General Directorate of Statistics from 1887 onwards published
yearly deaths statistics classified according to age and cause for the whole country;
the regional and provincial level data were classified only by cause or alternatively
by age.
The analysis of cause specific mortality allowed us to illustrate in great detail
the geographic mortality variation in the country in the first phase of the health
transition process. Substantial differences were found between the various Italian
regions, characterized by a clear north-south gradient, strongly conditioned by
infant and child mortality rates.
The Southern Regions were generally penalized and this disadvantage was essentially due to a higher risk of dying before the 5th birthday. Nevertheless very
different situations characterized the Italian regions in terms of neonatal, postneonatal and child mortality. An extraordinary frequency of babies who died
within the first month was found in the North East and Centre of the country,
while in the South exceptionally high levels of post-neonatal as well as child mortality rates were recorded.
“Infantile Atrophy” and respiratory diseases were essentially responsible for
the very high risk of death in the first month of life especially in the North Eastern regions. On the opposite side, infectious diseases, like measles and diphtheria,
and gastro-enteritis caused the high post-neonatal and child mortality rates particularly in the Southern regions.
46
L. Del Panta, L. Pozzi
The information on the different diseases responsible for the diversified risks
of death recorded in the first month of life and in the subsequent phase (1-12
months and 1-4 years) helps to clarify the role of their underlying determinants.
In the first month of life the climate as well as biological and maternal health related factors probably played an essential role.
In the subsequent phase, the relevance of infantile infectious diseases and intestinal disturbances, in the South, is an indirect evidence of the widespread economic insecurity, high population density, and poor hygienic conditions, exacerbated by hot climate, that made very risky for babies particularly the difficult period of weaning.
In addition, the data at our disposal show that the Italian regions were not
homogenous in terms of cause specific mortality levels and age structure and they
had individual characteristics and peculiarities whose determinants are difficult to
find out. We cannot exclude that these specificities were at least partially artificial
and reflect different classification procedures; they might also suffer from the
limit of being based on single calendar year data37.
However we have documented and discussed the unquestionable and tricky
role of malaria, as well as the crucial importance of tuberculosis in the variation of
health transition patterns which characterised the Italian sub-regions. Notwithstanding the relevance of these diseases, a comprehensive study of their geographical patterns and temporal trends is still to be undertaken.
This analysis would help clarify the causal mechanisms and underlying determinants of the diversified geographical patterns in the Italian health transition
process.
Many questions regarding these differentials are still unanswered. To reach further progress in this field, the necessity of an individual-based approach and the
importance of multiplying the number of micro-level case studies have been
raised on many occasions. Anyhow, in the light of the almost universal absence of
cause specific information in the past local civil status records of death, the need
of a geographical approach in the study of the Italian health transition still remains.
Dipartimento di Scienze Statistiche
Università di Bologna
Dipartimento di Economia, Impresa
e Regolamentazione
Università di Sassari
LORENZO DEL PANTA
LUCIA POZZI
37 We intend to explore the possibility of extending the period of analysis, as well as disaggregating the territorial level at the sub-regional one, using as standard the 1888 age and cause specific
mortality structure.
47
Age and cause mortality structure in the Italian regions etc.
APPENDIX
TABLE
Age and cause specific child mortality rates (per thousand) in the Italian regions, 1888
Causes of death
Infectious and parasitic
diseases
Measles
Typhoid fever
Diphtheria
Dysentery
Tuberculosis in all forms
Malaria
Diseases of the nervous
system
Convulsions
Apoplexy and cerebral
congestion
nom.
1938-42
0-30 gg 1-12 m
mf
mf
0-1
mf
1-4
mf
5-19 20-39 40-59
mf
mf
mf
60+
mf
totale
m
totale
f
totale
mf
1
1
1
1
1
1
1
3,52
0,20
0,16
0,18
0,04
0,56
0,23
28,24
3,99
2,31
2,32
0,67
5,90
2,39
29,48
3,86
2,28
2,31
0,66
5,99
2,43
21,72
4,49
1,97
4,05
0,62
3,88
1,45
3,98
0,28
0,62
0,74
0,04
1,25
0,30
4,03
0,04
0,53
0,02
0,02
2,72
0,23
2,90
0,01
0,43
0,02
0,06
1,52
0,35
4,55
0,01
0,95
0,03
0,58
1,27
0,85
6,53
0,74
0,77
0,75
0,18
1,96
0,59
6,69
0,67
0,81
0,72
0,17
2,32
0,48
6,61
0,70
0,79
0,74
0,17
2,14
0,54
6
6
9,28
8,23
13,90
9,05
21,99
16,49
3,94
1,69
0,60
0,02
0,56
0,00
1,55
0,00
10,91
0,00
3,12
0,88
2,64
0,73
2,88
0,81
6
0,37
0,36
0,70
0,13
0,05
0,15
0,95
9,11
1,21
1,04
1,13
Respiratory diseases
Bronchitis
Acute pneumonia
8
8
8
8,80
6,95
1,19
28,38
20,38
6,60
34,83
25,64
7,25
10,13
5,70
3,05
0,84
0,25
0,41
1,52
0,17
1,13
3,73
0,49
2,63
19,96
6,22
9,89
5,98
2,37
2,77
5,22
2,33
2,13
5,60
2,35
2,45
Digestive diseases
Enteritis and diarrhoea
9
9
9,13
5,81
38,79
32,69
44,74
35,83
13,27
11,00
0,68
0,34
0,67
0,22
1,63
0,58
7,16
3,97
4,53
3,18
4,32
3,09
4,43
3,13
Congenital anomalies
and perinatal conditions 14,15
Infantile atrophy
15
49,21
42,38
8,15
7,12
56,29
48,57
0,07
0,00
0,00
0,00
0,00
0,00
0,00
0,00
0,00
0,00
2,31
1,98
1,98
1,71
2,15
1,85
Other causes of death
1,42
6,69
7,57
4,17
0,92
2,33
4,35
29,41
4,84
5,54
5,19
Not determined causes
of death
All causes
18
0,19
2,89
2,85
1,57
0,23
0,29
0,53
2,04
0,70
0,75
0,72
81,55
127,05
197,73
54,87
7,25
9,40
14,68
74,03
28,01
27,13
27,57
REFERENCES
(1983), Measles mortality, state of nutrition, and family structure: a community study from Guinea-Bissau, “The Journal of Infectious Diseases”, 147, 4,
693-701.
A. BELLETTINI (1987), La popolazione italiana. Un profilo storico, Einaudi, Torino.
J. BERNABEU MESTRE (1993), Expresiones diagnósticas y causas de muerte. Algunas reflexiones sobre su
utilización en el análisi demográfico de la mortalidad, “Boletín de Demografía Histórica”, 11,3,
13-21.
C. BORRO SAPORITI (1984), L’endemia tubercolare nel secolo XIX : ipotesi per ripensare un mito, in F. DELLA
PERUTA (ed.), Malattia e medicina, “Storia d’Italia - Annali 7”. Einaudi, Torino, 841-875.
M. BRESCHI, M. LIVI BACCI (1986), Saison et climat comme contraintes de la survie des enfants.
L’expérience italienne au XIXe siècle, “ Population”, 41, 1, 9-35.
M. BRESCHI, L. POZZI, R. RETTAROLI (1994), Analogie e differenze nella crescita della popolazione italiana, 1750-1911, “Bollettino di Demografia Storica”, 20, 41-94.
M. BRESCHI, S. MAZZONI, P.M.MELIS, L. POZZI (2007), Nuove indagini per l’analisi della mortalità nei
primi anni di vita in Sardegna , in M. BRESCHI, L. POZZI (editors), Salute, malattia e sopravvivenza
in Italia tra ’800 e ’900, Forum, Udine, 195-220.
P. AABY, J. BUKH, I.M. LISSE, A.J. SMITS
48
L. Del Panta, L. Pozzi
(2010), The Sardinian experience of the lowest Italian
infant mortality rates in the past. True or false empirical evidence?, unpublished paper presented
at the Annual Conference of British Society for Population Studies, Exeter, September
2010.
L.J. BRUCE-CHWATT, J. DE ZULUETA (1980), The rise and fall of malaria in Europe, Oxford University Press, Oxford.
G. CASELLI (1990), Mortalità e sopravvivenza in Italia dall’Unità agli anni ’30, in SIDES, Popolazione, società e ambiente. Temi di demografia storica italiana (secc. XVII-XIX), CLUEB, Bologna, 275-309.
G. CASELLI (1991), Health Transition and the Cause-Specific Mortality, in r. SCHOFIELD, D. REHER, A.
BIDEAU (eds.), The Decline of Mortality in Europe, Clarendon Press, Oxford , 68-96.
G. CASELLI (2007), Mortalità degli adulti e differenze di genere nella prima fase della transizione sanitaria, in M. BRESCHI, L. POZZI (editors), Salute, malattia e sopravvivenza in Italia tra ’800 e ’900,
Forum, Udine, 293-310.
G. DALLA ZUANNA, A. ROSINA (2008), The fatal season. An analysis of extremely high winter neonatal
mortality, Working Paper Series n. 14, Department of Statistical Sciences, University of
Padua (available: www.stat.unipd.it/ricerca/wp).
G. DALLA ZUANNA, A. ROSINA (2010), A note on: The joint effect of maternal malnutrition and cold
weather on neonatal mortality in nineteenth-century Venice: An assessment of the hypothermia hypothesis, Population Studies 63 (3): 233-251 by Renzo Derosas, “Population Studies”, 64, 2,
193-195.
ISTAT, Cause di morte 1887-1955, Abete, Roma, 1958.
L. DEL PANTA (1984), Evoluzione demografica e popolamento nell’Italia dell’Ottocento (1796-1914),
CLUEB, Bologna.
L. DEL PANTA (1990), Fattori e condizioni della mortalità tra 1800 e 1930: igiene, salute e ambiente.
La situazione in Italia, in SIDES, Popolazione, società e ambiente. Temi di demografia storica italiana (secc. XVII-XIX), CLUEB, Bologna, 245-273.
L. DEL PANTA (1996), Dalla metà del Settecento ai nostri giorni, in L. DEL PANTA, M. LIVI BACCI, G.
PINTO, E. SONNINO, “La popolazione italiana dal Medioevo a oggi”, Laterza, Roma-Bari,
131-212.
L. DEL PANTA (1998), Costruzione di tavole di mortalità provinciali abbreviate 1881/82, “Bollettino
di Demografia Storica”, 29, 61-69.
L. DEL PANTA, M.E. FORINI (1994), Disponibilità alimentari e tendenze della mortalità in Italia: un tentativo di analisi per il periodo 1861-1921, “Bollettino di Demografia Storica”, 20, 111-121.
L. DEL PANTA, D.G. CALÒ, L.M.B. BELOTTI (2009), Elderly mortality in Italian regions at the beginning
of the health transition (1881-1921), “Statistica”, LXIX, 4, 243-267.
R. DEROSAS (2009), The joint effect of maternal malnutrition and cold weather on neonatal mortality in
nineteenth-century Venice: An assessment of the hypothermia hypothesis, “Population Studies”,
63, 3, 233-251.
R. DEROSAS (2010), Reply to the note by Dalla Zuanna and Rosina, “Population Studies”, 64, 2,
197-198.
ISTITUTO DI STATISTICA DEL REGNO D’ITALIA (1942), Nomenclature nosologiche per la statistica delle
cause di morte e dizionario delle malattie, Tipografia Fausto Failli, Roma.
M. GRMEK (1969), Préliminaires d’une étude historique des maladies, “Annales Economie Société
Civilisation”, 24, 1437-1483.
M. GRMEK (1995), Déclin et emergence des maladies, “História, Ciências, Saúde-Manguinhos”,
vol. 2, 2, July/Oct, 9-32.
M. LIVI BACCI (1993), Popolazione e alimentazione. Saggio sulla storia demografica europea, Il Mulino,
Bologna.
M. BRESCHI, M. ESPOSITO, S. MAZZONI, L. POZZI
Age and cause mortality structure in the Italian regions etc.
49
(1979), L’aumento della popolazione nell’era moderna, Feltrinelli, Milano.
Direzione della Statistica Generale
(1890), Statistica delle cause delle morti 1888, Tipografia Bodoniana, Roma.
MINISTERO DI AGRICOLTURA, INDUSTRIA E COMMERCIO, Direzione Generale della Statistica
(1892), Cause di morte. Statistica dell’anno 1890, Tipografia Elzeviriana, Roma.
MINISTERO PER L’INDUSTRIA, IL COMMERCIO E IL LAVORO, Ufficio Centrale di Statistica (1918),
Notizie statistiche della mortalità per tubercolosi negli anni dal 1887 al 1914, Tipografia Ditta
Ludovico Cecchini, Roma.
L. POZZI (2000), La lotta per la vita. Evoluzione e geografia della sopravvivenza in Italia fra ’800 e
’900, Forum, Udine.
L. POZZI, A. ROSINA (2000), Quando la madre lavora: industrializzazione e mortalità infantile nelle
province lombarde dall’Unità alla Grande guerra, in L. POZZI, E. TOGNOTTI (eds.), Salute e malattia fra ’800 e ’900 in Sardegna e nei paesi dell’Europa mediterranea, Editrice democratica
sarda, Sassari, 153-177.
L. POZZI (2007), Un’analisi territoriale delle differenze di mortalità per sesso nelle età dell’infanzia e
dell’adolescenza in Italia durante la transizione, in M. BRESCHI, L. POZZI (eds.), Salute, malattia e
sopravvivenza in Italia fra ’800 e ’900, Forum, Udine.
TH. MC KEOWN
MINISTERO DI AGRICOLTURA, INDUSTRIA E COMMERCIO,
SUMMARY
Age and cause mortality structure in the Italian regions at the beginning of the health transition: a research project
This paper aims at exploring Italian mortality structure (by age and cause of death) at
the regional level in the last decades of the 19th Century. These years, corresponding to
the beginning of the health transition process, were crucial in the Italian experience. The
analysis is based on a careful exploitation of the volume “Statistica delle cause delle morti
1888”, published in 1890, by the General Directorate of Statistics. This volume is the only
one which offers for the Italian regions, before the second World war, death statistics
classified according to both age and cause together.
The principal objectives of this descriptive contribution are essentially to illustrate the
territorial variation of mortality conditions in the first phase of the health transition process as well as to underline the relevance and the complexities of the causes specific mortality analysis to explain the geographical mortality differentials in terms of age and sex.
© Copyright 2026 Paperzz