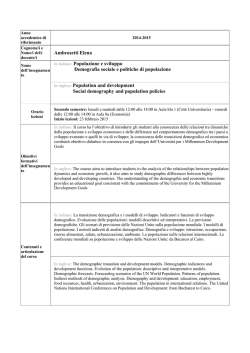
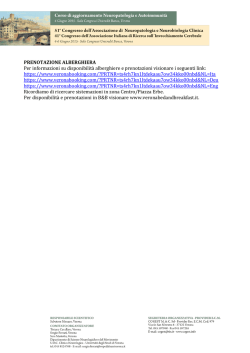
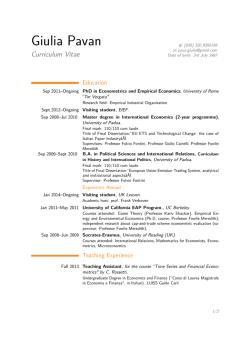
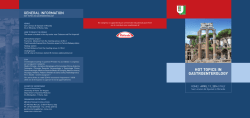
The population of ancient Rome
GLENNR. STOREY*
What was the population of imperial Rome? City blocks in Pompeii and Ostia are
sufficiently well explored that a fair estimate of population density can n o w be arrived at.
That peoples the city of ancient Rome with roughly 450,000 inhabitants, within the
known population and density range of pre-industrial and modern urban centres.
Introduction
What was the population of ancient Rome? Many
have believed there were as many as one million inhabitants - the figure in recent standard accounts [Brunt 1971: 376-88; Hopkins
1978: 96-8; Hodges & Whitehouse 1983: 4852; Stambaugh 1988: 90; Bairoch 1989: 259;
Robinson 1992: 8) and commensurate with the
city’s grandeur as capital of a great empire [FIGURE 1).But one million inhabitants in the 13.86
sq. km of the ancient city (Homo 1951: 98-9)
is the astonishingly high density of 72,150 persons per sq. km, roughly equal to the density
of sections of modern Hong Kong (Hong Kong
Census and Statistics Department 1971).l
A population estimate can be made by combining lines of evidence (in a manner similar
to recent research by, e.g., Blakely & Mathews
1990; Crown 1991; Kardulias 1992), including
the ethnohistoric record of Rome, the archaeological evidence of well-preserved Roman urban sites and the densities of pre-industrial and
modern cities. A house-by-house population
count for Pompeii and Ostia (including recon1 The area within the Aurelian Walls arguably did not
constitute the full urban area of ancient Rome. However,
it is unclear whether Rome had extensive ‘suburbs’in the
modern sense, or shanty towns. The question requires separate treatment; this analysis assumes that there were no
large, high-density suburban residency zones outside the
Aurelian Walls. That assumption (found in Homo 1951,
repeating earlier arguments) does not mean the landscape
was empty; far from it. But the settlement configuration
just outside the walls, while having a higher than rural
population density, was not an urban density, due to the
tombs, market-gardens and luxurious villas of the wealthy.
Purcell (1987a; 1987b] provides a useful discussion with
references.
structions of unexcavated areas) produces a
population density statistic applicable to Rome
and leads to a population estimate of the order
of half a million.
Background to demographic estimates for
Rome
Previous estimators of Rome’s population have
fallen into two opposite camps: the ones we
can call the ‘Great Rome’ theorists argue for a
million or more inhabitants, while ‘Little Rome’
theorists (so characterized by Carcopino 1940:
10) estimate at or below half a million; the history of demographic estimates reveals a pendulum swing between the extremes (G. Storey 1992:
17-62; Maier 1954). Many estimates in the favoured range of 750,000-1,000,000 inhabitants
start with the founder of the principate, Augustus,
whose posthumous testament to the Roman people, the Res Gestae divi Augusti (‘Achievements
of the Divine Augustus’) says (section 15):
Never did my largesse reach less than 250,000 people.
In . . [5 BC], I gave 240 sesterces to each one of
320,000 of the Roman people . . . In . . . [11 BC], I
gave to Romans then on the grain dole 240 sesterces
each. Their number stood at a little more than 200,000.
.
If these numbers are accurate, and if the
200,000 or 320,000 refer to a subset of the total
population (probably male household heads),
and if the remaining elements of the population - women and children, slaves, resident
aliens, police forces, transients etc. -are added,
then the population is at least 750,000, possibly
one million people or more (the earliest version
of this argument is in Lipsius 1605: 113-20).
* Department of Anthropology, 114 Macbride Hall, University of Iowa, Iowa City IA 52242-1322, USA. E-mail:
[email protected]
Received 20 December 1996, accepted 7 April 1997, revised 20 August 1997.
ANTIQUITY7 1 (1997): 966-78
Downloaded from https:/www.cambridge.org/core. IP address: 88.99.165.207, on 17 Jun 2017 at 22:14:56, subject to the Cambridge Core terms of use,
available at https:/www.cambridge.org/core/terms. https://doi.org/10.1017/S0003598X00085859
THE POPULATION OF ANCIENT ROME
Campus Mar tius
\
967
/pi:
Trans
0
1000
'
metres
FIGURE
1. Imperial Rome showing the boundaries, names, and numbers of the 14 regions established by
Augustus in 7 BC. The inner Servian Wall is indicated by the thinner dark line (breaks show locations of
gates in the walls). The outer Wall of Aurelian (thick dark line) enclosed 13.86 sq. km. Although built in
the 3rd century AD, the boundaries represented by the Aurelian Wall had been the customs boundaries since
the mid 1st centurym, effectively defining the limits of the city. (After Stnmbaugh 1988: 83, figure 6.)
The citing of the figures 200,000-300,000
may have been chiefly political in intent, to
glorify the accomplishmentsof Augustus (Finley
1985: 11,32). The two relevant enumerations
of the Roman census, 900,000 in 69 BC and 4
million in 2 8 BC are so disparate that some schol-
ars believe that the Augustan census of 28 BC
must have included women and children, not
just the usual male citizen family heads (Beloch
1968 [18861: 370-78; Brunt 1971: 1 2 0 ; Nicolet
1991: 131);the counter-opinion in Frank 1924;
Wiseman 1969; Lo Cascio 1994.
Downloaded from https:/www.cambridge.org/core. IP address: 88.99.165.207, on 17 Jun 2017 at 22:14:56, subject to the Cambridge Core terms of use,
available at https:/www.cambridge.org/core/terms. https://doi.org/10.1017/S0003598X00085859
968
GLENN R. STOREY
Ancient Rome and statistics
‘Census’ is a Latin word, and the modern notion of a state counting the population is a direct legacy from the Roman system of counting
its citizens. The complex Roman census process involved a sworn declaration of age, family and property, allowing the administration
to record the city’s human and property resources and to rank them (Nicolet 1991: 126).
The procedure, originally confined to Romans
in and near Rome, later expanded to subjects
in the provinces for the purposes of taxation,
as the Gospel according to Luke (2: 1)says: ‘And
it came to pass in those days, that there went
out a decree from Caesar Augustus, that all the
world should be taxed.’ This Judaean census,
mistakenly identified by Luke as universal, was
merely a provincial enumeration of taxable
communities necessitated by an administrative
re-organization initiating direct rule by the Romans. For the non-specialist observer of Rome,
it demonstrates that Roman administration was
an efficient record-keeping bureaucracy.
The Romans were not in the habit of recording, reporting and using statistical information
for public policy-making, as governments do
today (Finley 1985: 32), nor did ancient Rome,
at the time of Christ, have a bureaucracy, collecting statistics for administrative purposes
(Garnsey & Saller 1987: 2 0 4 0 ) . Under the Republic, the administrative tasks of governance
were carried out by members of the slave household of each Roman statesman holding power.
When Augustus founded the principate, he simply used his personal slave assistants as administrators (Weaver 1972). The elaborations
and additions to this basic pattern evolved into
the imperial bureaucracy, eventually an oppressive entity that bequeathed to English the negative connotations associated with the term
‘Byzantine’ (Carney 1971).
This view of how the imperial bureaucracy
came into being -the ‘primitivist’ view (Nicolet
1991: 162-3) -posits a simple, ad hoc, undifferentiated administrative structure resembling
a ‘patchwork’ of slowly evolving bodies of organization [Carney 1971: 29). But a considerable body of evidence suggests there was a
long-standing Roman tradition of urban enumeration (Nicolet 1987), and that some sort of
count of the inhabitants of the city of Rome
was made at various times. Suetonius (Caesar
41.3) recounts:
He [Julius Caesar] carried out B recensus [partial
census or review enumeration not requiring a sworn
declaration], not according to custom nor in the usual
place, but street-by-street, with the aid of the apartment house owners.
Suetonius (Augustus40.2)also states that Augustus
did likewise. These two occasions may not have
been the first (Nicolet 1991: 129-30).
Urban record-keeping took other forms as
well. At the beginning of the 3rd century AD,
the Emperor Septimius Severus displayed the
Forma Urbis Marmorea (Marble Plan of the City)
- a map of ancient Rome, showing its streets,
structures, and monuments (Carettoni et al. 1960;
Rodriguez-Almeida 1981).The fragments of the
Severan plan, about 10% that still exist, indicate
that precise details of the urban configurationwere
known to administrators. Both Augustus and
Vespasian had displayed similar plans (Palmer
1980: 2.271, which show houses and, apparently,
even habitation units in many houses. The number
of people in those units, which may have been
matters of record, were not included on the maps.
The precise administrative functions of the marble plans remain debatable; the kind of information-collecting reflected in these plans, and in
the activities of the officials of Julius Caesar,
Augustus and their successors, probably continued throughout imperial times.
There is no record of a city-wide census,
whereas a census of all citizens throughout the
empire, and partial censuses of entire subject
populations, are known. A register of births and
deaths in Rome and the provinces apparently
was kept, which would be of enormous demographic value. Without those records themselves,
our best expedient is to imitate, using modern
methods, the process carried out to produce the
Severan plan, taking it a step further by adding
population counts for each unit. While this is
impossible, at this point, for the city of Rome
itself, other examples of the Roman archaeological record can make up for this deficiency.
Methodology
Pompeii, Ostia and AutoCAD
Pompeii, a city ruin in central southern Italy, is
75% excavated (Jashemski1979:6).This site, once
aresort and market centre 200 km south of Rome,
offers an excellent opportunity for understanding Roman urban public and domestic structures
because of its preservation by the eruption of Mt
Vesuvius in AD 79 (De Vos & De vos 1982;
Downloaded from https:/www.cambridge.org/core. IP address: 88.99.165.207, on 17 Jun 2017 at 22:14:56, subject to the Cambridge Core terms of use,
available at https:/www.cambridge.org/core/terms. https://doi.org/10.1017/S0003598X00085859
THE POPULATION OF ANCIENT ROME
Richardson 1988; Jongman 1988;Laurence 1994;
Wallace-Hadrill 1994).The layout of the city has
been extensively studied and documented, even
to identifying the function [and even ancient
ownership) of a large proportion of the existing
remains, although the methods of identification
are not completely reliable (Della Corte 1965;
Eschebach 1970; 1981; Castren 1975: 21-37;
J o n p i a n 1988; Wallace-Hadrill 1991: 219; Van
der Poel et al. 1983). Pompeii is ideal for generating an accurate demographic estimate based on
a hypothetical house-by-house inhabitant count.
Closer to Rome is the city of Ostia, once
Rome’s port at the mouth of the Tiber River, a
rich city about 50% excavated (Packer 1971;
Meiggs 1973; Calza 1953; Pavolini 1988). Ostia differed from Pompeii in urban functions;
its livelihood was derived from commerce, and
it did not depend extensively on its own hinterland for subsistence support. The evidence
of Pompeii and Ostia, taken together, represents
the best avenue to understanding the configuration and urban characteristics of ancient Rome
[Packer 1971: 1;Ward-Perkins 1974: 36).‘
As neither city has been completely excavated, neither provides a complete house count
for a census. To correct for this, computer-generated archaeological maps (FIGURES
2 & 3),
including suppositions about unexcavated areas, were made for both sites by digitizing existing archaeological maps (Ostia: Gisrnondi in
Calza 1953, with later updates from Pavolini
1988; Pompeii: Eschebach 1981) and using the
AutoCAD architectural drawing software package (versions 10 and 1 ~ ) . ~
2 Rome, Ostia and Pompeii are not ‘typical’ Roman cities, but the degree of the ‘atypical’ found in Pompeii and
Ostia occurred also in Rome. Pompeii’s houses, possibly bigger than in a non-resort town, would also be found in Home
because the governing Blites had their largcst residences there.
Ostia’s commercial functions also characterized the capital
as well as the high frequency of apartment residency.
3 As pointed out by Wallace-Hadrill (1994: 71),the structure function identifications of Van der Poel et al. (1983)
are probably more reliable than those of Eschcbach (1970;
1981) utilized here. However, the most frequent emendation required by Van der Poel et al. (1983)would he changing
Eschebach’s commercial/industrial function identifications
back into ordinary private domus. The occupancy differentials between those two types of structure uses would
not significantly alter the results, or, if they did, they would
serve only to increase moderately the number of occupants
because Roman ’cottage’industries would have had worker
contingents similar in size to thc average slave contingent of
a private domus. So,Eschebachs identifications, though questionable in a number of cases. still yield reasonable results.
969
Features of the AutoCAD maps
The configurations of the maps maximize the
population estimates because the goal is to identify the largest possible population size. The
maps were constructed as separate layers of
functionally distinct buildings: public structures, domestic structures, shops, apartments,
taverns, production loci, and for estimated as
opposed to known configurations.
In estimating for the unexcavated areas, the
unexcavated areas of both sites were taken to
be chiefly residential. In Roman cities, structures of differing functions commonly appeared
in the same district; there was no overt zoning
in the modern sense (Paoli 1963 [1940]: 5-32;
Laurence 1995:64-5). There was the well-known
tendency of craftsmen plying the same trade
to congregate in the same neighbourhood (Paoli
1963 [1940]: 33-5), and a tendency for warehousing to concentrate in the same places. But
the mixing meant that shops, workshops, living quarters, taverns, etc. were located in most
districts of every city.
Public and non-residential structures have
accordingly been ‘rebuilt’ into the fabric of the
unexcavated areas, but no major concentrations
of non-residential architecture have been added.
Nothing similar to a large public Forum complex was placed in either city’s unexcavated
regions; with all the work that has been done
at both sites, it is unlikely that major complexes
of public structures remain to be discovered.
The estimated configurations were patterned
after the main residential zones seen in the
excavated parts of each city, with nothing inappropriately placed where it could not believably have actually stood.
The basis of ihe population estimates
Two types of residences characterize the fundamental patterns of Roman domestic life: the
domus, a private town-house or mansion, and
the apartments, either individual units or arranged in blocks or buildings, known as insulue (literally ‘islands’).The bulk ofthe residential
population inhabited these two types of buildings. The pattern of residence seems to have
been basically one family per unit (Paoli 1963
[19401: 56; Meiggs 1973: 235-62), but how many
people constituted the average Roman family?
Bradley (1991) and Wallace-Hadrill (1991)
have argued that the concepts of ‘nuclear’and
‘extended’ families for Roman society inad-
Downloaded from https:/www.cambridge.org/core. IP address: 88.99.165.207, on 17 Jun 2017 at 22:14:56, subject to the Cambridge Core terms of use,
available at https:/www.cambridge.org/core/terms. https://doi.org/10.1017/S0003598X00085859
N
metres
FIGURE
2. AutoCAD map of Pompeii, a s i f m a y have looked on 24 August AD 79.Colour code: black=sfreets, walls and water distribution points; blue=private
houses (domus); green=gardens; red=public facilities; turquoise=enterfainment facilities; mogenta=commercial/industrial facilities; yellow=apartment unjts
[insulae); orange=facilities for collegia [guilds);blue dots indicate conjectured configurations for unexcavated zones.
Downloaded from https:/www.cambridge.org/core. IP address: 88.99.165.207, on 17 Jun 2017 at 22:14:56, subject to the Cambridge Core terms of use, available at https:/www.cambridge.org/core/terms.
https://doi.org/10.1017/S0003598X00085859
THE POPULATION OF ANCIENT ROME
971
FIGURE
3. AutoCAD m a p of Ostia, showing the existing and reconstructed remains of the city dating
from the 2nd to 4th centuries AD. Colour code as for FIGURE2, excepf that black includes docks
conjectured along the river front at the top of the m a p and green=warehouse facilities.
equately describe an extremely complex institution, with high incidence of divorce and remarriage. Their argument, though correct, does
not upset the factual residential character of
the Roman family unit, a core nuclear family
with conjugal couple and dependent children.
The Roman family, as a co-residential unit, was
of the nuclear, not the extended, variety (Saller
& Shaw 1984; Shaw 1984; Saller 1984; Rawson
1986: 8-15; 1991a: 1-5; Parkin 1994). Not all
progeny of all past unions of the two remarried adults were living together at any one time,
in the same house or apartment.
This conjugal nuclear family provides a reasonably well-defined basic unit. It is generally
agreed that the pre-industrial nuclear family
was small - averaging between 3 and 5 or 6 individuals at a q 7 one moment (Russell 1958; 53;
Haviland 1972;Parkin 1992:91-133; Evans 1993).
Prior to the ‘demographictransition’,when health
and medical practice began to depress the level
of mortality below the level of fertility and trigger explosive population increase, high natural
fertility was offset by high infant mortality [Weiss
1973: 42-51, 55-6, 77-8), a factor particularly
characteristic of pre-industrial urban centres due
to their general problems of sanitation
(Teotihuacan:R. Storey 1992;Europe in general:
de Vries 1984;London: Finlay 1981;Rome: Brunt
1971: 133-6,385-8; Scobie 1986).
Downloaded from https:/www.cambridge.org/core. IP address: 88.99.165.207, on 17 Jun 2017 at 22:14:56, subject to the Cambridge Core terms of use,
available at https:/www.cambridge.org/core/terms. https://doi.org/10.1017/S0003598X00085859
972
GLENN R. STOREY
This basic size for Roman family units can
be adjusted both up and down. The small apartment units, it seems clear, characteristically held
either a single individual or a partial family.
The Roman written record describes the smallest
apartment units, with indications strongly pointing to common habitation by single men, a pair
of single men, a single mother and her children or small nuclear fa mi lie^.^ The anthropologically derived range of 3 to 5 or 6 persons is
reasonable for these families of lower socioeconomic status since they did not possess
sufficient wealth to own their own houses
(McKay 1988: 13734,1378-9).
The inhabitants of private town-houses or
mansions had greater wealth (Wallace-Hadrill
1991; 1994). Presumably, the nuclear families
inhabiting these houses were the same size as
the ‘normal’ pre-industrial nuclear family
characterizing the shops and apartments, again
3 to 5 or 6 individuals. These households contained retainers, poorer relations and slaves.
The number of slaves in Roman antiquity is
a vexing question. The common view continues to be that the number of slaves in Roman
culture was large - of the order of one-third
to 40% ofthe population (Brunt 1971: 124,7023; Bradley 1994: 29-30). The commonly cited
‘one-third’ comes from one source, the Greek
physician of the imperial period, Galen of
Pergamon (c. 130-200 AD) in a work called ‘On
the suffering of the soul’ (Kuhn 5.49). Galen
suggested that the p’opulation of the Greek city
of Pergamon in western Turkey was about
120,000: 40,000 citizen males, 40,000 women
and children and 40,000 slaves (one slave for
every two free persons). In the numerous citations of this source, it has rarely been pointed
out that Galen’s language in the passage is highly
4 The poetry of Martial (Marcus Valcrius Martialis u. AD
38-104) and Juvenal (Decimus Junius Juvenalis c. AD 60130) is particularly suggestive on the question of single
men: see for example, Martial Epigrums 1.86; 1.117.6-7;
2.53; 3.30.3-4; 8.14.56; 8.20-22; 11.32; 11.56.3-8; 12.18.16; Juvenal Satires 3.197-202. Suetonius (Gaius Suetonius
Tranquilhis c. AD 70-140) also noted that poor single men
lived alone in small upper-floor apartments (On Grammurians and rhetoricians 9). Regarding single mcn living together Diodorus Siculus (c.80?-21? RC: Iz’orldHistoqr3i.18.2)
reported that the impoverished Egyptian monarch Ptolemy
XI1 lived cheaply by sharing an upper-floor apartment in
Rome with a Greek scholar, due to the high rents. Regarding a small household, Martial describes a rent-dodging
family unit consisting of a man, his wife, mother and sister (Epigrams 12.32.1-25)
conditional. K.J. Beloch doubted its utility (an
1897 observation quoted in Lo Cascio 1994: 25,
n. 1 2 , 27), as have Warden & Bagnall (1988:
220, n. 2) more recently. Galen’s source for these
figures is unknown, and it is improbable that
the number of males, females and children
would have been equal.
Other sources give a different view of the
number of slaves, and imply that slave holding on the part of most individuals in Roman
society was moderate - maybe two or three
per family (Horace Satires 1.3.11-12; Dionysius
of Halicarnassus World History 31.18.2). But
the scattered references in the historic record
that report an extreme situation (200 slaves,
Horace Satires 1.6.116; 4116 slaves, Pliny the
Elder NaturalHistory33.135; 400 slaves, Tacitus
Annals 14.4)have been accorded greater weight.
‘Oneof the problems about the literary evidence’,
Wiedemann remarks (1981: loo), ‘is that what
was thought worth noting down was almost
always what was exceptional’. There is no doubt
that the imperial household was the largest body
of slaves in the ancient world, but no evidence
to agree with Carcopino (1940: 70) that they
numbered some 20,000. This might be true were
every slave on every imperial estate in the
Empire to be counted; it is doubtful for the palace
and city contingent stationed in Rome. For the
population of imperial slaves resident in Rome,
a few hundred or a thousand or two at most
seems more realistic.
Carandini’s recent excavations of Blite household buildings in the very heart of the Roman
Forum have demonstrated that the number of
slaves was small (1988: 359-87). Even if Blites
resident in Roman cities owned hundreds of
slaves, it is equally true that not all of those
slaves would have been domiciled there; the
Roman Blite owned multiple houses, and each
would have had its resident slaves. Evidence
from Roman Egypt suggests that common slave
holdings for wealthy families were from 6 to
18, with one exceptional case of u p to 70
(Wiedemann 1981: 101). Thus, the number of
slaves in most Blite households was moderate
(see Westermann 1955: 86-9, especially 88).
Counting slaves and any resident retainers or
poor relations (not always present), the members of the household outside the nuclear family would likely have been 10-12. So, adding
the basic ‘master’ nuclear family size (3 to 5 or
6) to the household slave and others contin-
Downloaded from https:/www.cambridge.org/core. IP address: 88.99.165.207, on 17 Jun 2017 at 22:14:56, subject to the Cambridge Core terms of use,
available at https:/www.cambridge.org/core/terms. https://doi.org/10.1017/S0003598X00085859
THE POPULATION OF ANCIENT ROME
region
outside Herculaneum
Pompeii
dwelling
units
Pompeii
Pompeii
population mean count
per unit
11
291
26.4
three
four
five
six
seven
eight
nine
215
32
145
46
115
222
293
118
230
1604
409
817
167
943
1965
2020
1124
1792
7.4
12.8
5.6
3.6
8.2
8.8
6.9
9.5
7.8
total
1427
11,132
9.7
gate
one
two
973
Ostia
dwelling
units
123
69
111
93
121
-
51 7
Ostia
population
Ostia
mean count
per unit
5351
3149
4863
3168
5343
43.5
45.6
43.8
34.1
44.2
21,874
42.2
-
-
TABLE1.Population counts for Pompeii and Ostia. The ‘region’ designations are modern conventions
(nine defined for Pompeii;five for Ostia).
gent size (10-12) yields a total house occupancy
of between 1 3 and 17.
Assignment of counts procedures
With these assumptions, the simulation was
carried forward: for both cities, each residential unit (real or fictive) was assigned an occupancy count, using the 3-5 or 6 range for
apartment dwellings, the 13-17 range for private houses. The assignment of an actual number
was guided chiefly by the size of the unit: in
most cases, a small unit was assigned a figure
towards the lower end of the appropriate range,
a larger unit towards the upper end.
That rule was deliberately and randomly
violated to reflect more faithfully the habitational
realities of urban life, as rightly emphasized
by Wallace-Hadrill (1991: 202, 213, 214, 2257). Not all large units hold more people, or small
ones fewer. In modern US society, a well-off
widow occupies a large mansion, while a twobedroom apartment houses eight people in the
inner city. Roman examples would be: an aging 6lite couple with a handful of slaves occupying one of the larger town-houses in the
backstreets of Pompeii; two families of commoners recently evicted from their land in southern E M a who tryto make a living selling ceramic
vessels in a small shop-front in Ostia, squeezed
into the small mezzanine apartment upstairs with
two slaves sleeping on the shop floor; or, the son
of a low-rankingsenator who occupies a spacious
three-room apartment on the second floor of an
apartment house with three slaves.
About 20% to 25% of the total sample was
varied in this way. To assure that the procedure was applied consistently, no totalling was
done until all assignments were complete for
both sites.
Results
TABLE
1 gives the totals for both sites: Pompeii
has a population of 11,132 inhabitants, at a
density of 16,615 persons per sq. km; Ostia has
21,874 inhabitants, at a density of 31,700 persons per sq. km.
Previous estimates for Pompeii (summarized
in Jashemski 1979: 343 n. 56) range from 6400
(Russell 1977) to 30,000 (Cary & Scullard 1975),
but the range favoured today -between 8000
and 12,000 (Jongman 1988: 110-12; WallaceHadrill 1991: 199-200) -finds strong support
from the simulation. It also matches recent work
by Wallace-Hadrill (1991; 1994)who subjected
a sample of houses from Pompeii (and
Herculaneum) to scrutiny as to their sizes, layouts and probable parameters of occupancy. As
in this current study, Wallace-Hadrill worked
from the ‘bottom up’, looking ’in detail at the
evidence of the houses themselves [to] see what
they imply about the density and distribution
of population within the city’ (1991: 201). He
assumed a population of around 10,000 (1991:
203). The maximum number of dwelling units
thought to exist in the entire city was 1500,
close to the 1427 of this study. His average
household unit size was 7-7 to 8.3, although
his method shied away from simple average
Downloaded from https:/www.cambridge.org/core. IP address: 88.99.165.207, on 17 Jun 2017 at 22:14:56, subject to the Cambridge Core terms of use,
available at https:/www.cambridge.org/core/terms. https://doi.org/10.1017/S0003598X00085859
GLENN R. STOREY
9 74
year
population
1881
1901
1911
1921
1931
1951
272,012
424,860
409,263
4 71,85 7
460,196
444,009
population density
(persons per sq. km)
18,675
26,289
25,324
29,127
29,347
28,315
Source: Comune di Roma Ufficio di Statistica e Censimento
1960 Tavole 17, 65; Tavole 19, 68; Tavole 21, 70; Tavole
23, 73; Tavole 25, 76; Tavole 42, 233.
TABLE2. Modern city of Rome population 18811951.
statistics. The result in this study (TABLE
1)is
also not very different - 9-6 persons per unit.
Strocka (1984: 49-50) concluded that the
house in Region 6 , Block 15, Doors 7 and 8 at
Pompeii contained a private suite for 6-10 family
members and slave quarters for 3-5, in a domus
that probably housed 12-20 people, when houseowners, tenants and slaves are included.
Wallace-Hadrill noted that the figures could
easily be reversed: 6-10 slaves, a family of 3-5
for the private suite (1991:222). These independent results, strongly supportive of the method
and result in this current study, bring an accurate picture of the city’s population within sight:
the scale of 6000 for Pompeii is not correct, nor
is the scale of 20,000; 11,000 is the better figure.
With about 75% of Pompeii fully excavated,the
degree of completeness in the data helps investigators, working from similar methodologies and
assumptions, to arrive at a consensus.
For Ostia,previous estimates (briefly discussed
inMeiggs 1973:532-5) range from 20,000 (Nibby
1829:61)to 100,000(Calza 1926: 16). Packer (1971:
48000
44000
4oooo
2
m
16000
8000
4000
0
0
10
20
30
40
50
60
70
80
90
100
Frequency
FIGURE
4.Histogram of urban population densities, from a sample of 531 cities: 425 pre-industrial cities
(up to 1930), and 106 modern cities (1980 and 1985 United Nations statistics).
Downloaded from https:/www.cambridge.org/core. IP address: 88.99.165.207, on 17 Jun 2017 at 22:14:56, subject to the Cambridge Core terms of use,
available at https:/www.cambridge.org/core/terms. https://doi.org/10.1017/S0003598X00085859
THE POPULATION OF ANCIENT ROME
70), with careful analysis of the residential units
and a family size of 4 (from Russell’s 1958 study),
concluded that Ostia was inhabited by no more
than 27,000 people. The current study at 22,000
substantiates Packer’s conclusions, and Nibby’s
19th-century estimate seems remarkably astute.
The high figures of 35,000, 50,000 and the unlikely 1OO,OOO are incorrect.s
These two population densities based on Roman archaeological data from Italy can be applied to ancient Rome. The average of the two
densities - one nearly twice the other - is
24,158 persons per sq. km. Applied to the known
area of the ancient city -13.86 sq. km enclosed
by the Walls of Aurelian -this makes the ancient population of the city about 335,000. So,
applying the higher figure from Ostia alone,
the city of warehouses and apartment houses,
to Rome, also a city of warehouses and apartments, at 31,700 persons per sq. km, the ancient population of Rome was 440,000.
The recent population history of Rome in
the area roughly equivalent to that of the ancient city is relevant. The period 1881-1951
(TABLE
2 based on Comune di Roma Ufficio
di Statistica e Censimento 1960) saw a growth
in the population of the city that had only
occurred previously in antiquity -to a maximum about that estimated for antiquity: some
450,000, with a density of close to 30,000
persons per sq. km at its most crowded. Even
conceding the many differences between antiquity and modern times, these recent data
should give pause to the claim that ancient
Rome had one million inhabitants.
Population density in a cross-cultural
perspective
Is the half-million result reasonable in other
respects? Substantiating evidence can be drawn
from systematic analysis of urban population
densities derived from adequate census data
and from less-adequate observer-traveller estimates. A sample is used of 531 cities, 425 preindustrial cities, 106 modern. Their densities
cluster well below 20,000 persons per sq. km
(FIGURE
4). In the entire combined sample, all
but 14 of the 531 cities, or 97,6%, had densities below 45,000 persons per sq. km; the mean
5 Janet DeLaine [pers. comm. 1995) reports one of her
students, Andrew Pearson, recalculating the population
of Ostia, arrived at a figure of 22,000.
975
is 14,542, with the distribution heavily skewed
to the lower end; the median is 10,935.6
The modern city sample (the 106 largest urban
centres according to the United Nations) shows
a similar profile: mean density 5991 persons
per sq. km; median 3790 per sq. km; maximum
42,571 (Manila in the 1980s). No modern city
possesses an overall population density remotely
near that for an ancient Rome of one million
people. Although modern cities might seem able
to support very high densities with advanced
architectural and transport technology, in fact,
they sprawl over very large territories in comparison to pre-industrial cities; the mean area
of the pre-industrial sample is 6.63 sq. Ism, of
the modern 807.
The mean density of the pre-industrial sample
of 425 is 16,661 persons per sq. km (median
12,897): the pre-industrial cities were more
crowded and compact than modern ones. These
data are based on various estimates reported
in a variety of sources at a variety of periods;
few accurate censuses of urban populations exist
before that for London of 1801 (Abstract. . .
1801), based on a count from parish registers.
Chandler & Fox’s study of urban growth
(1974) compiles many different estimates and
with supplementary sources -including New
World archaeological estimates independently
arrived at - indicate a normal urban density
range of ~O,OOO-ZO,OOO persons per sq. km
(Casselberry 1974; Haviland 1972; Blanton 1981;
Millon 1981; Calnek 1976; Healan 1977; Sanders et al. 1979; Culbert & Rice 1990; Webster &
Freter 1990).
If the pre-industrial data do represent a reasonable picture of population density, pre-industrial cities were more dense than their
modern counterparts; for the 205 pre-industrial
European cities, the average is only 18,042
persons per sq. km. Only four cities exceeded
6 The data are from the following sources: Census of
England and Wales 1881; Minister0 di Agricoltura, Industria e Commercio, Direzione della Statistica 1883; Ministere
du Commerce Service de la Statistique Generale 1883; Lot
1945-1950; Frankfort 1950; Russell 1958; Adams & Nissen 1972; Chandler & Fox 1974; Calnek 1976; Schinz 1989;
United Nations Population Fund 1988. The Chandler &
Fox volume is the main source for the pre-industrial data,
and Chandler (1987) has up-dated the volume. A preliminary analysis of the more recent data, a sample of 273 entries, shows a 98.9 cumulative percent below 45,000 person
per sq. km and a mean density of 13,789 persons per sq.
km, lower than the results reported below.
Downloaded from https:/www.cambridge.org/core. IP address: 88.99.165.207, on 17 Jun 2017 at 22:14:56, subject to the Cambridge Core terms of use,
available at https:/www.cambridge.org/core/terms. https://doi.org/10.1017/S0003598X00085859
976
GLENN R. STOREY
Discussion
The dcnsity figure for Yompeii is roughly average for a pre-industrial urban density sample, that for Ostia is comparatively high, and
well within the range of possibilities.
Stambaugh, realizing that an ancient Rome of
one million persons equals a population density in the 70,000s per sq. km found evidence
to support that figure (1988: 90):
But Bombay’s 1980 density was 18,796 persons
per sq. km; Calcutta’s was 31,779 (United Nations Population Fund 1988) - very much as
calculated for Pompeii and for Ostia, respectively! Those densities, when applied to the
area of ancient Rome, result in a population
well under half a million. Stambaugh used a
‘spot density’ from United Nations (1980) statistics. Spot densities are extremely high population densities found in cities all over the world
-but in exclusively small areas of only a few
hectares to one or two sq. kms. Only by applying a modern spot density statistic to the entire urban area of ancient Rome can the one
million population figure be reached. Beyond
the city of Rome itself lay a hinterland territory of roughly 2500 sq. km. If a population of
one million is to be supposed, it would be across
that larger region, comparable to that estimated
for the entire population of the Basin of Mexico
during the Late Horizon Aztec period on the
eve of the Spanish conquest (Sanders et aI. 1979).
If we assume a population of about a million, we
must conclude that Rome in the early principate was
one of thc most densely populated cities the world
has ever known - as crowded, probably, as modern Bombay or Calcutta.
Acknowledgements. Special thanks l o Susan Evans a n d
Winfield Swanson for their assistance, the University of
Iowa Office of Research for generous support for graphics
reproduction, a n d m y wife, Andrea Storey. All shortcomings of this paper are the author’s alone.
References
fllwtract oftlie airswer,~and returiis made pursuant to an Act
passed in the Fifty-IGrst Year of I I i s Majesty King George
I11 intitlod ‘An Act for taking an Account or the Population of GreatBritain mid the Incrcasc orDiminution thereof’
enumerntiorr Part 1 , England a n d Wales. 1801. London:
Groat 13ritain General Rogistcr Office.
AIIAMS, R. M(X:, & H. NISSKN.1972. The Uruk counfrySide.
Chicago (11,): Aldine.
I J m c o c i I , 1’. 108!1. IJrhauizaliou and the ecoiiomy in preindustrial
socictics: thc findings of two decades of research, lournnl uf Europcan Economic Hislory 18: 239-90.
IJici.oc:rr, K.J. 1968 Lltlll(i]. Dir: Bcviilkcrung der GriechischenRii171ischen W d t . Kome: 1,’Erma di Bretschneidcr.
BI.AKLII.Y,R.L. & 11,s. MA’I’FIEWS.
1990. Bioarchacological evidence for a Spanish-Native American conflict in the 16thcentury southeast, American Antiquity 55(4): 718-44.
RI.ANTON, IUi. 1981. The rise of cities, in Sabloff (ed.): 392402.
~ R A l I l , l ? YK.
, 1991. Discovering the 110117an family: studies in
Roinan social history. New York (NY): Oxford IJniversity Press.
1994. Slavery and society at Ilonie. New York (NY): Cambridge University Press.
BRIJNT,P.A. 1971. Italian manpower: 225 1lc to Ar, 14. New
York (NY): Oxford University Press.
(:AI.NRK, E X 1976. The internal structure of Tenochtitlan, in
E.R. Wolf (cd.), The Valley of Mexico: studies in pre-Hispanic ecology a n d society: 287-302. Albuquerque (NM):
IJniversity of New Mexico Press.
CAIZA,G. 1926. Ostia. Rome: La Libreria dello Stato.
(Ed.). 1953. Scavi d i Ostia: topografia generals. Rome: La
Libreria dello Stato.
CARANDINI,
A. 1988. Schiavi in Italia: gli strumenti pensanti
dci Romani fra tarda Repuhblica e nredio impero. Rome:
La Nuova Ilnlia Scicntifica.
CAR(:OPINO, J. 1940. Ilailylife in ancient Rome: lhe people a nd
city at the height of the Empire. Ncw Haven (CT): Yale
University Press.
CARETTONI,
G., A.M. COLLINI,
L. (:OZZA & G , GATTI. 19fiO. La
pianta marmorea di Roma antica: forma urbis Iloniuc.
Rome: M. Danosi.
CAHNL(Y,
T.1:. 1971. Bureaucracyin traditional sociotics: IlomonoByzantine bureaucracies viewcd from within. Lawrence
(KS): Coronado.
1975. A history of Rome down to
CAl<Y,M. & H.H. SCIJLLARD.
the reign of Constantine. 3rd edition. New York (NY): St
Martin’s.
CASSEI,~URY,
S.E. 1974. Further refinement of formulae for
determining population from floor area, World Archaeo/ogy6(1): 117-22.
CASTKBN,
P. 1975. Ordo populusquc pompeianus: polity a nd
society in Roman Pompeii. Rome: Bardi Editore. Acla
lnstituti Romani Finlandioe 8.
Census of England a nd Wales 1881 area, houses a n d population 1. 1883. London: Eyre & Spottiswoode.
CHANDLER,
T. 1989. Four thousand years of urban growth: a n
historical census. Lewiston (NY): St David’s.
T. & G. Fox. 1974. 3000years of urban growth. New
CHANDLUR,
York (NY): Academic.
COMUN$ DI ROMAUPFICIO DI STATISTICA E CENSIMENTO. 1960.
Roma: popolazione e territorio dal 1860 a1 1960 con
la distribuzione territoriale dei risultati dei censimenti.
Rome.
50,000 persons per sq. km, and none equalled
or exceeded 54,112 persons per sq. km, the
density equivalent to an ancient Rome of 750,000
inhabitants.
For the 8 2 pre-industrial cities existing during the Roman period, the mean density falls
to 13,607 persons per sq. km;within arange from
4000 to 37,750, 94% of the cities have a density
below 22,000. Not one Roman, European or other
pre-industrial city equals the population density
for an imperial Rome of one million inhabitants
- or even of 750,000 inhabitants.
Downloaded from https:/www.cambridge.org/core. IP address: 88.99.165.207, on 17 Jun 2017 at 22:14:56, subject to the Cambridge Core terms of use,
available at https:/www.cambridge.org/core/terms. https://doi.org/10.1017/S0003598X00085859
THE POPULATION OF ANCIENT ROME
CROWN,
P.L. 1991. Evaluating the construction sequence and
population of Pot Creek Pueblo, northern New Mexico,
American Antiquity 56(2): 291-314.
CVLRERT,
T.P. & D.S. RICE led.). 1990. Precolumbian population history in the Maya Lowlands. Albuquerque (NM):
University of New Mexico Press.
DELLACORTE,M. 1965. Casc ed abitanti di Pompei. 3rd edition. Naples: Casa Editrice P'austo Fiorentino.
DK VOS, A. & M. DE VOS. 1982. Pompei Ercolano Stobia. Rome:
Giuseppi Laterza.
DE VRIES, J. 1984. European urbanization 1500-1 BOO. Cambridge
(M.4): Harvard University Press.
ESCWEBACH,
H. 1970. Die Stadtbauliche Entwicklung des Antiken
Pompeji. Heidelberg: F.H. Kerle Verlag. Mitteilungen des
Deutschen Archaologischen Instituts Romische Abteilungen
Siebzehntes Erganzungsheft.
1981.Ponipei: pianta scavi. Naples: Editore Generoso Procaccini.
EVANS,S.T. 1993. Aztec household organization and village
administration, i n R.S. Santley & K. Hirth led.),Prehisponic
domestic units in western Mesoamerica: 173-89. Boca
Raton (FL): CRC.
R. 1981. Population and metropolis: the demography
FINLAY,
of London 1580-1650. New York (NY):
Cambridge University Press.
FINLEY,
M.1. 1985. Ancient history: evidencc and models. London: Chatto & Windus.
FRANK,T. 1924. Roman census statistics from 225 to 28 BC,
Clussical Philoiogy 19: 3 2 9 4 1 .
FRANKFORT,
H. 1950. Town planning in ancient Mesopotamia,
Town Planning Review 21(3): 98-115.
P. & R. SALLEn. 1987. The Roman empire: economy,
GARNSEY,
society and cullure. Berkeley (CA): Univcrsily of California Press.
HAVILAND,
W.A. 1972. Family size, prehistoric population estimates, and the ancient Maya, Americon Antiquity 37:
135-9.
HEALEN, D.M. 1977. Architectural implications of daily life in
ancient Tollan, Hidalgo, Mexico, World Archaeology 9(2):
140-56:
1983. Mohammed, Charlemagne
HODGES
R. & D. WHITEHOCJSE.
a n d the origins of Eurupe: archaeology and the Pirenne
Hypothesis. London: Duckworth.
HOMO,L. 1951. Rome imperiale et l'urbanisme dans l'antiquit6.
Paris: Editions Albin Michel.
HONCKONCCENSUS & STATISTICS D m A R m . 1971. Ilong Kong
population and housing census 1971 main report. Hong Kong.
K. 1978. Conquerors and slaves: sociological studies
HOPKINS,
in Roman history 1.New York (NY): Cambridge University Press.
JASHEMSKI, W. 1979. The gardens of Pompeii. New Rochelle
(NY]: Caratzas.
JONGMAN, W. 1988. The economy and society of Pompeii.
Amsterdam: J.C. Gieben.
KARDULIAS,
N.P. 1992. Estimating population at ancient military sites: the use of historical and contemporary analogy, American Antiquity 57[2): 276-87.
LAURENCE,
R. 1994. Roman Pompeii: space ond society. New
York (NY): Routledge.
1995. The organization of space i n Pompeii, i n T. Cornell &
K. Lomas (ed.), Urban societyin Roman Italy 63-78. New
York (NY): St Martin's.
L~rslrrs,J, 1605 Admiranda sive d e magnitudine Romano. 3rd
edition. Antwcrp.
LO CASCIO,E. 1994. The size of the Roman population: Beloch
and the meaning of the Augustan census figures, Journal
of Roman Studies 84: 23-40.
LOT, F. 1945-1 950. Recherches sup la population et la supeqficie
des cites remontants 6 la piriode Gallo-Romaine. Paris:
Libraire Ancienne Honor6 Champion.
MCKAY, A.G. 1988. Houses, in M. Grant & R. Kitzinger (ed.1,
Civilization of the ancient Mediterranean: Greece and
Rome 3: 1373-83. New York (NY): Scribner's.
977
MAIER,F.G. 1954. Romische Bevolkerungsgeschichte u n d
Inschriftenstatistik, Historia 2[3): 3 18-51.
MEIGGS,R. 1973. Roman Ostia. 2nd edition. New York (NY):
Oxford IJniversity Press.
MILLON,R. 1982. Teotihuacan: city, state, and civilization, i n
Sabloff [ed.): 198-243.
DU COMMERCE
SERVICE
DE LA STATISTIQUE
GENERALE.
MINISTERE
1883. Re'sultats statistique de denombrement de 1881,
France et Algerie. Paris: Imprimerie Nationale.
MWISTERO
DI .~CRICOLTURA,INDUSTRIA E COMMERCIO, DIREZIONE
DELLA STATISTICA. 1883. Censimento della Popolazione
dei Regno d'llalia a1 31 Dicembre 1881 1 , Part I.
Popolazione dei communi e mandamenti. Rome: Tipografia
Bodoniana.
NIBBY,A. 1829. Viaggio antiqiiorio ad Ostio. Rome: Societa
Tipografia.
NICOLE?,C. 1987 La Table d'H6raclQeet lcs origines du cadasIre Romain, in Curbs: espoce urbain et histoirc (ii"si6cle
av. JC-iiip si2cle ap. JC): 1-25. Rome: ~ c o l Franvaise
e
de
Rome. Collection 98.
NICwi'r, C. 1991. Space, geography, and politics in thc ear1,v
Roman Empire. Ann Arbor (MI): University of Michigan
Prcss.
PACKER,J.E. 1971. TheInsnlae oflmperiaf Ostia. Rome: American
Academy. Memoir 31.
PAI,ME:R,
R.E.A. 1980 Customs on market goods imported into
the Lity of Romc, Memoirs o f l h e American Academy in
Rome 36: 217-50.
PAOLI,U.G. 1963[1940] Rome: its people, life a n d customs.
New York (NY): Longman.
PARKIN,T.G. 1992. Roman demogrophy. Baltimore (MD):Johns
Hopkins University Press.
1994. Review of Kawson et a]., Iournal of Roman Studies
84: 178-85.
PAVOLINI,
C. 1988. Ostia. Rome: Giuseppi Laterza.
PIJRCELL,
N. 1987a. Tomb and suburb, in H. von Hesberg & €!
Zanker, Romische (Zrijbersstassen: Selbstdarstellung-Stafus-Standard: 25-41. Munich: Verlag Bayerischen Akademie
Der Wissenchaften. Abhandlungen Neue Folge, Heft 96.
1987h. Town a n d country a n d country i n town, in W.F.
Jashemski (ed.), Ancient Roman villa gardens: 187-203.
Washington (DC): Dumharton Oaks Research Library and
Collection.
KAWSON, B. 1986. The Roman family, in B. Rawson (ed.), The
family in ancient Rome: new perspectives: 1-57. Ithaca
(NY): Corncll University Press.
1991a. Introduction, in Rawson 199lb: 1-30.
1991b. Marriage, divorce and children in ancient Rome: New
York [NY): Oxford University Press.
RICHARDSON,
L., JR. 1988. Pompeii: an architectural history.
Baltimore (MD): Johns Hopkins University Press.
RORINSON,
O.R. 1992. Ancient Rome: city planning and administrution. New York [NY): Routledge.
E. 1981. Forma Urbis Murmorea:
RODRIGUEZ-ALMEIDA,
aggiornomento 3980. Rome: Edizioni Quasar.
RCJSSEIL.
J.C. 1958. Late ancient and medieval populations,
Transactions of the Americon Philosophical Society48(3):
1-101.
1977. The population and mortality at Pompeii, International
Committee on Urgent Anthropological and Ethnological
Research Bulletin 19: 107-14.
SALI.ER,
R.P. 1984. Familia, domus, and the Roman conception of the family, Phoenix 38: 336-55.
J.A. [ED.).1981. Supplement to the Handbook ofMidd1e
SABLOFF,
American Indians, 1:Archaeology. Austin (TX): University of Texas Press.
SALLER,
R.P. & B.D. SHAW.1984. Tombstones and Roman family relations in the principate: civilians, soldiers and slaves,
Journal of Roman Studies 74: 124-56.
J.R. PARSONS &R.S. SANTLEY.
1979. TheBasin
SANDERS,W.T.,
of Mexico: ecological process in the evolution of a civilization. New York (NY): Academic.
Downloaded from https:/www.cambridge.org/core. IP address: 88.99.165.207, on 17 Jun 2017 at 22:14:56, subject to the Cambridge Core terms of use,
available at https:/www.cambridge.org/core/terms. https://doi.org/10.1017/S0003598X00085859
978
GLENN 12. STOREY
SCHINZ,
A. 1989. Cities in China. Berlin: Gebriider Borntrager.
1986. Slums, sanitation, and mortality in the Roman world, Klio 68(2): 399-433.
SHAW,B.D. 1984. Latin funerary epigraphy and family life in
the later Roman Empire, Historia 33(4): 457-97.
STAMBAUGH,
J.E. 1988. The ancient Roman city. Baltimore (MD):
Johns Hopkins University Press.
STOREY,
G. 19!#2.Preindustrial urban demography: the ancient
Roman evidence. Ph.D dissertation, Pennsylvania State
University, State College (PA).
STOREY,R. 1992.Life and death in the ancient cityof Teotihuacan:
a modern paleodemographic synthesis. Tuscaloosa (AL):
University of Alabama Press.
STROCKA,
V.M. 1984. Hauser in Pompeji 1:Casa del Principe
d i Napoli. Tubingen: Verlag Ernst Wasmuth.
UNITE^ NATIONS.
1980. Compendium of social statistics: 1977.
New York (NY): United Nations Publishing Service.
UNITEDNATIONS
POPULATION
FUND.1988. Cities: slatisticol,
administrative and graphical information on the major
urban areas of the world. Barcelona: Instituts d’Estudis
Metropolitans de Barcelona.
VAN DER POEL, H.B. et al. 1983. Corpus topographicum
pompeianum: toponymy. Austin (TX]: University of
Texas Press.
SCOBIE, A.
WALLACE-HADRILL, A. 1991. Houses and households: sampling
Pompeii and Herculaneum, in Rawson 1991b: 191-227.
1994. Houses a n d society in Pornpeii and Herculaneum.
Princeton (NJ): Princeton University Press.
P.D. & R.S. BAGNALL.
1988. The forty thousand citiWARDEN,
zens of Ephesus, Classical Philology83: 220-23.
Wm-pERKWs,J.B. 1974.Cities of ancient GreeceandItaly:plUnning
in classical aniiquify New York (NY): George Braziller.
WEAVER,
P.R.C. 1972. Familia Caesaris: a social study of the
Emperor’s freedmen a n d slaves. New York (NY): Cambridge University Press.
WERSTER,
D.L. & A. FRETER.
1990. Settlement history and the
Classic ‘collapse’ at Cop&n: a refined chronological perspective, Latin American Antiquity l(1): 66-85.
WEISS, K.M. 1973. Demographic models for anthropology.
Washington (DC): Society for American Archaeology.
Memoirs 27.
WESTERMANN,
W.L. 1955. The slave systpms of Greek a n d Romun antiquity. Philadelphia (PA): American Philosophical Society. Memoirs 40.
WIEDEMANN,
T.J. 1981. Greek and Roman slavery. Baltimorc
(MD]: Johns Hopkins University Press.
WISEMAN,
T.P. 1969. The census in the first century BC, Journal ofRoman Studies: 59: 59-75.
Downloaded from https:/www.cambridge.org/core. IP address: 88.99.165.207, on 17 Jun 2017 at 22:14:56, subject to the Cambridge Core terms of use,
available at https:/www.cambridge.org/core/terms. https://doi.org/10.1017/S0003598X00085859
© Copyright 2026 Paperzz