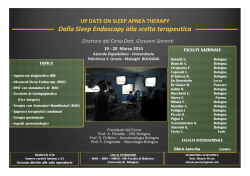
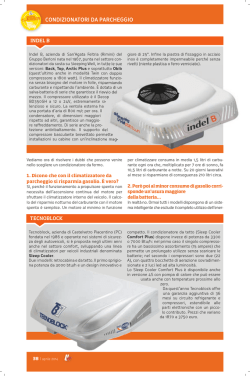
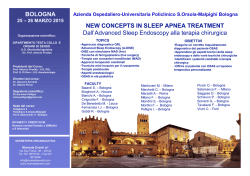
Cerebral Cortex August 2007;17:1970--1978
doi:10.1093/cercor/bhl106
Advance Access publication October 27, 2006
Directional Information Flows between
Brain Hemispheres during Presleep Wake
and Early Sleep Stages
Mario Bertini1, Michele Ferrara1,2, Luigi De Gennaro1, Giuseppe
Curcio1,3, Fabio Moroni1, Fabrizio Vecchio4,5, Marco De
Gasperis5, Paolo Maria Rossini3,4,6 and Claudio Babiloni4,5,6
Neuroscientists’ efforts to better understand the underlying processes of human consciousness are growing in a variety of
multidisciplinary approaches. Relevant within these are the studies
aimed at exploring the physiological substratum of the propagation
and reduction of cerebral—namely, corticocortical—communication
flows. However, the preferential direction of the information flow
between brain hemispheres is as yet largely unknown. It is the aim of
the present research to study the communication flows between
brain hemispheres, their directionality, and their regional variations
across wake--sleep states. A second aim is to investigate the
possibility of an association between different brain rhythms and
different preferred directions of the information flow. Scalp electroencephalograms (EEGs) were recorded in 10 normal volunteers from
wakefulness to early sleep stages (viz., resting wakefulness, sleep
stages 2 and 4, and rapid eye movement [REM] of the first sleep
cycle). EEG rhythms of interest were delta (1--4 Hz), theta (5--7 Hz),
alpha (8--11 Hz), sigma (12--15 Hz), and beta (16--30 Hz). The direction
of the interhemispheric information flow was evaluated by computing directed transformation function from these EEG rhythms.
Interhemispheric directional flows varied as a function of the state
of consciousness (wake and early sleep stages) and in relation to
different cerebral areas. Across wake to sleep states, we found that
delta and beta rhythms convey interhemispheric signals with
opposite directions: preferred right to left hemisphere direction for
delta and left to right for beta rhythms. A log correlation confirmed
that the trend of low to high EEG frequencies—traditionally
associated with an increasing state of vigilance—was significantly
related to the direction of the communication flow from the left to
right hemisphere. This evidence might open the way for a variety of
research lines on different psychophysiological and pathological
conditions.
the propagation and reduction of information flows between
cortical areas and between brain hemispheres (Berlucchi 1965;
Bertini et al. 2004; Massimini et al. 2004, 2005). In a pioneering
study, spontaneous neural activity was recorded in animals
across wake--sleep stages by macroelectrodes placed in the
splenium (posterior aspect) and genu (anterior aspect) of the
corpus callosum (Berlucchi 1965). This activity declined after
sleep onset, and a further drop was observed after the beginning
of rapid eye movement (REM) sleep. These results suggested
a functional modulation of transcallosal, bidirectional impulse
transmission between the cerebral hemispheres across wake-sleep stages.
Callosal activity along the wake--sleep cycle has not been
directly recorded in humans, due to intrinsic methodological
limitations of intracerebral EEG techniques. A suitable approach
was recently employed using paired-pulse transcranial magnetic
stimulation of the 2 primary motor cortices (Bertini et al. 2004).
This approach revealed a reduction of transcallosal inhibition
between the 2 primary motor areas across sleep stages, which
culminated in the last REM sleep of the night. In particular, the
decrease in transcallosal inhibition was stronger from right to
left hemisphere than from left to right hemisphere. It was
concluded that the callosal function between the 2 primary
motor cortices declines across the wake--sleep stages with
interhemispheric preferred directionality. Recently, Massimini
et al. (2004) investigated the neural synchronization mechanisms by which the callosal function and its directionality might
be modulated during the wake--sleep stages. By analyzing the
EEG rhythms representing the sequence of depolarization and
hyperpolarization of the cortical neurons generating the scalp
potentials, they showed that slow sleep EEG oscillations are
traveling waves that scan the human cerebral cortex with
a cycle of up to once per second. Each slow EEG oscillation has
an intra- and interhemispheric direction of propagation varying
from one cycle to the next. It has also been shown that slow
EEG oscillations originate more frequently at anterior cortical
regions and propagate in an anteroposterior and laterolateral
direction, as an effect of corticocortical connections (Steriade
at al. 1993). Propagation can be disrupted by disconnecting
intracortical pathways through surgical and pharmacological
manipulations (Amzica and Steriade 1995). The small delay
differences observed for the interhemispheric propagation of
the slow EEG oscillations are due to the high density of
homotopic transcallosal fibers (Jacobson and Trojanowsky
1975). More recently, EEG potentials have been directly evoked
by transcranial magnetic stimulation of the premotor cortex
during wakefulness and early sleep stages (stages 3/4, early in
Keywords: cerebral hemispheres, corpus callosum, quantitative
electroencephalography (qEEG), wake--sleep transition
Introduction
In a growing effort to explore the complex problem of human
consciousness, studies of intra- and interhemispheric connectivity in the brain have been central to a variety of approaches.
Recently, it has been proposed that consciousness depends
critically not so much on firing rates, synchronization at specific
frequency bands, or sensory input per se, but rather on the
brain’s ability to integrate information (Tononi 2005). Of
interest, in this respect, are studies on interhemispheric and
interareal broadband coherence in electroencephalogram
(EEG) during sleep (Nielsen et al. 1990; Guevara et al. 1995;
Achermann and Borbely 1998), and, in particular, the studies on
Ó The Author 2006. Published by Oxford University Press. All rights reserved.
For permissions, please e-mail: [email protected]
1
Dipartimento di Psicologia, Università degli Studi di Roma
‘‘La Sapienza,’’ Roma, Italy, 2Dipartimento di Medicina
Interna e Sanità Pubblica, Università di L’Aquila, L’Aquila, Italy,
3
Clinica Neurologica, Università di Roma ‘‘Campus
Bio-medico,’’ Roma, Italy, 4AFaR, Dip. Neuroscienze, Ospedale
San Giovanni Calibita Fatebenefratelli, Roma, Italy,
5
Dipartimento di Fisiologia Umana e Farmacologia, Università
di Roma ‘‘La Sapienza,’’ Roma, Italy and 6IRCCS Centro San
Giovanni di Dio Fatebenefratelli, Brescia, Italy
the night) (Massimini et al. 2005). Before sleep, activation of the
premotor cortex largely propagated intra- and interhemispherically. During early nonrapid eye movement (NREM) sleep
stages, cortical activation induced by transcranial magnetic
stimulation rapidly extinguished and showed a limited intraand interhemispheric propagation.
All these studies provide information on the propagation and
decline of information flows within and between hemispheres;
particularly, the work by Massimini et al. (2005) supports the
idea that the decline of effective connectivity may be an
important contributing factor in the fading of human consciousness. To date, however, there is little knowledge on the
dynamics of information exchanges between hemispheres.
Therefore, to bridge this gap, it seems relevant, as a first step,
to study the directionality of the information flows between
hemispheres. Consequently, the main aim of the present
research was to investigate the directionality of the interhemispheric flows of information and their changes as a function of
the cortical areas and of the physiological state (i.e., presleep
wake vs. sleep stages of the first sleep cycle). A further and more
ambitious goal was to evaluate whether there is any preferential
direction of the interhemispheric information flows related to
or depending upon the different EEG frequency bands.
The direction of the interhemispheric information flows was
evaluated by computing the directed transformation function
(DTF) of EEG rhythms (Kaminski and Blinowska 1991; Kaminski
et al. 1997; Korzeniewska et al. 1997; Mima et al. 2000; Babiloni
C, Babiloni F, et al. 2004; Babiloni, Vecchio, et al. 2004). In
recent years, the DTF method has shown that the presleep
period is characterized by a parietooccipital to frontal direction
of the cortical information flow, whereas the opposite holds
true at sleep onset (De Gennaro et al. 2004). After selective
slow-wave sleep deprivation, the frontal to parietooccipital
direction shows up in the presleep period, possibly due to
sleep pressure (De Gennaro et al. 2005).
Materials and Methods
Subjects
Ten male volunteers (mean age = 23.3 years; standard error = 0.58; range =
20--26 years) were selected from a university student population to
participate in the present study. All subjects were right-handed, as
assessed by a lateral preference questionnaire (Salmaso and Longoni
1985) (scores >0.70) and, based on a clinical interview, did not suffer
from epilepsy or any other neurological, psychiatric, or serious medical
condition. Further requirements for inclusion were normal sleep
duration and schedule, no daytime nap habits, no excessive daytime
sleepiness, and no other sleep disorder, as assessed by a 1-week sleep log.
The protocol of the study was approved by the local Institutional Ethical
Committee and the subjects gave their written informed consent,
according to the Declaration of Helsinki.
Participants were required to avoid napping throughout the experiment. An actigraph (AMI Mini motion logger) measured wrist activity
every 30 s from the nondominant hand and distinguished sleep from
wakefulness with a high degree of accuracy (e.g., Cole et al. 1992).
Compliance was controlled by checking the wrist activity data monitored by the actigraph.
EEG Recordings
A VEGA 24 polygraph (Esaote Biomedica, Firenze, Italy) was used for
polygraphic recordings. EEG recordings started at about 11:30 PM and
ended after 7.5 h of accumulated sleep.
EEG signals were high pass filtered with a time constant of 0.3 s and
low pass filtered at 30 Hz (sampling rate of 128 Hz). EEG electrodes
were placed at 19 sites of the international 10-20 system and were
referenced to linked earlobes (electrode impedance lower than 5 kX).
Standard electromyographic and electrooculographic derivations were
used to visually score sleep stages in 20-s epochs, according to standard
criteria (Rechtschaffen and Kales 1968).
Preliminary EEG Data Analysis
The EEG epochs with ocular, muscular, and other types of artifact were
preliminarily identified by 2 independent experimenters. Artifact-free
EEG data were staged and selected for further analysis. In particular,
a wakefulness EEG interval lasting 2 min (closed eye condition) served
as a presleep period. Sleep EEG intervals of interest for the present study
were 2-min EEG segments relative to the beginning of each sleep stage
(first stage 2, first stage 4, and first REM stage).
EEG Power Density Spectrum
For each stage of interest (wake, stage 2, stage 4, and REM), artifact-free
EEG epochs were re-referenced to a common average and were
analyzed by a standard Fast Fourier Transform algorithm (Matlab 6.0;
Mathworks Inc., Natrick, MA) at F3, F4, C3, C4, P3, and P4 electrode
sites. Frequency resolution was of 1 Hz (no phase shift). EEG bands of
interest were delta (1--4), theta (5--7 Hz), alpha (8--11 Hz), sigma (12--15
Hz), and beta (16--28 Hz). The analysis of the EEG power density spectra
across the presleep and early sleep stages allowed the evaluation of the
quality of the EEG data as an input for the DTF analysis.
‘‘Direction’’ of the Functional Connectivity Estimated by the
Mvar Model
Before computing the DTF, the EEG data (linked earlobes reference)
were preliminarily normalized by subtracting the mean value and
dividing by the variance, according to standardized rules by Kaminski
and Blinowska (1991). An important step of the DTF method was the
computation of the so-called Multivariate autoregressive (Mvar) model
(Kaminski and Blinowska 1991; Kaminski et al. 1997; Korzeniewska et al.
1997; Blinowska et al. 2004; Kus et al. 2004). EEG data at 9 electrodes
(F3, Fz, F4, C3, Cz, C4, P3, Pz, and P4) were simultaneously given as an
input to the Mvar model toward the computation of the directional
information flux among all the pair combinations of these electrodes. This
model was used to estimate the ‘‘direction’’ of the information flow
between the left and right hemispheres (F3--F4, C3--C4, and P3--P4). In
nonmathematical terms, coefficients of the Mvar model fitted to the data
can be interpreted as causal influence of signal recorded over electrode A
on signal recorded on electrode B or information flow between electrodes A and B. A direction of information flow from A to B is stated when that
case is statistically more probable than a directionality from B to A. This
Mvar model has already been used successfully to estimate the direction
of the corticocortical and corticomuscular information flow (Mima et al.
2001; Babiloni C, Babiloni F, et al. 2004; Babiloni, Vecchio, et al. 2004).
The mathematical core of the Mvar algorithm used in this work is
based on the ARfit programs running on the platform Matlab 6.0. The
model order was 7, as estimated by the Akaike criterion suggested in
previous DTF studies (Kaminski and Blinowska 1991; Kaminski et al.
1997; Korzeniewska et al. 1997). The goodness of fit was evaluated by
visual inspection of the values of noise matrix V of the Mvar model.
The Mvar model is defined as,
p
+ Aj Xt – j = Et ;
j =0
where Xt is the L-dimensional vector representing the L-channel signal
at time t; Et is white noise; Aj is the L 3 L matrix of the model coefficients;
and p is the number of time points considered in the model. From the
identified coefficients of the model Aj, spectral properties of the signals
can be obtained by the following z-transformation of the above
equation:
X ðz Þ = H ðz ÞE ðz Þ;
where H(z) is a transfer function of the system
p
H ðz Þ =
+ Aj z
!–1
–j
;
j =0
Cerebral Cortex August 2007, V 17 N 8 1971
Results
and
z
ð – jÞ
= expð – 2pijf dt Þ;
where f is frequency and dt is the time step.
Since the transfer function H(f ) is not a symmetric matrix, the
information transmission from the jth to the ith channel is different
from that from the ith to the jth channel. The DTF from the jth channel
to the ith channel is defined as the square of the element of H(f ) divided
by the squared sum of all the elements of the relevant row:
DTFij ðf Þ =
jHij j2
2:
jHim ðf Þj
L
m=1
+
A substantial difference between DTF ðf Þij and DTF ðf Þji may suggest
an asymmetric information flow from electrode i to electrode j. When
DTF ðf Þij is greater in magnitude than DTF ðf Þji ; the direction of the
information flow is from electrode j to electrode i. On the other hand,
the direction of the information flow is from electrode i to electrode j
when DTF ðf Þji is greater in magnitude than DTF ðf Þij : Of note, the
normalization of the DTF depends on the denominator of the previous
formula.
To simplify the visualization and statistical analysis of the DTF results,
the directional flow of information was given as ‘‘left to right’’ minus
‘‘right to left’’ direction of the DTF. Positive values of this subtraction
(DTFdiff values higher than zero) showed the predominance of the left
to right direction over the right to left direction of the DTF. On the
other hand, negative values of this subtraction (DTFdiff values lower
than zero) showed the predominance of the right to left direction over
the left to right direction of the DTF.
Of note, DTFdiff values could be both positive (prevailing left to right
direction of the DTF) and negative (prevailing right to left direction of
the DTF) at different frequency bins of a given band. To disentangle the
positive (maximum) and negative (minimum) values of the DTFdiff for
each frequency band, the following procedure was followed. For each
frequency band, the most positive (or less negative) DTFdiff value was
called the ‘‘max DTFdiff’’ and the most negative (or less positive) DTFdiff
value was called the ‘‘min DTFdiff.’’ The max DTFdiff reflected the
strongest trend toward left to right direction of the DTF, whereas the
min DTFdiff reflected the strongest trend toward right to left direction
of the DTF. They were considered separately in the final statistical
analysis.
The fact that the DTF analysis was done on the difference between
the 2 reciprocal DTF directions should require a careful interpretation
of the results. A zero value of such a difference meant equivalence of the
2 opposite DTF directions within the 2 min, namely, that the DTF
directions were equally strong or equally weak or both equal to zero in
the 2 min taken into account. It should be emphasized that this
equivalence is true for the whole period of 2 min but not necessarily
for subperiods within the 2 min. At this preliminary stage of the study,
we preferred evaluating the DTF values for the entire 2-min period
because the DTF values for shorter periods are supposedly less reliable
from the statistical point of view (Babiloni C, Babiloni F, et al. 2004;
Babiloni, Vecchio, et al. 2004).
Statistical Analysis
Statistical comparisons were performed by repeated-measure analyses
of variance (ANOVAs). The Mauchley test evaluated the sphericity
assumption, and correction of the degrees of freedom was carried out
using the Greenhouse--Geisser procedure. Subjects’ age and lateralization of the EEG power density at the frontal, central, and parietal
electrodes were used as covariates in the statistical design. The Duncan
test was used for post hoc comparisons (P < 0.05).
Statistical analysis of the DTFdiff values (direction of the information
flow) was performed using a 2-way ANOVA including the factors stage
(wakefulness, sleep stage 2, sleep stage 4, and REM sleep) and band
(delta, theta, alpha/sigma, and beta). This ANOVA was performed twice.
In the first analysis, the focus was on the maximum values of the DTFdiff,
concentrating our attention on the left to right direction of the DTF. In
the second analysis, the focus was on the minimum values of the
DTFdiff, concentrating on the right to left direction of the DTF.
1972 Hemispheric Connectivity at Sleep Onset
d
Bertini et al.
Power Density Spectra of EEG across Wake --Sleep Stages
Figure 1 plots the grand average (N = 10) of the EEG power
density spectra for the electrodes of interest (F3, F4, C3, C4, P3,
and P4) across the wake-to-sleep transition. These spectra
depicted the typical increase of delta, theta, and sigma power
during NREM sleep stages as compared with wakefulness and
REM sleep stages (e.g., Finelli et al. 2001). Furthermore, there
was a clear decrease of alpha and beta power in the NREM
stages with respect to the wakefulness stage.
Interhemispheric DTF of EEG Waves across
Wake --Sleep Stages
Figure 2 shows the grand average (N = 10) of the interhemispheric DTF values for the frontal (F3--F4), central (C3--C4), and
parietal (P3--P4) electrode pairs. These values particularly
referred to the DTF difference between left to right and right
to left directions (i.e., DTFdiff) across the subjects. The values
are low in magnitude (around 0.1) as expected by the fact that
they represent the difference between the absolute DTF values
of the opposite DTF directions. To corroborate the statistical
meaning of this DTF result, the same preponderant DTF
directions were observed in the large majority of the individual
subjects.
The first important item of information provided by Figure 2
is the evident increasing trend of left to right preferred
direction in relation to the increasing frequency of the EEG
waves in the parietal area. EEG frequencies showed preponderant right to left DTF directional flows at low delta rhythms. The
right to left DTF flow decreased as EEG frequencies increased
and showed a brisk inversion toward left to right DTF direction
at theta rhythms. The left to right direction of DTFdiff values
markedly increased up to alpha rhythms and then remained in
the left to right direction along the entire beta band.
To better clarify the relationships between DTF direction and
EEG frequencies, a nonparametric correlation (Spearman test,
P < 0.05) and nonlinear correlations (evaluating the coefficient
of determination for exponential and logarithmic trends) were
computed. Table 1 reports the results of these correlation
analyses for the parietal electrode pairs. In general, r2 values for
logarithmic analysis showed the maximum values for wake,
stage 2, and REM stage.
In the frontal and central areas, the 2 DTF directions were
quite balanced for all frequencies (i.e., DTFdiff close to zero). As
an exception, sleep stage 2 showed a dominant right to left DTF
direction on frontal electrode pairs (i.e., negative DTFdiff). In
contrast, left to right DTF direction generally prevailed in the
parietal areas (i.e., positive DTFdiff, see Fig. 2).
To better disentangle the left to right and right to left DTF
directions within each band, the maximum and minimum values
of the DTFdiff were used as data for separate ANOVAs. For each
frequency band, the ANOVA design included the factors stage
(wakefulness, sleep: stage 2, stage 4, and REM) and scalp site
(frontal, F3--F4; central, C3--C4; and parietal, P3--P4). The
analysis of the max DTFdiff values (emphasizing the left to right
DTF direction) showed main effects of the factor stage for the
sigma (F3,27 = 3.82; P = 0.02) and beta (F3,27 = 3.45; P = 0.03)
bands. Left to right DTF direction was more predominant during
wakefulness than stage 2 sleep for the sigma band (P < 0.004)
and during wakefulness versus sleep stages 2 and 4 for the beta
Figure 1. Grand average (N 5 10) of the EEG power density spectra for the electrodes of interest (F3, F4, C3, C4, P3, and P4) across the wake--early sleep stages. These spectra
depicted the typical increase of delta, theta, and sigma power during NREM sleep stages as compared with wakefulness and REM sleep stages.
band (P < 0.01 to P < 0.02). Furthermore, a close-to-significance
interaction was observed between the factors scalp site and
stage for the beta band (F6,54 = 2.35; P = 0.06). Post hoc tests
showed that left to right DTF direction for the beta band in
parietal areas was stronger in wakefulness than in any early
sleep stages (P < 0.004 to P < 0.0002). Moreover, max DTFdiff
values pointed to main effects of the scalp site factor for the
theta (F2,18 = 12.61; P = 0.0006), alpha (F2,18 = 14.56; P = 0.0001),
sigma (F2,18 = 26.65; P = 0.000005), and beta (F2,18 = 30.22; P =
0.000001) bands. For all bands, left to right DTF direction
was higher in parietal than central and frontal areas (P < 0.04 to
P < 0.007).
The above results were substantially confirmed by the
ANOVA on the min DTFdiff values (main effects of the scalp
site factor for the theta, alpha, sigma, and beta bands; P < 0.003
to P < 0.0000006). As a peculiar contribution of the ANOVA of
the min DTFdiff values (i.e., negative DTFdiff values), a significant interaction was shown between the factors scalp site and
stage for the delta band (F6,54 = 3.16; P = 0.01). Post hoc tests
showed that in parietal areas, the right to left DTF direction was
predominant during wakefulness than any early sleep stages
(P < 0.03 to P < 0.01). In frontal areas, the right to left DTF direction was instead lower during wakefulness than sleep stage 4
(P < 0.04). The mentioned statistical effects of the ANOVAs are
illustrated in the right and left sides of Figure 3. The figure depicts maximum and minimum mean DTFdiff values, separately.
Measurements of DTFdiff in the delta and beta bands for
individual subjects are reported in Table 2. Most subjects
showed DTFdiff values in agreement with the group data. In 7
out of 10 subjects, right to left DTF direction of the parietal
delta band was higher in magnitude during wakefulness than
early sleep stages. In 6 out of 10 subjects, left to right DTF
direction of the parietal beta band was higher in magnitude
during wakefulness than early sleep stages. In 8 out of 10
subjects, right to left DTF direction of the frontal delta band was
lower in magnitude during wakefulness than early sleep stages.
Cerebral Cortex August 2007, V 17 N 8 1973
Figure 2. Grand average (N 5 10) of the interhemispheric DTF values for the frontal
(F3--F4), central (C3--C4), and parietal (P3--P4) electrode pairs. These values refer to
the DTF difference between left to right and right to left directions (i.e., DTFdiff). The
DTFdiff values were illustrated for all EEG frequencies of interest.
Table 1
Results of the correlation analysis of DTFdiff values across all frequency bins for parietal
electrode pairs during wake, stage 2, stage 4, and REM stage
Spearman
Log
Exp
p
r2
r2
r2
Wake
Stage 2
Stage 4
REM
0.000939
0.318678
0.8572
0.5348
0.392086
0.025368
0.5194
0.1769
0.098683
0.091214
0.0005
0.0431
0.113111
0.084287
0.6064
0.244
A nonparametric correlation was computed with the r2 values of the Spearman test (P \ 0.05).
Furthermore, nonlinear correlations were computed evaluating the coefficient of determination r2
for exponential and logarithmic trends.
Control Analyses
Two control analyses were done. The first included all recorded
(i.e., 19) channels as an input to the Mvar model because
interhemispheric flow may come from the different phase
1974 Hemispheric Connectivity at Sleep Onset
d
Bertini et al.
Figure 3. Grand average (N 5 10) of the maximum and minimum means (±standard
errors) of the DTFdiff values for the delta and beta bands (see Methods for further
details). Max DTFdiff values indexed left to right direction of the DTF (most positive DTF
values). Min DTFdiff values indexed right to left direction of the DTF (most negative DTF
values). The means illustrate the results of 2 statistically significant (P \ 0.05) 2-way
ANOVA interactions. The ANOVA included the factors scalp site and stage for each
band.
delays of EEG potentials propagating by channels not taken
into account in the Mvar model (F3, Fz, F4, C3, Cz, C4, P3, Pz,
and P4). As in the main analysis, the maximum and minimum
values of the DTFdiff were used as inputs for separate ANOVA
designs. The analysis of the max DTFdiff values (left to right DTF
direction) showed main effects of the factor stage for the sigma
(F3,27 = 3.86; P = 0.025) and beta (F3,27 = 3.91; P = 0.039) bands.
Post hoc tests showed that left to right DTF direction for the
beta band was predominant in parietal areas during wakefulness
compared with all early sleep stages (P < 0.005 to P < 0.0001).
Besides, the min DTFdiff values (i.e., negative DTFdiff values)
Table 2
Individual values of delta and beta band directionality
Waking
Frontal
Subject
Subject
Subject
Subject
Subject
Subject
Subject
Subject
Subject
Subject
Mean
SE
Central
Subject
Subject
Subject
Subject
Subject
Subject
Subject
Subject
Subject
Subject
Mean
SE
Parietal
Subject
Subject
Subject
Subject
Subject
Subject
Subject
Subject
Subject
Subject
Mean
SE
Stage 2
Stage 4
REM
Delta
Beta
Delta
Beta
Delta
Beta
Delta
Beta
1
2
3
4
5
6
7
8
9
10
0.0069
0.0710
0.0143
0.0019
0.0069
0.0609
0.0028
0.0032
0.0095
0.0012
0.0134
0.0090
0.0046
0.0057
0.0058
0.0005
0.0006
0.0026
0.0017
0.0076
0.0106
0.0142
0.0030
0.0021
0.0921
0.0064
0.0105
0.0008
0.0714
0.0080
0.0040
0.0115
0.0946
0.0076
0.0290
0.0127
0.0503
0.0042
0.0060
0.0080
0.0121
0.0001
0.0029
0.0058
0.0186
0.0107
0.0091
0.0052
0.0040
0.0943
0.1848
0.0221
0.0202
0.0531
0.0353
0.1464
0.00041
0.0230
0.0533
0.0215
0.0138
0.0054
0.0479
0.0102
0.0076
0.0026
0.0047
0.0068
0.0570
0.0166
0.0010
0.0083
0.0049
0.0137
0.0027
0.0115
0.0562
0.0041
0.0012
0.0020
0.0054
0.0046
0.0100
0.0054
0.0262
0.0003
0.0038
0.0039
0.0187
0.0008
0.0006
0.0070
0.0005
0.0035
0.0002
0.0035
1
2
3
4
5
6
7
8
9
10
0.0073
0.0119
0.0644
0.0044
0.0148
0.0002
0.0102
0.0031
0.0028
0.0589
0.0025
0.0095
0.0148
0.0007
0.0040
0.0051
0.0014
0.0216
0.0149
0.0064
0.0591
0.0040
0.0089
0.0064
0.0258
0.0048
0.0513
0.0233
0.0263
0.0124
0.0098
0.0273
0.0006
0.0316
0.0019
0.0085
0.0035
0.0038
0.0104
0.0019
0.0292
0.0028
0.0001
0.0020
0.0002
0.0020
0.0039
0.0031
0.0420
0.0260
0.0414
0.0014
0.0195
0.1324
0.0157
0.0005
0.0147
0.0344
0.0214
0.0146
0.0436
0.0176
0.0087
0.0155
0.0017
0.0107
0.0036
0.0083
0.0070
0.0021
0.0060
0.0052
0.0078
0.0066
0.0517
0.0032
0.0198
0.0529
0.0100
0.0428
0.0530
0.0042
0.0021
0.0109
0.0053
0.0000
0.0083
0.0043
0.0217
0.0043
0.0007
0.0074
0.1140
0.0020
0.0168
0.0110
1
2
3
4
5
6
7
8
9
10
0.1574
0.2176
0.0036
0.0574
0.0061
0.1032
0.0018
0.0031
0.0862
0.0085
0.0645
0.0240
0.1188
0.2035
0.1326
0.0659
0.0426
0.0110
0.0434
0.0088
0.2207
0.1025
0.0928
0.0246
0.0783
0.0273
0.0429
0.0343
0.0140
0.0475
0.0105
0.0055
0.0108
0.0087
0.0022
0.0118
0.0253
0.0676
0.0945
0.0499
0.0427
0.0027
0.0884
0.0368
0.0129
0.0367
0.0407
0.0118
0.0043
0.0135
0.0080
0.0812
0.0320
0.0128
0.0262
0.1133
0.0285
0.0120
0.0142
0.0151
0.0029
0.0398
0.0295
0.0377
0.0562
0.0162
0.0195
0.0204
0.0296
0.0948
0.0346
0.0081
0.0442
0.0613
0.0177
0.0802
0.0073
0.0673
0.0048
0.0030
0.0820
0.0358
0.0229
0.0155
0.0118
0.0934
0.0142
0.0663
0.0837
0.0010
0.0843
0.0724
0.0002
0.0858
0.0513
0.0124
pointed to a significant scalp site 3 stage interaction for the
delta band (F6,54 = 3.09; P = 0.019). Post hoc tests indicated that
the right to left DTF direction was predominant during
wakefulness compared with all early sleep stages at the parietal
sites (P < 0.04 to P < 0.02). These results were fully in
agreement with those of the main analysis, based on a 9-channel
Mvar model.
The second control analysis modeled the relationships
between anterior and posterior midline cortical areas, to
validate on a new data set the results of a previous EEG-DTF
study of our group (De Gennaro et al. 2004). In the present
analysis, we evaluated this flow direction by adding left and right
hemispheres (F3--P3 and F4--P4) to the midline derivations (Fz-Pz). For each band of interest, we performed the analysis of the
maximum DTF values (DTF direction). The ANOVA design
included the factors stage (wakefulness, stage 2 sleep, stage 4
sleep, and REM sleep), scalp site (left, F3--P3; midline, Fz--Pz; and
right, F4--P4), and direction (anterior-to-posterior and posterior-to-anterior). The delta band showed a significant stage 3
direction interaction (F3,24 = 3.32; P < 0.04), pointing to
a reduction of posteroanterior DTF direction and to an increase
of DTF anteroposterior direction (P < 0.04) from wake to stage
2. The theta band showed a significant stage 3 scalp site 3
direction interaction (F6,48 = 4.17; P < 0.009), pointing to an
increase of DTF anteroposterior direction and to a decrease of
DTF posteroanterior direction in the right hemisphere from
wakefulness to the sleep stages. The alpha band showed a closeto-significance stage 3 direction interaction (F3,24 = 2.52; P <
0.089), pointing to a reduction of DTF posteroanterior direction
from wake to stage 2. The sigma band also showed a significant
stage 3 direction interaction (F3,24 = 3.54; P < 0.03), indicating
a reduction of DTF posteroanterior direction (P < 0.04) from
wake to stage 2. The beta band showed a close-to-significance
stage 3 direction interaction (F3,24 = 2.77; P < 0.068), pointing
to a reduction of DTF posteroanterior direction from wake to
stage 2. On the whole, there was a predominant posterior-toanterior DTF direction during the presleep period and a predominant anterior-to-posterior DTF direction during the early
sleep periods. These results confirmed on a new data set those
reported in the mentioned EEG-DTF study (De Gennaro et al.
2004).
Discussion
The results clearly show the presence of interhemispheric
directional flows that vary both across wake and early sleep
states and in relation to different cerebral areas. More importantly, in our opinion, they also show preferred and selective
directionality for different EEG frequency bands.
In particular, these data provide 3 intriguing findings.
1. While high-frequency bands both in wake and sleep convey
more left to right information flows, low-frequency bands
Cerebral Cortex August 2007, V 17 N 8 1975
both in wake and sleep convey more right to left information flows. To our knowledge, this finding represents
the first evidence that slow and fast rhythms reflect
a continuum of opposite preferred directions of information
flows between brain hemispheres both in wake and sleep
states. Some hints of interpretational and heuristic relevance
may be put forward. Psychophysiological literature traditionally associates increasing frequencies of EEG rhythms
with an increasing state of vigilance. Thus, the finding that
the trend of increasing frequencies of EEG rhythms appears
significantly related to a trend of increasingly left to right
direction of the communication flows is by no means
irrelevant. Neuropsychological literature has provided a large
amount of knowledge on cognitive and emotional specialization of brain hemispheres (e.g., Demaree et al. 2005;
Halpern et al. 2005). However, the principles underlying
human interhemispheric communication are poorly understood. According to Stephan (2003) ‘‘This is highly regrettable because (i) it is one of the most fundamental
principles how human brains seem to be organized and
(ii) changes in hemispheric specialization (and particularly
interhemispheric integration) are believed to be connected
to a variety of psychiatric disorders.’’ The opportunity to use
the frequency bands as a physiological indicator of directionality may open the door to a variety of important
investigations in these areas.
2. Further reflections are suggested by the data showing
variations of directionality at different regional sites.
As we can see in Figure 3, significant regional differences
of the flow directionality across stages appear at the delta
and beta bands. The delta band conveys a prevalence of information flow from right to left hemisphere both in
different regional areas and across wake to sleep states.
However, within this general frame, whereas in the parietal
areas the prevalence of the right to left direction is
significantly higher during wake than during all sleep stages,
including stage 4, the opposite trend is found in the frontal
areas, where the tendency toward a right to left direction is
higher during sleep stage 4 than in wake. No differences for
directionality were found in the central areas. On the other
hand, the beta band shows a general orientation toward the
left to right direction at the parietal sites; no directionality
difference was found at the frontal and central areas.
Furthermore, a significant prevalence of the left to right
direction is present in wake as compared with all the other
sleep stages. What is the meaning of these differential
patterns of information flows? In general, these data emphasize the functional diversity of brain areas in relation to the
different states. In particular, in the transition from wake to
sleep, they highlight the special role of frontal areas. In fact,
the main interhemispheric information flow is conveyed by
delta rhythms between frontal areas. This nicely fits with the
role of frontal area in early sleep processes (De Gennaro
et al. 2001, 2005), as well as with the frontal predominance
of the delta EEG power during human NREM sleep (Werth
et al. 1996) and during animal sleep (Vyazovskiy et al. 2002).
Furthermore, they extend to the domain of interhemispheric information flow previous evidence showing that
sleep onset is characterized by an increment of the
functional coupling from frontal to parietooccipital areas
(De Gennaro et al. 2004) and that such a directional process
is already present in the presleep period when sleep
1976 Hemispheric Connectivity at Sleep Onset
d
Bertini et al.
pressure is enhanced by sleep deprivation (De Gennaro
et al. 2005). Observations on delta waves have been receiving increasing attention in the sleep literature. The lowfrequency rhythms defining slow-wave sleep have long been
regarded as epiphenomena, with negligible or no functional
significance, because this physiological state was previously
regarded as associated with global inhibition of the cerebral
cortex and subcortical structures, which underlies the
annihilation of consciousness. However, studies using intracellular recordings of electrophysiologically characterized cortical cell types in naturally awake and sleeping
animals have shown unexpectedly high levels of spontaneous neuronal activity during slow-wave sleep (Steriade et al.
2001). And, although the thalamic gates are closed for
signals from the outside world during slow-wave sleep,
due to the obliteration of synaptic transmission in thalamocortical neurons, the intracortical dialog and the responsiveness of cortical neurons are maintained and even
increased during this quiescent state. These data suggest
that slow-wave sleep may serve important cerebral functions, among which was the consolidation of memory traces
acquired during wakefulness (e.g., Huber et al. 2004;
Peigneux et al. 2004). Our observations may have heuristic
value in designing specific research projects geared toward
clarifying the sources and dynamics of the ‘‘intracortical
dialog’’ during this quiescent state.
Altogether, our findings lend further support for the notion
of use-dependent local sleep (e.g., Finelli et al. 2001; Ferrara
et al. 2002; Vyazovskiy et al. 2002) in the specific domain of
state-related interhemispheric variations.
3. Finally, the present results extend, in terms of ‘‘directionality,’’ several previous lines of evidence: 1) the reduction of
spontaneous neural activity in the splenium of the corpus
callosum across sleep stages in animals (Berlucchi 1965); 2)
the reduction in transcallosal inhibition especially from right
to left motor areas across sleep stages in humans (Bertini
et al. 2004); 3) evidence of slow sleep EEG oscillations as
traveling waves having intra- and interhemispheric directions of propagation (Massimini et al. 2004); 4) the drop in
functional interhemispheric connectivity during early sleep
stages (Massimini et al. 2005); 5) the modulation of interhemispheric EEG coherence across wake--sleep stages in
normal subjects (Nielsen et al. 1990; Guevara et al. 1995;
Achermann and Borbely 1998) and in patients with partial
resection or agenesis of the corpus callosum (Montplaisir
1990; Nielsen et al. 1993); and 6) the decrement of regional
cerebral blood flow in the left parietal area during slow-wave
sleep (Kajimura et al. 1999).
Conclusions
The above considerations are fundamentally limited to description and further clarification of the empirical findings on
the interhemispheric relationships during wake and early sleep
stages. These relations are part of a complex matrix of cortical
and subcortical connections underlying the cognitive processes
during wake--sleep states (Kaminski et al. 1997; Balkin et al.
2002; Massimini et al. 2005). Nevertheless, the current approach
may suggest new research strategies to increase knowledge on
the interhemispheric functional coupling in different psychophysiological and pathological conditions.
At the psychophysiological level, one prospect is to investigate the relationship between physiological indicators of directionality and thinking processes in relative independence of
the traditional categorizations of wake and sleep states. States of
consciousness are traditionally viewed through the eyes of the
nosologist, who distinguishes and separates waking from sleep
stages with their stereotyped correlation with thinking processes. What is often lacking is the effort to look through the
states, by searching for unifying principles and organizational
coherence (Bertini 1986). As far as our findings do associate
different directions of information flow between hemispheres
to different EEG rhythms and indicate specific variation of
dominance between these rhythms in the transition from wake
to sleep states, they invite us to break the imagined walls of the
states of consciousness. For example, following the traditional
attitude of associating the beta rhythm with wakefulness, we
may fail to acknowledge the presence and to understand the
functional meaning of this rhythm in the sleep state; in the same
vein, we may pay little attention to the delta waves so often
appearing during the wake and REM state. The prospect is to
understand the functional continuity of the same physiological
rhythms which might change in their hierarchical integration
along the 24-h cycle in strict dependence on the physiological and
mental requirements of the internal and external environments.
Specific suggestions may also come from investigations in
the pathological domain. For example, the hypothesis that the
presence of slow waves routinely observed in the EEG records
of epileptic patients is associated with the right to left predominance of directional flow is clearly testable. Within these
perspectives, we are currently carrying on a large validation
study involving multilevel approaches concerning both normal
and pathological conditions.
Notes
We wish to thank Dr Andrea Cassarino for his technical help and Prof.
Fabrizio Eusebi for his continuous support. FV participated in this study
in the framework of his PhD program at the Doctoral School in
Neurophysiology, University of Rome ‘‘La Sapienza.’’ The research
received funds from the Department of Psychology (University of
Rome ‘‘La Sapienza’’) and from the Association Fatebenefratelli for
Research. Conflict of Interest: None declared.
Address correspondence to Dr Mario Bertini, MD, PhD, Dipartimento
di Psicologia, Università degli Studi di Roma ‘‘La Sapienza,’’ Via dei Marsi,
78, 00185 Rome, Italy. Email: [email protected].
References
Achermann P, Borbely AA. 1998. Temporal evolution of coherence and
power in the human sleep electroencephalogram. J Sleep Res.
7:36--41.
Amzica F, Steriade M. 1995. Disconnection of intracortical synaptic
linkages disrupts synchronization of a slow oscillation. J Neurosci.
15:4658--4677.
Babiloni C, Babiloni F, Carducci F, Cincotti F, Vecchio F, Cola B, Rossi S,
Miniussi C, Rossini PM. 2004. Functional frontoparietal connectivity
during short-term memory as revealed by high-resolution EEG
coherence analysis. Behav Neurosci. 118:687--697.
Babiloni C, Vecchio F, Babiloni F, Brunelli GA, Carducci F, Cincotti F,
Pizzella V, Romani GL, Tecchio FT, Rossini PM. 2004. Coupling
between ‘‘hand’’ primary sensorimotor cortex and lower limb
muscles after ulnar nerve surgical transfer in paraplegia. Behav
Neurosci. 118:214--222.
Balkin TJ, Braun AR, Wesensten NJ, Jeffries K, Varga M, Baldwin P,
Belenky G, Herscovitch P. 2002. The process of awakening:
a PET study of regional brain activity patterns mediating the re-
establishment of alertness and consciousness. Brain. 125(Pt
10):2308--2319.
Berlucchi G. 1965. Callosal activity in unrestrained, unanesthetized cats.
Arch Ital Biol. 103:623--634.
Bertini M. 1986. Some implication of Witkin’s teaching for sleep and
dreaming psychophysiology. In: Bertini M, Pizzamiglio L, Wapner S,
editors. Field dependence in psychological theory, research and
application. London: LEA. p 15--26.
Bertini M, De Gennaro L, Ferrara M, Curcio G, Romei V, Fratello F,
Cristiani R, Pauri F, Rossini PM. 2004. Reduction of transcallosal
inhibition upon awakening from REM sleep in humans as assessed by
transcranial magnetic stimulation. Sleep. 27:875--882.
Blinowska KJ, Kus R, Kaminski M. 2004. Granger causality and information flow in multivariate processes. Phys Rev E Stat Nonlin Soft
Matter Phys. 70(5 Pt 1):050902.
Cole RJ, Kripke DF, Gruen W, Mullaney DJ, Gillin JC. 1992. Automatic
sleep/wake identification from wrist activity. Sleep. 15:461--469.
De Gennaro L, Ferrara M, Curcio G, Cristiani R. 2001. Antero-posterior
EEG changes during the wakefulness-sleep transition. Clin Neurophysiol. 112:1901--1911.
De Gennaro L, Vecchio F, Ferrara M, Curcio G, Rossini PM, Babiloni C.
2004. Changes in fronto-posterior functional coupling during sleep
onset in humans. J Sleep Res. 13:209--217.
De Gennaro L, Vecchio F, Ferrara M, Curcio G, Rossini PM, Babiloni C.
2005. Antero-posterior functional coupling at sleep onset: changes
as a function of increased sleep pressure. Brain Res Bull. 65:
133--140.
Demaree HA, Everhart DE, Youngstrom EA, Harrison DW. 2005. Brain
lateralization of emotional processing: historical roots and a future
incorporating ‘‘dominance’’. Behav Cogn Neurosci Rev. 4:3--20.
Ferrara M, De Gennaro L, Curcio G, Cristiani R, Corvasce C, Bertini M.
2002. Regional differences of the human sleep electroencephalogram in response to selective slow-wave sleep deprivation. Cereb
Cortex. 12:737--748.
Finelli L, Borbely AA, Achermann P. 2001. Functional topography of the
human non-REM sleep electroencephalogram. Eur J Neurosci.
13:2282--2290.
Guevara MA, Lorenzo I, Arce C, Ramos J, Corsi-Cabrera M. 1995. Interand intrahemispherical EEG correlation during sleep and wakefulness. Sleep. 18:257--265.
Halpern ME, Gunturkun O, Hopkins WD, Rogers LJ. 2005. Lateralization
of the vertebrate brain: taking the side of model systems. J Neurosci.
25:10351--10357.
Huber R, Ghilardi MF, Massimini M, Tononi G. 2004. Local sleep and
learning. Nature. 430:78--81.
Jacobson S, Trojanowski JQ. 1975. The appearance of dendrites of
callosal and corticothalamic neurons in somatosensory cortex of
immature rats demonstrated by horseradish peroxidase. Adv Neurol.
12:319--333.
Kajimura N, Uchiyama M, Takayama Y, Uchida S, Uema T, Kato M,
Sekimoto M, Watanabe T, Nakajima T, Horikoshi S, et al. 1999.
Activity of midbrain reticular formation and neocortex during the
progression of human non-rapid eye movement sleep. J Neurosci.
19:10065--10073.
Kaminski MJ, Blinowska KJ. 1991. A new method of the description of
the information flow in the structures. Biol Cybern. 65:203--210.
Kaminski MJ, Blinowska KJ, Szclenberger W. 1997. Topographic
analysis of coherence and propagation of EEG activity during
sleep and wakefulness. Electroencephalogr Clin Neurophysiol.
102:216--227.
Korzeniewska A, Kasicki S, Kaminski M, Blinowska KJ. 1997. Information
flow between hippocampus and related structures during various
types of rat’s behavior. J Neurosci Methods. 73:49--60.
Kus R, Kaminski M, Blinowska KJ. 2004. Determination of EEG activity
propagation: pair-wise versus multichannel estimate. IEEE Trans
Biomed Eng. 51(9):1501--1510.
Massimini M, Ferrarelli F, Huber R, Esser SK, Singh H, Tononi G. 2005.
Breakdown of cortical effective connectivity during sleep. Science.
309:2228--2232.
Massimini M, Huber R, Ferrarelli F, Hill S, Tononi G. 2004. The sleep slow
oscillation as a traveling wave. J Neurosci. 24:6862--6870.
Cerebral Cortex August 2007, V 17 N 8 1977
Mima T, Matsuoka T, Hallett M. 2000. Functional coupling of human
right and left cortical motor areas demonstrated with partial
coherence analysis. Neurosci Lett. 287:93--96.
Mima T, Matsuoka T, Hallett M. 2001. Information flow from the
sensorimotor cortex to muscle in humans. Clin Neurophysiol.
112:122--126.
Montplaisir J, Nielsen T, Cote J, Boivin D, Rouleau I, Lapierre G. 1990.
Interhemispherical EEG coherence before and after partial callosotomy. Clin Electroencephalogr. 21:42--47.
Nielsen T, Abel A, Lorrain D, Montplaisir J. 1990. Interhemispherical EEG
coherence during sleep and wakefulness in left- and right-handed
subjects. Brain Cogn. 14:113--125.
Nielsen T, Montplaisir J, Lassonde M. 1993. Decreased interhemispherical EEG coherence during sleep in agenesis of the corpus
callosum. Eur Neurol. 33:173--176.
Peigneux P, Laureys S, Fuchs S, Collette F, Perrin F, Reggers J, Phillips C,
Degueldre C, Del Fiore G, Aerts J, et al. 2004. Are spatial memories
strengthened in the human hippocampus during slow wave sleep?
Neuron. 44:535--545.
Rechtschaffen A, Kales A. 1968. A manual of standardized terminology,
techniques and scoring system for sleep stages of human subjects.
1978 Hemispheric Connectivity at Sleep Onset
d
Bertini et al.
Los Angeles (CA): Brain Information Service/Brain Research Institute, University of California. p. 1--58.
Salmaso D, Longoni AM. 1985. Problems in the assessment of hand
preference. Cortex. 21:533--549.
Stephan KE, Marshall JC, Friston KJ, Rowe JB, Ritzl A, Zilles K, Fink GR.
2003. Lateralized cognitive processes and lateralized task control in
the human brain. Science. 301:384--386.
Steriade M, Contreras D, Curro Dossi R, Nunez A. 1993. The slow
( <1 Hz) oscillation in reticular thalamic and thalamocortical
neurons: scenario of sleep rhythm generation in interacting thalamic
and neocortical networks. J Neurosci. 13:3284--3299.
Steriade M, Timofeev I, Grenier F. 2001. Natural waking and sleep states:
a view from inside neocortical neurons. J Neurophysiol. 85:1969--1985.
Tononi G. 2005. Consciousness, information integration, and the brain.
Prog Brain Res. 150:109--126.
Vyazovskiy VV, Borbely AA, Tobler I. 2002. Interhemispheric sleep EEG
asymmetry in the rat is enhanced by sleep deprivation. J Neurophysiol. 88:2280--2286.
Werth E, Achermann P, Borbely AA. 1996. Brain topography of the
human sleep EEG: antero-posterior shifts of spectral power. Neuroreport. 8:123--127.
© Copyright 2026 Paperzz