DRYING OFLIQUID FOOD DROPLETS
EnzymeInactivation and Multicomponent Diffusion
CENTRALE LANDBOUWCATALOGUS
0000 0545 8514
tANDiJOUWIMVLSSITfcJjk
Promotoren:
dr. ir.K.van'tRiet
hoogleraar indelevensmiddelenproceskunde
dr. ir.P.J.A.M.Kerkhof
hoogleraar indefysische technologie, TechnischeUniversiteit Eindhoven
til-7"- 8?D ] , ibo^
G. Meerdink
DRYING OFLIQUID FOOD DROPLETS
EnzymeInactivationand Multicomponent Diffusion
Proefschrift
terverkrijging vandegraadvan doctor
indelandbouw- en milieuwetenschappen,
opgezagvan derector magnificus,
dr. CM. Karssen,
inhet openbaarte verdedigen
opwoensdag22 September 1993,
desnamiddagstevieruurindeAula
van deLandbouwuniversiteit teWageningen
"\
-'"0!-
Coverdesign:metdankaanMeesSchimmelenJoseMiddelhuis
CIP-GEGEVENSKONINKLIJKEBIBLIOTHEEK, DENHAAG
Meerdink, G.
Dryingofliquidfood droplets :enzymeinactivationand
multicomponentdiffusion /G.Meerdink. -[S.I. : s.n.].
-111.
ThesisWageningen. -Withref. -WithsummaryinDutch.
ISBN 90-5485-145-7
Subject headings:dryingkinetics/enzymeinactivation
/multicomponent diffusion.
m j o ? ^ , 14 fey
STELLINGEN
Blijkbaar is de fysische juistheid van modellen voor de beschrijving van de
droogkinetiek niet altijd relevant, gelet op de positieve conclusies omtrent de
geschiktheid van fysisch onjuiste modellen in het kader van geavanceerde
procescontrolesystemen.
Zaror,C.A.andPerez-Correa, J.R.(1991).Modelbasedcontrolofcentrifugal atomizerspray-drying.
FoodControl,2, 170-75.
Clement,K.H.,Hallstrom,A.,Dich,H.C.,Le, CM.,Mortensen,J.andThomsen,H.A. (1991). Onthe
dynamicbehaviourofspraydryers.TransIChemE,69,PartA,245-52.
Het is op z'n minst verbazingwekkend dat Masters in zijn Spray Drying Handbook
slechts summiere informatie verstrekt over de droogkinetiek van druppels en evenmin
verwijst naarrecenteliteratuur overditonderwerp.
Masters,K.(1991).SprayDryingHandbook.LongmanScientific&Technical,Harlow,England.
In demeestehoofdstukken over drogen in studie- enhandboeken op het gebied van de
(levensmiddelen-) proceskunde is weinig bruikbare informatie over droogkinetiek en
drogerontwerp tevinden.
In de literatuur worden voor de beschrijving van de droogkinetiek van agrarische
produkten veelal de 'thin layer equations'gebruikt. Het in plaats daarvan toepassen van
de 'short cut calculation method' zal het fysisch realiteitsgehalte van de geschatte
modelparameters sterk verhogen en het inzicht in de optredende transportprocessen
vergroten, zonder dat ditleidttot rekentechnische complicaties.
Coumans,W.J. (1987).Power lawdiffusion indrying processes.PhD.thesis, TechnicalUniversity
Eindhoven,TheNetherlands.
In veel studie- en handboeken over moleculaire scheidingsprocessen en
fasenevenwichten wordt bij de beschrijving van het fasenevenwicht gebruik gemaakt
vanhetbegrip fugaciteit inplaatsvan chemischepotentiaal. Deze gewoonte draagt niet
bijtot hetvergroten vanhet inzichtbijdestudenten, en isthermodynamischgezien ook
niet noodzakelijk.
* ) U G 8 * O * U>(>H
6.
Docenten in de procestechnologie zouden zich meer moeten realiseren dat het
behandelen van gecompliceerde stofoverdrachtsproblemen weinig zinvol is zolang
slechts een beperkt aantal studenten de basisconcepten voor de beschrijving van
stofoverdracht werkelijk doorgrondt.
7.
Indien deLandbouwuniversiteit blijft vasthouden aan de gedachte dat allestudies in de
eerste en tweede fase gelijk van opzet en lengte moeten zijn, zal dat leiden tot een
ernstigeverzwakkingvandepositievandetechnologischestudierichtingen ten opzichte
van'concurrende'opleidingenaanandereuniversiteiten.
8.
Het grote belang dat de centrale beleidsorganen van de Landbouwuniversiteit aan de
verbetering van de kwaliteit van de onderwijspraktijk zeggen te hechten, heeft tot nu
toe weinig uitwerking gekregen in daadwerkelijk beleid, inclusief de daarbij behorende
wijzingen indeverdelingvanmiddelenenmankracht.
9.
Het groteaantal onzinnigeofverwerpelijke uitspraken enmaatregelen alsgevolgvande
heersende'lawandorder'manieisverontrustend.
10.
Indien dePvdAblijft vasthouden aan opvattingen omtrent detaak van de overheid die
25-50jaar geleden nuttig engoed waren, zalzij elkepolitieke invloed verliezen envele
potentielekiezersblijvend vanzichvervreemden.
Stellingenbehorendebijhetproefschrift "Dryingofliquidfood droplets"
G.Meerdink
Wageningen, 22September 1993
ABSTRACT
Meerdink G. (1993). The drying of liquid food droplets: enzyme inactivation and
multicomponentdiffusion. PhDthesis,AgriculturalUniversityWageningen, TheNetherlands
(122pp.,English andDutch summaries).
Keywords: drying kinetics, enzymeinactivation, multicomponent diffusion, modelling, liquid
foods, spray-drying.
Inthisthesisthedryingofliquid food dropletsisstudied from three different pointsofview:
dryingkinetics,enzymeinactivation andmulticomponent diffusion. Mathematical modelsare
developed andvalidated experimentally.
Drying experiments areperformed with suspended droplets and withfree falling droplets
under spray-drying conditions. Theexperimentswith the free falling droplets are performed
in a specially designed drying tower using a resonance nozzle. The resonance nozzle is
capableofproducing equallysizeddroplets.
Thermal enzymeinactivation kinetics are determined at different water concentrationsin
separate experiments. The inactivation kinetics can be described by a first order Arrheniustypemodel.
A mathematical model based on the binary diffusion equation and the inactivation
kinetics isdeveloped that describes the drying kinetics ofthedroplets aswell asthe enzyme
inactivation. The significance of the spray-air mixing pattern on enzyme inactivation is
examined usingthedevelopedmodel.
Slab drying experiments are performed with a ternary food model system. All
experiments show that segregation of the dissolved solids can occur. This segregation
cannot be described by a binary diffusion equation. Therefore the Maxwell-Stefan
multicomponent diffusion equations are applied.Model simulations areused to examinethe
extent ofsegregation during spray-drying.
ter herinnering aanmijnvader
VOORWOORD
Het is nu tien jaar geleden dat ik door Klaas van 't Riet bij de Sectie Proceskunde werd
aangesteld. Ik hebdaartot nutoe met plezier gewerkt. De Sectie Proceskunde is eenleuke
groep, terwijl daamaast het afwisselende karakter van het werk mij zeer aanspreekt.
Gedurende deze tijd heeft het nu voorliggende proefschrift langzamerhand zijn vorm en
inhoud gekregen. Dit was echter niet gelukt zonder de steun van een aantal mensen die ik
metnamewilbedanken.
Klaas van 't Riet: dewijze waaropjijje mensen devrijheid geeft, maar 'sturend' alsjij
datnoodzakelijk vindt, resulteert ineengoed werkklimaat enistegelijkertijd stimulerend.En
wat het onderzoek betreft: je wordt pas 'echt' enthousiast als de experimentele data niet
overeenkomen met de (model-) verwachtingen, dan komt een stroom van mogelijke
verklaringen enslimmeproefjes opgang.
Piet Kerkhof: ik vind het erg leuk dat je nu als promotor bij de afronding van dit
onderzoek betrokken bent. Jouw kennis, enthousiasme en inzet hebben een grote rol
gespeeld bij de start van het onderzoek en hebben mijn interesse in de procestechnologie
vergroot.
Bert Gundlach: zonder jouw bijdrage zou het experimentele werk minder snel en
minder goed verlopen zijn. Daarnaast heeft je optimistische en enthousiaste karakter de
moed er bij mij en onze studenten ingehouden als het weer eens niet verliep zoals gepland
was.
Gerrit Heida: je bent een prima kamergenoot. Het is aan jou te danken dat een
computeranalfabeet alsiktoch zonuendanietszinnigsuitdezeapparaten krijg.
Wim Beverloo: het doet er niet toe met welk proceskundig probleem ik bijje aanklop,
steedsbenjebereid omernaarteluisterenenelkekeerlukthetje weer ommijwijzer wegte
latengaan.
Studenten:jullieinzet isopvrijwel elkebladzijde vandit proefschrift terug tevinden.Al
ishet misschien frustrerend te ontdekken dat het werk van maandenzo nu en dan slechtsin
een paar regels istenigte vinden. Ditbetekent echter niet dat het daarom minder belangrijk
was.
Medewerkers Technische Dienst Biotechnion: ik sta er meestal niet zo bij stil, maar
jullie bijdrage aan dit onderzoek in de vorm van tekeningen, apparaten en adviezen, moet
toch algauw meer dan 1manjaar omvatten, met de droogtoren als opvallendste werkstuk.
Mijn dank daarvoor.
Mijn ouders: dit proefschrift is indirect ook een resultaat vanjullievoortdurende inzet
enbetrokkenheid tijdensmijnopleidingenwerk.
Verder gaat mijn dank uit naar Dr. ir. T.H.M. Snoeren voor de suggestie om het optreden
van segregatietijdens drogen eensnadertebestuderen; naar GiovannaFerrarivoor hetwerk
aan de droogkinetiek vanmelkdruppels; naar AnneHulst enJanHunikvoor hetmeedenken
over het ontwerp van de resonantie-nozzle; en naar de collega's bij Proceskunde voor de
prettigewerksfeer ensamenwerking.
Jose, de keuze voor de combinatie van werken, opleiding, krijgen en verzorgen van
kinderen, enaandachtvoor elkaarblijkt niet altijd gemakkelijk tezijn enisslechtsmetvallen
enopstaanteleren.Tochzouikhetnietandershebbengewild.
CONTENTS
GENERAL INTRODUCTION
1.1 MAINRESEARCH QUESTIONS INTHIS THESIS
1.2 DROPLETDRYINGKINETICS
1.3 DEACTIVATIONOF(X-AMYLASEDURINGDRYING
1.4 SEGREGATIONOFSOLUTEMATERIALDURINGDRYING
1.5 OUTLINE OFTHETHESIS
2 DROPLETDRYING KINETICS
2.1 INTRODUCTION
2.2 THEORETICALMODEL
2.3 MATERIALS ANDMETHODS
2.3.1 Suspended droplets
2.3.2 Freefalling droplets
2.3.2.1 Dryingequipment
2.3.2.2 Drying experiments
2.4 RESULTS ANDDISCUSSION
2.4.1 Suspended droplets
2.4.2 Freefalling droplets
2.5 CONCLUSIONS
11
11
17
17
18
18
20
22
22
34
46
3 INACTIVATION OF(X-AMYLASEDURINGDRYING
3.1 INTRODUCTION
3.2 THEORETICAL MODEL
3.3 MATERIALS ANDMETHODS
3.3.1 Inactivation kinetics experiments
3.3.1.1 Thermostablea-amylase
3.3.1.2 Thermo-unstable a-amylase
3.3.2 Dryingexperiments
3.3.2.1 Suspended droplets
3.3.2.2 Freefalling droplets
49
49
52
52
52
53
54
54
54
3.4 RESULTS ANDDISCUSSION
3.4.1 Inactivation kineticsexperiments
3.4.2 Drying experiments
3.4.2.1 Suspended droplets
3.4.2.2 Freefalling droplets
3.5 CONCLUSIONS
55
55
63
63
67
76
4 SEGREGATION OFSOLUTEMATERIALDURINGDRYING
4.1 INTRODUCTION
4.2 THETERNARYDRYINGMODEL
4.2.1 Themodel formulation
4.2.2 Theconcentration dependence ofthediffusion coefficients
4.3 MATERIALS ANDMETHODS
4.4 RESULTS ANDDISCUSSION
4.4.1 Drying experiments
4.4.2 Dryingmodel simulations
4.5 CONCLUSIONS
APPENDIX1
APPENDIX2
GENERAL DISCUSSION
5.1 INTRODUCTION
5.2 SPRAY-AIRMIXINGPATTERN ANDENZYMEINACTIVATION
5.3 SIGNIFICANCE OFMEASUREDINACTIVATION CONSTANTS
FOR SPRAY-DRYING CALCULATIONS
5.4 SEGREGATIONDURING SPRAY-DRYING
5.5 CONCLUSIONS
NOMENCLATURE
REFERENCES
SUMMARY
SAMENVATTING
79
79
79
83
85
87
87
90
96
97
98
99
100
105
107
110
111
115
119
121
Chapter1
GENERAL INTRODUCTION
1.1 MAIN RESEARCH QUESTIONS IN THIS THESIS
Dryingisaveryimportant unitoperationinthefood industry; it isaconcentration aswellas
a preservation method. The obtained dry product has a much longer shelflife at ambient
temperature than the original 'fresh' product because ofthe decreased water activity. Drying
processes are designed and operated in such a way that heat deterioration of the dried
product isavoided asmuch aspossible, whilegood rehydration and handling properties are
aimed at.
The design and optimisation of drying apparatus is, despite their significance and
extensiveuse,generally stillbased onqualitative insightsinthe importance ofvariousdrying
and product parameters, empirical correlations and practical experience. The design and
optimisation isbased on 'trial and error' and empirical scale-up experiments. This is caused
bythe complicated relations between original product properties, drying process conditions
anddesired dried product characteristics.Moreover, (validated) mathematical dryingmodels
based onfundamental dryingparameters (e.g.waterdiffusion coefficients andwater sorption
isotherms) and product properties (e.g. reaction kinetics of heat labile components) are
scarce.
The existence of drying models, describing parts of or the entire drying process, will
facilitate design procedures and enhance the possibilities of improving process conditions
regarding among other things product quality. Furthermore the number of large-scale
experiments willbe reduced and the understanding ofthe results of drying experimentswill
beimproved.
Animportant group of food materials that arebeing dried, are liquid foods such as dairy
products, fruitjuices,and carbohydrate solutions.Liquid foods arecommonly driedinspraydryers, inwhich thefluidis atomised and small free falling droplets (droplet diameter dd is
10 - 300 urn) are formed. Spray-dryers are mostly operated in co-current mode to avoid
thermal deterioration ofthe drying products. Spray-dryers are designed and optimised inan
'empirical'way. Thedevelopment ofan'overall'dryer model isstillinitsfirststage (Kerkhof
andCoumans(1990),Liveslyetal. (1992)).
2
Chapter 1
Essential parts of an 'overall' spray-dryer model are a kinetic model of a drying droplet
and a model that predicts the final product properties using calculated internal water
concentration profiles and droplet temperatures. In recent years droplet drying kinetics
models are developed andvalidated experimentally. However, almost all experimental work
ondroplet dryingkineticsisperformed with'large' suspended droplets (dd =1-10mm). No
studies have been published which deal extensively with the drying kinetics of small freefalling droplets under spray-drying conditions. In a few publications the relations between
droplet drying kinetics and product quality are explicitly taken into consideration, but the
empirical evidencefor theproposed mathematical relationsislimited and absent onthelevel
ofsmallfree falling droplets.
Inalmost all(droplet) dryingmodels(liquid)foods areconsidered asbinary systems,with
water and dry solids asthe two components. Foods are, however, multicomponent systems
and as a consequence segregation during drying can occur of the dissolved solids. In the
literaturenoattention ispaidtotheoccurrence and possibleconsequences of segregation for
dryingkineticsandproduct quality.
Thestartingpoint ofthisthesiswasthe conviction that the kineticsofadrying droplet of
liquid food material can be predicted using an existing model and consequently no new
modelhadtobedeveloped. Themainquestionsraised inthisthesisare therefore:
1. Is the droplet drying model that is developed and validated for 'large' suspended liquid
food droplets, appropriate also for describing the drying kinetics of 'small' free falling
dropletsunder spray-drying conditions?
2. Is it possible to predict a (bio-) chemical product quality change during drying by
integratingthedroplet dryingmodelwithakineticsmodelthat describesthereaction rate
as a function of water concentration and temperature? Or, more specific, can the
inactivation oftheenzymea-amylaseduringdryingbepredicted?
3. Is it necessary to develop a droplet drying model which takes into account the
multicomponent nature of liquid foods? Or, more specific, can segregation of solutes
duringdryingbemeasured andmodelled?
In this thesis the (existing) droplet drying model is adapted and extended to include
reaction rates and multicomponent diffusion. The drying experiments and/or model
General introduction
simulations areperformed alwaysontwo levels,onthe level o flarge'suspended droplets or
layers (dd «10mm) and on the level of'small' free falling droplets (dd »0.2mm) under
spray-dryingconditions.
1.2 DROPLET DRYING KINETICS
The drying kinetics of liquid food droplets has been studied experimentally and or
theoretically by several authors (Ranz and Marshall (1952), Charlesworth and Marshall
(I960), Trommelenand Crosby (1970), Kerkhof and Schoeber (1974), van derLijn (1976),
Schoeber (1976), Toei et al. (1978), Liou (1982), Sano and Keey (1982), Furuta et al.
(1985),Yamamotoetal.(1985), Coumans (1987)). Theproposed models areusuallybased
on the 'effective-diffusivity' concept. In this concept the different internal mass transfer
mechanismsarelumpedbyoneparameter, the 'effective' water diffusion coefficient, whichis
regarded as the controlling factor in the drying process. This effective water diffusion
coefficient isingeneral dependent onwater concentration and temperature. In most studies,
like in this thesis, it is assumed that no vacuole formation occurs during drying. The
influence ofvacuole formation ondroplet drying kinetics isexplicitly considered byVan der
Lijn (1976), Wijlhuizen et al. (1979), Sano and Keey (1982), and Kerkhof and Coumans
(1990).
The water concentration and temperature dependence of the effective diffusion
coefficient canbedetermined inseparate diffusion experiments (Schoeber (1976),Luybenet
al. (1980), Furuta etal.(1984), Coumans (1987), Tong and Lund (1990)). The advantages
ofthismodellingconcept comparedwithotherapproaches(e.g.:'curve-fitting' and'complete
modelling') are: the mathematical models obtained are not too complicated, the number of
parameterstobedetermined (orestimated) islimited, the parameters havephysicalmeaning,
and water concentration profiles can be calculated. Moreover, water diffusion is the main
internalmasstransfer processinliquidfoods for alargepart ofthedryingprocess.
Droplet drying experiments, although limited in number, showed in general a good
agreementbetween experimental and simulated drying kinetics (Liou (1982), Sano andKeey
(1982),Yamamotoetal. (1985),Furutaetal.(1985)).Measured diffusion coefficients were
used inthe simulations.However, inthe droplet drying experiments performed inliterature,
the drying conditions applied are quite different from the circumstances one encounters ina
spray-dryer. In particular:
- the applied initial droplet diameter is 1or 2 orders of magnitude larger than the droplet
diameter(dd = 10-300//m) ina spray-dryer.
Chapter 1
- the droplets are attached to a support or suspended in an upward directed air stream,
instead offreefalling.
- theapplied dryingairtemperatures areoften lowerthan the inlet (150-250°C) and outlet
(70-120°C)temperaturesused inspray-drying ofliquid foods.
- the initial and final moisture contents are often higher than in spray-drying. In spraydrying of liquid foods these values are 1 a 2 kgH20(kg ds)~l and 0.01 a 0.05
kgH20(kg ds)"l, respectively.
- the airvelocitiesused inthe experiments (about 1 ms~l)aremuch smallerthantheinitial
dropletvelocitiesinaspray-dryer (about 100ms~l).
Asaconsequencetheinitialdroplet dryingfluxinspray-drying is 10^- 10-> timeslargerthan
inthe experimentswiththe suspended droplets and the characteristic dryingtimes are 10^ 10"timessmaller.
This meansthat although there is experimental evidence that the proposed mathematical
modelsareapplicableindescribingthedryingkinetics ofsingledroplets,itisstilluncertainif
the models are appropriate under spray-drying conditions. This leaves the question whether
they can be used in the design or optimisation of spray-drying processes. Validating these
models in spray-drying experiments is, however, extremely difficult. This is caused by the
non-uniform conditions within the drying chamber, the existence of a droplet size
distribution and different droplet trajectories. Furthermore it is very difficult, not to say
impossible, to perform controlled experiments in a spray-dryer in such a way that only a
singleparameter ischanged at atime.
Inliterature afew experiments aredescribed inwhich the drying behaviour offree falling
equally sized (uniform) droplets under relatively constant external drying conditions was
studied (HendricksandBabil(1972),Buttiker (1978), Greenwald (1980), Alexander(1983),
El-Sayed (1987),Wallack(1988),Flicketal. (1988),El-Sayed etal.(1990), and Wallacket
al. (1990)). The conditions used in these experiments were better comparable with the
conditions one finds during spray-drying. A special atomisation device was used in these
experiments for the production of uniform droplets. The experiments were, moreover,
performed always in a drying tower inwhich the drying conditions were controlled. In this
way problems were avoided related to the drop size distribution and the non-uniformity of
the drying conditions during spray-drying as well as to the limitations of experiments with
suspended droplets.Intable 1.1 anoverview ofthe different studies ispresented concerning
theproducts dried,thedryingconditionsapplied andthemainaimsofthe study performed.
General introduction
Table 1.1 Overview ofstudies onthe dryingbehaviour offree-falling uniform droplets.
Author(s)
Product(s)
Drying conditions'
Aim of the study
Hendricks and Babil
aqueous and non-aq.
dd =10-40/an
uniformity and
(1972)
inorganic salts,
F =25-330 °C
morphology
liquidfoods and
mds =0.01-10%
polymers
Buttiker(1978)
aqueousCaCC>3
dd =300-800/an
morphology and
solutions
r = 190°C
drying kinetics
mds =10-55%
Greenwald (1980)
liquid foods
dd = 80-240,um
morphology
T=30-170 °C
mrfj = 10-40%
Alexander(1983)
liquid foods
dd = 180-300,um
morphology and
7 =75-275 °C
surface folding
mds = 1 0 - 4 0 %
El-Sayed (1987),
liquid foods
El-Sayedef a/. (1990)
dd =200-350//m
morphology and
T = 175-225 °C
drying kinetics
mds= 10-40%
Wallack (1988),
liquid foods
Wallack et al. (1990)
dd =180-250/^1
morphology and
T=100-250 °C
drying kinetics
mds = 30%
Flick era/. (1988)
skim-milk
dd =200-400 fm
C
T =80-180 C
morphology and
drying kinetics
mds= 2 4 - 3 1 %
1) mds = dry solids content ontotal basis
Most experimentswere performed attheUniversity ofCalifornia inBerkeley (Greenwald
(1980), Alexander (1983), El-Sayed (1987), Wallack (1988), El-Sayed et al. (1990),
Wallack etal. (1990)). At thisuniversity a small dryingtower (diameter « 0.08 m, length «
2.5 m)was build and different droplet producing devices were used. Different liquid foods
were studied in the experiments. Most experiments were performed at high drying air
temperatures (Tg«175 °C). In almost all studies listed in table 1.1, mainly changes were
6
Chapter 1
investigated inthe morphology ofthe product. From table 1.1 it canbe seenthat there have
been four (limited) attempts to determine the drying kinetics of the falling droplets and to
compare experimental results with model simulations. Agreement between experiments and
simulations was found only for the constant drying rate period (Buttiker (1978), El-Sayed
(1987),Wallack (1988),El-Sayed etal.(1990),Wallack etal.(1990)) or inthe onset ofthe
falling drying rate period (Flick et al. (1988)). This is due to the complicated drying
behaviour of the products studied (Buttiker (1978), El-Sayed (1987), Wallack (1988), ElSayedetal.(1990),Wallacketal.(1990)) or to thelimited length ofthe dryingtower used
by Flick et al. (1988). The drying air temperatures used by El-Sayed (1987), Wallack
(1988), El-Sayed etal. (1990), andWallack etal. (1990)were high(T * 175°C) and asa
result water vapour bubbles were formed after a certain drying time and expansion of the
droplets occurred. Moreover considerable axial air temperature gradients existed in the
dryingtower.
It canbeconcludedthat, although some attempts havebeen made, the drying kinetics of
'small'freefalling (liquid food) dropletsisnot yet studied indetail.Experimental evidenceof
the appropriateness of drying models, based on the 'effective-diffusivity' concept, is still
lackingfor spray-drying calculations.
Theobjectives ofthedryingexperimentswiththesuspended dropletsare:
- to validate the kinetics model for droplet drying before the experiments with the 'small'
freefalling dropletsarestarted.
- to develop avalidated modelwhichcanbeused asstartingpoint for the studyonenzyme
inactivation duringdrying.
Theobjective oftheexperimentswiththefree falling dropletsis:
- to validate the developed droplet drying model under spray-drying conditions, without
usingaspray-dryer.
1.3 DEACTIVATION OF a -AMYLASE DURING DRYING
Dryingcanprofoundly alterthequalityofadried product after rehydration. Inthe literature
numerous articles are published measuring and discussing the quality of dried products in
relation to initial product qualities and applied drying process conditions. But in almost all
these articles the drying process itself is considered as a 'black box' and no explicit
mathematical models are developed inwhich the drying kinetics are related with changesin
General introduction
(bio-)chemical ormechanical properties ofthe dried product. Consequently, the knowledge
and understanding oftherelations between drying conditions and product quality is at most
ofaqualitativecharacter. Abovethatpossibilities arelimited ofapplyingthe obtained results
inthedesignandoptimisation ofdryingprocesses.
Inthisthesisthe inactivation of enzymes, or more specific ofoc-amylase, during dryingis
studied as an interesting example of a biochemical quality parameter. Drying can
significantly reduce the activity of enzymes after rehydration. This reduction is determined
bytheenzymecharacteristics andbythe drying process conditions. Thedetermination ofthe
optimaldryingconditionsisanimportant prerequisitefor thesuccessful production ofactive
dried enzymes or alternatively, to inactivate the enzymes to avoid enzymatic deterioration
ofdried foods during storageorafter rehydration.
In the literature there are only a few publications dealing systematically with the
theoretical and/or experimental aspects of the inactivation behaviour of enzymes during
drying. Almost no information is available describing the inactivation kinetics at water
concentrations as low as found in drying processes. Kerkhof and Schoeber (1974),
Wijlhuizen et al. (1979), Luyben et al. (1982) and Kerkhof and Coumans (1990) have
described the inactivation of enzymes during (spray-) drying theoretically. The inactivation
kinetics used were based on sparse literature data, mainly from Verhey (1973), Daemen
(1981, 1983) and Daemen and Van der Stege (1982), who studied experimentally the
inactivation behaviour of several enzymes during the spray-drying of milk. The inactivation
of enzymes in single droplets was studied theoretically and experimentally by Liou (1982)
and Yamamoto et al. (1985, 1992). They found a good agreement between inactivation
experiments and drying model simulations. Zimmerman (1987) modelled the inactivation of
intra-cellular enzymes during fluidized bed drying of yeast and verified the model
experimentally. However, the appropriateness of the drying kinetics model as applied by
Zimmerman (1987), namelyashrinkingcoremodel,isdisputable.
Theobjectives ofthedryingexperimentswiththe suspended dropletsare:
- tomeasureand modeltheinactivation kinetics oftheenzymeot-amylase.
- to model the enzyme inactivation in a drying droplet and to validate the model with
drying experiments. The integration of experimentally determined inactivation kinetics
and dryingparameters should result inanoverallmodel.
Theobjective ofthedryingexperimentswiththefree falling dropletsis:
- totestthedeveloped enzymeinactivation modelunder spray-dryingconditions.
1
8
Chapter 1
1.4 SEGREGATION OF SOLUTE MATERIAL DURING DRYING
Liquid foods consist ofmanysolutes,which havewidely different diffusivities. Thevaluesof
the binary diffusion coefficients in dilute aqueous solutions can vary at least two orders of
magnitude for low and high molecular weight components, respectively. During drying the
concentration gradients originating from the water transport will induce mass transport of
the (non-volatile) solutes in opposite direction. The transport velocities of the different
solutes depend on the values of their diffusion coefficients. Given the large difference in
these coefficients, it can be expected that segregation of components can occur during
drying. At the surface the concentration of components with a low diffusivity will be
relatively highas compared withthe concentration of components with ahigh diffusivity. In
the centre the reversed situation will exist. This phenomenon is neglected in the binary
approachofdryingkinetics.
The extent of this segregation will depend on the difference in the component
diffusivities, the initial water concentration and the drying process conditions. The product
quality will be influenced dependent on the extent of this segregation, in particular the
surface properties. Considering the fact that liquid foods are mostly dried in spray-dryers,
segregation caninfluence powder characteristics inthisway.
In literature on drying, very little attention is paid to segregation of non-aqueous
components and relevant information is almost non-existing. An important exception is the
retention of volatile aroma components during drying of foods (Chandrasekaran and King
(1972a, b), Kerkhof (1975), Riede and Schlunder (1988)). A few fundamental studies are
reported on dilute non-electrolyte ternary mixtures in water (Dunlop and Gosting (1957),
Dunlop and Gosting (1964), Ellerton and Dunlop (1967)). In these studies multicomponent
diffusion coefficients were measured at high water concentrations, using solutes with a low
molecularweight.
Theobjectives ofthedryingexperimentsare:
- tomeasureifsegregation occursduring dryingofliquid foods.
- to develop adryingmodelwhichdescribesthemeasured segregation.
Theobjective ofthemodel simulationsis:
- to evaluatetheextent ofsegregation during spray-drying.
Generalintroduction
1.5 OUTLINE OF THE THESIS
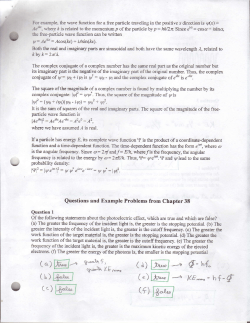
Infigure1.1 thecoherenceand outline ofthisthesisisshown.
Chapter 2describesthe droplet drying kineticsmodel and the drying kinetics experiments
withthe suspended and free falling droplets. Theexperimental drying kinetics are compared
withmodelsimulations.
Chapter 3deals with the modelling and measurement of the thermal enzyme inactivation
kineticsandthecouplingofthesekineticstothedryingmodel asdescribed inchapter 2.The
experimental enzymeinactivation duringdryingiscompared withmodel simulations.
Chapter 4 describes the developed ternary drying model and the measurement of
segregation during drying. The experimental concentration profiles are compared with
modelsimulations.
Chapter 5discussesthe influence ofthe spray-air mixing pattern on enzyme inactivation,
the significance of measured inactivation constants for spray-drying calculations and the
extent ofsegregation duringspray-drying.
(^STARTING POINT^)
MULTICOMPONENT
DIFFUSION
INACTIVATION
KINETICS
INACTIVATION
•
DROPLET
T
DRYING KINETICS
OFa-AMYLASE
SEGREGATION
OF SOLUTES
1
1
CHAPTER 3
.
1
CHAPTER 4
CHAPTER 2
L
'SUSPENDED'
DROPLETS
(d = 1cm)
MODELLING
EXPERIMENTS
!
MODELLING
EXPERIMENTS
MODELLING
EXPERIMENTS
'FREE FALLING'
DROPLETS
(d =: 0.02 cm)
MODELLING
EXPERIMENTS
|
!
MODELLING
EXPERIMENTS
MODELLING
SIMULATIONS
r
f
CHAPTER 5
GENERAL
DISCUSSION
Figure1.1
Outlineofthisthesis
—
1
Chapter 2
DROPLET DRYING KINETICS
2.1 INTRODUCTION
Inthischaptertheapplied droplet dryingkineticsmodelandtheresultsofthedroplet drying
experimentsaredescribed. Theexperimental data arecompared withmodelpredictions. The
experiments with the suspended droplets (dd «lcm) and the experiments with the free
falling droplets(dd «0.02cm)arediscussed separately.
In the suspended droplet experiments awider range of initial moisture contents isused,
than is applied in the studies described in literature (Liou (1982), Sano and Keey (1982),
Yamamotoetal.(1985),Furutaefa/. (1985)).
The experiments with the free falling droplets are performed in a specially designed
drying apparatus. This equipment consists of two main parts: the resonance nozzle and the
dryingtower. Theresonance nozzleiscapableofproducing equallysized(uniform) droplets.
The drying tower is designed in a such way that the drying conditions are uniform and
comparablewithspray-dryingconditions.
Inthedrying experimentsmaltodextrin solutionsand skim-milk areused.
2.2 THEORETICAL MODEL
The drying model isbased onthe 'effective' water diffiisivity concept (see chapter 1.2). The
model consists of three main equations. Water concentration profiles inside a droplet are
calculated by solving the unsteady state diffusion equation for binary systems. A heat
balance gives the droplet temperature during the drying process. The droplet trajectory is
calculated byusingamomentumbalance.Major assumptionsregarding the dryingbehaviour
of a droplet are:the droplet is and remains perfectly spherical, the change involume of the
droplet corresponds to the volume of water evaporated ('ideal shrinkage') and no vacuole
formation occursduringdrying.
Chapter 2
12
- Diffusionequation
The internal transport of water in a shrinking, drying droplet can be described by means of
thefollowing diffusion equation:
1 d
dt
r*Dw(Cw,T)^
(2.1)
or
where Cwisthewater concentration, t isthedryingtime, r isthe space co-ordinate, Dw is
thewater diffusion coefficient, and T isthetemperature.
Theinitialandboundary conditionsare:
/ =0
0<r<Rdi0
r>0
r =0
(2.2)
L w —Cw o
(2.3)
dr
-D, w
/>0
r = Rj,,
dr
\-C V
1
~~ kg,eff \Pw,i ~ Pw,b)
(2.4)
W w
where Rd is the droplet radius, Vw is the partial volume of water, kg ejj is the effective
external mass transfer coefficient, pw is the gas phase water concentration, and the
subscripts 0, t, i and b denote initial, drying time, interface and bulk phase, respectively.
The boundary condition 2.4 gives the water flux with respect to the receding external
surface. The equilibrium relation between the internal and external water concentration at
the surface is given by the water sorption isotherm. The effective external mass transfer
coefficient Jcg ejy isthe external masstransfer coefficient kg corrected for Stefan-diffusion,
because a net massflowexists in the gas phase. Through the interface there is an outward
directed moistureflux,but no opposite airflux.The external masstransfer coefficient kg is
calculated from thecorrelation ofRanzandMarshall(1952):
Sh=2+ 0.6Re05 Sc033
(2.5)
Droplet drying kinetics
13
where Sh, Re and Sc arethe Sherwood, Reynolds and Schmidt number, respectively.
- Heatbalance
Theheat balance isbased onthe assumption that there isnotemperature gradient within the
droplet, because the characteristic time for internal heat transfer is much smaller than for
internal masstransfer. In addition, the Biot number Bi for heat transfer is small (suspended
droplets: Bi » 05, free falling droplets: Bi « 0.1).Moreover apart ofthe heat transferred to
the surface isused immediately for the evaporation ofwater. Accordingly, the heat balance
equationbecomes:
-j^d,tcP,dPd-jj-=
a
g,eff iTg,b ~Td)-kg,eff \Pw,i - / V - M # v
(2.6)
where cpd isthespecific heat, pd isthedroplet massdensity, ccgejj- istheeffective external
heat transfer coefficient, AHV is the heat of evaporation at the temperature of the droplet,
and the subscripts d and g denote droplet and gas phase, respectively. The heat balance
equation correlates the droplet temperature change with the difference between the heat
transferred by convection and that needed for evaporation. The effective external heat
transfer coefficient ag>eff ist n e external heat transfer coefficient ag corrected for theunidirectional mass transport in the gas phase. The external heat transfer coefficient ag is
calculated applyingtheheat transfer analogue ofequation2.5:
Nu =2+0.6Re"> Pr'
-033
where Nuand Pr aretheNusseltandPrandtlnumber, respectively.
- Momentum balance
Important assumptions regarding the falling behaviour are: the droplet moves in vertical
direction only,thefalling behaviour ofthedroplet isnot influenced bythe presence of other
dropletsandthedroplet behavesasarigid sphere. Themomentumbalancebecomesthen:
(2.7)
Chapter 2
14
dvd
(Pi-Pz\
3QPg(vd~vg)
(2.8)
where v is the velocity, g is the gravity constant and Cd the drag coefficient. The drag
coefficient iscalculated bythenextexpressions(Birdetal.(I960)):
Re<2
Cd
2<te<500
G=
to >500
Q=0.44
~Re
18.5
Re 0.6
(2.9)
(2.10)
(2.11)
- Numericalsolution
Thesetofdifferential equations 2.1, 2.6and2.8 issolved byanimplicit difference technique
taking unequal space and time intervals. Because of the moving outer boundary of the
droplet, the diffusion equation 2.1 and the initial and boundary conditions 2.2, 2.3 and 2.4
are transformed applying a dissolved solids centred space co-ordinate. In this way the
movement of the external interface through the space co-ordinate grid is avoided. The
transformed spaceco-ordinate isdefined as:
]cdsr2dr
(2.12)
where a isthe transformed space co-ordinate and Cds isthe dissolved solids concentration.
Thewater concentration inthetransformed co-ordinate systemisdefined as:
c,ds
(2.13)
Droplet drying kinetics
15
where uw isthetransformed water concentration. Thetransformed diffusion equation hasa
form similar to equation 2.1. The computer program used is an adapted and extended
versionoftheprogramsdeveloped byVanderLijn(1976) andWijlhuizenetal.(1979).
- Physicaldata
The physical data used in the simulations are given in the tables 2.1 (skim-milk) and 2.2
(maltodextrin). Thewater sorption isotherm of skim-milk and the temperature dependence
of the isotherm are based on data given by Walstra and Jennes (1984). The concentration
and temperature dependence of the water diffusion coefficient in skim-milk are based on
data obtainedbyFerrarietal.(1989). Theconcentration andtemperature dependence ofthe
diffusion coefficient was measured in a water concentration range from 0.25 - 0.8
kgH20(kg ds)"1 andfor temperaturesfrom 30-70°C.
The water sorption isotherm of maltodextrin and the water concentration and
temperature dependence of the water diffusion coefficient in maltodextrin are based on the
data obtained byFuruta etal. (1984). They present diffusion data for water concentrations
from 0.1 - 9 kgH20(kg ds)~l and for a temperature range of 25 - 45 °C. The temperature
dependenceofthewater sorptionisothermisneglected. ThemaltodextrinusedbyFurutaet
Table 2.1. Physical data skim-milk
Skim-milk solids density
1470kg m"3
Specific heat ofskim-milk solids
1790 Jkg"1 K"1
Sorption isotherm ofskim-milk at
cow <0.125
T= 293K
aw >0.125
aw=5.6(ow
aw =exp(-0.002s/(O„ 234 )
Temperature dependence ofthe
sorption isotherm
E
a
w,T ~ aw,293
ex
Eaw =33860expi
Diffusion coefficient ofwater in
skim-milk at r = 323K
A*,323 =exp
a.w ( 1
R [T
P
1_V
293J
-22.38a) w ) Jmol" 1
82.50+1700<»w"
mP- s~l
l+79.61a)H,
Temperature dependence of the
water diffusion coefficient
®w,T = Dw,373 e*P
2 -1
[
R [T
323J
Eaw = 139000 exj >(-3.32<aw) Jmol" I
Chapter 2
16
al. (1984) has the same Dextrose Equivalent value as the maltodextrin used in the
experiments reported here.
Table2.2. Physicaldatamaltodextrin
Maltodextrin density
1600kg nT 3
Specific heat of maltodextrin
1500 Jkg"1 K"1
Sorption isotherm of maltodextrin
a)w>0.35
aw=l
5
cow<035
aw = Y,enmw
«=l
ex =5.38828
e2 = 20.6498
e 4 = 443.880
es =-315.853
e3 = -197.015
Diffusion coefficient ofwater in
skim-milk at T =308K
D w ,308=10" = 1
10-4m2s-!
o, =-5.62029
a2 =3.75424
a4 =704.872
a5 =-2853.10
a6 =6354.49
a-,=-7952.04
a 8 =5245.81
a9 =-1424.05
Temperature dependence ofthe
water diffusion coefficient
E
(1984))
a,w(\
R \T
D
w,T =Av.308e x P
Moisture dependence of the
activation energy (Furuta et al.
a 3 = -86.5335
1 y
2 -1
nv' s l
308J
6
Eaw=4200'£c„(l-mK)"-1
c, =3.32582
c 4 =-443.608
c 2 =-15.8667
c 5 =481.664
J mol' 1
c3 =151.217
c6 =-146.387
Adapted relation for the
moisture dependence of the
activation energy
Ea,w =75000exp(-6ft> w )+25000 J mol"1
Droplet drying kinetics
2.3 MATERIALS AND METHODS
2.3.1 Suspended droplets
- Skim-milk
The drying experiments were performed in a laboratory-scale fluid-bed dryer (PRL
Engineering Ltd., UK). The dropletswere placed inthe dryer on a perforated tray ( 0 = 10
cm). In a drying experiment about 20 droplets were dried simultaneously. The air
temperature and velocity were controlled and kept constant during an experiment. Ambient
air was used as drying medium. The air velocity used (0.7 ms"l) was below the terminal
falling velocity ofthe droplets (10 ms'l), consequently the droplets were not fluidized The
droplets to be dried consisted ofjellified spheres (agar (Merck), 0.5 % on total basis) of
concentrated skim-milk with an initial moisture content of 4.5 kgH20(kg ds)~l and an
initial diameter of 1 cm. The droplets were produced using a perspex mould. The water
content ofthe droplets was determined byweighing the droplets before and after the drying
experiment. Atdifferent timeintervals aspherewastaken from the dryer and weighted. The
dryingexperimentswereperformed at 55,75and 95°C.
- Maltodextrin
The drying experiments were performed in a vertical tube ( 0 = 12 cm), which was
connected with a drying apparatus (Kiekens nv., The Netherlands). In the tube about 10
droplets were dried simultaneously. The droplets were distributed over the cross-sectional
area of the tube. One of the droplets was attached to a thin thermocouple, the others to
cotton strings. The airflowinthe tube had a downward direction. The air temperature and
velocity were controlled and kept constant during an experiment. Dried air was used as
dryingmedium. Thedropletstobedried consisted ofjellified spheres (agar (Merck), 2%on
total basis) of maltodextrin solutions (MOR-SWEET 01921, DE 20-22, Cerestar) with
different initial moisture contents. The droplets were produced by using a perspex mould
with a diameter of 1cm.For the drying experiment with an initial moisture content of 0.47
kg H20(kg ds)"l the droplets were pre-dried. The initial diameter was 0.86 cm in that
experiment. The water content of the droplets was determined by weighing the droplets
before and after the drying experiment. A droplet was removed at different times and the
weight was determined. The change in the droplet temperature during the drying process
wasfollowed withtheinserted thermocouple.
In the drying experiments, the initial water content varied between 3.0 and 0.47 kg
H20(kg ds)~l. Thetemperature ofthedrying airvaried between 97 and 105 °C and the air
17
18
Chapter 2
velocity was 2.5 ms'l. Higher drying temperatures gave practical problems such as crust
formation, loss of the spherical shape of the droplets, vacuole formation and boiling
phenomena.
2.3.2.Freefalling droplets
2.3.2.1.Drying equipment
- Resonance nozzle
In the resonance nozzle a laminar liquidjet is broken up in uniform droplets by applying a
controlled external sinusoidal disturbance (Hulst etal. (1985), Hunik and Tramper(1992)).
Infigure2.1a schematic representation ofthe resonance nozzle is depicted. The membrane
is connected bymeansofthe pinwith an electromagnetic vibration exciter (Bruel & Kjaer).
The charged electrode is meant for charging of the droplets to avoid coalescence of the
droplets. Moreover it causes the formation of a droplet spray inside the drying tower,
instead of a very narrow 'droplet jet'. This spray enhances the uniformity of the droplet
dryingconditions.
The break-up of a laminar jet in equally sized droplets is described for non-viscous
liquids byRayleigh and for viscous newtonian liquids by Weber (Lefebvre (1988)). Weber
(Lefebvre (1988)) has developed a relation to calculate the optimal frequency of the
sinusoidal disturbance for newtonian liquids, which contains the density, viscosity and
surface tension oftheliquid aswell asthejet velocity and the diameter ofthenozzle orifice.
The droplet diameter can be calculated by adding a mass balance equation, resulting in
equation2.14.
(2.14)
* - ' . ^ )
where Om is the mass flow and / is the frequency of the sinusoidal disturbance. In the
experimentsnozzle orifice diametersdn of80u,m,88 urnand 103 urnwere used. Themass
flow<I>mwasalways 8.3 10"^ kgs'l, resulting injet velocities v ; ofrespectively 14.1ms"*
(dn = 80 urn), 11.7 ms"l (d„ = 88 urn) and 8.5 ms"1 {dn = 103 urn) for a maltodextrin
Droplet drying kinetics
19
solution with a moisture content of 1.5 kgH20(kg ds)"1. The applied frequencies were
34400 Hz (d„ = 80 um) and 16000 Hz (dn = 88, 103 urn), respectively. The frequencies
used withthe nozzle orifices of 80 umand 103 um are equal to the optimal frequency. The
frequency used with a nozzle orifice of 88 um is smaller than the optimal frequency of
25600 Hz, but also at this frequency uniform droplets were produced. The calculated
droplet diameters at these frequencies are 158 um (34400 Hz) and 204 um (16000 Hz).
Droplet diameters were determined using a measuring microscope (Zeiss). The voltage on
the charging electrode varied between 50 and 150 V depending on the nozzle orifice
diameter, the applied frequency, the distance between resonance nozzle and charging
electrode, the desired spray-angle (higher voltages resulted in larger spray-angles), and the
moistureconcentration ofthe solution.
Liquid in
earth
negative charged
droplets
positive charged
electrode
droplet_
spray
Figure 2.1
Schematic representation ofthe resonance nozzle.
20
Chapter 2
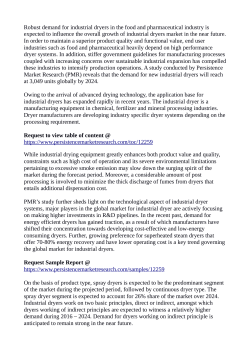
- Dryingtower
The dryingtower is depicted infigure2.2. The height of the tower is 6m and the diameter
0.63 m. The tower is insulated and electrical heating cables are applied to prevent axial
temperature gradients. The aim of the sieve plate is to reduce the development of radial
velocityprofiles. Ambient airwasused asdrying medium. Thedrying airwas heated directly
bymeansofanaturalgasburner. Atdifferent heightsinthe dryingtower, sampleports ( 0 =
10 cm) are present through which samples could be taken. The average air velocity in the
tower was 0.2 ms~l in the drying experiments. The value of the Reynolds number is,
accordingly, about 6500,indicatingthepresenceofaturbulent flow pattern. Airtemperature
andvelocitywerekept constant duringadryingexperiment.
Axial and radial airtemperature andvelocity profiles were measured inan 'empty' drying
tower using thermocouples and a heat wire anemometer (Alnor), respectively. The air
velocity measurementswereperformed atambienttemperatures.
In the experiments an excess of drying air was used to ensure the uniformity of the
drying conditions. As a result there is only a small increase of the air humidity (about 1
gH20(kgda)"*)and a small decrease ofthe drying airtemperature (about 2 °C), assuming
that the drying process isperformed under adiabatic conditions. These changes are about 50
times smaller than inactual spray-drying processes. The outlet relative humidity was always
lessthan 10%.
2.3.2.2 Drying experiments
- Determinationof thedropletdryingkinetics
Thedryingkinetics ofthedropletswasdetermined bycollecting droplets at different sample
ports. The samplesweretaken inthe centre ofthe drying tower. Thedroplets were catched
in awater cooled sample holder ( 0 = 7 cm, T » 35 °C)filledwith paraffin oil (Merck, art.
1760).Dependent ontheheight ofthe sampleport, the sampletimevaried from 1-2minat
the top upto 30 - 45 min at the bottom as a result ofthe decreasing spray droplet density.
The sample sizeranged for the same reason from about 1g at the top down to about 0.1 g
at the bottom. The moisture content ofthe droplets was determined using a vacuum-dryer.
Thedropletsdidcoalesceinthe sampleholderto onedroplet athighmoisture contents. This
droplet could be removed with a injection needle. At lower moisture contents the droplets
were too viscous to coalesce, the paraffin oil was then removed by decanting followed by
rinsingwithasmallamount ofpetroleum ether.
Droplet drying kinetics
21
resonance
nozzle
© O r
hot air,
—sieve plate
spray
.^sample ports
heating cables
powder
Figure 2.2 The drying tower
22
Chapter 2
Droplet uniformity was controlled severaltimesineach experiment byvisual observation
of a sample catched with apetri-dishfilledwith paraffin oil, using a stereo-microscope (40
times magnification). Photographs of (partially) dried droplets, and scanning and cryo
scanning electron microscope pictures of dried droplets were made in several experiments.
The aim was to determine if coalescence of droplets in the drying tower occurred and to
identify changes indroplet shape and the presence ofvacuoles. However, as pointed outby
El-Sayed (1987) and El-Sayed et al. (1990), morphological changes are difficult to
determinebythemethodsapplied andtherefore theresultshavetobeinterpreted withcare.
- Maltodextrin
Intheexperimentsthesamemaltodextrinwasused asinthe experimentswiththe suspended
droplets (chapter 2.3.1). The initial moisture content varied from 1- 4 kgH20(kg ds)"l,
andthedryingairtemperaturesfrom 80-150°C.
- Skim-milk
In the experiments the same skim-milk was used as in the experiments with the suspended
droplets (chapter 2.3.1). The initial moisture content varied from 1.5 - 4 kgH/jCXkg ds)"l,
andthedryingairtemperaturewas 110°C.
The drying experiments with skim-milk were, however, seriously disturbed by many
experimental problems. In particular the resonance nozzle clogged up very often (each 1a
10 min) during a drying experiment. In this way it was impossible to measure the drying
kinetics of skim-milk droplets properly. Although it was possible to produce uniform
droplets with initial moisture contents of 2.3 - 4 kgH20(kg ds)"*, this was impossible at
lowermoisturecontents.
2.4 RESULTS AND DISCUSSION
2.4.1. Suspended droplets
- Modelsimulation
Figure 2.3 gives a typical simulation of the drying of a maltodextrin droplet, using an
'average' set of experimental conditions. The characteristic drying time xd (defined as the
time needed to reach cow0/a}wt =0.37) is 3500 s. The characteristic time of heat transfer
zh (defined as the time needed to reach (7^ - Tdt)/\Tg - Td0) = 0.37) is 300 s. As shown
Dropletdryingkinetics
23
infigure 2.3 the constant (water) activity period isvery short (t =0.007rd). At the end of
the constant activity period, the surface water activity decreases very fast (when t = 0.3rd
then aWSUrface = 001 ( t n e equilibrium water activity is zero)) and the droplet temperature
starts to increase rapidly from the wet-bulb temperature to the drying air temperature
(r h =0.09 rd). Consequently the dryingprocesstakes place almost completely inthe falling
(water) activity period, while furthermore in a large part of the drying process the droplet
temperature is at most a few degrees centigrade below the drying air temperature and the
surface water concentration isnearlyinequilibriumwiththemoisturecontent oftheair.
In figure 2.4 the water diffusion coefficient in maltodextrin is given as function of
moisture content and temperature, together with the changes inthe diffusion coefficients in
the droplet centre and at the droplet surface as calculated in the model simulation.
Furthermorethechangeofthe'average'diffusion coefficient isgiven. This'average' diffusion
coefficient is calculated using the average water concentration and droplet temperature as
calculated inthemodel simulation andtherelationfor thediffusion coefficient.
Uw,t
Jw,t
U w,o
J w,max
aw<-)
TH(°C)
^ e n d of constant activity period
1.0
100
0.8-
I
0.6
/
~"^v
l
VV
Y ,—1
0.4-r
0.2-
^ \ r
Q w
^w.t
w,o
u
50
^w,t
Jw.max
^ - v
10
0
i
10
100
1000
Td
10C
r (s)
Figure2.3
Model simulation. The changes in time are shown of the average water concentration,
droplet temperature, drying flux and water activity at the surface. Initial conditions:
cowfi =1.25kgH 2 0(kgds) _1 , ddo=lO'2m,
Tg =102.5 °C, v g =2.5ms - 1 and
// =0kgH2O(kgda)"1. Physical data table 2.2, applying the relation of Furuta et al.
(1984)fortheactivationenergy.Themaximumdryingflux j w max =1.5210 3 kgm'V 1 .
Chapter 2
24
As can seen from figure 2.4 the three 'diffusion coefficient' histories differ strongly asa
result of the water concentration profiles. Dependent on the 'temperature-water
concentration' histories, the diffusion coefficients start with an decrease or increase intime,
tobefollowed byanincreaseand decreaserespectively, andlogically minimumor maximum
values occur. A decreasing diffusion coefficient in the drying droplet as caused by the
decreasing moisture content can partially or completly be compensated by the droplet
temperature increase. Consequently the drying flux during the falling water activity period
decreaseslessasexpected giventhe strong concentration dependence ofthewater diffusion
coefficient atconstant temperature.
- Sensitivityanalysis
The accuracy of drying model predictions are determined by the accuracy of the (measured
or estimated) physical parameters used and by the sensitivity for variations in (initial)
experimental dryingconditions.
Theimportant physical parameters arethewater diffusion coefficient, thewater sorption
isotherm and the external mass and heat transfer coefficients. The values of the water
10
logD(rrrV1)
uu(kgH.O(kgds) )
Figure 2.4
The water diffusion coefficient of maltodextrin as function of water concentration and
temperature, and the calculated centre (— —), surface (
) and average (
)
'diffusion coefficients - water concentration' histories. Initial conditions model simulation
and physical data: seefigure 2.3. • : final value.
Droplet drying kinetics
diffusion coefficients andwater sorption isotherms for maltodextrin aswell asfor skim-milk
as for other (liquid) foods, however, are known only by approximation. In particular the
values ofthewater diffusion coefficients have never been determined experimentally at low
water concentrations (respectively, aw <0.25 kgH20(kgds)~l for skim-milk and <ow <
0.10 kgH20(kg ds)"l for maltodextrin)andathighertemperatures (respectively, T >70°C
for skim-milk and T >45 °C for maltodextrin). Regarding the water sorption isotherm of
maltodextrin, no experimental data are available at temperatures above 45 °C. The relation
for thewater sorption isotherm of skim-milk, asgiven intable 2.1,is derived from sorption
data at ambient temperature and at water concentrations for which crystallisation does not
occur of the lactose present in skim-milk. Therefore the values of the diffusion coefficient
and the water activity at low water concentrations and high temperatures have to be
determined by extrapolation. The external transport coefficients are calculated by the Ranz
andMarshall correlation. Theaccuracy ofthese calculated values islimited and errorsup to
50% can occur. Moreover during dryingthe surface ofthe droplets does not remain smooth
but surface folds appear. Above that the air flow pattern is not well defined in the
experiments, andthe droplets can movealittleup and down. Allthese effects will influence
the external transfer coefficients. Knowledge about the importance of the variations is
therefore needed.
Infigure2.5 the influence isgiven on the residual water concentration for a drying time
of7200soffeasible variations ofthedifferent physical and experimental parameters, for the
examplegiveninfigure2.3.In each analysis only oneparameter wasvaried, whilethe other
parameters remained attheir base-casevalues. Ascan seenfrom figure 2.5 the drying flux is
in particular sensitive to small variations (+/- 20%) in the activation energy values of the
temperature dependence of the diffusion coefficient. This reflects the fact that the mass
transfer is primarily internal 'diffusion' controlled, as shown in the model simulation. The
influence ofvariationsinthewater sorptionisotherm (aw) isnegligible. Thisiscaused bythe
fact that the average moisture content is much higher than the surface water concentration
during alarge part ofthe drying process (seefigure2.3). In the base-case the average and
surface moisture content after 7200 s were respectively, 28 10"2 kgH20(kg ds)~l and 28
10"5 kgH20(kgds)"l. During the falling activity period the drying flux is, by
approximation, proportional with the difference between the average and the surface water
concentration. As a consequence changes in the water sorption isotherm will influence the
drying kinetics only if they result in large changes in the difference between average and
surface moisture content. Changingthe sorption isotherm results invariations ofthe surface
25
26
Chapter2
-1
|m-20-1or-1.
wwo(kgH20 (kgds)-')
0%
-50%
+50%
1.15
i
' 1.25
i
5
1.35
i
R0 (10- 3 m]
5.25
kg.CCg
0.25(kg H20 (kg ds)"1
0.20
-20%
0%
+20%
E o U mor 1 )
T„ C O
0
2.5
5
Vg(ms"1)
a Influenceofvariationsinphysicalparameters.
Figure2.5
b Influenceofvariationsinexperimentalconditions.
Influence of variations in important variables on the residual water concentration. Base
case:seefigure 2.3.Dryingtimeis7200s.
water concentration (14 10"^-42 10"^kgH20(kg ds)~l)that canbeneglected with respect
totheaveragemoisture content.
- Skim-milk
Inthefigures2.6a-ctheexperimental dryingresults atthreedifferent drying air temperatures
(55, 75 and 95 °C) are shown. Ascan seenthe experimental data are scattered (upto about
± 20%), especially at lower water contents (cow <0.3 kgH20(kgds)"l). The differences
between duplicate experiments are of the same order of magnitude. This might be because
duringdryingthe spheresdidnotremainperfectly spherical,but deformed gradually in'dried
currant'likestructures.
The calculated drying kinetics is in good accordance with the experimental results. The
discrepancies between calculated and measured average moisture contents are of the same
magnitudeasthedifferences between duplicateexperiments,no systematicdeviations occur.
Dropletdryingkinetics
27
10
log ^ J :
Utt0
0
-0.5
-1.0-
a
D
D
D ^ ^ :
DDD ~ D f T
-1.5-
-2.0
-i
0
2
4
6
8
1
i
1
1
1
1
1
r-
10 12 14 16
l-x10"3(s)
Experimental conditions: caw0 =4.8kgH 2 0(kgds) ', dd 0 =10 2 m, Tg =55 °C,
vg =0.7ms"1 and H=0.01 kgH 2 0(kgda)"1.
iolog "-,t
n
5D a
D DD
-1.5-
-2.00
—i
2
1
1
4
1
1
6
1
1
1
1
1
1
1
1
1
1
r
8 10 12 14 16
f x10"3(s)
Experimental conditions: iaw0 =4.4kgH 2 0(kgds)~ 1 > dd 0 =10"2 m,
Tg=75°C,
v g =0.7ms"1 and H =0.01kgH 2 0(kgda)"1.
Figure2.6
Dryingkineticsofskim-milk droplets.
:model simulation, physical data table 2.1;
— —:modelsimulation,usingtherelationforthewaterdiffusion coefficient inskim-milk
asgivenby Wijlhuizen etal. (1979).
Chapter2
28
*>logUw.t
-2.0
Figure2.6c
- i — i — i — i — i
0
2
4
6
8
1 — i — r ~
10 12 14 16
tx10"3(s)
Experimental conditions: fii,0 =4.8kgH 2 0(kgds)" 1 , ddfi =10~2 m, Tg =95°C,
v g =0.7ms"1 and H=0.01kgH 2 0(kgda) -1 .
Applying the relation for the diffusion coefficient in skim-milk asgiven byWijlhuizen etal.
(1979) doesnot significantly change the predictions of the experimental drying results. The
difference between the relations for the diffusion coefficient as given by Wijlhuizen et al.
(1979)andFerrarietal.(1989)liesprimarilyinthemethod ofextrapolation to low moisture
content andhightemperaturevalues.
Sano and Keey (1982) found similar experimental and modelling results with respect to
the drying kinetics of skim-milk droplets, although their experimental circumstances were
different: the initial and final moisture contents were 2.33 and 0.30 kgH20(kgds)~l
respectively, theinitialdrop diameterwas2mmandthe drying airtemperature was 100°C.
Moreover they performed experiments at drying air temperatures of 150 °C, investigating
droplet expansion and inflation. Sano and Keey (1982) used the diffusion relation as given
by Wijlhuizen et al. (1979). They found, however, discrepancies between measured and
simulated droplet temperatures. Sano and Keey (1982) give no explanation for this
phenomenon. Droplet temperature measurements as performed a few times during the
experiments showed similar behaviour. Analysis of the simulations revealed that the
observed discrepancies can be overcome by a 30-50 % increase of the external mass and
heat transfer coefficients. This is true for the data published by Sano and Keey (1982) as
Droplet drying kinetics
well asfor our own data. The accuracy ofthe prediction ofthe experimental drying kinetics
isnot influenced bythisincrease,asexpected (seefigure 2.5a).
The irregular shrinkage of the droplets does not cause a systematic deviation from the
calculated dryingkinetics,asexpected. Thiscanbeaconsequence ofthe limited accuracy of
the measurements, but also of the way in which the diffusion coefficients are determined.
The equations as given byWijlhuizen etal. (1979) and Ferrari etal. (1989) areboth based
on drying experiments inwhich a single droplet was dried. These droplets showed irregular
shrinkage also, but this was not taken into account when the diffusion coefficients were
calculated. Asa consequence irregular shrinkage istaken into account in an indirect wayin
thedetermined diffusion coefficients.
- Maltodextrin
The experimental results of drying experiments at four different initial water contents (3.0,
1.86, 1.04 and 0.47 kgH20(kg ds)~l) are shown in the figures 2.7a-d. Detailed results for
thefirststage of a drying experiment (the initial water content was 1.04 kgH20(kgds)"*)
are plotted in figure 2.7e. During the drying process the droplets lost, in an irregular way,
theirperfect spherical shapeand surface folds appeared.
Drying model simulations (not showninfigure2.7)usingthe physical datagiven intable
2.2 andthe relationfor the moisture dependence ofthe activation energy asgiven byFuruta
et al. (1984), showed a systematic underestimation of the drying flux at the highest initial
moisture content (3.0 kgH20(kg ds)"l) and an overestimation of the drying flux at the
lowest initial moisture content (0.47 kgH20(kgds)~l), when compared with the
experimental data. The average discrepancy between experimental and calculated moisture
content was 18 %. As shown, the sensitivity analysis reveals that the drying flux is very
sensitive to variations in the activation energy of the temperature dependence of the
diffusion coefficient. In the model simulations that are shown in the figure 2.7, a modified
relation for the moisture dependence ofthe activation energy isused. This relation isgiven
intable 2.2. The relation was estimated by comparison of the calculated drying curveswith
the experimental data using different relations for the moisture dependence ofthe activation
energy. The relation is modified in such a way that the activation energy is lower at low
moisture contents (lower droplet drying rates) and higher at high moisture contents (higher
droplet dryingrates)compared withtherelation asgivenbyFurutaetal.(1984).
29
Chapter2
30
Ww.t
0.80.6
0.40.2
• moisture content
o temperature
0
0
1
2
4
5
tx10"3(s)
Experimental conditions: a>Wi0 =3.0kgH2O(kgds) \ ddfi =10 2 m, r 4 =97°C,
v g =3.8ms-1 a n d ^ =0.0kgH 2 O(kgda) _1 .
U-t
tx10"3(s)
Experimental conditions: ww0 =1.86kgH20(kgds)_1,rfrf>0 =1°~2 m - 7g=103°C,
vg =2.5ms"1and/f =0.0kgH 2 O(kgda) _1 .
Figure2.7
Drying kinetics of maltodextrin droplets. The change in time is given of the average
moisture content and droplet temperature.
: model simulation, physical data table
2.2,applyingthe'adapted'relationfortheactivationenergy.
Dropletdryingkinetics
31
Ww.t
T d (°C)
tx10_3(s)
Figure2.7c
Experimental conditions: » w>0 =1.04kgH2O(kgds)~\ dd0 = 10~2m, r g =101°C,
\g =2.5ms"1and H=0.0kgH 2 0(kgda)"1.
Ww.t
0.2
T d (°C)
• moisture content
-20
o temperature
0-
4
Figure2.7d
Experimental
0
—r~
conditions:
6
8
tx10_3(s)
cow0 =0.47kgH2O(kgds) ',
Tg =101.5 °C,v g =2.5ms" 1 and// =0.0kgH 2 O(kgdar 1 .
dd0 =0.8610~2 m,
32
Chapter2
A further analysis of the relations used is done: in figure 2.8 the diffusion coefficients as
calculated by both activation energy relations are compared. Besides that the range of
conditions (water concentrations and temperatures) as applied in the diffusion experiments
(Furuta etal. (1984)), is plotted. The diffusion coefficients as calculated from the relations
and asshowninfigure 2.8,differ atmost 6fold. Thelargest difference isat atemperature of
100 °C and moisture content of 0 kgH20(kgds)"l (as expected), that is far outside the
range of the experimental conditions. Comparison of the diffusion coefficient 'histories' as
given in figure 2.4 and the range of experimental conditions reveals that the diffusion
coefficients as used in the drying calculations are mainly based on extrapolations. These
extrapolations are strongly influenced by the accuracy of the estimation of the activation
energy. Given the limited range of temperatures used (25 - 45 °C) in the diffusion
experiments, the estimate cannot be very accurate and consequently the modified relation
results in (calculated) diffusion coefficients which differ not significantly from those
calculated with the relation given byFuruta et al. (1984). The drying kinetics is, however,
influenced significantly. Applying the adjusted relation for the activation energy a good
description ofthe experimental drying kinetics and droplet temperatures is obtained, as can
seen from figure 2.7. The average discrepancy between experimental and calculated
moisturecontentis 10%,instead of 18%.
Td(°C)
100
80
60
40
• moisture content
o temperature
0
Figure2.7e
0.2
0.4
0.6
h20
0.8
1.0
tx10"3(s)
0
Drying kinetics during the first stage of drying. Experimental conditions:
mw o=104kgH 2 0(kgds) _1 ,
_1
77=0.0kgH 2 O(kgda) .
rfrf0=10"2m,
r g =101°C,
v g =2.5ms _ 1
and
33
Droplet drying kinetics
Analysisshowedthat alsoacombination ofincreasingtheexternalheat andmass transfer
coefficients with 30-50% and decreasing theactivation energy at lowwater contents canbe
used to improve the prediction of the drying kinetics. This, however, is not examined in
moredetail.
Another source of error might bethe non-ideal shrinkage behaviour ofthe maltodextrin
droplets,giventheexperimental conditions.Ashasbeen described intheprevious paragraph
thisphenomenon istakenintoaccountinthediffusion coefficient inanindirectway.
10
logD(m 2 s- 1 )
-8
100°c
60°C
20°C
u) w (kgH 2 0(kgds)"')
Figure 2.8
The concentration and temperature dependence of the water diffusion coefficient of
maltodextrin as calculated by two different relations for the moisture dependence of the
activation energy. Physical data table 2.2;
: relation Furuta et al. (1984); — —
'adapted' relation;^ experimental conditions diffusion experiments (Furuta etal. (1984)).
34
Chapter 2
2.4.2 Freefalling droplets
- Modelsimulation
Infigure 2.9theresultsof a simulation ofthedryingofafree falling maltodextrin droplet are
depicted, using an 'average' set of experimental conditions. In the simulation it is assumed
that the drying air temperature and humidity are constant. The characteristic time of the
dryingprocess rd is 1.5 sandthe characteristic timeofheat transfer rhis2s. Consequently
thedryingprocesstakesplaceprimarily at'intermediate'temperatures.Moreover ascanseen
fromfigure 2.9 the mainpart of the drying process inthe drying tower occurs inthe falling
water activity period (aWtSurface < 1). The shift from the constant water activity period
(aw,su>face= 1)t o t n e falling water activity period takes place already at a falling distance of
0.55 m (t =0.25r d ). This transition is reflected also in the temperature curve, the droplet
temperature increases from the wet-bulb temperature (during the constant water activity
period) up till the drying air temperature. During the constant water activity period the
droplet deceleratesveryfastfromtheinitialjet velocitydownto theterminal falling velocity.
The decrease of the drying flux during the constant water activity period is a result of the
decreaseoftheexternalmasstransfer coefficient caused bythedecreaseindropletvelocity.
In figure 2.9a the point on the drying curve is indicated were the droplet temperature
reaches 100°C.Theaverage and surface water concentration arethen 0.4 kgH20(kgds)~l
and 0.009 kgH20(kg ds)~l, respectively. Thecalculated water activitiesbelonging to these
concentrations are 1 and 0.05. Consequently internal boiling can take place, and internal
vapour bubbles can develop, accompanied (eventually) by droplet expansion, surface
ruptures, droplet collapse and vacuole formation (El-Sayed (1987), Wallack (1988), ElSayed etal.(1990), Wallack etal.(1990)). Whether boiling occurs will depend also on the
presence or formation of nuclei. For spontaneous nucleation the droplet temperature must
be at least 10 up to 20 °C above the boiling temperature (Verhey (1973)). Also the
desorption of dissolved gases, caused by the increase in droplet temperature and dissolved
solids concentration can be a factor inbubble formation and droplet expansion (Greenwald
(1980), El-Sayed (1987)). However, the experimental evidence for and knowledge of the
mentioned processes is limited. An increase of the dryingfluxis expected if expansion etc.
occurs, and the drying model will underestimate the drying rate (van der Lijn (1976),
Wijlhuizen et al. (1979), Sano andKeey(1982)).
Dropletdryingkinetics
35
100°C,10s
50°C,5s
- 10°C,1s
2
4
6
falling distance (m)
a Theaveragewaterconcentration,droplettemperatureanddryingtimeasfunction ofthefallingdistance.
Jw.t
v
d,t
n
. .
Qw(-)
constant activity period
2
4
6
falling distance lm)
b Thedryingflux,dropletvelocityandwateractivityatthesurfaceasfunction ofthefallingdistance.
Figure2.9
Model simulation. Initial conditions: <yw0=2.0kgH 2 O(kgds) _1 ,
dd0=200faa,
r g =120°C, v d>0 =10ms _1 , v g =0.2ms _ 1 and // =0.025kgH2O(kgda)_1. Physical
data table 2.2, applying the 'adapted' relation for the activation energy. The maximum
dryingfluxj w
max =2.8110"
2
kgm'V 1 .
36
Chapter2
- Sensitivityanalysis
Asensitivityanalysissimilarasdescribedfor the suspended droplets(see chapter 2.4.1) was
performed. In figure 2.10 the influence on the residual water concentration of parameter
variations around their base-case values is shown at a falling distance of 2.6 m (= sample
port 4), for the example given in figure 2.9. The results are similar as found for the
suspended droplets, but there are two exceptions. Firstly, the influence of changes in the
activation energy of the diffusion coefficient is for the free falling droplets smaller than for
the suspended droplets. Thisiscaused bythe fact that the Biot-number for masstransfer of
the suspended droplets is about one order of magnitude larger than that for the free falling
droplets (at the same temperature) and consequently the drying process of the suspended
droplets is more internal mass transfer controlled. However, also in the case of free falling
droplets the Biot number for mass transfer is larger than 1. Furthermore the residual
moisturecontent isverysensitivetothevalue ofthedrag coefficient Cd(or, inotherwords,
to the estimation of the droplet velocity), as expected. A 50% change in Cd results in an
about 25 % change in the terminal falling velocity and in an about 35 % change in the
residence time ofthe dropletsbefore arriving at sample port 4. The terminal falling velocity
has an average value of about 0.5 ms~l for the base-case and the residence time is 3.25 s.
Theinfluence ofavariation ofthedrying airvelocity islimited because the terminal droplet
velocityisabout 2.5timestheairvelocity.
- Dryingequipment
Resonancenozzle
Infigure2.11 thebreak-up ofajet in individual droplets and the spray-formation is shown.
As can be seen a dropletjet is formed first and after that a spray is formed, caused by the
electrostatic repulsion of the droplets (Crowley (1968)). The measured droplet diameters
were in accordance with the diameters as calculated from equation 2.14. The average
discrepancybetweenmeasured and calculated diametersis 3%.
Electrode voltages above 150 V were not useful because higher voltages resulted in a
toowidedroplet spray.Theresultant lowspraydroplet densitiesledupto too long sampling
times (> 0.5 h) at the bottom of the drying tower. Moreover a considerable part of the
dropletsthen stucktothetowerwall.
Dropletdryingkinetics
-50%
37
0%
50%
1
95
100
R 0 (um)
105
1
k a (ms"1, Jm~-V °c- )
0%
50%
-50%
-0.55
052
A,
\
0.49
0.46
0.43
\
K\
r^
°w
0.40
0.37
034
0.31
-0 28-
!
1
Q
w
" ols^
022
-0.19
-0.16
u»
(kgH 2 0(kgds)" 1 )
-0.13
-0.10
0.07
0.04
0.01
-20%
0%
20%
1
Ec (Jmol" )
-50%
0%
50%
Q„(-)
a Influenceofvariationsinphysicalparameters.
Figure2.10
1.9
2.0
2.1
uwo(kgH20(kgds)-1)
b Influence ofvariationsinexperimentalconditions.
Influence ofchangesin important variables onthe residual water concentration. Baseose
values: see figure 2.9. Falling distance is 2.6 m. The variations in the external transfer
coefficients relatetovariationsinthevariablepartsoftheequations2.5and2.7.
Chapter2
38
Figure2.11
Break-upandchargingofthelaminarjet.
Dryingtower
The axial temperature gradients in an 'empty' drying tower were 5 °C at most. Radial
velocity differences of about 0.1 ms'l were measured, with the highest values at the top of
the tower. The influence ofthesevariations on the residual moisture content is limited, see
thepreceedingparagraph andfigure2.10b.
Dryingkinetics
Itturned out that itwasverydifficult to obtainthe sameexperimental conditions in different
experiments. Furthermore water concentrations in duplicate measurements showed often a
considerable scatter of up to 25 % (see also figure 2.13). Separate experiments
Dropletdryingkinetics
39
o
*>
o
->
Photographofasampleofdrieddroplets.
»-.-•• « - ••J*4!'5?"!-* * i i * •#
•A
» < • i fh f « 4 JT , |
•f
' T *» *r
" * ' •r
-jf $ 4 '
Scanningelectronmicroscopephotographofafewdrieddroplets.
Figure2.12
Photographs
of
dried
maltodextrin
1
droplets.
Experimental
GVo =1.5kgH 2 0(kgds)~ , ddfi =204,umandTg =150 °C.
conditions:
Chapter 2
40
Figure 2.12c
Cryo scanningelectron microscope photograph ofthe interior ofadried droplet.
showed that this scatter can not be explained by the inaccuracy of the applied moisture
determinationmethodonly.
- Drying kinetics of maltodextrindroplets
In figure 2.12 three characteristic photographs are given of dried droplets catched at the
bottom ofthetower. The drying air temperature was 150 °C. As can seen from thefigures
2.12aandb,theresonance nozzle iscapable of producing uniform droplets and coalescence
of the drops in the tower was absent. The photographs indicate that during the drying
process the maltodextrin droplets remained more or less 'spherical', but with a 'crater' like
surface. El-Sayed (1987),Wallack (1988),El-Sayed etal.(1990) and Wallack etal.(1990)
also found that free falling maltodextrin droplets were 'spherical', however, their droplets
contained one or more (water vapour) bubbles and expansion of the droplets took place.
This is not found in the experiments reported here, see figure 2.12c. The drying air
temperatures (180-240 °C)used inthe experiments ofEl-Sayed (1987), Wallack (1988),ElSayed et al. (1990) and Wallack etal. (1990) were much higher than used here (150 °C);
conditionswhichfavor theonset ofnucleation and expansion inthe experiments ofEl-Sayed
Dropletdryingkinetics
41
(1987), Wallack (1988), El-Sayed eta!.(1990) and Wallack et al. (1990). The appearance
of their (partly) dried droplets is, however, similar to that of the droplets shown in figure
2.12b. This appearance, they argue, is probable an artefact due to the collapse of the
expanded droplets caused by the strong fall in temperature when the partly dried droplets
were catched in liquid nitrogen. In our experiments the removal of the samples from the
drying tower caused a similar strong temperature fall (although less than in their
experiments), but in our experiments the water concentration of the droplets is lower (they
are almost dry) and consequently a more rigid structure is present, perhaps preventing
collapse. Verhey (1972) spray-dried different liquid foods, including maltodextrin solutions,
using process conditions which prevent vacuole (vapour bubble) formation. Electron
microscope pictures of the produced powder particles show that the appearance of these
droplets is similar to that from this research work. Consequently, although vacuole
formation and droplet expansion cannot be excluded to have happened in the experiments
reported here at Tg = 150°C, the experimental evidence for these phenomena direct to its
absence. In the experiments performed at drying air temperatures below 150 °C, it is even
morelikelythatvacuoleformation andbubbleexpansionwasabsent.
u) w (kgH 2 0(kgds)- 1
1.6
4
6
falling distance (m)
Experimental conditions: awQ = 1.6kgH20(kgds)~\ dd0=l5%fim, r g =100°C and
charging voltage=70-80V. O, • , A:resultsof3 experimentalruns.
Figure2.13
Dryingkineticsofmaltodextrindroplets.
: modelsimulation;physicaldatatable2.2,
applyingtheadaptedrelationfortheactivationenergy.
Chapter2
42
uJkgHzOfkgds) -1
5
4
6
falling distance (m;
Figure2.13b Experimental conditions: a>w0=4.5kgH 2 0(kgds) , dd0=2l0fjm,
r g = 8 0 ° C and
charging voltage=100-130V. O, • , A:resultsof3 experimentalruns.
uw(kgH20(kgdsr1
1.6
k
6
falling distance (m)
Figure2.13c
Experimental conditions: mwfi =1.6kgH20(kgds)_1, rfrfj0=204/an, T g =130°C and
charging voltage=110-130V.Theduplicateresultsareshownof 1 experimentalrun.
Droplet drying kinetics
In figure 2.13 typical drying results are shown at a broad range of experimental
conditions. In the model simulations it was assumed that the drying air temperature and
humidity are constant. As can be seen, the experimental results show sometimes a
considerable scatter, as mentioned before. In all experiments there exists a large systematic
discrepancy between experimental data and model predictions. The drying model
overestimates the drying rate in all cases. The discrepancies can not be explained by
experimentalinaccuracies.
Feasible explanations for this large discrepancy are: the erroneous estimation of the
residencetimeofthedropletsandtheassumptioninthemodel simulationsthatthedryingair
temperature and humidity are constant in the air around the droplets. Variations in other
physical and experimental parameters can not explainthisdifference, giventhe results ofthe
sensitivityanalysis(seefigure2.10).
The momentum balance (equation 2.8) used for the prediction of the droplet residence
time is in principle only valid inthe 'ideal' case of a 'free' falling rigid sphere. In the drying
towertheseconditionsarenotfulfilled completely:
- Thedroplets are charged and consequently electrical attraction and repulsion forces (ofan
unknown size)playarole(Crowley(1968),Alexander(1983)).
- After thebreak-up oftheliquidjet issuing from the resonance nozzle, a stream of droplets
existsover a short distance, merging inadense spray. Thefalling velocity ofthedropletsin
the droplet stream is larger than calculated by the impulse balance (Arrowsmith and Foster
(1973))andinthedensespraythereversesituationexists.
- At low water concentrations the droplets lose their perfect spherical shape (see figure
2.12) causing an increase of the friction coefficient, resulting in a lower terminal falling
velocity.
- In the drying tower there exists a (limited) airvelocity profile, leading to a residence time
distribution ofthedroplets.
Theexact consequences ofthesedeviations from the 'ideal' case areunknown, and have
to be evaluated by setting-up droplet residence time distribution experiments. This kind of
experimentshasnotbeen performed.
The assumption of constant drying air temperature is examined in a few experiments by
measuring the axial and radial temperature profiles in the drying tower, using different
charging voltages. In this way the angle of the spray-cone was varied. The temperature
profiles were measured with a thermocouple, in such a way that the attachment of drying
dropletswasavoided.It appeared tobeverydifficult toobtainreproducibleresultsatthe
first sample port (falling distance = 0.33 m), because minor changes in the position of the
thermocouple resulted insignificant temperaturechanges.
43
Chapter 2
44
f a l l i n g distance(m) tower1centre
(106) (107)
0.3-
(82)
E3 EH / f6TI
/i
.
1.8
m
(73)
i
(94)
2.6
\M
-Spray-cone
I
(150 V ) .
i
^Sp^ay-cone
(70V)|
.
4.6
'
/
6.0
Figure 2.14
I
I
/
(99)
Eo]
i
70V
charging voltage :
charging voltage=150V
Axial and radial air temperature profiles in the drying tower. Experimental conditions:
a>wfi =2 . 3 k g H 2 0 ( k g d s ) _ 1 , dd 0 =204 ^m and Tg =110 °C.
Theresultsfor two 'extreme'voltages (70 Vand 150V)aredepicted infigure2.14. The
'average' drying air temperature was 110°C. As can seen from figure 2.14 strong axial and
radial drying air temperature profiles especially exist at the top of the tower. The profiles
depend onthe applied chargingvoltage. Inboth casesthere isa small spray-cone at the top
in which the air temperature (about 70 °C) is considerable lower than the 'average'
temperature. At a charging voltage of 70 V the air temperature in the tower centre (about
100 °C) at a falling distance of 4.6 m (sample port 6) is still lower than the 'average'
temperature. Theindicated spray-cones arebased onthe measurement of spray diameters at
different sample ports. Air humidity profiles are not measured, but these will exist also in
connection with the air temperature profiles. Droplet drying experiments indicate that
applying an 'extreme' charging voltage such as 150 V, results in lower average residual
moisture contents than at lower voltages, as expected. However, also in that case the
discrepancy between model simulations, assuming constant air temperature and humidity,
andexperimentsremained.Furthermorethedifferences between duplicateexperimentsarein
the sameorderofmagnitudeasbetweenverydifferent chargingvoltages.
Dropletdryingkinetics
45
uw(kg H£{kgds)" 1 )
2.zl
1.8
4
6
falling distance(m)
The average water concentration as function of the falling distance. Experimental
conditions:
a>w0=2.3kgH 2 0(kgds)~\
rfrf0=204/an,
r g =110°C
and
charging voltage=110V
Tg(°0
120
drying air temperature
100
80
604020
o : charging voltage = 70V
7 : charging voltage =150V
0 0
4
6
falling distance (m
Airtemperaturesatthecentreofthedryingtower.Experimental conditions:seefigure2.14
Figure2.15
Drying kinetics andairtemperatures.
-: 'spray' model simulation; — —:'ideal'
model simulation; physical data table 2.2, applying theadapted relation forthe activation
energy.Thevaluesatthedrawn linesindicatethespraydiameters(m)atafalling distance
of4.6m(sampleport6).
46
Chapter 2
To examinethe consequences of the existence of temperature and humidity profiles for the
predicted droplet dryingkinetics,the'ideal'dryingmodelwasadapted. Intheadapted 'spray'
dryingmodeltwo important assumptionsweremade:the drying process isadiabatic and the
fraction ofthedrying airentrained inthe spray after acertain falling distance isequal to the
square of the ratio of the diameter of the spray at that distance and the diameter of the
dryingtower.New'fresh' dryingairentrained inthesprayatagivenfalling distanceisideally
mixed up with the air already present in the spray. The change of air temperature and
humidity inside the spray is determined by the heat and mass transferred to and from the
droplets,respectively. Theheattransferfromthe dryingtower wallisneglected, moreoverit
is assumed that no droplets stick to the tower wall and that the droplets are evenly
distributed in space. This latter assumption is certainly not valid. During the spray diameter
measurements itwas seenthat thedroplet densitygradually decreasesfrom thetower centre
to the edge of the spray, indicating that in all cases a kind of spray 'core' exists within the
spray itself with a diameter of about 20-30 cm at a falling distance of 4.6 m. In figure 2.15
the results of simulations using the 'spray' drying model are compared with experimental
moisture contents and temperatures, and with a 'ideal'drying model simulation. Ascan seen
thedroplet dryingkineticsand airtemperature areinfluenced stronglybythe spray diameter.
A 'reasonable' agreement is found when in the simulation a spray-diameter of 20 cm at a
falling distance of 4.6 misused, corresponding with the diameter of the 'inner' spray core.
Although still (considerable) discrepancies exist between measured and calculated drying
kinetics and air temperatures, the results show that an appropriate description of the sprayairmixingpatternisaprerequisitefor asuccessful predictionofthedroplet dryingkinetics.
2.5 CONCLUSIONS
The change intime of the average moisture content and temperature of suspended droplets
canbe predicted bythe droplet drying kinetics model. The approach adopted inthis part of
the study of using independent measured physical constants, and adjusting them, if
necessary, within the existing uncertainty limitsto satisfy the results of drying experiments,
leadstomodelswhichcanused for designor optimisation ofthedryingprocess.
The drying kinetics of equally sized free falling droplets could not be predicted. In all
cases the drying rate was overestimated. An important reason is that the drying air
conditionswithin the droplet spray did differ strongly from the surrounding drying air. This
wasnot expected giventhelow'average'droplet densities, ascomparedwithpractical spraydryers, used in the experiments. Consequently, drying experiments aimed at verifying the
Droplet drying kinetics
droplet kinetics model under spray-drying conditions, have to designed in such way that
sprayformation isavoided.Moreover drying kinetics calculationsfor spray-dryers which do
not takeintoaccounttheexistenceofsprays, areofverylimitedvalue.
ACKNOWLEDGEMENTS
The author thanks B.L. Gundlach, G. Ferrari, J.H. Hunik, H. Bouma, E.H.W. Engbersen,
B.H.Hoefman, B.Lequay, C.Lodder, M.W. Reij, A.A.C.M.Rutten, C.G.P.H. Schroenand
P.H.H. Timmermansfor theircontributionstothisresearch.
47
Chapter3
INACTIVATION OF a -AMYLASE DURING DRYING
3.1 INTRODUCTION
This chapter describes the applied inactivation kinetics model and the set-up and results of
the inactivation and drying experiments. The drying kinetics model has been described in
chapter 2. The experimental inactivation data are compared with simultaneous drying and
inactivation model simulations. The experiments with the suspended droplets (dd «lcm)
and those with the free falling droplets (<i d «0.02cm) are discussed separately. Two
different a-amylasesareused, because ofthe different characteristic times ofthetwo drying
processes, 3500 sand 1.5 s,respectively. Athermostable a-amylaseisused inthe suspended
droplets experiments and a thermo-unstable a-amylase in the free falling droplets
experiments. Maltodextrin isused as support material in all experiments. The temperatures
used in the suspended droplets experiments are higher and the range of initial water
concentrations iswiderthan applied inthe enzyme inactivation experiments reported before
in literature. Inactivation experiments using free falling droplets are not described in
literature.
3.2 THEORETICAL MODEL
Theinactivation of enzymes can often be described as afirstorder reaction. The integrated
equationis:
In
CM
C.(0)
=- * . /
whereCe istheconcentration active enzyme, t isthereaction timeand ke isthe inactivation
constant.
The inactivation constant ke depends on temperature and water concentration. In
literature (Kerkhof and Schoeber (1974), Wijlhuizen et al. (1979), Luyben et al. (1982),
(3.1)
50
Chapter 3
Liou (1982) and Zimmerman (1987)) several models are used to describe this dependence.
Thesemodelsareallbased onanArrhenius-type equation.
:
kx exp
.Es.
(3.2)
RT
where kx isthepre-exponentialfactor, Ea isthe activation energy, R isthegeneral gaslaw
constant, and T isthe absolute temperature. Thevalues of Ea and kx can be obtained by
linearregression ofInke vsl/T. Noneoftherelations inliterature arebased on fundamental
insights into the enzyme inactivation mechanism at different water contents. In this study
alsoamathematical descriptionisusedwithouttheoretical justification.
Themoisturedependence of Ea and Ink^ isdescribed bythenexttwoequations:
Ea=Ea0+a(cow)
(3.3)
ln*00 = l n * o o 0 + c ( o j
(3.4)
where oiw is the moisture content, a,b,c and d are fitting parameters, and subscript 0
denotethevalueofaparameter atzeromoisture content.
The parameters a,b,c,d,Ea0
and lnA^o are determined by a non-linear optimisation
programbased ontheDownhill simplexmethod (Pressetal.(1989)).The sumof squares of
the relative error between measured and calculated inactivation constants is used as
optimisation criterion.
The residual enzyme activity during drying is calculated by combining the inactivation
kinetics model and the droplet drying kinetics model. The calculation method is shown in
figure 3.1. The drying kinetics model calculates the moisture concentration profiles in the
droplet andthedroplet temperature ateachtimestep.Theinactivation model calculates then
thedifferent inactivation constantsasfunction ofthe droplet radius, andtheresulting change
inenzymeactivity. Theoverall residual enzymeactivityisdetermined byintegration overthe
dropletradius.
Inactivationofa-amylase duringdrying
51
|TARJ)
- t n e w = t ' o l d+
A t
\
DRYING KINETICS MODEL
-Td=droplet temperature (no profile)
i
^-Cw(r)=water concentration profile
INACTIVATION KINETICS MODEL
i
/k e (r)=inactivation constant profile
i
ST
1 ORDER REACTIONx A t
i
v
RQ(r)=residual enzyme activity profile
I
INTEGRATION OVER THE RADIUS
AVERAGE RESIDUAL ENZYME ACTIVITY
yes f
<
»•
new
final
(STOP)
Figure3.1
Calculationoftheresidualenzymeactivityduringdrying.
Chapter3
52
3.3 MATERIALS AND METHODS
3,3.1 Inactivation kinetics experiments
3.3.1.1 Thermostable
a-amylase
The enzyme used was a commercial thermostable a-amylase (Maxamyl, Gist-brocades nv.)
from Bacillus licheniformis. The experiments were performed with a model system,
consisting of a concentrated solution ofMaxamyl, maltodextrin (MOR-SWEET 01921, D.E.
20-22, CPC), water (demineralised), CaCl2.2H 2 0 (Merck) and NaOH (Merck). CaCl 2 was
added to increase the heat stability of the a-amylase (Fogarty (1983), Violet and Meunier
(1989)). The pH of the model system was 5.5. During the preparation of the samples for the
inactivation experiments, the pH of the model system decreased as a result of non-enzymatic
breakdown reactions of the sugars present in the maltodextrin (Feather and Harris (1973)).
Just that amount of NaOH was added to obtain a pH of the samples of 5.5 before the
inactivation experiments were performed. In the preparation procedure the enzyme activity
did not change.
The standard enzyme solution was: maltodextrin {mm = 0.35 mass fraction), water
(demineralised, mw = 0.65 mass fraction), CaCl2 (1 mM CaCl2(kg maltodextrin)" 1 ) and
Maxamyl (5 10~4 ml Maxamyl(kg maltodextrin)"1). The pH of the solution was adjusted
with 0.01 N NaOH. In the experiments inactivation cells were used (Liou (1982)). The
inactivation cells (see figure 3.2) consisted of two sections, with the enzyme solution in
between. Low initial water concentrations were obtained by adjusting the water content of
the standard solution by pre-drying to the desired moisture content. For pre-drying the
bottom section was placed in a drying stove at 70 °C and reduced pressure. After pre-drying
the cellswere stored for 24 h in a refrigerator to equilibrate the moisture concentration.
layer with enzymeFigure3.2
Inactivationcell(Liou(1982)).
1cm
Inactivation of a-amylase during,drying
Usually 8inactivation cellswereused, withtwo ofthem serving asreference samples. The6
otherswereimmersedinathermostated (+/-0.2 °C)glycerolbathfor different timeperiods.
Thetimefor 99%temperature equilibration within the inactivation cellscanbe estimated to
be 150 seconds. After the heat treatment the cells were cooled in melting ice. The treated
samples were then rehydrated to obtain the standard enzyme solution (mw = 0.65 mass
fraction). Next the a-amylase activity of the treated samples was measured and compared
with the a-amylase activity of the reference cells. In this way the change in the enzymatic
activitywithtimecouldbefollowed atagiventemperature andwater content.
The a-amylase activity was determined with a slightly modified Phadebas amylase test
(Pharmacia Diagnostics AB, Uppsala, Sweden). Instead of distilled water a 10 mM Namaleatebuffer with 50ppmCa^"1"wasused. ThepHoftheassaywas6.5. Samplesof 100ul
ofthe standard solution were used inthe analysis. Alinear relation was found between the
enzyme concentrations as used in the experiments and the measured a-amylase activity in
the presence of maltodextrin. The accuracy of the analysis as determined from duplicated
experimentswas5%.
In the experiments performed, the water content varied between 1.86 (= 0.65 on total
basis)and0.09 kgH20(kg ds)"1. andthetemperaturebetween 100°Cand 130°C.
3.3.1.2 Thermo-unstable a-amylase
A commercial thermo-unstable a-amylase (Fungamyl, Novo Nordisk) from Aspergillus
Oryzaewasused. Ingeneralthesamematerialsandmethodswereused asinthe inactivation
experimentswiththethermostable a-amylase. Thedifferences were:themassfractionwater
inthe standard enzymesolutionwas0.70, theinitialpHofthe standard solutionwas6.5,the
amount ofaddedFungamyl solutionwas2 10~4ml(kgmaltodextrin)"!, thepre-drying ofthe
enzyme solutions was performed at 50 °C and a water bath was used. The time for 99%
temperature equilibration within the inactivation cells is 5 s in the water bath. The water
content varied between 0.11 and 2.33 kgH20(kgds) _1 , and the temperature between 75
and 100 °C.
53
54
Chapter 3
3.3.2 Drying experiments
3.3.2.1 Suspended droplets
Themostable a-amylase (Maxamyl) was used in the suspended droplet experiments. The
enzymeinactivation rateandthedryingkineticsweredetermined simultaneously. Thedrying
apparatus and the determination ofthe drying kinetics is described in more detail in chapter
2.3.1. Thecomposition ofthe dry solids ofthe droplets equaled the standard solution used
intheinactivation experiments, exceptthatthe amount ofadded Maxamyl was increased 10
fold inorder to have a measurable amount of enzyme activity after rehydration of the dried
droplets. The droplets were adjusted to pH 5.5 with 0.01N NaOH before the drying
experiments were performed. The droplets werejellified with agar (Merck, 2.0 % on total
basis). The dropletswere produced byusing aperspex mouldwith a diameter of 1cm. For
drying experimentswithlowinitialwater contentsthedropletswere pre-dried at 70°C. Ina
drying experiment about 10droplets were dried simultaneously. At different times a droplet
was removed andthewater concentration and residual enzyme activity were determined. In
each experiment two droplets were not dried but used as reference samples. The water
content ofthe dried droplets was determined by weighing the droplets before and after the
drying experiment. For the determination of the residual a-amylase activity the dried
droplets were rehydrated again by boiling (10 minutes) in a concentrated maltodextrin
solution (mw =0.49, CaCl2= 90 ppm). After that the water content was adjusted to 65 %
on total basis. The enzyme activity inthis solution was measured inthe sameway as in the
inactivation kineticsexperiments. Theresolvingprocedure andtheboiling stepdidnotgivea
significant reduction in enzyme activity. The accuracy of the measuring procedure of the
enzymeactivity asdeterminedfromduplicated experimentswas 10 %.
The initial water content varied between 3.0 and 0.47 kgH20(kgds)~l in the drying
experiments. Thetemperature ofthe drying airvaried between 97 and 105±0.5 °C and the
airvelocitywas2.5 +0.5m/s.
3.3.2.2 Freefalling droplets
Thethermo-unstablea-amylase (Fungamyl) wasused inthefreefalling droplet experiments.
The experiments were performed in a drying tower as described in chapter 2.3.2.1. In the
tower equally sized (uniform) droplets can be dried at constant external drying conditions.
Thedry solids composition ofthe dropletswasthe same as used inthe inactivation kinetics
Inactivation of a-amylase during drying
experiments. The drying kinetics was determined using the methods as described in chapter
2.3.2.2. The residual enzyme activity of the droplets was measured after rehydration to a
water content of0.70 kgH20(kgtotal)"1. The amount ofwater to be added was based on
the determination of the water content of the droplets before rehydration, using the same
sample. The enzyme activity was measured in the same way as in the inactivation kinetics
experiments.
In the drying experiments the initial moisture content and droplet diameter were 1.7
kgH20(kgds) _1 and 204 um, respectively. The temperature of the drying air varied
between 110and 150°C.
3.4. RESULTS AND DISCUSSION
3.4.1 Inactivation kinetics experiments
Theresults oftheinactivation kinetics experiments aregiven inthe figures 3.3 and 3.4. The
measured and calculated inactivation constants ke for thethermostable andthermo-unstable
a-amylase aregiveninthetables3.1 and3.2,respectively. Themoisturedependencies ofthe
estimated Ea and lnA^ values aregiveninthe figures 3.5 and 3.6. Theinactivation constant
data arefittedto the inactivation kinetics model asgiven bythe equations 3.2, 3.3 and 3.4.
The obtained parameter values are given intable 3.3. The drawn curves in thefigures3.4,
3.5, 3.6 and the calculated ke values in the tables 3.1 and 3.2 are calculated with the
estimated parametervaluesandtheequations 3.2, 3.3 and 3.4.
The characteristic times oftheinactivation experiments rr (defined as: rr =k~1) are at
least 5timesthetimeneeded for 99%temperature equilibration withinthe inactivation cells.
Consequently it can be assumed that on the time scale of the inactivation kinetics
experiments, the temperature within the inactivation cells equals the temperature of the
water orglycerolbath.
Fromfigure3.3 it canbeconcluded that thethermal inactivation ofboth ot-amylasescan
be described by afirst order reaction. The experimental results, as shown in thefigure3.4,
are fully in agreement with the general assumption that the heat stability of an enzyme
increasesatlower moisturecontents.
55
Chapter 3
56
ln(Cein/Ce(o))l-)
0
O
a
a
o
3
T=110°C
T=115°C
T=120°C
T=125°C
4
tx10"3(s)
Thermostable a-amylase, ww =0.45kgH 2 O(kgds) '.
ln(C e (t)/C e (o))(-)
O
o
D
-|
0
0.2 0.4
0.6 0.8
1
1
1
T= 90° C
T= 95° C
T= 100°C
,
1.2
1
!
1-
1.4
tx10" 3 (s)
Thermo-unstable a-amylase, a>w =0.18kgH 2 O(kgds) 1.
Figure 3.3
The residual a-amylase activity as function oftime at different temperatures and one water
content.
: best fit.
Inactivation ofa-amylaseduringdrying
57
In k e ( S )
-6.4-
-6.8-7.2-
-7.6
-8.0
-8.4
-8.8-1
-9.2
-9.6
T
'
0.00248
1
'
1
'
1
'
1
'
1
0.00252 0.00256 0.00260 0.00264 0.00268
l / T (K"1)
Thermostable a - a m y l a s e .
I ' I ' I ' I ' I ' I ' l ' I
0.00268 0.00272 0.00276 0.00280
0.00284
0.00288
l/T (K~1)
Thermo-unstablea-amylase
Figure3.4
Arrhenius plots of the inactivation constant ke at different temperatures and water
concentrations.
valuesfromtable3.3.
:calculated bythe inactivation kinetics model using the parameter
58
Chapter3
Table3.1 Inactivationconstantske ofthethermostablea-amylase.
a>w
kg^OCkgds)1.86
1.08
0.45
0.21
0.09
T
1
keV (measured)
4
ke (calculated)
°C
10" s
lO^s
100.3
1.6
1.7
105.5
7.7
7.9
107.7
14
15
98.2
1.0
0.81
103.6
1.9
2.1
107.1
3.2
3.7
111.1
8.4
7.1
110.0
3.1
2.2
115.3
3.8
3.9
120.0
5.9
6.4
124.9
12
10
115.3
3.3
2.9
120.2
5.0
4.6
125.3
7.2
7.4
130.3
14
11
105.4
1.0
1.0
110.3
1.9
1.6
115.2
2.3
2.6
120.5
3.7
4.2
1)theaverageoftheinexperiment 95%confidence intervalis23%.
The experimental results found by Liou (1982) indicate that the heat stability shows an
optimum for the enzymelipoxygenase at awater content of around 0.35 kgH20(kg ds)-*,
whileit decreases again at lower water concentrations. This certainly is not the case for the
enzymes used in this study, given the range of water concentrations and temperatures
studied.
The Ea and l n ^ value decrease at lower water contents for both enzymes, similar
results arefound inliterature (Daemen(1981),Liou (1982),Yamamotoetal.(1985, 1992),
Zimmermann(1987)). Theestimated Ea valuesare inthe samerange asfound inliterature.
As a result of the decrease of Ea the temperature sensitivity of the enzyme inactivation
decreaseswith decreasing moisture content. Theaccuracy ofthe Ea and Ink„ values ofthe
thermo-unstable a-amylase, however, isverylimited. Theinactivation constantsat acertain
Inactivationofa-amylaseduringdrying
59
Table3.2 Inactivationconstantske ofthethermo-unstablea-amylase.
0)w
kgH^OCkgds)"
2.33
0.82
0.43
0.18
0.11
1
T
£ c l> 2 ) (measured)
ke (calculated)
°C
HHs
HHs
75
3.7
2.6
85
20
33
75
0.19
0.25
80
3.9
2.3
85
40
20
85
1.9
2.5
90
28
18
90
1.4
0.84
95
5.8
4.8
100
19
26
85
0.55
0.027
95
6.1
0.80
1)thevaluesgivenaretheaverageofatleasttwoexperiments.
2)theaverageofthebetweenexperiment 95%confidence intervalis70%.
moisture content were measured at two or three different temperatures only and in a small
temperature range (10°Cat maximum).Furthermore the estimated Ea and lnA:^ values are
strongly correlated, insuch awaythatlowand high valuesfor Ea correspond withlowand
highvaluesfor Inkx, respectively.
The estimated parameter values given in table 3.3 must be interpreted with caution,
because of the correlation between the different parameters. The moisture and temperature
dependence oftheinactivation constants oftheenzymescanbedescribed bydifferent setsof
fitting parameters with almost the same value for the applied optimisation criterion. This is
caused by the fact that the number of experimental data is small (19 and 12, respectively)
comparedwiththenumberoffittingparameters(6).Extrapolation oftheresultsto higher or
lowertemperaturestherefore mustbedonewithgreatcare.
Theinactivation kineticsmodelgivesa good description oftheexperimental data ofthe
thermostable a-amylase. The average discrepancy between measured values and model
predictions of ke is 13%. Also the water concentration dependencies of Ea and \nkx are
describedwell.
Chapter 3
60
400-
Inkjs" 1 )
200-
300
150-
200-
100-
100
50-
E o x10" 3 (Jmor 1 )
' — i — • — i — ' — i — ' — i — ' — i — ' — i — ' — i
0
0.4
0.8
1.2
1.6
2.0
0
2.4 2.6
0.4
0.8
1.2
2.0
2.4
2.6
b \nkx dependency.
a Ea dependency.
Figure 3.5
1.6
u (kg H,0 (kg ds)"1)
u (kg HO (kg ds)"')
Thewater concentration dependencies of Ea and lnfc^ ofthethermostable a-amylase.
D: calculated from measured inactivation data;
; calculated by the inactivation
kinetics model using theparametervaluesfrom table 3.3.
E a x10" 3 (Jmof 1 )
600-i
Ink.ls" 1 )
200n
n
150
400
100
200
50
0
0.4
0.8
1.2
16
2.0
2.4
2.6
0
0.4
0.8
ui (kg H.O (kg ds)"1)
Figure 3.6
1.6
2.0
2.4
2.6
u u ( k g H 2 0 (kgds)" 1 )
2
a Ea dependency.
1.2
b \nk„ dependency.
The water concentration dependencies of Ea and lnt^, of the thermo-unstable a-amylase.
• : calculated from measured inactivation data;
kinetics model usingtheparametervaluesfrom table3.3.
; calculated by the inactivation
Inactivationofa-amylase duringdrying
61
Table3.3 Parametervaluesintheinactivationkineticsmodel.
Parameter
Value
Value
thermostable a-amylase
thermo-unstable a-amylase
a,0
117.3
245.1
a
71.5
221.6
b
1.88
0.26
Intoo.o
28.1
44.8
c
23.7
108.7
d
1.86
0.21
E
The description of the experimental data of the thermo-unstable a-amylase by the
inactivation kinetics model is not very satisfactory. The average discrepancy between
experimental inactivation constants and model predictions is 50 %. It is not expected,
however, that other empirical relations, with the same number of parameters, improve the
description ofthe experimental data significantly. Ascanbe seen from figure 3.4b there isa
tendency to underestimate the inactivation rate of the thermo-unstable a-amylase at higher
temperatures. Consequently itisexpected that theinactivation ratewillbeunderestimated at
the temperatures used in the drying experiments. Moreover, as will be shown in paragraph
3.4.2.2, the inactivation takes place at 'intermediate' moisture contents (about 0.4
kgH20(kg ds)"l). In order to improve the description of the inactivation constants in
particular at intermediate moisture contents, the parameters of the inactivation model are
estimated againbyomittingtheinactivation constants obtained at amoisturecontent of2.33
kgH20(kg ds)~l. Furthermore it was assumed that the relation between Ea and ln&„„ and
thewater concentration islinear and consequently the fitting parameters b and d are equal
to 1. The estimated parameter values are given in table 3.4. As shown in figure 3.7 the
description of the inactivation constants at intermediate moisture contents has been
improved, as anticipated. The average discrepancy between model predictions and
experimental inactivation constants, used in the parameter estimation, is 34 % instead of
47%bythenon-linearmodel.
Chapter 3
62
Table 3.4
Parameter values ofthe linear inactivation kinetics model.
Parameter
Value
thermo-unstable a-amylase
E
a,0
247.3
a
341.0
b
1
73.9
I
•
0.00268
I
'
c
121.8
d
1
I
•
0.00272
1 •
I
'
I
0.00276
'
I
'
I
0.00280
•
I
•
I
• I
0.00284
0.00288
l / T (K~1)
Figure 3.7
Arrhenius plots of the inactivation constant ke of the thermo-unstable a-amylase at
different temperatures and water concentrations.
kinetics model usingtheparametersvaluesfrom table 3.4.
: calculated by the inactivation
Inactivation of a-amylase during drying
The expected difference in thermostability of both enzymes is clearly reflected by the
obtained results. The(estimated) inactivation constants ofthethermo-unstablea-amylase at
100 °C are four orders of magnitude larger than those of the thermostable a-amylase. The
calculated characteristic times of the inactivation process rr at 100 °C and 0.4
kgH20(kg ds)"l arefor the thermo-unstable and thermo-stablea-amylase 1.7 sand 14100
s,respectively.
Violet and Meunier (1989) found a two stage inactivation kinetics for Bacillus
licheniformis a-amylase at temperatures lower than 85 °C. Tomazic and Klibanov (1988a,
b)havestudied the mechanism oftheirreversiblethermal inactivation ofdifferent Bacillus a
-amylases in dilute aqueous solutions. They found that two different mechanisms can be
responsible for the thermal inactivation of the Bacillus licheniformis a-amylase: the
monomolecular conformational change ofthe enzymeandthe deamidation ofthe asparagine
and glutamine residues. The determined activation energies Ea of both inactivation
mechanism differ and are about 300 and 100kJ mol'l, respectively. Giventheir results and
the values found in this study for the activation energy Ea of the inactivation process at
different water concentrations (see figure 3.5a) it might be that these two mechanisms are
also responsible for the thermal inactivation of the thermostable a-amylase used in this
study. The possible existence of two inactivation mechanisms with different activation
energies should result in curved Arrhenius-plots. This is, however, not found in this study.
Moreover to determine the existence of such curved plots, the inactivation kinetics
experiments haveto be performed using a much wider temperature range as has been done
inthisstudy.
3.4.2. Drying experiments
3.4.2.1. Suspended droplets
-Modelsimulation
Figure3.8 showstheinactivation ofthethermostable a-amylase ina suspended droplet. The
drying process as such is discussed in chapter 2.4.1. It can been seen that the enzyme
activity starts to decrease when the droplet temperature approaches the temperature of the
drying air. This can be explained bythe differences between the characteristic times of the
dryingprocess,thetemperatureincreaseandtheinactivation reaction.During alargepart of
63
Chapter3
64
L(°0
M O (s)
Figure3.8
Model simulation. The changes in time are given of the water concentration, droplet
temperature and residual enzyme activity. Initial conditions (see also figure 2.3):
fijw0 =1.25kgH20(kgds)_1, ddo =0.01m, r g =102.5°C,
v g =2.5ms _ 1
and
_1
H=0kgH2O(kgda) . Physical data table 2.2, applying the adapted relation for the
activationenergy;kineticdatatable3.3(thermostablea-amylase).
the drying process the droplet temperature is almost equal to the drying air temperature,
since the characteristic time for drying rd is much larger than that for heat transfer zh
(Td{=3500s)»rh{=300s))
(see chapter 2.4.1 and figure 2.3). The (calculated)
characteristic times of the inactivation reaction rr at the drying air temperature (102.5 °C)
variesfrom5000 s, at the initial moisture content, to 13000 swhen the moisture content is
zero.Bothvalues arelargerthan the characteristic timeof drying. Consequently the enzyme
inactivation takes mainly place when the droplet temperature approaches the drying air
temperature.
Figure 3.9 showsthe steepwater concentration profiles which occur during drying. Asa
result an inactivation constant profile is present, caused by the water concentration
dependence of the inactivation constant at constant temperature (see also figure 3.1). The
inactivation constant at the droplet centre (high moisture content) is higher than at the
surface (lowmoisturecontent).Consequently aresidualenzymeactivity profiles developsin
Inactivationofa-amylaseduringdrying
65
Si (-)
RaJ
t i ' W,0
1 "
\
0.8-
\
^ v ^ ^ ^ ^
\
\
surface
v-
-^^average
0.6N
surface^
centre^
^^jiverage
*•-...._
0.4centre
0.2A
0
1
V
i
()
2
•
i
•
4
i
6
•
i
8
•
i
10
rx10 (s)
Figure3.9
The change in time ofthe surface, centre and average water concentrations and residual
enzymeactivities.Initialconditions:seefigure 3.8.— —:waterconcentration;
:residualenzymeactivity
such awaythat the residual enzymeactivity inthe centre islower than atthe surface ofthe
droplet.
-Sensitivityanalysis
Asensitivity analysis, similar asdiscussed inchapter 2.3.1, was performed to investigate the
influence ofsmallparameter variations around theirbase-casevaluesonthe residual enzyme
activity after a drying time of 7200 s, for the example given in figure 3.8. The results are
depicted in figure 3.10. The most important parameters influencing the predicted residual
enzyme activity are the drying air temperature (as expected), the external transfer
coefficients and the air velocity. The effect of the latter two is a result of the fact that the
heat transfer is externally limited (see chapter 2.2). The maximum change in the residual
activity in figure 3.10 corresponds to an error of 50% in the estimated value for the
inactivation constant kt. An error of such a size can easily occur given the fact that in the
Chapter 3
66
model simulation an extrapolation of the measured ke values takes place to lower
temperatures aswellasto lowermoisturecontents.
1.25
uuo
1.35 (kg H20 (kg dsf 1 )
5.25 (10"3m)
J^U W i 0 ,R 0
-50%
50%(-)
a Influence of variations in physical parameters,
Figure 3.10
102.5
Tg
2.5
vg
105 CO
5 (ms )
b Influence of variations inexperimental conditions.
Influence of changes in important variables on the residual enzyme activity. Base-case
values: see figure 3.8. Drying time 7200 s.
Inactivation ofa-amylase during drying
-Experimentalresultsandmodelsimulations
Theexperimental resultsofthe drying experiments atthefour different initialwater contents
(3.0, 1.86, 1.04and 0.47kgH20(kgds)" 1 )are showninthe figure3.11. Theresultsfor the
first stage of a drying experiment (initial water content was 1.04 kgH20(kgds)"l) are
plotted in figure 3.lie. The modelling of the drying kinetics has been discussed in chapter
2.4.1.
The drying model gives an adequate description of the experimental residual enzyme
activities. The estimated residual enzymes activities are within, or nearly within, the 50%
'uncertainty limits'represented bythe dotted lines, except for the experiment with an initial
moisture content of 3 kgH20(kg ds)"*. However, it seems that there is a tendency that
higherintitialmoisturecontentsresultsinhigherexperimental inactivation rates ascalculated
by the drying model. In the experiment with an initial water concentration of 3
kgH20(kg ds)~l a considerable inactivation occurs at relatively low temperatures (approx.
85 °C) and high average water contents (approx. 2.5 kgH20(kgds)~l). This discrepancy
can not be explained by smallvariations inexperimental and physical parameters (see figure
3.10). To predict the experimental inactivation data, the inactivation constant in the model
mustbeincreasedbyafactor 25. Thereason for thishighinactivation isnot understood.
3.4.2.2. Freefalling droplets
- Model simulation
Figure3.12 showstheinactivation ofthethermo-unstablea-amylaseinafreefalling droplet.
An important assumption is that the external drying air temperature and humidity are
constant. The residual enzyme activities are calculated using the non-linear as well as the
linearkineticsmodel.Thedryingprocessassuchisdiscussed inchapter 2.4.2.
The enzyme inactivation, as calculated by using the non-linear model, 'starts' (residual
enzyme activity is 99%) at an average moisture content and droplet temperature of 0.56
kgH20(kg ds)"l and 91 °C, respectively. A residual a-amylase activity of 50% is reached
when these values are 0.25 kgH20(kgds)~l and 110 °C. The (calculated) inactivation
constants ke belonging to these values are 0.05 s~* and 0.5 s~l, corresponding to
characteristic inactivation times rr of 20 s and 2 s, respectively. These values are in the
same order of magnitude as the characteristic times of the drying process (rd =1.5s) and
heat transfer (rh- 2s). Accordingly the enzymeinactivation takes place at an 'intermediate'
stageofthedryingprocess.
67
68
Chapter3
R Q , ^ L t (-)
Uw,o
Q 2 p a enzymeactivity
• moisture content
o temperature
4
5
tx10~ 3 (s)
1
a Experimentalconditions: a)w0 =3kgH20(kgds) ,dd0 =0.01m, Tg =97°Candv g =3.8ms '.
W
w,t /_
0.2-j a enzyme activity
• moisture content
o temperature
0
2
4
6
8
10
tx10"3(S)
b Experimentalconditions: wwfi =1.86kgH 2 0(kgds) _1 , dd0 =0.01m, Tg = 103 °C and\g =2.4ms"1.
Figure3.11
Enzyme inactivation during drying; the changes in time are given of the water
concentration,droplettemperatureandresidualenzymeactivity.
:modelsimulation,
physicaldatatable2.2,applyingtheadapted relationfor theactivation energy,kineticdata
table 3.3 (thermostable a-amylase); — —: uncertainty limits, calculated by applying
inactivation constants which differ +/- 50 % from the calculated constants using the
inactivationkineticsmodel. H isinallexperiments0kgH20(kgda)"1.
Inactivation ofa-amylaseduringdrying
69
Ww,t
T d (°C)
a enzyme activity
• moisture content
o temperature
6
8
3
tx10" (s)
Figure3.13c
Experimental conditions: <ow0 =1.04kgH20(kgds) 1, ddSs =0.01m, Tg = 101 °C and
xg =2.5ms
R Q , ^ 1 (-)
T d (°C)
W w ,o
1.0
0.8
0.6
0.4
0.2
0
a enzyme activity
• moisture content
o temperature
1
0
6
, 8
tx10" 3 (s)
Figure3.13d Experimental conditions: ww0 =0.47kgH2O(kgds) 1, dd0 =0.0086m, Tg =101.5 °C
and v g =2.5ms '.
Chapter3
70
Uw.t
0.8
U10" 3 (s)
Figure3.1le
Enzyme inactivation during the first stage of drying. Experimental conditions:
<ow0=1.04kgH 2 O(kgds) _1 , dd0= 0.01m, Tg =101 °C andv g =2.5ms"1.
4
6
falling distance(m)
Figure3.12
Model simulation. The water concentration, droplet temperature and residual enzyme
activity are given as function of the falling distance. Initital conditions:
a) w 0 =2kgH 2 0(kgdsr 1 , ddQ=200fjm, Tg=120°C, v d;0 =10ms _1 , v g =0.2ms"1
and i/ =0.025kgH2O(kgda)_1 (seealsofigure 2.9).Physical datatable2.2,applyingthe
adaptedrelationfortheactivationenergy.
a-amylase);— —:kineticdatatable3.4.
:kineticdatatable3.3 (thermo-unstable
Inactivation of a-amylase during drying
From figure 3.12 it canbe seenthethat final residual enzyme activity as calculated with
the linear inactivation kinetics model is lower than obtained by applying the non-linear
model. Alsoincase ofthe linear model the inactivation takesplace at intermediate moisture
concentrations and droplet temperatures. A residual enzyme activity of 50 % is reached
whentheaveragemoisture content is0.20 kgH20(kgds)~l and at adroplet temperature of
113 °C. In the simulation it is assumed that if the moisture content is higher than 0.82
kgH20(kg ds)"l, then the Ea and l n ^ valuesbecome constant and equal to the values at
0.82 kgH20(kg ds)"1. In this way it is avoided that extrapolation of the linear model to
higher moisture contents results in activation energy values which are much higher than
feasible for enzymeinactivation.
-Sensitivityanalysis
Asensitivityanalysissimilarasdescribedinchapter3.4.1isperformed. Thevariationsofthe
residual enzyme activity around the base-case value, as caused by the parameter variations,
are showninfigure 3.13.Thefalling distance is2.6 m(sample port 4). Theresidual enzyme
activityiscalculatedbyapplyingthelinearinactivationkineticsmodel.
In the base-case the average moisture content, temperature and residence time of the
droplet are 0.28 kgH20(kgds)~l, 107 °C and 3.25 s, respectively. The variations in the
residual enzyme activity are a result of the combined effect of changes in droplet
temperature, moisture content and residence time. In most cases the changes offset each
other, for example: a lower droplet temperature goes with a higher moisture content,
assuming the same residence time. An increase of 0.01 kgH20(kg ds)"l in moisture
content, 1°C in temperature and 0.1 s in residence time of the droplet with respect to the
base-case values, corresponds to relative changes in the inactivation constant of +12 %,
+33% and+16%,respectively. Theparameterswhich strongly influence theresidual enzyme
activity are the drag coefficient, the external transfer coefficients and the drying air
temperature. Thedragcoefficient mainlyinfluences theresidencetimeofdroplets,whilethe
other two parameters determine the temperature history of the droplets. The maximum
change in the residual activity in figure 3.13 is caused by the Cd change. The second
maximumchangecorrespondsto achangeintheestimatedvaluefor ke withafactor3.
71
72
-67%
Chapter 3
300% ( s i
i
-50%
50% I
95
100
R0
vg
105 (p.m)
0.3 (ms_l)
kg , a
125
-50%
5 0 % (-)
a Influence ofvariations in physical parameters,
Figure 3.13
1.9
2.0
(°C)
2.1
uuo(kgH20(kgdsr1)
b Influence ofvariations in experimental conditions.
Influence of changes in important variables on the residual enzyme activity. Base-case
values: seefigure 3.12. Falling distance 2.6 m.Kinetic data table 3.4.
Inactivation of a-amylase during drying
-Experimentalresultsandmodelsimulations
In figure 3.14a the results of a drying experiment at 130 °C are shown. The experimental
conditionsused arealmostthe sameasinfigure2.13c. Thevaluesgivenarethe average ofa
duplicate experiment. Thelinesinfigure3.14a are calculated using the 'ideal' drying model,
assuming constant air temperature and humidity, as well as the 'spray' drying model as
discussed in chapter 2.4.2. The modelling of the drying kinetics as such is discussed in
chapter2.4.2.
Theexperimental dryingkinetics agreewiththe experimental dryingkineticsasshownin
figure 2.13c. The enzyme inactivation takes place at an 'intermediate' stage of the drying
process, as discussed before. As can seen from figure 3.14a the 'ideal' drying model
overestimates the drying and inactivation rate. The overestimation of the drying rate has
been discussed in chapter 2.4.2. Inthat chapter it is shown that the assumption is not valid
that during drying the air temperature and humidity are constant. A 'spray' drying model
resulted in an improved description of the experimental drying kinetics. When applying the
'ideal' drying model, the experimental enzyme inactivation can be described only by
decreasing the inactivation constant with a factor 15. Parameter variations as discussed in
the sensitivity analysis can therefore not explain this overestimation, with exception of the
drag coefficient Cd. Furthermore the non-linear inactivation kinetics model using the
parameter values of table 3.3, resulted in a similar overestimation. Consequently the
overestimation of the enzyme inactivation might also primarily be a result of the 'spray'
character ofthedryingprocess.
Application of the 'spray' drying model, represented bythe drawn lines in figure 3.14a,
results in a good description of the drying kinetics as well as a better description of the
residualenzymeactivity.Theapplied spraydiameterof0.35 mat afalling distanceof4.6m,
isareasonable estimate ofthe'inner'spray-core asdiscussed in chapter 2.4.2. Infigure3.15
the calculated droplet temperatures, and calculated and experimental residual enzyme
activities are depicted using both drying models. The results show that the main reason for
the shift of the residual enzyme activity values lies in the consequently lower droplet
temperatures in the 'spray' model, caused by the lower air temperatures in the spray (see
figure 2.15b).
The experimental results obtained at a drying air temperature of 150 °C show the same
trends as those at 130 °C, see figure 3.14b. The drying kinetics can also be described
reasonable bythe 'spray' drying model, applying the same spray diameter of 0.35 m. In the
drying experiments at 130 °C and evenmore at 150 °C, the inactivation rate at short falling
distancesisunderestimated. Atlargefalling distancesitisoverestimated to someextent.
73
Chapter3
74
gat.Ra(-)
a moisture content
o enzyme activity
falling distance (m)
Tg =130°C
D moisture content
o enzyme activity
4
6
falling distance(m)
:150°C
Figure3.14
Enzymeinactivation during drying. Thewater concentration and residual enzymeactivity
are given as function of the falling distance. Experimental conditions:
o w?0 =1.7kgH 2 0(kgds) _1 , dd0 =204/jm and tf =0.025kgH2O(kgda)_1. The
temperature ofthedrying air isgiven at eachfigure. Physical data table 2.2, applyingthe
adapted relation for the activation energy; kinetic data table 3.4. — —: 'ideal' drying
model;
: 'spray'dryingmodel,aspray-diameterof0.35 matafalling distanceof4.6
m (sample port 6) is applied. The average relatieve error in a duplicate residual enzyme
activitymeasurementis20%.
Inactivation ofa-amylaseduringdrying
Uw.t
75
.R_(-)
"
%
1
1
"•"* - ^
*>v
~~ '
_ ^
'
0.8-
\ \
V
o
- .
\
0.6-
\
•
0.4-
\
N
'N A
D \
N
0.2-
^
D moisture content
o enzyme activity
^ -
\ .
J3
^"^^^p
~ ~— ~ - _ / ^ ~ ~ - ~ ^
A
0
Figure3.14c
1
0
2
'
1
'
1
4
6
falling distance(m)
7",=110oC
The experimental results obtained at a drying air temperature at 110 °C, as given in
figure 3.14c, arewithrespecttothedryingkineticsinaccordancewiththe resultsat 130and
150°C. Theexperimental inactivation rate, however, differs strongly from the 'ideal'aswell
asthe 'spray' drying model simulation. The experimental inactivation rate, as measured ina
duplicate experiment, is even much larger than calculated by the 'ideal' drying model. The
experimental inactivation rate at 110°C canbe described only ifthe inactivation constant is
increased 500fold inthe 'ideal'model simulation. Comparison ofthe experimental datawith
those offigures3.13a andb showsthat for short falling distances the measured inactivation
rateisevenhigherthan measured at 130and 150°C. Thiswill of course never be predicted
by an Arrhenius-type of model. Given this difference, there must be another yet unknown
reason.
76
Chapter3
R
a<
Td (°C)
-)
r-no
^•* d r o p l e t ^ _ ^ _
'itemperQture^
/
1
^ / ^
. / \ .
DV
0.8-
/X
0.60.4-
enzyme
activity
D
droplet
temperature
-100
\
- 50
\
\
enzyme
activity
\
\
0.2-
- 10
1
0
()
Figure3.15
1
2
1
r
"'
6
4
falling distance (m)
Enzyme inactivation and droplet temperature. The residual enzyme activity anddroplet
temperature are given as function of the falling distance Experimental conditions,and
physicalandkineticdata: seefigure3.14.Tg =130°C.— —: 'ideal'dryingmodel;
:'spray'dryingmodel.
3.5 CONCLUSIONS
The inactivation rate decreases at low water concentrations for both a-amylases. The
thermalinactivation kineticscould bedescribed byafirstorder Arrhenius-type mathematical
model.
Theresidual activity ofathermo-stable a-amylase during drying ofa suspended droplet
was successfully predicted bythedryingmodel. Thethermal inactivation rate ofthethermounstable a-amylase during drying of equally sized free falling droplets could be predicted
reasonablybytakingintoaccount the 'spray'dryingcharacter ofthe drying process.In these
simulationsthediameter ofthedroplet sprayhadtobeadjusted to describethe experimental
results.Lowtemperature andhighinitialmoisture studiesindicateayetunknown effect.
The approach in this part of the study of the independent measurement of inactivation
kinetics,leadsto modelswhichcanbeused for design or optimisation ofthedryingprocess,
includingproduct quality.
Inactivationofa-amylaseduringdrying
ACKNOWLEDGEMENTS
The author thanks M.O.A. Cueleneare, F.J. Kuiper, S.A. van Ochten, M.J.A. Rombouts,
A.G.M. Salet,L.J. van Sijll andL.A. Vrijhoef for theircontributionstothisresearch.
11
Chapter4
SEGREGATION OF SOLUTE MATERIAL DURING DRYING
4.1 INTRODUCTION
Thischapter describesthe developed ternary dryingmodel and the set-up and results ofthe
segregation experiments. Inthe experiments slabs of aternary food model system are dried
and concentration profiles are measured. Thefood model system consists ofwater, sucrose,
and sodium caseinate. The drying model is developed for the slab geometry and isothermal
drying conditions. The model takes into account the shrinkage during drying and the
concentration dependence of the diffusion coefficients. Because experimental data and
estimation procedures are lacking for multicomponent diffusion coefficients in aqueous
solutions,the multicomponent diffusion coefficients havebeen estimated usingthe resultsof
thedryingexperiments.
4.2 THE TERNARY DRYING MODEL
4.2.1 The model formulation
Thedescription ofthe diffusional masstransfer inmulticomponent mixtures canbebased on
either the generalised Maxwell-Stefan (GMS) equations or on equations derived from the
thermodynamics ofirreversible processes(TIP) (Cussler (1976),Krishna and Taylor (1986),
Wesselingh and Krishna (1990)). It can be shown, however, that these descriptions are
equivalent. Theternary drying modelused inthisthesisisbased onthe GMS equations. An
advantage oftheGMSequations isthattheMaxwell-Stefan (MS) multicomponent diffusion
coefficients in the GMS equations have physical meaning in contradiction to the transport
coefficients inthe TIPequations. TheMS diffusion coefficients areinverselyproportional to
the frictional drag that one set of molecules experiences when moving through another set
molecules.
For a ternary mixture there are two independent GMS equations and three independent
MS diffusion coefficients. The water diffusion and the diffusion of one of the dissolved
components (inthemodel sucrose) canbedescribed bythenextequations:
Chapter 4
80
1
RT
djuw _ {xwns-xsnw)
w
(* w n p
-xpnw)
MS
CtD,wp
Q A us
dr
(4.1)
ws
1
RT
dp, _ {xsnw-xwns)
s
[xsnp - xpns)
MS
C,D:sp
r\KiS
C
dr
(4.2)
where R isthe general gas law constant, T is the absolute temperature, // is the chemical
potential, r isthe space co-ordinate, x isthe molefraction, n isthemolarfluxwith respect
to a stationary co-ordinate system, D is the MS (multicomponent) diffusion coefficient,
C, isthemolar density ofthemixture, andthe subscripts w, s and p denotewater, sucrose
and sodiumcaseinate, respectively.
Animportant model assumption isthat thevolume decrease ofthe drying system equals
thevolumeoftheevaporated water duringdrying. Consequently thereisno netvolume flux,
andthevolumeaveragevelocityiszero,thatis:
(4.3)
nwVw+nsVs+npVp=0
where Visthepartial molarvolume.
Combining the GMS equations 4.1 and 4.2 with the continuity equations for water and
sucrose in a slab, and using equation 4.3, two coupled partial differential equations are
obtained describingtheunsteady statetransport ofwater and sucrose.
dC„
dt
dt
dr'
dr ™ dr
dr
dr
dr ^ dr
dr
(4.4)
(4.5)
Inwhich:
[E]= [P][B]-'[T][P]-1
(4.6)
81
Segregation of solute material during drying
with:
*^ww
^ws
(4.7)
[£]-
[p]=
[B],
l-Cw{vw-Vp)
-cs{vs-vp)
MS
D,wp
1+x,
(4.8)
i-cs{vs-vp)
D,MS
AMS
[T]=
-Cw(Vw-Vp)
MS
Awp
D,SMS
P .
dxv
dxw
-xu
n
D,MS
MS
MS
D,sp
MS
D,wp
J
(4.9)
MS
D,sp
dxs
l +x,
(4.10)
dx<
where C is the molar concentration, t is the drying time, [E] is the matrix of transformed
MS diffusion coefficients, [P] isthe concentration transformation matrix, [B] is the matrix
oftheMSdiffusion coefficients, [T]isthematrixofthethermodynamic factors, and y isthe
thermodynamic activity coefficient. The elements of the matrix [E] are denoted as Fickian
multicomponent diffusion coefficients, inliterature. TheseFickian multicomponent diffusion
coefficients are not independent of each other. The cross diffusion coefficients can become
negative.
Theinitialandboundaryequationsforthesepartialdifferential equationsare:
t =0
0<r<R,Q
t>0
r =0
(4.11)
C =C
dr
=0
dC,
dr
0
(4.12)
Chapter4
82
t>Q
r = Re,t
{EwwE„-E„E„)^
=-kg(pw,-pwJ))(EWICsVw+E„{l-Ct,Vw))
{EwwEss-EwsEsw)-^-
=kg{pwJ -pWib){Eww C /
w
+£
w
(l-C/J)
(4.13)
(4.14)
where Rgis the external radius, kg is the external mass transfer coefficient, pw is the gas
phase water concentration, and the subscripts 0, t, i and b denote initial, drying time,
interface and bulk phase, respectively. The derivation of the boundary conditions 4.13 and
4.14 is given in appendix 4.1. The equilibrium relation between the internal and external
water concentration at the surface is given by a linearized water sorption isotherm. The
externalmasstransfer coefficient kgisnot corrected for the existence of anett massflowin
thegasphase.Thiscorrection isnegligible,giventheexperimental conditionsused.
In the drying model no heat balance equation is included. It is assumed that the slab
temperature during drying remains constant and equals the drying air temperature. In the
drying experiments performed, convective as well as conductive heat transfer took place,
leadingtoarapid increaseofthe slabtemperaturetothedryingairtemperature.
Thetwopartialdifferential equationscanbesolved analytically insomecasesby defining
two linear combinations ofthe concentrations ofwater and sucrose as new variables (Toor
(1964a, b)).For non-shrinking systems with constant diffiisivities and boundary conditions
of the first or second kind this procedure leads to two uncoupled partial differential
equations. For these equations standard solutions are available (Luikov (1968)). For the
system described in this chapter no analytical solution is available. The two partial
differential equations aretherefore numerically solvedbyusing amodified variableweighted
Crank Nicolson's method (Lapidus and Pinder (1982), Kerkhof (1985)) by taking unequal
spaceandtimesteps.
Because of the receding surface the two partial differential equations were transformed
using a sodium caseinate centred space co-ordinate. This transformation avoids the
movement oftheexternal surface throughthespaceco-ordinategrid. Thetransformed space
co-ordinate isdefined as:
a=\CpVpdr
(4.15)
Segregation of solute material during drying
83
where a isthetransformed spaceco-ordinate.
Thewater and sucroseconcentrationsinthetransformed co-ordinate systemaredefined as:
r
CV
C,
C
^p'pV
(4.16a,b)
where u is the transformed concentration. The final transformed partial differential
equationshaveaform similartotheequations4.4and4.5, seeappendix4.2.
4.2.2. Theconcentration dependence ofthediffusion coefficients
Experimental data concerning MS multicomponent diffusion coefficients in concentrated
aqueous solutions are lacking, and no reliable estimation methods have been developed
(Wesselingh and Krishna (1990)). Moreover no methods are available to measure these
coefficients inawiderange ofwater concentrations. Therefore theMS diffusion coefficients
are estimated using the results of the drying experiments, including the concentration
dependence.
In describing the concentration dependence of the MS diffusivities it was assumed that
the water concentration isthe main factor given its strong decrease during drying, and not
the ratio of the other two components. It is expected that the MS diffusion coefficients
strongly decrease at low water concentrations, as found for MS diffusion coefficients in
concentrated binary aqueous solutions. The water concentration dependence of each MS
diffusion coefficient isdescribedbythenextpower lawtypeofequation:
DMS
nm
ic y y„m
(4.17)
where a isthe exponent in the power law relation, D^,x is the value of the MS diffusion
coefficient at infinite dilute aqueous solution, and the subscripts n and m denote
components i and j , respectively. The parameters anm and D^x
have to be estimated.
Power law type of equations like 4.17 have been used in literature to describe the
concentration dependence ofthewater diffusion coefficient indrying materials (Liou(1982),
Coumans(1987)).
Chapter 4
84
The thermodynamic activity coefficients y are considered to be constant in the
estimation procedure. Assumed values are: yw=l,
YS = Y7
an<
^ Yp-Y™ ( = values at
infinite dilute aqueous solution). This means that the matrix of the thermodynamic factors
[r] (seeequation 4.10)equalstheunitymatrix.Thisassumption iscertainly not valid atlow
water concentrations (a)w <0.3kgH 2 O(kgds) _1 ). At these water concentrations the
thermodynamic activity coefficients become dependent on the water concentration, as
indicated by water sorption isotherms given in literature for similar food systems (Iglesias
and Chirife (1982)). However, thermodynamic models and data are lacking describing the
change of the thermodynamic activity coefficients as function of water and solute
concentrations. As a consequence the estimated concentration dependencies of the MS
diffusion coefficients do not onlyreflect the effect ofthe decreasing water concentration on
themobilityofwater and solutes,but alsothe influence ofthethermodynamic non-idealities
on the driving force for diffusion, in particular at low water concentrations. In binary
aqueous sugar and protein solutions the thermodynamic activity coefficients are less than
one, and it is expected that this is also valid in the food model system used in the
experiments. Consequently the driving forces are underestimated in the ternary drying
model, leading probably to an overestimation of Dws
concentrations. The effect on the estimated value of D^
and D^p
at low water
is difficult to assess. In binary
dryingcalculations, asperformed inliteratureand asdiscussed inchapter 2,usuallythesame
assumption ismade. Therefore, also those diffusion coefficients as used in the calculations,
containathermodynamic factor.
The parameters Dnm wand anm are estimated usingthe Downhill simplex method (Press
et al. (1989)), a non-linear optimisation method. The sum of the absolute values of the
relative error between measured and calculated ratio and water concentration profiles is
taken as optimisation criterion. In total there are 6 parameters which have to be estimated.
Attempts failed, however, to estimate all 6 parameters simultaneously. This is caused by a
strong correlation between the parameters, in particular between aws, awp, D^fsx and
Dwpoa, leading even to negative values of the parameter aws or awp. In the estimation
procedure it is assumed therefore that the water concentration dependencies of Dws and
Dwp areidentical,that is:aws =awp. Thenumber of parameters to be estimated isreduced
by one inthisway down till 5.Moreover it is assumed that at awater concentration below
10kgm"3,theMSdiffusion coefficients areconstant. Theresults ofdryingexperimentswith
Segregation ofsolute material during drying
85
initial solids contents of 5, 10, 15 and 20% on total basis are used in the estimation
procedure. At each moisture content the results of one experiment are taken. In total 204
datapointsareincludedintheoptimisation.
4.3 MATERIALS AND METHODS
The drying experiments were performed with a food model system, consisting of water
(demineralised), sucrose (Merck) and sodium-caseinate (DMV Campina). To avoid internal
bulk flow and to simplify the experimental procedure, the model system was jellified by
addingasmallamount(0.4% ontotalbasis)ofagar(Merck). Theratiobetweenthe sodium
caseinateand sucroseconcentration was0.50 inallexperiments. Thediflusivity ofsucroseis
expected tobeatleast oneorderofmagnitudelargerthanthat ofsodiumcaseinate.
Thejellified food model system (thickness 1 cm) was dried in sample holders (figure
4.1),placed inadryingcell(figure 4.2). Asampleholder consisted ofa stack of7flatteflon
ringsand the sample holderwas disassembled ringbyringafter removalfromthe cell.Each
timeafter oneringremoval asliceprotruded,thatwascut off. Analysisofthe slicesgavethe
concentration profiles of water, sucrose and sodium caseinate inthe slab. Eight slabs were
dried simultaneously in each experiment. The temperature inthe drying cell was controlled
andthe external masstransfer couldbeinfluenced bychangingthe stirrer speed. A constant
flow of dry air was used as drying medium. The sample holders were removed from the
dryingcellatdifferent timesduringthedryingexperiment.
side-view
Gel
1 cm
U7/////////SS/77/A
7rings
top-view
Figure 4.1
Sample holder
3cm
Chapter4
86
side-view
Mixer
Air-inlet
m
Cap C P
/Thermocouples
Air-outlet
—H-t—
D-d
D-D
Heater
Sample-Holders
20 cm
/
40 cm
top-view
Air-inlet
Bayonet catch
Air-Outlet
Figure4.2
Dryingcell
The analysis of the slices consisted of two steps. First the dry weight content was
determined by means of a vacuum dryer, in which the slices were dried at 70 °C for two
days. After that the sucrose and sodium caseinate concentrations were determined by an
automatic infrared analyser, type Milkoscan 104 A/B (Foss Electric, Denmark) (Goulden,
1964)), after dissolution and dilution of the dried slices. The accuracy of the analysis
depended on the initial solids content of the model system. The difference between the dry
solids content in the slices as determined inthe vacuum dryer, or as calculated on basis of
the solute concentrations determined bythe infrared analyser, waslessthan 3% at aninitial
dry solids content of 15.9% on total basis. The error inthe ratio between sodium caseinate
and sucrosewas lessthan 5%at the same initial dry solids content. In general the accuracy
decreased atlowerinitialdry solidscontents.It wasimpossibleto cut sliceswith exactly the
samethicknessindifferent drying experiments. Consequently itwasnot possibleto repeat a
dryingexperiment inexactlythe sameway.
In the drying experiments performed, the dry solids content of the food model system
varied between 5% and 20 % on total basis. The temperature of the drying air was 50°C.
Segregation ofsolute material during drying
87
4.4 RESULTS AND DISCUSSION
4.4.1 Drying experiments
Theresultsofadryingexperiment withaninitialdry solidscontent of 15.9%(ontotal basis)
aregiveninthefigures4.3,4.4,4.5 and4.6.ThedimensionlessdistanceXisdefined as:
)cpdr
-SL
\cpdr
The profiles inthefiguresare given inthe form of bar graphs, representing the average
concentration as measured in each slice. The calculation of the deviations as given in the
figures 4.5 and4.6,isbased ontheassumptionthat nosegregation occursduringdrying.
In the earliest part of the drying process, the originally flat water concentration profile
haschanged onlynearthe surface (figure 4.3a) andnosegregation ismeasured (figure 4.4a).
There isno significant deviation from the initial ratio ofthe two solutes. Inthe second part
of the drying process (or penetration period) the water concentration profile is very steep,
butthebottom concentration (X = 0) still hasnot changed (figure 4.3b), and a considerable
degree of segregation occurs (figure 4.4b). Near the surface the ratio between the sodium
caseinate and sucrose concentration increasesfromthe initial ratio up to avalue of 0.55. In
the centre of the slab the situation is reversed, whereas at the bottom no segregation is
found. In the last part of the drying process (or regular regime period) the water
concentration profile starts toflattenand the bottom concentration decreases (figure 4.3c).
The ratio between the dry solids components at the bottom now decreases down from the
initial ratio and the ratio profile moves inward (figure 4.4c). The ratio near the surface is
0.60. Theprofiles inthefigures4.5and4.6givea similarimageasfigure4.4. Themaximum
deviation intheconcentration nearthe surface is+ 11% for sodium caseinate and - 6% for
sucrose. The experiments give an average value of the ratio inthe surface layer of the slab
only.It canbeexpected, however,thattheratio atthesurface ishigherthan 0.60.
(4.18)
Chapter4
88
water concentration
(kgH 2 0(kgp)" 1 )
-
15-
-
10-
-
-
s-
-
-
—I
0-
L_
T
1
i
i
i
0 0.4 0.8 0
0.4 0.8 0
0.4 0.8
dim.distance x
x
x
a:t=480s
b-.t=4620s
c:t=9600s
Figure4.3
Water concentration profiles after drying at three different time values. The water
concentrationisdefined askgwaterperkgsodiumcaseinate.Theinitialwatercontentis 16
kgH20(kgp)_1.Theinitialratiois0.5kgp(kgs)"1.
ratio
(kgp(kgs)-1)
0.6(\ c
U.JI
0.4-
-
i
n H—i—
1
1
1
0 ' 0i4 ' 0.8 0 0.4 0.8 0 0.4 0.8
dim. distance x
x
x
a:t=480s
b:t=4620 s c t =9600s
Figure4.4
Ratioprofiles after dryingatthreedifferent timevalues.Experimental conditionsseefigure
4.3.
Segregation of solute material during drying
89
deviation caseinate concentral-ion (%)
15-i
10
51
0
-51
-10
-15
0
0.4 0.8 0 0.4 0.8 0 0.4 0.8
dim.distance x
x
x
Q:t=480s
b:t=4620s
c:t=9600s
Figure4.5
Deviationsfromtheoverall average sodium caseinate concentrations after drying atthree
different timevalues.Experimentalconditionsseefigure4.3.
deviation sucrose concentration (%)
10i
.—
r
i
i
i
r—i
1
0 0.4 0.8 0 0.4 0.8 0 0.4 0.8
dim.distance x
x
x
a:t=480s
b:t =4620s c:t=9600s
Figure4.6
Deviations from theoverall average sucrose concentrations after drying atthree different
timevalues.Experimentalconditionsseefigure4.3.
90
Chapter 4
The experimental results agree qualitatively with our theoretical considerations: a water
concentration gradient causes a considerable segregation when there is a large difference in
diflusivities. The concentration atthe surface ofthe component with the smallest diffusivity
(sodiumcaseinate)isrelativelyhighascomparedwiththeothercomponent (sucrose).
Infigure4.7 the 'final' ratio profiles are given as measured in drying experiments with
other initial dry solids concentrations. The results indicate that the extent of segregation
decreases when the dry solids content increases, as expected because of the decreased
mutualmobilityofsucroseand sodiumcaseinate.
4.3.2 Dryingmodel simulations
-Simulationoftheexperimentaldryingdata
Figure 4.8 shows drying model simulations compared with experimental drying data. The
experimental dataarethe sameasshowninthefigures4.3 and4.4.
The drying model describes the experimental water concentration profiles aswell asthe
ratio profiles reasonable good. The average relative discrepancy between simulation results
and experimental water concentration and ratio profiles used in the optimisation is 16 %.
Particularly the trend in the shape of the calculated profiles agrees well with the
experimental profiles. However, the minimum values in the calculated ratio profiles are
found at higher values of X compared with the experimental data. The calculated surface
ratio's showa(strong) increaseinthefirstand second part ofthe drying process,whereasin
the third part of the drying process the value remains more or less constant. This
phenomenon iscausedbythealreadyverylowsurface water concentrations attheendofthe
second drying period. At these water concentrations the mutual mobility of sucrose with
respect to sodium caseinate hasbecome very low. The degree of segregation attains then a
'fixed' value. Thefinalvalue of the calculated surface ratio (1.51) is much higher than the
initial ratio (0.50), indicating that segregation is in particular important at the surface. This
meansthatthephysical-chemical surface properties canbeverydifferent from the properties
asdeterminedfromtheaverage composition.
Segregationofsolutematerialduringdrying
91
ratio (kg p (kg s)~
0.7
ds=5%
t=13200 s)
0.60.5
0.4
0.3
1
'
1 '
'
' '
0.5
ds=10%
(t=15000 s)
0.7
0.6H
0.50.40.3-
0.5
ds =16%
)600s)
0;/-i
0.6O.b
0.40.5
0.71
1
' '
I
i
,
,
,
0.5
ds=20%
(t =14400s)
0.6
0.50.40.3
0
0.5
1
dimensionless distance X
Figure4.7
'Final'valuesoftheratioprofilesatdifferent initialdrysolidscontents.
ds=drysolidscontentontotalbasis.
—:initialratio;
92
Chapter4
vmrerconcenrraHon
(kgH 2 0(kg p)"1)
20
t= 480 s
\
15-
\\
i
10
\
\
\
\
t= i.620 s
15-
\
\
\
10-
\
\
\
\
\
5
\
\\
OH
—i
1—
L.
,
,
ZU
\
r-^s
t=9600 s
15-
\\
10-
\\
5-
\\
N.
00
a
Figure4.8
1 ,
1
Q2
,
,
T-IA
0A
0.6
0.8
1.0
dimensionless distance x
Water concentration profiles.
Experimental and simulated profiles at three different drying times. The initial water
content is 16kgH2<I>(kgp)" 1 . The initial ratio is 0.5 kg p(kg s)" 1 .
: experimental
data, seefigures 4.3 and 4.4;— —: model simulation, physical data table 4.1;
: averaged simulation results.
Segregation ofsolute material during drying
ratio
93
(kg p ( k g si" 1 )
10.741
0.64^
r= 480 s
•
0.580.52J
S
J
0.460.40034-
i
i
I
1
I
i
1
t= 4620s
0.64-
/
/
/
/
/
/
0.580.52H
*S,
/
N
/
/
urn
/
/
0.460.400 34-
1
l
1
1
i
i
i
i
E511
0.641
t= 9600 s /
058^
/
/
0.52*>•. i *
^,_
0.46-
/
/
/
/
/
/
/
/
/
/
/
0.400340
Figure 4.8b
0.2
0.4
0.6
0.8
1.0
dimensionless distance x
Ratioprofiles. D: calculated ratioatthe surface.
Chapter 4
94
Table 4.1
Physical datafood model system.
Mass density:
- water
1000kg n r 3
- sucrose
1580kg m"3
- sodium caseinate 1 '
1380kg n r 3
Mol weight:
- water
0.018 kg mol"1
- sucrose
0.342 kg mol" 1
- sodium caseinate*)
100 kg mol -1
MSdiffusion coefficients
D
MS=4710-10(CwKj..6m2s-l
D^=3.210-10(CwKw)16m2s-l
Df
Linearized water sorption isotherm
=6.710-12(CwKj32mVl
Cwj >13889molm' 3 .p w i =4.6molm" 3
c
3
Cy,<
„ , <13889molm" 3 :prw,i
w , = —^-molm"
300()
External masstransfer coefficient
kg =1.510~2 ms" 1
1)estimated value
-EstimatedMS diffusioncoefficients
Theestimated equationsfor theMS diffusion coefficients aregivenintable4.1and depicted
in figure 4.9. The estimated behaviour of D^fs and D^f is in agreement with the general
finding that the water diffusivity in foods decreases strongly at low moisture contents. The
valuesoftheestimated diffusion coefficients areinthe sameorder ofmagnitude asfound in
literature for binarywater diffusion coefficients in liquid foods (Menting (1970), Luyben et
al. (1980), Furuta et al. (1984), Coumans (1987), Ferrari et al. (1989)). The estimated
water concentration dependence of Dsp is more pronounced than for Dws or Dwp , as
expected giventhe difference inmolecular size ofwater and sucrose. As aresult the mutual
mobility of sucrose and sodium caseinate is very restricted at low water concentrations.
Similar results are found for the water concentration dependence of aroma components in
carbohydrate solutions (Menting (1970), Chandrasekaran and King (1972a), Furuta et al.
(1984),Riedeand Schliinder(1988)) andofproteinsinsugar solutions(Loncin(1980)).
Segregation of solute material during drying
.
n MS
, 2 -1
log D (m s
wafer concentration x10 (kg m
Figure 4.9
Estimated Maxwell-Stefan multicomponent diffusion coefficients. Equations table 4.1.
The estimated results as shown infigure4.9 and in table 4.1 must be interpreted with
care. Different set ofvalues for the 'fitting' parameters can give appropriate descriptions of
the experimental drying data, with almost the same value for the optimisation criterion, as
mentioned before.
The very low values of D^ at low moisture contents compared with D%f and D^
indicatethat the segregation can not proceed onthetime scale ofthe drying process at low
moisture concentrations. Consequently, at these moisture concentrations the ratio between
the dry solids components attains a fixed value. In particular the ratio at the surface will
attain afixedvalue already soon after the beginning ofthe drying processgiventhe existing
lowwater concentrations, asshowninfigure4.8.
95
96
Chapter 4
4.5 CONCLUSIONS
Segregation occurred during drying in the food model system studied. In slab drying
experiments, the concentration of sodium caseinate was relatively high at the surface
compared with the sucrose concentration, in the centre the reversed situation existed. In
experimentswithaninitial dry solidscontent of 15.9% ontotal basis,the measured ratio of
sodium caseinateand sucroseinthe surface layerincreased from theinitialratio of0.5up to
0.6 kg sodium caseinate(kg sucrose)"*. Simulations with a ternary drying model, based on
the generalised Maxwell-Stefan equations, resulted in a good agreement with the drying
experiments. The estimated Maxwell-Stefan diffusivities were comparable with values
reported in literature. The calculated ratio at the surface increased from 0.5 to 1.51 kg
sodiumcaseinate(kg sucrose)"* astheinitialmoistureis 15.9%ontotalbasis.
ACKNOWLEDGEMENTS
The author thanks T.H.M. Snoeren, W.A. Beverloo, G.D. Mooiweer, O. Bruquet, J.J.
Dommershuijzen, J. deKoningandF.Waaijen for their contributionstothisresearch.
Segregation of solute material during drying
97
Appendix 4.1
Inthisappendixtheboundary conditionsat Rgt asgivenbytheequations4.13 and 4.14, are
derived. The boundary condition for the water transport is based on the fact that at the
surface the internal water flux equals the external water flux, both with respect to the
receding surface. Theboundary conditionfor thewaterfluxn'wis:
" I =Cw(v w - v,-) =nw - Cwv, =k (p • - pwJ,)
(4.19)
where v isthevelocityand superscript i denotes interface.
Becausethere isnotransport of sucrosethroughtheexternal surface, thefluxof sucrose
withrespect to the receding surface iszero. Theboundary condition for the sucrosefluxn's
is:
"i = Q ( v J - v / ) = i i , - C , v I - = 0
(4.20)
Therecedingvelocity oftheexternal surface v, is:
v
dRe t
t
\
/ =—^~ =~Kkg [PwJ -PwJ,)
Theright-hand part ofequation4.21follows from amassbalanceoverthedryingsystem.
The boundary conditions as given by the equations 4.13 and 4.14 can be derived by
combiningtheequations4.1, 4.2,4.3,4.19, 4.20 and 4.21, usingthetransformation asgiven
byequation4.6.
(4.21)
Chapter 4
98
Appendix 4.2
Inthisappendix thetransformed diffusion equations (equations: 4.4 and 4.5), and initial and
boundary conditions(equations:4.11, 4.12,4.13 and4.14) aregiven.
Thetransformed diffusion equationsare:
duw _
dt
^
da
dur
dt
d
da
Aduw
da
cduw
da
da
(4.22)
da
d
ndus
D—da da
(4.23)
Thetransformed initial andboundary conditionsare:
r= 0
0<a<Cp>0VpRefi
r>0
<7=0
t >0
a=
(4.24)
da
da
(4.25)
CpQVpRe0
(AD-BC)-^L
{AD-BC)^
aa
=
Dkg{pwJ-pw>b)
(4.26)
=
-Ckg{pwJ-pw,b)
(4.27)
Inwhich:
A=
CPVP{-{\-CSVS)({\-CWVW)ESS+CSVWEJ+CWVS({I-CWVW)ESW+CSVWEWW)}
C=
CPVP{-{I-CWVJ({I-CSVS)EWW+CWVSEJ+CSVW((I-CSVS)EWS+CWVSEJ}
D=
CPVP[CWVS((I-CSVS)EWW+CWVSEJ-(I-CSVS)((I-CSVS)EWS+CWVSESS)}
Chapter5
GENERAL DISCUSSION
5.1 INTRODUCTION
The drying models, as described inthis thesis, arefinallyintended to examine the effect of
important process conditions and variables on drying kinetics, product quality (enzyme
inactivation) and segregation; inparticular during spray-drying ofliquid foods. Three topics
relevant for spray-drying will be discussed briefly inthis chapter, the effect of the spray-air
mixing pattern on enzyme inactivation, the significance of the measured inactivation
constantsfor spray-drying calculations andtheextent ofsegregation duringspray-drying.
Important factors which impede the actual use of drying models for spray-drying
calculationsare:
- the sizedistribution ofthedroplets.
- thecomplicated spray-airmixingpatterns,resultinginnon-uniform drying conditionsand
droplet trajectories. Dropletsofdifferent sizescanhavequitedifferent dryinghistories.
- the changes in the physical structure of the droplets, like: vacuole formation, droplet
inflation, shrivellingandshrinkage.
The effect of droplet size distribution on (overall) drying kinetics and product quality is
discussed byKerkhofand Coumans (1990)for an idealised spray-air mixing pattern. In that
studyitwas assumed that the airwasperfectly mixedwhilethe particlesmoved inplug flow
mode through the dryer. Van der Lijn (1976) analysed the relation between three different
idealised spray-air mixing patterns and drying kinetics. The influence of vacuole formation
and droplet inflation on drying kinetics is treated by Van der Lijn (1976) and on product
quality by Wijlhuizen et al. (1979). The inactivation of the enzyme phosphatase (Daemen
(1981)) was taken as quality parameter in the product quality studies mentioned. The
relationbetween spray-airmixingpattern and product qualityis,however, not examined yet.
The importance ofthis mixing pattern is clearly demonstrated by the obtained experimental
resultsshowninchapter3.
To assesstheconsequences ofprocessconditionsduring spray-drying onthe (bio-) chemical
product quality, reaction kinetics models like discussed in chapter 3, have to be used. The
100
Chapter5
parameters inthesemodelsareestimated using separately determined reaction constants. To
obtain a reliable estimate these reaction constants have to be determined in a temperature
and water concentration range relevant for the spray-drying process. A point of concern is
therefore, whether the inactivation constants as calculated in spray-drying models are
covered byexperimental data or arebased on extrapolation. Inthe latter casethe reliability
of the calculated quality changes is limited. Furthermore one can question if the
methodology as applied in chapter 3 is always appropriate for determining the relevant
inactivation constants,giventhe short particleresidencetimesina spray-dryer.
Thedryingkineticsofliquidfoods andthequality ofspray-dried powders caninprinciplebe
affected by segregation ofthedissolved solids.Model simulations can show if and to which
extent segregation canoccur during spray-drying. Thiscanbe studied more extensively with
themodeldeveloped inchapter4.
5.2 SPRAY-AIR MIXING PATTERN AND ENZYME INACTIVATION
VanderLijn(1976) distinguished three'idealised' (extreme)mixingpatterns:
1. Perfectly mixed air; the air temperature and humidity are constant during the drying
process. Theairtemperature and humidityareat outlet conditions. Thedropletsmovein
plugflowmodethroughthedryer.
2. Perfectly cocurrent dryer operation; both air and droplets move in plug flow mode
through the dryer. The wet droplets are brought in contact with the drying air at inlet
conditions immediately after atomisation. During drying the air temperature decreases
andtheairhumidityincreases.
3. Gradual spray-dispersion; in practical spray-drying a droplet spray is formed and drying
air isgradually admixed. An extreme situation arises in that case where the entrainment
of drying air in the droplet spray is so slow that the drying droplets are in equilibrium
withthe airconditionsinsidethe spray. Asresult water concentration profiles are absent
inside the droplet. The droplet drying time is then completely controlled by the rate of
admixing of drying air. However, combinations of droplet temperature and (average)
water concentrations occurring during drying can be derived using the water sorption
isotherm ofthe product (van derLijn (1976)). Thecalculation ofthedrying timeisonly
possibleiftherateofadmixingisknown.
In actual spray-dryers the spray-air mixing patterns will be combinations of these three
patterns, moreover the droplets will not move in plug flow. Attempts are reported in
General discussion
101
literature(Liveslyetal.(1992))inwhichthespray-airmixingpatternismodelled indetailby
using computational fluid dynamics, but no experimentally validated models do yet exist.
However, using 'idealised' patterns can give insight in the importance of the mixing pattern
for dryingkinetics and product quality, and inthelimitations of model calculations based on
simplified mixingassumptions.
In the model simulations performed, three 'idealised' mixing patters are used, namely:
perfectly mixed air, perfectly cocurrent dryer operation and an 'idealised' droplet spraydrying air admixing pattern. The first two are similar to that of Van der Lijn (1976). The
perfectly mixed air calculations are based on the 'ideal' drying model (chapter 2). In the
perfectly cocurrent dryer operation the 'ideal'drying model is combined with heat and mass
balances over the drying air 'attached' to the drying droplet. The 'spray' drying model as
discussed inchapter 2.4.2.2 isused inthe 'idealised' spray-air admixing pattern calculations.
Theconsequences ofthe different patterns are evaluated for one droplet diameter only. It is
Table 5.1. Conditions anddata usedinthe spray-drying simulations.
Process conditions
- inlet:
air
r = 250°C
77= 0.01kgH 2 O(kgdar 1
product
r =50°C
mw =1.5kgH 2 0(kgds) _1
dd 0 = 200 /jm
v r f 0 =100ms - 1
- outlet:
air
r=no°c
H = 0.0655kgH 2 O(kgda) _1
product
r=no°c
ft)w=0.05kgH2O(kgds)_1
-feed-air ratio
0.0383kgds(kgd a ) - 1
Data
- physical data
table 2.2
- kinetic data
table 3.4
102
Chapter5
expected that the obtained results are similar for other diameters. In the simulations the
inactivation kinetics ofthethermo-unstable a-amylase isused. Theinactivation is described
bythe'linear'inactivation kineticsmodel(chapter 3.4.1).
In the simulation 'typical' spray-drying conditions are applied. These conditions are
summarised intable 5.1.It is assumed that the drying process is adiabatic and that the final
air and droplet temperatures are equal. Theinitial droplet diameter and velocity are 200 \im
and 100 ms"1, respectively. In the 'spray' drying model it is assumed that the length of the
spray-cone isequalto the length ofthe spray-tower. Inthisway an'extreme' mixing pattern
issimulated.
Figures 5.1 and 5.2 showthe results ofthemodel simulations.Figure 5.1 showsthat the
mixing patterns profoundly influence dryingkinetics, as expected (vanderLijn (1976)), and
enzyme inactivation. The highest drying rate as well as inactivation rate is obtained in the
'cocurrent'pattern, thelowestinthe'spray'pattern.
The drying rate differences result from the differences in drivingforce. In the 'cocurrent'
log r (s)
Figure5.1
Enzyme inactivation and drying kinetics for different spray-air mixing patterns. The
changesintime aregivenoftheaveragewaterconcentrationandresidualenzymeactivity.
Initial conditions: see table 5.1;
activity;x:final residualenzymeactivity.
: drying kinetics;
: residual enzyme
Generaldiscussion
103
V°n
0
0.2 0.4 0.6 0.8
1
1.2 1.4
CJW (kg H20 (kg dsf
Figure5.2
1
)
Droplet temperature-average water concentration histories for different spray-air mixing
patterns.Initialconditions:seetable5.1.
pattern the average driving force is higher than in the 'mixed' pattern, in the 'spray' pattern
thereversed situation exists.During dryinginthe 'cocurrent' pattern the airtemperature and
humidity changes from inlet to outlet conditions, while in the 'mixed' pattern the air
temperature andhumidity arealwaysatoutlet conditions.Inthe 'spray'pattern onlyalimited
amount of air at inlet conditions is 'available' at the onset of the drying process. The air
temperature in the spray decreases strongly and approaches the adiabatic saturation
temperature (51°C). Thedroplet isalmost inequilibriumwiththeairinthe'spray'. Therate
of admixing of drying air at inlet conditions determines the drying rate. Finally the air
temperatureandhumidityinthe'spray'approachtheoutlet conditions.
Figure 5.2 showsthat ateachaveragewater concentration the droplet temperature inthe
cocurrent caseishigherthan inthemixed 'case',for the 'spray' casethe situation isreversed.
Inthe 'spray' casethe droplet temperature isduring alarge part ofthe drying process at the
wet-bulbtemperature.
The residual enzyme activity differences are caused bythefact that the inactivation rate
is more sensitive to droplet temperature changes than the water diffusion coefficient. The
activation energy of the inactivation reaction (Ea «200-500kJmoF ) is for all water
104
Chapter 5
concentrations higher than the activation energy of the water diffusion coefficient
(Ea «25-100kJmol~ ). Consequently the enzyme inactivation increases more strongly
thanthe dryingtime decreases at increasing droplet temperatures, and viceversa. And since
the average droplet temperature in the 'cocurrent' pattern is higher than in the 'mixed'
pattern, is the residual enzyme activity in the 'cocurrent' pattern lower than in the 'mixed'
pattern.Forthe'spray'patternthe samereasoning explainstheresults.
The calculated outlet residual enzyme activities of the 'cocurrent' and 'spray' pattern can
beobtainedbychangingthe outlettemperatures inthe 'mixed' patternwith+6 °Cand -9°C,
respectively. This temperature range is in the same order of magnitude as the outlet
temperature ranges considered during design and optimisation of spray-dryers.
Consequently, optimisation ofspray-dryersregardingproduct qualityusingdryingmodels,is
onlypossibleifdetailed information aboutthe spray-mixingbehaviourisavailable.
Infigure5.3 the change in time of the 'average' inactivation constant ke is plotted. The
'average' inactivation constants are calculated using the average water concentration. In
figure5.3 it is indicated when the residual enzymes activities are 90 and 50% respectively.
As can be seen from figure 5.3 not only the values of the inactivation constants differ, but
1
°log (ke) Is 1 )
2i
R0=O.S
Ra=°- 9 f
u
/
2-
a=°5
/
'cocurrent'/
k
R
Ra=°-9'
/'mixed'
1
-2
'spray'
1
10
Figure 5.3
•
log t (s)
The change in time of the 'average' inactivation constant ke for different spray-air mixing
patterns. Initial conditions: seetable5.1.
General discussion
also their change in time. In the 'cocurrent' pattern a rapid increase of the inactivation
constant isfollowed bya decrease. Theincrease is caused bythe rapid droplet temperature
increasewhich completely dominatesthe decrease due to the water concentration decrease.
The final decrease of ke is caused by the decrease of the droplet temperature and water
concentration during the final part of the drying process. In the 'mixed' pattern the
inactivation constant remains, after a rapid increase, more or less constant. The increasein
droplet temperature is offset bythe decrease inmoisture content. The inactivation constant
in the 'spray' pattern obtains its maximum value when the final water concentration is
reached. The temperature increase dominates the moisture content decrease. As a result of
these differences the enzyme inactivation takes place in different drying stadiums as well as
atdifferent water concentration ranges,dependent onthemixingpattern prevalent.
Interpreting thefigures 5.2 and 5.3 onemust keep inmind that theuse of average water
concentrations and 'average' inactivation constants is somewhat misleading. During drying
water concentration profiles develop and inconnection to that inactivation constant profiles,
insuch awaythat the inactivation constant atthe surface ofthe droplet islower than inthe
droplet centre. Consequently the residual enzyme activity is higher at the droplet surface
thaninthedroplet centre, seethefigures 3.1 and3.9.
The simulation results show that the prevalent spray-air mixing pattern influences the
residual enzymeactivity. Asaresultthe design and control ofthismixingpattern isofgreat
importance, among otherthings,for theresulting(bio-)chemicalproduct quality.
5.3 SIGNIFICANCE OFMEASUREDINACTIVATION CONSTANTS FOR
SPRAY-DRYING CALCULATIONS
Theexperimental method used inthisthesisfor themeasurement oftheinactivation constant
sets an upper limit to the value of the inactivation constant which can be determined. This
maximal value ofthe inactivation constant kemax can be estimated as follows. The method
assumes that onthe time scale of an inactivation kinetics experiment the temperature inthe
inactivation cell equals the temperature of the external heating medium. The estimation of
the maximal value of the inactivation constant is therefore based on the next two
considerations:
- the minimal practicable layer thickness in an inactivation cell (see figure 3.2) is 1mm.
The time for 99% temperature equilibration of a water layer of 1mm thickness is 3 s,
assumingthat internalconductiveheattransfer isratelimiting.
105
Chapter5
106
- the characteristic time ofthe inactivation reaction rr (rr = l/ke) must be 5times larger
than the time for 99%temperature equilibration, to avoid that considerable inactivation
(> 10%)alreadytakesplaceduringtemperature equilibration.
These two starting points result in a minimum value for xr of 15 s and a maximal
inactivation constant kemax of0.07 s'^.
In figure 5.4 the inactivation constants calculated in the spray-drying simulations, as
discussed in paragraph 5.2, for the thermo-unstable a-amylase are compared with the
measured inactivation constantsaswell aswiththemaximalinactivation constant. Asshown
in figure 5.4 the enzyme inactivation occurs in all mixing patterns at temperatureconcentration combinations not covered by the inactivation kinetics experiments.
Consequently the calculated residual enzyme activities are entirely based on extrapolations
to higher temperatures and lower water concentrations of the measured inactivation
constants. In the 'cocurrent' pattern the maximal calculated inactivation constant is 30 s~l.
Moreover almost all inactivation constants for the relevant temperature-concentration
L(°0
1.2
uMkg H20(kgds
Figure5.4
U
-1,
Inactivation constants and droplet temperature-water concentration histories. Initial
conditions:seetable 5.1;
:linesofconstantvaluesoftheinactivationconstant;
maximal inactivation constant k„
--0.07s"- l .
•: droplet temperature-
average water concentration history; see figure 5.2;//f. range of experimental conditions
used in the inactivation kinetics experiments of the thermo-unstable a-amylase. On the
droplet 'temperature-water concentration' graphs it is indicated when the residual enzyme
activitiesare50and90%,respectively.
General discussion
combinations arehigherthantheestimated maximalinactivation constant of0.07 s"l (dotted
line). This means that with the given experimental method no solution is available for this
extrapolation problem.
To measure inactivation constants at higher temperatures than possible with the method
used in this thesis, methodologies must be developed and applied which can estimate
inactivation constantsfrominactivation kinetics experiments inwhichthe characteristic time
ofthe overallinactivation reaction equalsthetime of99% temperature equilibration within
the inactivation cells. The methodology must include: a model which calculates the overall
inactivation inan inactivation cellusing aheat transfer model combined with an inactivation
kinetics model and a non-linear optimisation method to estimate the parameters in the
inactivationkineticsmodel,givenexperimental data.
Figures like figure 5.4 can be useful in evaluating inactivation kinetics experiments
already performed and in planning subsequent experiments. It stresses the use of a cyclic
method of collecting kinetic data. In such a method calculations based on a limited set of
inactivation kinetics data are used to identify critical temperature-water concentration
combinations and subsequently the appropriate inactivation kinetics experiments and
experimental methodology.
5.4 SEGREGATION DURING SPRAY-DRYING
To examine the occurrence of segregation during spray-drying, model simulations are
performed under 'spray-drying' like conditions using the estimated Maxwell-Stefan (MS)
diffusion coefficients. Infigure5.5theresultsofamodel simulation areshown.
The calculated water concentration profiles show a similar behaviour as found in drying
kinetics calculationsusing models as described inchapter 2. Very steep profiles at the onset
of the drying process (penetration period), followed by a flattening of the profiles (regular
regimeperiod).Thesurface water concentration decreasesveryrapidlyfromthe initialwater
concentration till thefinalmoisture content (0 kgH20(kg ds)~l is this simulation), caused
by the fact that internal mass transfer is the rate controlling mechanism. As can seenfrom
the calculated ratio profiles, the extent to which segregation occurs under spray-drying
conditionsislessthan that found for the simulated drying experiments(seefigure 4.8b), the
segregation at the surface is 0.94 kg p(kg s)"l and the 'penetration depth' is» 15 urn. The
penetration depth coincides with the steep water concentration profiles in the first stage of
thedryingprocess.After adryingtimeofabout 3.5 stheratioprofile is 'fixed'.
107
Chapter 5
108
water concentration
(kgH 2 0(kg p)"1)
2.8-
dimensionless distance X
Waterconcentrationprofiles.
ratio
(kg p(kg sj
1.0i
0.8-
0.6initial ratio
t
t=0.006 s
(b)
0.4-
—I—r—r—'—r—<—\—i—r—>—r—'—I-'—r-1—I-1—|—'—I
0.80
0.84
0.88
0.92
0.96
1.00
dimensionless distance X
Ratioprofiles.
Figure5.5
Segregation during spray-drying. The initial layerthickness is50nm,theinitial moisture
content is3kgf^OCkgds)"1, theinitial ratio is0.5 kgp(kg s)"1 andtheexternal mass
transfer coefficient is 1 ms"'.Physicaldatatable4.1.
109
Generaldiscussion
The difference in ratio profiles between the drying experiments with the slabs and the
'spray-drying' model simulation is not caused by the different time scales, because the
Fourier times are comparable. The main reason for the differences in ratio profiles is the
difference ininitialdry solidscontent (50% ontotalbasis(model simulation) versus 15.9%
(drying experiment)), or more precisely the differences in diffusion velocities due to the
water concentration dependency of the MS diffusion coefficients. The value of D^s
decreases much stronger with increasing solids content than the water mobility (D™ and
D^). As a consequence the characteristic time of the segregation process increases faster
than the characteristic time of the drying process with increasing initial solids content. The
'overall'degreeofsegregation willtherefore belimited athigher initial solid contents, ascan
be seen from table 5.2 also. The results shown in the figure 5.5 and table 5.2 indicate that
segregation does occur during spray-drying, but the extent is dependent on the initial
moisture content. The importance for the product quality will depend on the dry solids
components involved andtheapplicationsaimedat,but effects arepossiblegiventhe results
intable5.2.
Table5.2.
Calculated surface ratiosatdifferent initial moisturecontents.Thesurface ratioisgivenat
anaveragemoisturecontent of0.2 kgH20(kg ds)"1. Theinitial ratiois0.5 kgp(kgs)"1.
Dataseefigure5.5.
Initialmoisturecontent
1
(kgtyOOcgds)- )
Surfaceratio
(kgpCkgs)"1)
4
1.41
2.33
1.27
1.5
1.08
1
0.94
0.67
0.81
0.43
0.68
110
Chapter 5
5.5 CONCLUSIONS
The prevalent spray-air mixing pattern profoundly influences the residual enzyme activity.
Dependent onthe mixing pattern, the change intimeoftheinactivation constant is different
andasaresulttheenzymeinactivationtakesplaceat different water concentrations. General
statements about the drying stage in which the inactivation of enzymes takes place are not
possible. Calculations using 'idealised' mixing patterns can only be used to make first
estimatesoftheinfluence ofprocessconditionsonresidualenzymeactivities.
Themethodusedintheinactivation kineticsexperimentsisnot appropriatetopredict quality
changesindryingprocessesinwhichthecharacteristic dryingtimesarelessthan 15s,likein
spray-drying processes. The application of cyclic kinetic data collection methods, inwhich
inactivation kinetics experiments are alternated by model simulations, makes the data
collectionmoreefficient andresultsinmoreaccuratepredictions.
Model simulations revealed that during spray-drying segregation will occur in the food
model system, although to a lesser extent as found for the slab drying experiments. The
calculated surface ratios of the dry solids components are dependent on the initial solids
content. The extent of segregation canbe controlled by applying different initial dry solids
contents.
NOMENCLATURE
a
aw
fitting parameter
water activity
[B]
matrixof MSdiffusion coefficients
Bi
b
C
-
c,
Biot number
fitting parameter
concentration
molardensity
c
Q
fitting parameter
drag coefficient
-
C
specific heat
Jkg-lK
diffusion coefficient
matrixoftransformed Maxwell-Stefan diffusion
coefficients
fitting parameter
diameter
fitting parameter
dryair
drysolids
activationenergy
m^ s~l
m^ s~l
activation energy diffusion coefficient
Jmol"1
frequency
gravityconstant
Hz
m s~2
K
water concentration gasphase
drying flux
inactivation constant
kgH 2 0(kgda)kgH20m-2s-1
s-1
h
externalmasstransfer coefficient
ms"l
*.
m
n
Nu
pre-exponential factor
s-1
mass fraction
molarflux instationaryco-ordinate system
Nusselt number
sodium caseinate
molm-2s_l
.
P
D
[E]
e
d
d
da
ds
Ea
/
*
H
Jw
P
m^ s~l
kgm"3,mol m"3
mol m"-'
m
-
Jmol"1
Nomenclature
112
[P]
concentration transformation matrix
Pr
R
Prandtlnumber
generalgaslawconstant
residualenzymeactivity
dropletradius
Ra
Rd
Re
Re
r
s
Sc
Sh
T
t
u
V
V
X
X
JmoHK'1
m
m
externalradius
Reynoldsnumber
space co-ordinate
sucrose
Schmidtnumber
Sherwood number
temperature
time
transformed concentration
partialvolume
velocity
dimensionlessdistance
mole fraction
m
°C,K
s
-,mol m~3
m-* kg"l, m^ mol'l
ms~l
-
externalheattransfer coefficient
Js"1 m-2K"1
matrixofthermodynamic factors
thermodynamic activity coefficient
heat ofevaporation
chemicalpotential
concentration gasphase
massdensity
Jkg"1
J mol' 1
kgm'3, mol m~3
kgm"3
transformed space co-ordinate
characteristictime
massflow
water concentration
kg, m
s
kgs" 1
kgH 2 0(kgds)- 1
• Greek
a
8
PI
y
AHV
V
p
p
a
X
®w
Nomenclature
113
• Superscript
MS
interface
Maxwell-Stefan
oo
at infinite dilute aqueous solution
i
- Subscript
0
0
b
d
d
ds
initial
atzeromoisture content
bulkphase
droplet
drying
drysolids
e
eff
8
h
i
enzyme
effective
gasphase
J
n
n
m
m
max
P
r
s
T
t
w
oo
heat transfer
interface
jetvelocity
nozzle orifice
componentn
maltodextrin
componentm
maximal
sodiumcaseinate (protein)
reaction
sucrose
temperature
time
water
atinfinite diluteaqueous solution
REFERENCES
Alexander, K. (1983). Factors governing surface morphology in the spray drying of foods. PhD thesis,
University ofCalifornia, Berkeley.
Arrowsmith, A. and Foster, P.J. (1973). The motion of a stream of monosized liquid drops in air. Chem.
Eng. J., 5, 243-50.
Bird,R.B. , Stewart, W.E.andLightfoot, E.N. (1960). Transportphenomena, JohnWiley& SonsInc., New
York.
Buttiker, R. (1978). Erzuegung von gleich grossen tropfen mit suspendierten und gelosten feststoff und
derentrocknungimfreienfall. PhDthesis,ETHZurich, Switzerland.
Chandrasekaran, S.K. and King, C.J. (1972a). Multicomponent diffusion and vapour-liquid equilibria of
diluteorganiccomponents inaqueoussugarsolutions. AIChEJ., 18,513-20.
Chandrasekaran, S.K. andKing, C.J. (1972b). Volatiles retention during drying of food liquids, AIChE J.,
18, 520-6.
Charlesworth, P.H. andMarshall, W.R. (1960). Evaporation from drops containing dissolved solids. Part I
andII. AIChEJ.,6, 9-23.
Coumans, W.J. (1987). Power law diffusion in drying processes. PhD thesis, Technical University
Eindhoven, TheNetherlands.
Crowley, J.M. (1968). Lateralinstability ofastreamofchargeddroplets.PhysicsofFluids, 11, 1372-74.
Cussler, E.J. (1976). Multicomponent Diffusion. Chemical Engineering Monographs, Vol 3, Elsevier,
Amsterdam.
Daemen, A.L.H. (1981). The destruction of enzymes andbacteria during spray-drying of milk andwhey. 1.
Thethermoresistance ofsomeenzymes andbacteria in milk andwhey withvarioustotal solids contents.
Neth.MilkDairyJ., 35, 133-44.
Daemen, A.L.H. (1983). The destruction of enzymes andbacteria during spray-drying of milk andwhey. 3.
Analysisofthedryingprocessaccordingtothestagesinwhichthedestructionoccurs.Neth.MilkDairy
J., 37, 213-28.
Daemen, A.L.H. and van der Stege, H.J. (1982). The destruction of enzymes and bacteria during spraydryingofmilkandwhey. 2. Theeffect ofthedryingconditions. Neth.MilkDairy J., 36, 211-29.
Dunlop, P.J. and Gosting, L.J. (1957). Interacting flows in diffusion of the system raffinose-urea-water. J.
Phys. Chem., 61, 1619-22.
Dunlop, P.J. and Gosting, L.J. (1964). Diffusion coefficients for one composition of the system watersucrose-glycine. J.Phys. Chem., 68, 3874-76.
116
References
Ellerton, H.D. and Dunlop, P.J. (1967). Diffusion and frictional coefficients for four compositions of the
system water-sucrose-mannitol at 25 °C. Tests of the Onsager reciprocal relation. J. Phys. Chem., 71,
1291-97.
El-Sayed, T.M. (1987). Development of particle morphology of drying drops. PhD thesis, University of
California, Berkeley.
El-Sayed, T.M., Wallack, D.A. and King, C.J. (1990). Changes in particle morphology during drying of
drops of carbohydrate solutions and food liquids. 1. Effects of composition and drying conditions.
IndustrialEngineering and Chemistry Research, 29, 2346-54.
Feather, M.S. and Harris, J.F. (1973). Dehydration reactions of carbohydrates. Adv. Carbohydr. Chem., 28,
161-224.
Ferrari, G., Meerdink, G. and Walstra, P. (1989). Drying kinetics for a single droplet of skim-milk. J. of
FoodEng., 10,215-30.
FlickD.,Lenoir Ph., and Gibert,H. (1988).The drying offree falling droplets of concentrated skim-milk. In
Proc. Sixth Int. Drying Symp., pp 471-78.
Fogarty, W.M. (1983). Microbial Amylases. In Microbial Enzymes and Biotechnology, ed. W.M. Fogarty,
Applied SciencePublishers,London, pp. 1-92.
Furuta, T., Tsujimoto, S., Makino, H., Okazaki, M. and Toei, R. (1984). Measurement of diffusion
coefficient ofwater and ethanol in aqueuos maltodextrin solution. J. ofFood Eng., 3, 169-86.
Furuta, T., Okazaki, M., and Toei, R. (1985). Flavour retention on drying of a single droplet under various
drying conditions. In Drying '85,eds.R. Toei and A.S.Mujumdar, Hemisphere Publ. Corp., New York,
pp 338-44.
Goulden, J.D.S. (1964). Analysisofmilk fat by infra-red absorption. J.Dairy Res., 31,273-84.
Greenwald, C.G. (1980). Particle morphology in the spray drying of foods. PhD thesis, University of
California, Berkeley.
Hendricks, CD. and Babil, S. (1972). Generation of uniform, 0.5-10 nm, solid particles. J. of Physics E:
Scientific Instruments, 5, 905-10.
Hulst, A.C.,Tramper, J., van't Riet,K. and Westerbeek, J.M.M. (1985). A newtechnique for the production
ofimmobilized biocatalysts in large quantities.Biotechnol. Bioeng., 27,870-76.
Hunik, J.H. and Tramper, J. (1993). Large-scale production of K-carrageenan droplets for gel bead
production. Biotechn. Prog., 9, 186-92.
Iglesias,H.A. and Chirife, J. (1982).Handbook ofFood Isotherms. Academic Press,New York.
Kerkhof, P.J.A.M. (1975). A quantitative study on the effect of process variables on the retention of volatile
tracecomponents in drying.PhD thesis, Technical UniversityEindhoven, The Netherlands.
Kerkhof, P.J.A.M. (1985),personal communication.
Kerkhof, P.J.A.M. and Coumans, W.J. (1990). Drying of foods: transferring inside insights to outside
outlooks.Paper presented atthe 7th Int. Drying Symp., Praque.
References
Kerkhof, P.J.A.M. and Schoeber, W.J.A.H. (1974). Theoretical modelling of the drying behaviour of
droplets in spray-driers. In Advances in Preconcentration and Dehydration of Foods, ed. A. Spicer,
Applied SciencePublishers,London, pp. 349-97.
Krishna, R. and Taylor, R. (1986). Multicomponent mass transfer: theory and applications. In Handbook of
heat and masstransfer, ed. N.P. Chereminisoff, Vol. 2, GulfPublishing Corp.,Houston, pp 260-424.
Lapidus, L. and Pinder, G.F. (1982). Numerical solution of partial differential equations in science and
engineering. Wiley-Interscience, NewYork, pp 149-62.
Lefebvre, A.H. (1988). Atomization and sprays.HemispherePublishing Corporation, New York.
Lijn, J. van der (1976). Simulation of heat and mass transfer in spray-drying. PhD thesis, Wageningen
Agricultural University, TheNetherlands.
Liou, J.K. (1982). An approximate method for nonlinear diffusion applied to enzyme inactivation during
drying. PhD thesis, Wageningen Agricultural University, The Netherlands.
Livesly, D.M., Gillespie, R.F., Veoman, ML., Oakley, D.E., Elhaus, B., Ranpuria, C.K., Taylor, T. and
Wood, W. (1992). Development and validation ofa computational model for spray-gas mixing in spraydryers. InDrying '92,ed. A.S.Mujumdar, Elsevier, Amsterdam, pp407-16.
Loncin, M. (1980). Diffusion phenomena in solids. In Conference Proc. 2nd Int. Congress on Eng. and
Food, eds.P.Linko etal.,Applied SciencePublishers, London, pp354-63.
Luikov, A. (1968). Analytical heat diffusion theory. AcademicPress, London.
Luyben, K.Ch.A.M, Liou, J.K., and Bruin, S. (1982). Enzyme degradation during drying. Biotechnol. and
Bioeng., 24, 533-52.
Luyben, K.Ch.A.M., Olieman, J.J. and Bruin, S. (1980). Concentration dependent diffusion coefficients
derivedfrom experimental dryingcurves. InProc.2nd Int. Symp.onDrying,Montreal, pp233-43.
Menting, L.C. (1970) Diffusion coefficient of water and organic volatiles in carbohydrate-water systems. J.
Food Technol., 5, 111-26.
Press, W.H., Flannery, B.P., Teukolsky, S.A. and Vetterling, W.T. (1989). Numerical recipes in pascal.
Cambridge Univ.Press.
Ranz, W.E. and Marshall, W.R. (1952).Evaporation from drops.Part I and II. Chem. Eng. Progr., 48, 1416, 173-80.
Riede, T.T. and Schlunder E.U. (1988). Evaporation and pervaporation of a binary mixture from an inert
carrier liquid. Chem. Eng. Technol., 11,384-91.
Sano, Y. and Keey, R.B. (1982). The drying of a spherical particle containing colloidal material into a
hollow sphere. Chem. Eng. Sci., 37,881-9.
Schoeber, W.J.A.M. (1976). Regular regimes in sorption processes. PhD thesis, Technical University
Eindhoven, The Netherlands.
Toei, R., Okazaki M. and Furuta, T. (1978). Drying of a non-supported droplet. In Proc. 1st Int. Drying
Symp.,Montreal, pp53-8.
117
References
118
Tong,D.H. andLund, D.B. (1990).The effective moisture diffusivity in porous materials as a function of
temperatureandmoisturecontent.Biotechnol.Prog.,6, 67-75.
Tomazic, S.J. andKlibanov, A.M. (1988a).Mechanisms ofirreversible thermal inactivation ofbacillus aamylase.J.Biol.Chem.,263,3086-91.
Tomazic, S.J. and Klibanov, A.M. (1988b). Why is one bacillus a-amylase more resistant against
irreversiblethermo-inactivationthananother?J.Biol.Chem.,263,3092-6.
Toor,H.L. (1964).Solution ofthelinearized equationsofmulticomponent masstransfer: I. AIChEJ., 10,
448-55.
Toor, H.L. (1964). Solution of the linearized equations of multicomponent mass transfer: II. Matrix
methods.AIChEJ., 10, 460-65.
Trommelen,A.M.andCrosby,E.J. (1970).Evaporation anddryingofdropsin superheatedvapors.AIChE
J., 16, 857-67.
Verhey, J.P.G. (1973). Vacuole formation in spray powder particles. 3. Atomization and droplet drying.
Neth.MilkDairyJ.,27, 3-18.
Verhey, J.P.G. (1972). Vacuole formation in spray powder particles. 2. Location and prevention of air
incorporation.Neth.MilkDairyJ.,26, 203-24.
Violet, M. and Meunier, J. (1989). Kinetic study of the irreversible thermal denaturation of Bacillus
licheniformisa-amylase.Biochem J.,263,665-70.
Wallack, D.A. (1988). Stickiness and morphological development during drying of drops. PhD thesis,
UniversityofCalifornia,Berkeley.
Wallack, D.A., El-Sayed, T.M. and King, C.J. (1990). Changes in particle morphology during dryingof
dropsofcarbohydrate solutionsandfood liquids. 2.Effects on drying rate. Industrial Engineeringand
ChemistryResearch,29, 2354-57.
Walstra,P.andJennes,R.(1984).DairyChemistryandPhysics.JohnWiley,NewYork,pp304.
Wesselingh,J.A.andKrishna,R.(1990).Masstransfer. EllisHorwood,Chichester,England.
Wijlhuizen, A.E., Kerkhof, P.J.A.M. and Bruin, S. (1979). Theoretical study of the inactivation of
phosphataseduringspray-dryingofskim-milk.Chem.Eng.Sci.,34, 651-60.
Yamamoto,S.,Agawa,M.,Nakano,H.and Sano,Y.(1985).Enzymeinactivationduringdryingofasingle
droplet.Indrying '85,eds. R.ToeiandA.S.Mujumdar.Hemisphere,Washington,pp330-7.
Yamamoto, S. and Sano, Y. (1992). Drying of enzymes: the enzyme retention during drying of a single
droplet.Chem.Eng.Sci.,47,177-83.
Zimmerman, K. (1987).Einflussparameter und mathematisch modellierung der schonende trocknungvon
starterkulturen.Fortschr.-Ber.,VDIReihe 14,Nr.36,VDI,Dusseldorf.
SUMMARY
The spray-drying of liquid foods is an important unit operation in the food industry. In
spray-dryers the fluid is atomised and brought into contact with hot air. Spray-dryers are
mostly operated in the food industry inthe co-current mode to avoid heat deterioration of
the drying product. 'Overall' dryer models are still inthefirststage of development, despite
the importance of spray-drying. These models can be used to improve design and
performance ofthedryer. Essential partsof such'overall'modelsaremodelsthat predict the
dryingkineticsofdropletsandthefinalproduct quality.
In recent years a model hasbeen developed which describes the drying kinetics ofliquid
food droplets. The model is based on the effective diffusion coefficient concept and it
assumesthat aliquidfood canbeconsidered asabinarysystem,withwater and dry solidsas
thetwo components. This drying model can be integrated with a reaction kinetics model to
predict the (bio-) chemical product quality. To validate the drying model experimental
conditions are used in literature which are very different from conditions during spraydrying.
The aims of the research described inthisthesis are: (1) to validate the existing droplet
drying kinetics model under spray-drying conditions, (2) to investigate the possibility to
predict a(bio-) chemicalproduct quality changeduring spray-drying, and (3)to examinethe
validity of the assumption that a drying liquid food droplet can be considered as a binary
system. In that case segregation of the dissolved dry solids components does not occur. To
reach these goals the droplet drying kinetics model has to be extended to include reaction
ratesandmulticomponent diffusion.
A specially designed drying apparatus has been developed to perform droplet drying
experiments under spray-drying conditions. This equipment consists of two main parts: a
resonance nozzle and a drying tower. The resonance nozzle is capable of producing small
equally sized (uniform) droplets. Thedrying tower isdesigned in such away that the drying
conditionsareuniform andcomparablewith spray-dryingconditions.
The droplet drying experiments are performed on two levels, on the level of 'large'
suspended droplets ( ^ « l c m ) and on the level of 'small' free falling droplets
(dd * 0.02cm). The experiments with the free falling droplets are performed in the drying
tower. The droplet drying kinetics experiments are performed with maltodextrin solutions
and skim-milk.
120
Summary
The inactivation of the enzyme a-amylase during drying is studied as an example of a
biochemical product quality parameter. Theactivity ofenzymescanbe reduced significantly
during drying. Maltodextrin is used as support material. To predict the inactivation of aamylase during drying, the thermal inactivation kinetics is determined at different water
concentrations. The inactivation kinetics oftwo a-amylases, which differ in thermostability,
isdetermined becauseofthelarge difference inthe characteristic drying times ofthe droplet
drying experiments. The inactivation rate decreases at low water concentrations. The
inactivation kineticscanbedescribed byasimplefirstorderArrhenius-typemodel.
Inthe suspended droplet experimentsthe change intime ofthewater concentration and
thedroplettemperature aswellastheresiduala-amylase activityismeasured. Themeasured
valuesarecompared withmodel simulations,andagood agreement isfound.
Inthefreefalling droplets experiments the change ofthe water concentration aswell as
oftheresiduala-amylase activityismeasured asfunction ofthe falling distance. Comparison
of model simulations with experimental data reveals that the drying rate as well as the
inactivation rate is overestimated. In the model simulations it is assumed that the air
condition inside the spray equals the air condition outside the spray. Air temperature
measurements show that this assumption is not valid. Simulations with an adapted droplet
drying model result in an improved description of the drying rate as well as of the
inactivation rate.
Slab drying experiments with a ternary food model system (water, sucrose and sodium
caseinate)areperformed totesttheassumption that liquid foods canbeconsidered asbinary
systems. The concentration profiles of the different components are measured and it is
determined that segregation ofthe solutes can occur during drying. Theratio of the sodium
caseinate and sucrose concentrations near the surface increases, inthe centre of the slabthe
ratiodecreases.Thisphenomenon iscausedbythelargedifference inthediffusivities ofboth
solutes. To describe this segregation a ternary drying model is developed. This model is
based on the generalised Maxwell-Stefan equations. A good agreement is found between
model simulations and experimental data. The diffusion coefficients used in the model
simulationsareestimated from thedryingexperiments.
To examine the effect of the droplet spray-air mixing pattern in a spray-dryer on the
residualenzymeactivity,model simulationsareperformed using different 'idealised' spray-air
mixingpatterns. Theresultsrevealthat the residual enzymeactivity isstrongly influenced by
the prevalent spray-air mixing pattern in the spray-dryer. Model simulations using the
ternary drying model show that also during spray-drying segregation of solutes can be
expected, however, the extent is strongly influenced by the initial dry solids content. A
higherinitialdrysolidscontent resultsinlesssegregation.
SAMENVATTING
Het sproeidrogen van vloeibare levensmiddelen is een belangrijke bewerking in de
levensmiddelenindustrie. In een sproeidroger wordt vloeistofverneveld enmet hete luchtin
contact gebracht. De droger wordt meestal in meestroom bedreven om hittebeschadiging
vanhet produkt tevoorkomen.Modellen diehet gehele sproeidroogproces beschrijven zijn,
ondanks het belang van sproeidrogen, nog in ontwikkeling. Dergelijke modellen kunnen
worden toegepast om het ontwerp en de bedrijfsvoering van de droger te verbeteren.
Essentiele onderdelen van een sproeidroogmodel zijn modellen die de droogkinetiek van
druppelsenderesulterende produktkwaliteit voorspellen.
In het recente verleden is een model ontwikkeld dat de droogkinetiek van druppels
beschrijft. Het model veronderstelt dat een vloeibaar levensmiddel kan worden opgevat als
eenbinair systeemmetalscomponenten water envastestof.Tevenswordt aangenomen dat
het interne watertransport kan worden beschreven met een 'effectieve' difrusiecoefficient.
Dit model kan worden gei'ntegreerd met reactiekinetiek-modellen om de (bio-) chemische
produktkwaliteit te voorspellen. In experimenten om het droogkinetiekmodel te verifieren
zijn in de literatuur omstandigheden gebruikt die sterk verschillen van de condities tijdens
sproeidrogen.
De doeleinden van het in dit proefschrift beschreven onderzoek zijn: (1) valideren van
het bestaande droogkinetiekmodel voor druppels onder sproeidroog-omstandigheden, (2)
nagaan ofhet mogelijk is om de verandering van (bio-) chemische produktkwaliteit tijdens
sproeidrogen te voorspellen, en (3) onderzoeken of de veronderstelling terecht is dat een
drogendvloeibaar levensmiddel opgevatkanworden alseenbinair systeem;ontmengingvan
devaste-stof-componenten zal dan niet plaatsvinden. Omdeze doeleinden te bereiken moet
het droogkinetiekmodel worden uitgebreid met zowel reactiekinetiekmodellen als
multicomponentdifrusie.
Er is een droogapparaat ontwikkeld om droogexperimenten te kunnen uitvoeren met
druppels onder sproeidroog-omstandigheden. Het apparaat bestaat uit een tweetal
hoofdonderdelen: een resonantie-verstuiver en een droogtoren. De resonantie-verstuiver is
in staat om kleine druppels van gelijke grootte te produceren. De droogtoren is zodanig
ontworpen datdedroogcondities overalgelijk zijn entevergelijken zijn met deconditiesbij
sproeidrogen.
De droogexperimenten met de druppels zijn zowel uitgevoerd met 'grote' druppels
(diameter is 1cm) als met 'kleine'druppels (diameter is 0.02 cm).De experimenten met de
'kleine' druppels zijn uitgevoerd in de droogtoren. Maltodextrine oplossingen en magere
melkzijngebruikt alsmodelmateriaal.
122
Samenvatting
De activiteit van het enzym a-amylase is gebruikt als voorbeeld van een biochemische
kwaliteitsparameter. De activiteit van enzymen kan sterk afhemen tijdens drogen.
Maltodextrine isgebruikt alsdragermateriaal. Omderestactiviteit vana-amylase na drogen
te kunnen voorspellen, is de thermische inactiveringskinetiek bepaald bij verschillende
vochtgehalten. De inactiveringssnelheid neemt af bij lage waterconcentraties. De
inactiveringskinetiek kan worden beschreven door een eerste-orde-model. De temperatuuren vochtafhankelijkheid van de inactiveringsconstante is gemodelleerd met behulp van een
Arrhenius-achtige vergelijking.
Indeexperimenten metde'grote'druppelszijntijdenshet droogproceshetwatergehalte,
dedruppeltemperatuur enderesterendea-amylase-activiteitgemeten.Degemeten waarden
zijnvergeleken metmodelsimulaties, eneengoedeovereenstemming isgevonden.
In de experimenten met de 'kleine' druppels is dewaterconcentratie en de resterende aamylase-activiteit gemeten bij verschillende valafstanden. Vergelijking van modelsimulaties
met experimentele waarden laat zien dat zowel de droog- als de inactiveringsnelheid wordt
overschat. In de modelsimulaties wordt verondersteld dat de luchtcondities in de
druppelnevel gelijk zijn aan de luchtcondities buiten de druppelnevel. Metingen van de
luchttemperatuur laten zien dat die aanname niet terecht is. Simulaties met een aangepast
droogmodel geven een betere beschrijving van zowel de droogkinetiek als de enzyminactivering.
Droogexperimentenmetlaagjes, bestaande uit eenwaterige oplossing van saccharoseen
natriumcasei'naat, zijn uitgevoerd om na te gaan of vloeibare levensmiddelen beschouwd
kunnen worden als binaire systemen. De concentratieprofielen van de verschillende
componenten zijn gemeten en het blijkt dat ontmenging van vaste-stof-componenten kan
optreden tijden drogen. De verhouding tussen de natriumcasei'naat- en
saccharoseconcentratie neemttoeaanhet oppervlak, enneemt afinhet middenvandelaag.
Dit verschijnsel wordt veroorzaakt doordat de diffusiecoefficienten van beide componenten
sterk verschillen. Er is een ternair droogmodel ontwikkeld om deze ontmenging te
beschrijven. Het model is gebaseerd op de algemene Maxwell-Stefan-vergelijkingen. Het
model blijkt in staat te zijn om de experimentele concentratieprofielen goed te beschrijven.
De in het model gebruikte diffusiecoefficienten zijn geschat met behulp van de resultaten
vande droogexperimenten.
Gegeven het ontwerp van een sproeitoren zal de druppelnevel na verstuiving op een
bepaalde wijze worden opgemend met de drooglucht. De invloed daarvan op de
enzymactiviteit na sproeidrogen is door het uitvoeren van modelsimulaties nagegaan. De
resultaten laten zien dat de restactiviteit sterk wordt bei'nvloed door het type mengpatroon.
Modelsimulaties met het ternaire droogmodel geven aan dat ontmenging ook kan optreden
tijdens sproeidrogen. De mate van ontmenging is echter afhankelijk van het
beginvochtgehalte;hoelagerhetbeginvochtgehalte, desteminderontmenging.
Curriculum vitae
Gerrit Meerdink werd op 2 november 1954 te Winterswijk geboren. Hij behaalde in
1972 het diploma HBS-B. In hetzelfde jaar begon hij aan zijn studie Chemische
Technologie aan de Universiteit Twente. Deze studie werd in 1979 met het afleggen
van het ingenieursexamen afgerond. Vanaf 1 augustus 1980 tot en met September
1982 was hij werkzaam bij de Vakgroep Proces- en milieubeheer van de Universiteit
Twente. Op 1 januari 1983 trad hij in dienst bij de Sectie Proceskunde van de
Landbouwuniversiteit Wageningen, eerst als promovendus en vanaf 1986 als
universitair docent.
© Copyright 2026 Paperzz