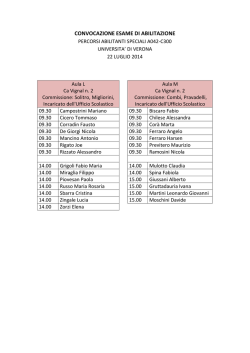
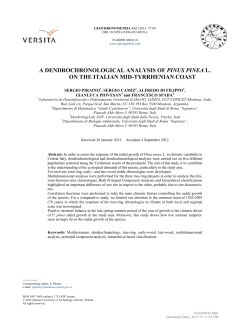
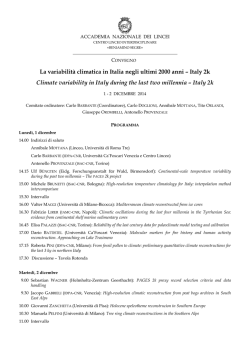
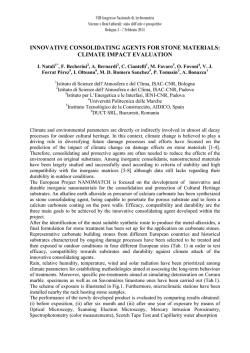
Acta Oecologica 27 (2005) 197–210
www.elsevier.com/locate/actoec
Original article
Spatial and altitudinal bioclimatic zones
of the Italian peninsula identified from a beech (Fagus sylvatica L.)
tree-ring network
Gianluca Piovesan a,*, Franco Biondi b, Mauro Bernabei c,
Alfredo Di Filippo a, Bartolomeo Schirone a
a
DAF (Department of Technologies, Engineering, Sciences of the Environment and Forests), University of Tuscia, Via S. C. de Lellis,
I-01100 Viterbo, Italy
b
Department of Geography, University of Nevada, Reno, NV 89557-0048, USA
c
CNR-IVALSA/PAT, Via Biasi 75, I-38010 San Michele All’Adige (Trento), Italy
Received 30 June 2004; received in revised form 12 November 2004; accepted 20 January 2005
Available online 02 March 2005
Abstract
A network of 24 beech (Fagus sylvatica L.) tree-ring chronologies has been developed for the Italian peninsula. Principal component and
cluster analyses were used to identify geographical and altitudinal patterns of tree growth. Correlations and response functions were then
applied to the main modes of tree-ring variability to uncover climatic signals. In a landscape occupied by humans for millennia, this approach
provided a detailed quantitative ecological characterization of forest types. Altitude was significantly correlated with dendrochronological
parameters. The Alps and northern Apennines could be distinguished from the central-southern Apennines. In central Italy, we recognized
three different vegetation belts occupied by beech forests, from low- to high-elevation sites. Summer drought impacted beech growth with
different intensity at different elevations, depending on the onset and duration of the growing season. Moreover, low-elevation beech forests
showed a distinct late spring climate signal, which was opposite to that of high-elevation sites. The coherent geographical and ecological
patterns of tree-ring variability suggest that dendrochronological networks help define bioclimatic zones and forest types.
© 2005 Elsevier SAS. All rights reserved.
Keywords: Dendroecology; Dendroclimatology; Tree growth; Phytoclimate; Italy; European beech
1. Introduction
The prediction of long-term climate effects on ecosystems
requires a deep historical understanding because Earth’s surface features are products of the natural and cultural processes that have shaped them over time (Jackson et al., 2001).
Dendrochronology is most useful for defining the historical
range of variability of tree growth-climate relationships at
multiple temporal and spatial scales (Swetnam et al., 1999).
Indeed, fine-scale networks of multi-century tree-ring chronologies based on climatically sensitive species have been
used to disentangle local, regional, and global phenomena
* Corresponding author.
E-mail address: [email protected] (G. Piovesan).
1146-609X/$ - see front matter © 2005 Elsevier SAS. All rights reserved.
doi:10.1016/j.actao.2005.01.001
(Briffa et al., 2002a; 2002b). In addition, common growth
patterns between forest stands reflect ecologically and climatologically homogeneous territories, and can be used to characterize vegetation types along horizontal and vertical gradients (Cook et al., 2001). Dendroclimatic studies reveal not
only the main climatic signals embedded in xylem layers, but
also the temporal stability of climate-tree growth relationships (Briffa et al., 1998; Biondi, 2000). Because tree-ring
records can disclose trends in growth due to environmental
driving forces, they should also be considered powerful tools
for assessing changes in productivity of both coniferous
(Biondi, 1999; Mäkinen et al., 2002) and deciduous (Cullen
et al., 2001; Dittmar et al., 2003) tree species.
Numerous studies have revealed the sensitivity of European beech (Fagus sylvatica L.) to climatic variations in terms
198
G. Piovesan et al. / Acta Oecologica 27 (2005) 197–210
of growth and reproduction responses (Eckstein and Frisse,
1982; Biondi, 1993; Power, 1994; Piovesan and Adams, 2001;
Stribleya and Ashmore, 2002; Nielsen and Jørgensen, 2003).
Beech is a late-successional species widely distributed in
European temperate forests, growing in environments little
affected by wildfires. Its broad geographical range, which
spans more than 20° latitude, 30° longitude, and 1500 m altitude (Fenaroli and Gambi, 1976), presents an interesting
opportunity to examine the growth response of this species to
a range of climatic regimes. Beech stands in Europe have
commonly been managed following high-forest silvicultural
systems so that stands with trees older than a century are not
uncommon over the landscape (Dittmar et al., 2003). Even in
areas of intense, millennia-long human presence, nuclei of
old-growth beeches still remain today, and such stands have
allowed the construction of multi-century tree-ring chronologies (Biondi, 1992; Bourquin-Mignot and Girardclos, 2001;
Piovesan et al., 2003). Because of its longevity, widespread
distribution, and climatic sensitivity, beech is a most promising species not only for tree-ring networks, but also for
biomonitoring programmes on the status of European temperate forests. Beech growth patterns at the continental scale have
already been used to identify distinct regional and altitudedependent growth-limiting factors (Ellenberg, 1988; Dittmar
et al., 2003). In the Italian peninsula, previous research
revealed a latitudinal gradient in beech tree-ring records consistent with climatic features (Biondi and Visani, 1996).
Italian beech forests are present over several phytoclimatic regions, from the Mediterranean region, at the southern latitudinal limit of the species, to the beginning of boreal
forests (Pignatti, 1998). The ecological gradients present in
cold temperate (Alps) and Mediterranean climates (Apennines and Mount Etna) offer the possibility to study growthcontrolling factors of beech, and to use its response to climate for identifying latitudinal and altitudinal zones of
vegetation. For instance, in the Apennines beech extends over
a 1400-1500 m altitudinal interval, from hilly lowlands (300400 m a.s.l.) to high-elevation forests (1800-2000 m a.s.l.).
Using phytosociological analysis, beech forests in the Alps
and northern Apennines have been described as AbietiFagion, Eu-Fagion, Cephalanthero-Fagion, and LuzuloFagion, whereas the syntaxonomic unit Geranio versicolorisFagion was proposed for southern Italy (Pignatti, 1998).
However, beech ecological patterns and processes (such as
productivity) need to be examined within a quantitative
regional framework in order to describe their forcing factors.
Tree-ring networks can offer an accurate ecological characterization of beech forests, providing useful information
towards a sustainable, science-based management of these
natural resources. In this article, we analyse an Italian network of 24 Fagus sylvatica tree-ring chronologies with the
objective to uncover the principal modes of growth variability. Such modes are then used to identify latitudinal and
altitudinal zones depending on climate and geographic location.
2. Materials and methods
2.1. Beech tree-ring network
The tree-ring network is a combination of beech chronologies developed over the past 15 years (Biondi, 1992; Schirone et al., 2002). Sampling sites are distributed throughout
Italy (beech is absent in Sardinia), from 39.9° to 46.1° N and
from 9.3° to 16.2° E (Fig. 1, Table 1). The main network
features are: a) distribution over the entire peninsula, with
higher density in central Italy; b) broad elevational range, from
low hills to high mountains; c) presence of old trees within
forest stands with no intense human disturbance in the recent
past. A total of 24 chronologies are distributed from the Alps
to the southern Apennines, at elevations ranging between
about 450 m and 1900 m a.s.l. Although sampled sites are
more numerous in central Italy (17 chronologies), site conditions vary in terms of topography, substrate, soil, and associated species. Sampled stands could not be considered free
from past human influence, although several of them show
no signs of logging. Numerous sites were also located in forested areas not easily accessible or set aside several decades
ago for conservation purposes as parks and natural reserves.
At least one location (Val Cervara, which includes VCL and
VCH; Fig. 1 and Table 1) is representative of old-growth patterns and processes in Apennine beech forests (Piovesan et
al., 2005), and sampled trees reach the maximum age reported
for the species, up to 500 years (Biondi and Visani, 1996;
Piovesan et al., 2003).
The tree-ring network covers climate regimes from cold
temperate to Mediterranean (Essenwanger, 2001). Each site
was catalogued according to Mayr-Pavari’s classification (De
Philippis, 1937), which identifies five phytoclimatic zones by
means of the dominant tree species. Every zone is climatically defined, and further divided into sub-zones and types,
as shown in Table 2 for northern, central, and southern Italy.
The stands we sampled belong to the Castanetum and Fagetum zones. Tree selection focused on predominant, dominant or codominant trees, either isolated or grouped, with the
best combination of old age and trunk health. Trees were
sampled at breast height (about 1.3 m from the ground) using
increment borers. A few samples were taken from downed
trees either with an increment borer or with a chainsaw. Maximum age, stem diameter and height of trees were used as
indicators of forest structure. Maximum age computed from
the number of visible rings underestimates beech longevity
because increment cores were taken at breast height and most
cores did not include the stem pith. Also, if stands have not
reached old-growth status, such structural indicators do not
describe species potential in relation to the environment, but
only actual stand conditions (Peterken, 1996).
Tree-ring chronologies were developed from wood samples
using standard dendrochronological procedures (Stokes and
Smiley, 1996). After surfacing and crossdating, tree-ring
widths were measured to the nearest 0.01 mm using a sliding
stage micrometer interfaced with a personal computer. After
G. Piovesan et al. / Acta Oecologica 27 (2005) 197–210
199
Fig. 1. Map of collection sites. Site codes are the same as in Table 1, the only difference being that VCE includes both VCL and VCH. The enlarged area shows
the location of central Italy sites (called L-A in the text).
measuring, tree-ring series were statistically compared with
each other to ensure accuracy of crossdating and measurement (Holmes, 1983). Locally absent rings, when detected,
were given ring-width equal to zero. The dated ring-width
series were standardized and averaged to produce a tree-ring
chronology for each site (Fritts, 1976), as follows:
i=nt
共w
兺
i=1
0.5
It =
nt
− y 兲 it
+ c it
with Īt = chronology value at year t; nt = number of samples
for year t; w = crossdated ring width of sample i in year t;
y = value of sample i in year t computed by fitting a modified
negative exponential with asymptote ≥ 0 or a straight line
with slope ≤ 0 to the i ring-width series; cit = constant added
to sample i in year t so that the standardized chronology has
mean equal to 1. The standardized chronologies were then
prewhitened by fitting autoregressive (AR) models (Box and
Jenkins, 1976) to the period 1925-1988, which represents the
common overlap among chronologies. The order of the AR
model was chosen according to a combination of criteria,
including the partial autocorrelation function, significance of
AR model parameters, Akaike Information Criterion, and
residual autocorrelation function (Biondi and Swetnam, 1987;
SAS Institute Inc., 2000).
The level of common growth variation among different
trees of the same site was quantified by the mean correlation,
first principal component, percentage of agreement coefficient or GLK for “Gleichläufigkeitswert” (Eckstein and
Bauch, 1969), and Baillie-Pilcher’s t-test (Baillie and Pilcher,
1973) over the period 1925-1988. Hierarchical cluster analysis (Ludwig and Reynolds, 1988) was used for detecting subdivisions among the 24 prewhitened site chronologies. Distance between variables was based on the Pearson productmoment correlation coefficient; clusters were then identified
by means of the average distance between all pairs of variables contained in them (Wilkinson, 1997).
Principal components analysis, or PCA (Jolliffe, 1986) was
performed on the correlation matrix of the 24 prewhitened
beech site chronologies for the period 1925-1988. Principal
component loadings (or eigenvectors), which display the pattern of association between chronologies, were employed to
detect groupings in the tree-ring network. Principal component scores (or amplitudes) were used to represent growth
fluctuations over time, and to investigate their relationship
with synoptic climate data (see section 2.2. on “Climategrowth relationships”). The PCA was then similarly applied
to the sub-set of 17 chronologies from central Italy (called
L-A for Latium-Abruzzi), where the higher density of the
network (Fig. 1) allows for finer spatial (i.e., latitudinal and
altitudinal) detail. Selection of principal components was
200
Table 1
Summary information on sampled sites and tree-ring chronologies for each region 1
REGION
SITE
ID
LATITUDE
(°)
LONGITUDE
(°)
ELEVATION
(m a.s.l.)
SLOPE
%
TREE
CORE
DBH
(cm)
H
(m)
PERIOD*
LENGTH* Nmax
years
A - Southern Italy
Foresta Umbra
FOU
41.7667
16.0000
750 (720-770)
0-15
3
6
108-151
31
1852-1988
137
Parco del Pollino
PPO
39.9333
16.2333
1900 (1800-2000)
20-40
4
8
74-121
25
1783-1988
206
299
Oriolo Romano
ORI
42.1583
12.1392
450 (400-500)
5-45
26
26
45-90
35
1905-2002
98
106
C - Central Italy
(Abruzzi)
D - Northern Apennines
E - Alps
Monte Fogliano
FOG
42.3285
12.1440
750
5-30
20
26
45-95
35
1869-2002
134
198
Monte Venere
VEN
42.3434
121851
800
5-35
36
37
30-85
32
1871-1996
126
133
Monte Cimino
CIM
42.4181
12.2350
950
0-35
70
101
35-100
41
1813-2000
188
193
Sabina
SAB
42.3383
12.6697
1050
5-40
25
45
40-65
32
1784-1995
212
227
Monti Lepini
LEP
42.6047
13.0839
1250
20-35
21
21
44-65
30
1827-2001
175
181
Monte Petrella
PET
41.2178
13.5681
1375
0-30
22
23
41-73
27
1925-2000
76
84
Monte Terminillo
TER
42.5000
13.0000
1650 (1550-1750)
5-60
20
20
42-69
32
1697-2000
304
307
Rosello
ROS
41.9008
14.3497
1000
10-55
11
11
30-61
28
1876-1997
122
136
Majella
MAI
42.1333
14.1333
1150 (1110-1190)
65-70
4
7
62-64
13
1901-1988
88
140
Morino
MOR
41.8639
13.4581
1250
0-50
20
25
40-70
37
1766-1997
232
288
Bosco S. Antonio
BSA
41.9000
14.0500
1350 (1320-1375)
0-20
9
17
59-123
30
1879-1988
110
210
Monti Pizi
PIZ
41.9214
14.2372
1400 (1350-1450)
0-60
32
32
40-83
30
1901-2001
101
107
Valle Cervara low
VCL
41.8690
13.6230
1350 (1200-1500)
0-55
21
21
55-102
32
1581-2001
421
435
Tocchito
TOC
41.9842
14.1381
1600
5-30
21
21
41-71
24
1875-2001
127
138
Parco d’abruzzo
PNA
41.7667
13.8333
1600 (1290-1895)
0-53
22
48
69-261
34
1670-1988
319
319
Valle Cervara high
VCH
41.8690
13.6230
1725 (1600-1850)
5-55
32
37
55-100
32
1523-2002
480
503
Badia Prataglia
BAD
43.8833
11.7000
1150 (991-1316)
20-80
13
25
43-136
30
1785-1988
204
335
Monte Scoperta
MSC
44.1333
11.0833
1200 (1185-1215)
44-68
8
17
40-63
21
1901-1989
89
90
191
Monte Barro
MBA
45.8333
9.3333
750 (750-765)
22-71
12
26
67-126
35
1855-1988
134
Cansiglio
CAN
46.0667
12.4333
1200 (1160-1265)
40-48
5
12
58-63
28
1885-1988
104
122
Valzurio
VAL
45.9333
9.9667
1450 (1430-1480)
20-27
8
16
82-139
24
1810-1988
179
197
* Site chronologies are made up of at least 3 trees-6 radii; 1DBH: Diameter at breast height; H: Mean height of the 3-4 tallest trees in the stand (stature); Nmax: Maximum number of rings counted on a single
specimen.
G. Piovesan et al. / Acta Oecologica 27 (2005) 197–210
B - Central Italy
(Latium)
184
G. Piovesan et al. / Acta Oecologica 27 (2005) 197–210
201
Table 2
Pavari’s phytoclimatic belts with related climatic features and altitudinal ranges in different regions. Tc: mean temperature of the coldest month, m: mean of the
absolute minimum temperatures (modified from De Philippis, 1937)
Zone
Subzone
Castanetum
Warm
Cold
Warm
Cold
Fagetum
Tmed
°C
10-15
10-15
7-12
6-12
Tc
°C
>0
> -1
> -2
> -4
m
°C
> -12
> -15
> -20
> -25
Southern Italy (A)
m a.s.l
600 to 800-900
800-900 to 1000-1200
1000-1200 to 1700
1700 to 2000
guided by the Kaiser-Guttman rule (Guttman, 1954; Kaiser,
1992).
Central Italy (B-C)
m a.s.l.
300-500 to 600-800
600-800 to 800-1000
800-1000 to 1500
1500 to 1800
Northern Apennines (D)
m a.s.l.
200-300 to 500-600
500-600 to 700-900
700-900 to 1200
1200 to 1600
Alps (E)
m a.s.l.
up to 300-400
300-400 to 700-900
700-900 to 800-1200
800-1200 to 1500-1600
3. Results
3.1. Characteristics of the tree-ring network
2.2. Climate-growth relationships
Climate-growth relationships were determined using both
dendroclimatic (Fritts, 1976) and synoptic (Barry and Carleton, 2001) procedures. Dendroclimatic correlation and
response functions (Blasing et al., 1984) were calculated
between principal component scores of prewhitened treering chronologies and monthly climate variables. The bootstrap method (Efron and Tibshirani, 1986; Guiot, 1991) was
used for computing and significance testing (Biondi and
Waikul, 2004). Explanatory climate variables spanned a
14-month window, from October of the current growth year
to September of the previous year. Since tree-ring chronologies had been prewhitened to remove time-series autocorrelation, possible vegetative lag effects from previous growing
seasons were not considered. Because of the higher density
of sites in central Italy, this dendroclimatic analysis was performed on the PCs of the 17 L-A chronologies. Climate was
quantified by monthly total precipitation (P) and monthly
mean air temperature data for the period 1928-1995 published by the Italian “Servizio Idrografico di Stato”. Thermal
variables consisted of mean temperature (Tmed), mean maximum temperature (Tmax), and mean minimum temperature
(Tmin). A total of 13 meteorological stations distributed
throughout the Latium and Abruzzi regions (latitude range:
41.20-42.57°N; longitude range: 11.87-14.37°E) were averaged to compute the monthly climate variables (Table 3). Each
station had records from 1928 to 1995, which also passed
data homogeneity tests (Fritts, 1976).
Synoptic analysis relied on correlation maps between principal component scores and gridded climate data (precipitation and temperature) available from the NCEP/NCAR
reanalysis for the period 1948-1988 (Kalnay et al., 1996).
Temperature signals at different elevations were studied by
means of correlation maps for three different atmospheric
pressure levels, i.e. 1000 mb, 925 mb, and 850 mb. Correlation maps were drawn for the region covering 6-19°E longitude and 36-48°N latitude when studying the climate significance of the entire tree-ring network. Such area includes all
of Italy, the surrounding seas, and nearby Mediterranean environments (Fig. 1). Correlation maps were also drawn for the
central Italy region when principal component scores were
particularly relevant for the Latium-Abruzzi (L-A) area.
A total of 465 trees and 628 cores were used to compute
tree-ring chronologies (Table 1). The 24 site chronologies are
from 76 to 480 years in length, with maximum tree ages ranging from 84 years at Monte Petrella to 503 years at Valle Cervara. Numerical features of tree-ring chronologies are summarized in Table 4. Significant correlations were found
between key dendrochronological parameters and the main
site and stand features (Table 5). Mean tree-ring width (MW)
is negatively influenced by elevation and chronology length,
which is determined by maximum tree age. Elevation and
chronology length are also negatively correlated to the standard deviation (SD) and to the first-order serial correlation
(A1) of the site chronology. Mean sensitivity (MS) is positively correlated to longitude over the whole network, and
positively to both elevation and maximum age when considering central Italy. Note that, in dendrochronology, sensitivity is the absolute difference between two adjacent tree-ring
values, scaled over their mean; mean sensitivity is the arithmetic average of sensitivity computed for an entire tree-ring
series. Mean sensitivity was originally defined by Douglass
(1920), and has been used as a synthetic measure of the yearto-year variability in a tree-ring series (Fritts 1976).
Elevation is related to chronology statistics because in Italy
the oldest beech trees are often found in the highest portion
of its altitudinal range, where tree rings tend to be narrower
Table 3
Geographical coordinates of the 13 meteorological stations that were averaged to compute monthly precipitation and temperature for the LatiumAbruzzi (L-A) region
Latium (L)
Abruzzi (A)
Gaeta
Latina
Roma C.R.
Tuscania
Poggio Mirteto
Viterbo
Subiaco
Leonessa
Sulmona
Avezzano
Palena
Agnone
Pescasseroli
Latitude
(°)
41.20
41.45
41.90
42.42
42.27
42.42
41.92
42.57
42.05
42.03
41.98
41.80
41.80
Longitude
(°)
13.58
13.10
12.48
11.87
12.68
12.10
13.10
12.97
13.92
13.43
14.13
14.37
13.78
Elevation
(m.a.s.l.
50
21
51
165
346
327
458
975
420
700
767
806
1150
202
Table 4
Statistics (mean followed by range in parentheses) for tree-ring chronologies 1
CHRONOLOGY
MW
SD
(0.01 mm)
(0.01 mm)
MS
A1
LAR
N
ACBT
%
PC1
GLK
%
%
t BP
p
VAR
Foresta Umbra
177(164-192)
51.7 (61.1-73.8)
0.31 (0.25-044)
0.26 (0.13-0.72
0
3
0.41
63.2
70.3
6.68
4 (neg. 2nd)
35.6
Parco del Pollino
135(64-226)
30.6 (22.0-65.8)
0.20 (0.22-0.32)
0.41 (0.36-0.64)
0
3
0.32
54.2
65.0
3.25
2 (neg. 2nd)
24.0
Oriolo Romano
458(232-790)
101.5 (91.9-349.7)
0.16 (0.17-0.35)
0.64 (0.49-0.84)
0
24
0.50
53.0
66.3
5.07
3 (neg. 2nd)
38.6
289(154-442)
59.7 (49.0-213.9)
0.18 (0.16-0.41
0.53 (0.40-0.83
0
19
0.21
28.66
62.7
4.62
3 (neg. 2nd)
40.2
Monte Venere
198(57-368)
54.6 (18.8-183.4)
0.20 (0.23-0.56)
0.63 (0.39-0.88)
0.164
34
0.31
43.6
65.4
4.28
1
45.0
Monte Cimino
183(58-530)
42.9 (35.7-168.7)
0.21 (0.22-0.62)
0.43 (0.15-0.84)
0.067
59
0.35
42.0
64.1
4.92
3 (neg. 2nd)
29.4
Sabina
196(73-444)
62.7 (45.4-296.2)
0.23 (0.19-0.52)
0.65 (0.37-0.85)
0.071
11
0.47
50.4
68.9
4.986
3 (neg. 2nd)
58.6
Monti Lepini
179(61-318)
65.5 (37.8-166.9)
0.21 (0.21-0.42)
0.74 (0.44-0.94)
0.149
21
0.44
50.4
69.9
3.45
3 (neg. 2nd)
66.5
Monte Petrella
382(290-556)
111.5 (79.6-202.0)
0.14 (0.11-0.28)
0.78 (0.42-0.90)
0
22
0.56
63.8
63.3
3.67
1
69.3
20.9
Monte Terminillo
108(42-173)
33.4 (14.0-84.0)
0.31 (0.25-0.59)
0.43 (0.13-0.78)
0.313
20
0.53
50.2
71.9
7.12
1
Rosello
226(91-281)
52.5 (29.4-197.0)
0.20 (0.21-0.43)
0.53 (0.14-0.80)
0.145
25
0.24
37.5
67.9
3.44
3 (neg. 2nd)
44.7
Majella
132(81-212)
41.4 (24.1-89.8)
0.28 (0.25-0.51)
0.39 (0.37-0.59)
0
3
0.18
61.9
67.5
3.48
1
23.6
Morino
209(137-523)
42.0 (42.8-258.8)
0.18 (0.19-0.42)
0.46 (0.25-0.77)
0.066
18
0.39
40.5
69.8
4.05
3 (neg. 2nd)
39.0
Bosco S. Antonio
211(92-292)
73.3 (33.0-118.9)
0.27 (0.22-0.41)
0.56 (0.34-0.85)
0
9
0.61
78.1
77.8
7.21
3 (neg. 2nd)
28.5
Monti Pizi
254(140-366)
52.0 (50.8-190.1)
0.21 (0.17-0.43)
0.22 (0.17-0.68)
0
32
0.28
35.5
70.4
5.14
1
Valle Cervara low
138(92-226)
33.7 (30.2-134)
0.27 (0.17-0.42)
0.19 (0.18-0.76)
0.074
21
0.37
47.3
74.5
5.42
2 (neg. 2nd)
Tocchito
184(107-329)
45.0(32.5-92.2)
0.26 (0.23-0.45)
0.26 (0.17-0.68)
0.074
21
0.49
52.8
73.3
6.75
1
18.0
23.1
7.1
7.6
Parco d’Abruzzo
138(58-227)
34.7 (21.5-97.0)
0.24 (0.15-0.43)
0.33 (0.20-0.74)
0.081
17
0.30
42.1
64.9
3.91
4 (neg. 2nd)
Valle Cervara high
119(49-182)
29.0 (15.3-75.5)
0.28 (0.23-0.51)
0.12 (0.08-0.65)
0.338
32
0.41
45.5
68.9
5.06
3 (neg. 2nd)
18.3
Badia Prataglia
241(84-372)
45.9 (20.1-137.4)
0.14 (0.15-0.33)
0.49 (0.33-0.73)
0.067
12
0.29
45.9
61.3
3.84
1
19.1
17.5
Monte Scoperta
279(205-332)
68.0 (68.0-108.3)
0.23 (0.22-0.35)
0.29 (0.10-0.57)
0.099
8
0.52
61.7
66.9
7.90
2
Monte Barro
226(123-323)
44.1 (39.9-105.8)
0.15 (0.17-0.28)
0.60 (0.43-0.80)
0.068
12
0.31
36.8
60.7
2.97
1
41.5
Cansiglio
268 (199-320)
74.3 (72.6-111.2)
0.15 (0.17-0.28)
0.66 (0.55-0.73)
0
5
0.62
46.2
61.0
4.70
1
43.5
Valzurio
185 (114-308)
41.1 (44.8-120.6)
0.22 (0.23-0.46)
0.28 (0.03-0.56)
0.439
8
0.27
42.3
61.7
4.39
2 (neg.2nd)
21.6
1
MW: mean ring-width; SD: standard deviation; MS: mean sensitivity; A1: autocorrelation of first order; LAR: percent of the measured local absent rings; N: number of trees considered for the common period
analyses; ACBT: average correlation between trees; PC1: amount of variance explained by first principal component of the ring-width measures; GLK: mean percentage of agreement coefficient between trees;
t BP: mean value of Baillie-Pilcher t test between trees; p: order of the autoregressive model used to obtain the pre-whitened chronology; VAR: % of variance explained by AR model (period 1925-1988).
G. Piovesan et al. / Acta Oecologica 27 (2005) 197–210
Monte Fogliano
G. Piovesan et al. / Acta Oecologica 27 (2005) 197–210
203
Table 5
Correlation coefficients between chronology statistics (see Tables 1 and 3 for acronyms) and forest site features for (A) the 24 beech chronologies of the Italian
peninsula, and (B) the 17 chronologies of central Italy (bold: p <0.01; italic: p <0.05)
A
MW
SD
MS
A1
LAR
ACBT
PC1
GLK
t BP
p
B
MW
SD
MS
A1
LAR
ACBT
PC1
GLK
t BP
p
Latitude
Longitude
Elevation
DBHmax
H
LENGTH
Nmax
0.15
0.02
-0.32
0.07
0.28
0.05
-0.24
-0.52
0.01
-0.35
-0.29
-0.13
0.44
-0.24
-0.35
0.04
0.35
0.53
0.09
0.27
-0.55
-0.43
0.35
-0.43
0.34
0.14
0.15
0.27
0.09
-0.17
-0.23
-0.31
0.09
-0.29
0.03
-0.26
-0.06
-0.18
-0.11
0.40
0.11
-0.02
-0.21
0.17
-0.02
0.06
-0.46
-0.04
-0.05
0.43
-0.59
-0.61
0.41
-0.49
0.49
-0.09
-0.22
0.23
0.02
0.27
-0.59
-0.64
0.34
-0.46
0.37
-0.13
-0.16
0.20
-0.04
0.24
-0.22
-0.36
0.29
-0.11
0.18
-0.23
-0.28
-0.06
0.36
-0.04
-0.31
-0.24
0.35
-0.45
-0.04
-0.05
0.26
0.50
0.03
-0.18
-0.60
-0.47
0.61
-0.54
0.43
0.27
0.20
0.47
0.32
-0.19
-0.17
-0.21
0.11
-0.26
-0.07
-0.10
-0.06
-0.13
-0.01
0.49
0.15
-0.02
-0.31
0.06
0.14
0.15
-0.46
-0.19
0.12
0.55
-0.59
-0.63
0.53
-0.59
0.65
-0.13
-0.22
0.22
0.16
0.29
-0.60
-0.63
0.55
-0.59
0.58
0.05
-0.14
0.29
0.21
0.34
(Piovesan et al., 2005). Maximum age of beech trees almost
doubles going from low- to high-elevation stands (Table 1),
even though anthropic influences and management practices
probably contribute to this difference. Since old trees have
smaller ring widths, and MW is positively correlated to SD
(r = 0.87, p < 0.001), higher sites also tend to have lower yearto-year variability (Table 5). Locally absent rings were frequently observed at higher elevations and in older stands, but
significant correlation occurs with maximum age considering the central Italy chronologies.
Indices of common variability in tree-ring chronologies
were also correlated with measures of forest structure and
spatial location (Table 5). The amount of variance explained
by the first principal component of each site chronology was
negatively correlated with maximum tree height (H), possibly because in fertile sites climate becomes less limiting for
radial growth, and the among-trees coherence of ring-width
variability decreases. The GLK is correlated negatively to latitude and positively to longitude, suggesting that climate
affects beech growth to a greater extent going from north to
south and from west to east within the Italian peninsula.
Finally, a positive correlation exists between the order of the
fitted AR model and indicators of forest structure, i.e. maximum tree diameter and, especially, maximum tree height. This
is consistent with a similar relationship previously found
between order of the autoregressive model and tree age
(Biondi and Visani, 1996). For AR models of order > 1, the
second-order parameter estimate was negative in almost all
chronologies (Table 4), confirming the inverse link between
increments at 2-year intervals uncovered in other studies of
beech tree-ring records (Biondi, 1993; Biondi and Visani,
1996). Because flower primordia develop the year before
seeds are produced, and mast production can reduce radial
increment in mature beech trees (Holmsgaard, 1955; 1962),
the observed negative biennial autocorrelation is most likely
related to the interplay among tree growth, climate, and mast
production (Piovesan and Adams, 2001).
Groupings among tree-ring chronologies identified by cluster analysis were mainly consistent with geographic location,
so that sites near one another and at a similar elevation were
placed in the same group (Fig. 2). For instance, chronologies
ORI, FOG, and VEN were clustered together, with FOG and
VEN showing major affinity. These three sites belong to the
warm sub-zone of the Castanetum in northern Latium
(Table 2), and MBA, a northern Italy hilly site of the cold
Castanetum, shows more affinity with this cluster than with
any other one. Another cluster comprises PPO, TOC, TER,
PNA, and VCH, which belong to the cold Fagetum in central
and southern Italy. Major similarities were found between
PNA and VCH, and between PPO and TOC. The VCL is also
included in this group, although it is classified as warm Fagetum. A third cluster is the most numerous, and comprises
mainly chronologies from the warm sub-zone of Fagetum in
central Italy (CIM, SAB, BSA, PIZ, MOR, ROS, LEP, MAI
and PET). In this group, major affinity is found between BSA,
PIZ, MOR, ROS and LEP. The PET is slightly different, probably because of its proximity to the Tyrrhenian Sea (Fig. 1).
The FOU site, even if within the Castanetum zone, is linked
to this group. The FOU is located on Monte Gargano promontory, an isolated mountain descending to the Adriatic Sea
(Fig. 1) and characterized by altitudinally compressed vegetation belts (Falinski and Pedrotti, 1990). The MSC, BAD
and CAN constitute a fourth cluster made of stands of the
204
G. Piovesan et al. / Acta Oecologica 27 (2005) 197–210
Fig. 2. Hierarchical clustering dendrogram of the 24 beech prewhitened chronologies over the common period 1925-1988 (see Table 1 for explanation of
letter codes).
Fig. 4. PC1L-A (A) and PC2L-A (B) loadings plotted against altitude. Grey
scales refer to the regions in Table 1.
Fig. 3. Eigenvalues (% of explained variance) and eigenvectors (loadings) of the first two principal components for (A) the 24 beech chronologies, and (B) the
17 central Italy chronologies. Data are grouped in regions (see Table 1 for explanation of letter codes) from south (left) to north (right), and ordered inside each
group from lower (left) to higher (right) elevation.
G. Piovesan et al. / Acta Oecologica 27 (2005) 197–210
warm Fagetum in the northern Apennines and the Alps. The
VAL, which belongs to the cold Fagetum in the Alps, is isolated from any other cluster, showing no particular affinity
with the rest of the network.
For the common interval 1925-1988, the first two principal components accounted for 53.8% of the total variance in
the 24-chronology network (PC1 and PC2; Fig. 3A), and for
63.4% of the variance in the 17 chronologies from LatiumAbruzzi (PC1L-A and PC2L-A; Fig. 3B). The PC1 and PC1L-A
loadings are always positive, and reach the highest values for
mountainous sites in the central Apennines (Figs. 3 and 4A).
The PC2 and PC2L-A mainly separate the low-elevation sites
from the high-elevation ones (Figs. 3 and 4B). Principal component scores are almost identical for PC1 and PC1L-A, as
well as for PC2 and PC2L-A, with a linear correlation of
0.99 and overlapping time-series patterns (Fig. 5).
3.2. Radial growth-climate relationship
Dendroclimatic analyses focused on the Latium-Abruzzi
(L-A) region. The PC1L-A is correlated with current summer,
directly with precipitation and inversely with temperature,
205
especially maximum temperature (Table 6A). Another significant positive correlation exists with previous winter
(December) precipitation. Response functions confirmed the
central role of summer climate, especially during June and
July (Table 6B). The PC2 L-A, which contrasted low- and highelevation sites (Fig. 4B), was negatively correlated with late
spring precipitation (May-June) and positively correlated with
May-August temperature (Table 6A). Response functions
pointed to May temperature as the main climate signal
(Table 6B).
Synoptic analysis of the correlations between summer climate (precipitation and temperature) and PC1 scores showed
that central-southern Italy is the region most influenced by
summer climate (Figs. 6A and 7). December precipitation
was correlated to PC1 especially over the central-northern
Apennines (Fig. 6B). Correlation maps drawn separately for
different pressure levels (Fig. 7) indicated a stronger summer
temperature signal at 925 mb (~760 m a.s.l.) and 850 mb
(~1460 m a.s.l.), in agreement with the average elevation
(1200 m a.s.l.) of the network. Correlation between PC2L-A
and May temperature extends over the Italian peninsula, and
reaches its maximum in northern Latium (Fig. 8), where several low-elevation chronologies are located.
Fig. 5. Time series plot of the first two principal component scores for the whole Italian tree-ring network (24 chronologies, PC1 and PC2) and for the central
Italy sub-set (17 chronologies, PC1L-A and PC2L-A). (A) First principal component scores; (B) Second principal component scores.
206
G. Piovesan et al. / Acta Oecologica 27 (2005) 197–210
Table 6
Significant values (p <0.05) of bootstrapped (A) correlation, (B) response functions calculated between principal component scores of the chronologies of
central Italy and the regional climatology (period 1929-1988)
A
SEP
PC1L-A
PC2L-A
P
Tmed
Tmax
Tmin
P
Tmed
Tmax
Tmin
Year preceding growth
OCT NOV DEC
0.31
Jan
Feb
Mar
Apr
0.22
Year of growth
May
Jun
0.40
-0.26
-0.28
-0.29
0.41
0.42
0.34
-0.27
0.38
0.36
0.37
Jul
0.31
-0.30
-0.29
-0.29
Aug
0.28
-0.35
-0.36
-0.30
0.36
0.31
0.39
0.31
0.26
0.34
Jul
0.23
Aug
Sep
Oct
-0.25
B
SEP
PC1L-A
PC2L-A
P
Tmed
P
Tmax
P
Tmin
P
Tmed
P
Tmax
P
Tmin
Year preceding growth
OCT NOV DEC
0.20
Jan
Feb
0.22
0.27
4. Discussion
Despite the ecological complexity of Italian beech forests
(Pignatti, 1998), a number of patterns identified in the beech
tree-ring network are clearly related to geographical differences in climatic regimes. Hierarchical clustering and principal component analysis of tree-ring chronologies generated distinct beech forest types. For each of those types,
correlation between principal component scores and climate
data revealed the most important climatic signals and their
spatial extension. In agreement with previous studies (Biondi,
1992; Biondi and Visani, 1996; Dittmar et al., 2003), distinctive radial growth-climate relationships uncovered in the treering network are organized along altitudinal and latitudinal
gradients. With regard to latitude, central and southern forests were clearly separated from northern ones.
In central Italy, bioclimatic zones (Fig. 2) are distributed
along an elevation gradient, and agree with those (Castanetum and Fagetum) proposed by Mayr-Pavari (De Philippis,
1937). Three major types of beech forests could be distinguished: low-elevation, mountainous, and high-elevation.
Low-elevation beech forests (400-800 m a.s.l.) are typically
located on fertile (e.g., volcanic) soils, in foggy areas near
lakes (Vico and Bracciano). These stands can be ascribed to
the Castanetum belt, and to the phytosociological unit
Aquifolio-Fagetum (Pignatti, 1998). This association, with
abundant Ruscus aculeatus in the understory, has structural
and floristic affinities with other warm-temperate beech for-
Mar
Apr
Year of growth
May
Jun
0.21
0.27
0.20
0.26
0.22
0.22
Sep
Oct
0.21
0.26
0.20
0.22
ests (Peters, 1997). In these environments, beech trees leaf
out early in the spring, and are favoured by a wetter and cooler
May. Deciduous oak species in the Latium region display
similar climatic controls (Romagnoli and Codipietro, 1996).
The cardinal role of May climate on low-elevation beech forests has also been reported for central and eastern Europe
(Dittmar et al., 2003). This may help explain the significant
correlations between Alpine and central Apennine lowelevation chronologies.
Mountainous beech forests (from 1000 to 1400 m a.s.l.),
which are enclosed in the warm Fagetum belt of MayrPavari, belong to different syntaxa (e.g., Aquifolio-Fagetum,
Polysticho-Fagetum). In some cases, the vegetation is characterized by the occurrence of the evergreen Taxus baccata
(for instance, at sites LEP, MOR, ROS, PIZ; Fig. 1) and Abies
alba (e.g., site ROS) (see Laurent et al., 2004). In the cluster
analysis, those stands are grouped together (Fig. 2). Considering the limited geographic distance between them (Fig. 1),
it follows that patterns of tree-ring variability separated beech
vegetation types at a fine spatial scale. In this altitudinal belt,
trees leaf out at the beginning of May, when they are susceptible to the occurrence of late spring frost. However, the main
factor limiting radial growth is water deficit during the summer, especially June and July (Biondi, 1993; Piovesan and
Schirone, 2000). In the Apennines, this beech forest type
extends north, reaching the limit of the Mediterranean region
(Pignatti, 1998). Mountainous northern Apennines chronologies have greater affinities with the Alpine mountainous ones
G. Piovesan et al. / Acta Oecologica 27 (2005) 197–210
207
Fig. 6. Interpolated correlation maps between PC1 scores and (A) gridded
summer precipitation, (B) previous December precipitation.
than with those in central Italy. This result is consistent with
the phytosociological characters of beech forests in the northern Apennines and Alps (Pignatti, 1998). High-elevation beech
forests of central-southern Italy (from 1550 to 1800-2000 m
a.s.l.) can be ascribed to the cold Fagetum. This vegetation
type reaches elevations in excess of 2000 m a.s.l. on Mount
Etna in Sicily (Piovesan et al., unpublished data). These stands
are characterized by beech dominance in the overstory, and
by an impoverishment of herbaceous species (Schirone et al.,
in press). In southern Italy, PPO is well within the highmountain vegetation type.
The beech network, currently dominated by Apennine
mountainous beech forests, exhibits strong common variability of annual growth. As pointed out by other authors (Biondi,
1993; Biondi and Visani, 1996; Piovesan and Schirone, 2000;
Dittmar et al., 2003; Piovesan et al., 2003), summer drought
is the key climatic factor that affects beech growth, especially in central-southern Italy. The importance of summer
Fig. 7. Interpolated correlation maps between PC1 scores and gridded summer temperature at (A) 925 mb, (B) 850 mb.
drought as a bioclimatic indicator means that mountainous
sites in the central-southern Apennines fall within the Mediterranean region, although their climate is often classified as
temperate, as was recently done by Blasi et al. 1999. The
correlation maps between PC1 scores and summer temperature or precipitation delineated two regions, one Northern or
Continental, the other Central-Southern or Peninsular. This
is in agreement with vegetation (Pignatti, 1979) and climatic
studies (Brunetti et al., 2004), which draw a boundary approximately at the latitude of Monte Conero, near Ancona, where
the border between the Mediterranean and the temperate cold
region is also located (Daget, 1977; Pignatti, 1979). Our
results have therefore confirmed the northern Apennines as a
zone of transition between two bioclimatic types. In that
region, the positive response to December precipitation could
have an important role in synchronizing tree-ring variability.
208
G. Piovesan et al. / Acta Oecologica 27 (2005) 197–210
genetic diversity is indeed related to elevation (Sander et al.,
2000). During the last Ice Age, central-southern Italy was a
centre of refugia for temperate forest species (Tallis, 1990),
but the size of such refugia is not completely known, especially in relation to altitudinal gradients. Divergent occupation of space should affect the genetic diversity of populations, especially since the last Ice Age (Comps et al., 2001).
Further research is needed to clarify if the reported altitudinal pattern identified by our dendroecological approach has a
genetic component or if it is an expression of phenotypic plasticity of the species. In the latter case, beech could then be
considered an ideal bioindicator. In other words, tree-ring networks would result in a classification of forest types based on
quantitative ecology and life history parameters, and this classification would become the starting point for the selection of
material used in genetic and provenance studies.
Fig. 8. Interpolated correlation maps between PC2
May temperature at 925 mb.
L-A
scores and gridded
Winter precipitation, mediated by the NAO, contributes to
water availability during the growing season through soil
water recharging (Biondi, 1993), and may also affect the low
frequency component of tree-ring chronologies (Piovesan and
Schirone, 2000). Since network density is greatest in central
Italy, a more articulate analysis of climate relationships can
be provided for the Latium-Abruzzi (L-A) area.
In central Italy, PC2L-A revealed a gradual transition of
forest types along the altitudinal gradient, which spans
1275 m. This is consistent with published relationships
between climate and vegetation in the same region (Blasi et
al., 1999). Temperature is a key factor for explaining the differences between hilly and mountainous sites. Low-elevation
beech forests have a distinct late spring climate signal, which
is opposite to that of high-elevation sites. This opposite dendroecological behavior between low and high altitude beech
stands was previously observed in central Europe, where it
extends to summer months (Dittmar et al., 2003). Phenological observations have shown that beech growing season
decreases with increasing elevation (Lausi and Pignatti, 1972),
so that the role of May as the turning point between dormantbud bursting and growing period changes with elevation. During May at the lower-elevation sites, thanks to a higher temperature regime, trees have the crown completely developed,
so that a warm-dry late spring can cause water stress, while at
the upper-elevation sites mild temperatures are needed to protect the bud burst and foliage from late spring frost. Since
Italian climate is becoming warmer and drier (Brunetti et al.,
2004), future climatic influences on beech physiology could
be predicted using sophisticated phenological models
(Schaber and Badeck, 2003).
Genetic control has been proposed for time of leaf formation in beech (Borghetti and Giannini, 1982). However, a study
on genetic variability of 21 Italian populations of beech found
no association between allele frequencies and altitude
(Leonardi and Menozzi, 1995). In central Europe, beech
Acknowledgements
We wish to thank all the people (too many to be named
individually) who made possible the development of the Italian beech tree-ring network. Central Italy tree-ring chronologies were built with the partial support of the Italian Agency
for the Environment (APAT). Synoptic maps were produced
using the web site http://www.cdc.noaa.gov/Correlation/
index.html provided by NOAA-CIRES Climate Diagnostics
Center, Boulder, Colorado, USA. The comments of Franz-W.
Badeck and two anonymous reviewers are gratefully acknowledged. F. Biondi thanks the University of Nevada, Reno for
sponsoring dendrochronological research.
References
Baillie, M.G.L., Pilcher, J.R., 1973. A simple cross-dating program for
tree-ring research. Tree-ring Bull. 33, 7–14.
Barry, R.G., Carleton, A.M., 2001. Synoptic and Dynamic Climatology.
Routledge, London.
Biondi, F., 1992. Development of a tree-ring network for the Italian Peninsula. Tree-ring Bull. 52, 15–29.
Biondi, F., 1993. Climatic signals in tree-rings of Fagus sylvatica L. from
the central Apennines, Italy. Acta Oecol. 14, 57–71.
Biondi, F., 1999. Comparing tree-ring chronologies and repeated timber
inventories as forest monitoring tools. Ecol. Appl. 9, 216–227.
Biondi, F., 2000. Are climate-tree growth relationships changing in northcentral Idaho? Arct. Antarct. Alp. Res. 32, 111–116.
Biondi, F., Swetnam, T.W., 1987. Box-Jenkins models of forest interior
tree-ring chronologies. Tree-ring Bull. 47, 71–95.
Biondi, F., Visani, S., 1996. Recent developments in the analysis of an Italian
tree-ring network with emphasis on European beech (Fagus sylvatica
L.). In: Dean, J.S., Meko, D.M., Swetnam, T.W. (Eds.), Tree Rings,
Environment and Humanity, Special Volume. Radiocarbon, pp. 713–
725.
Biondi, F., Waikul, K., 2004. DENDROCLIM2002: A C++ program for
statistical calibration of climate signals in tree-ring chronologies. Comput. Geosci. 30, 303–311.
Blasing, T.J., Solomon, A.M., Duvick, D.N., 1984. Response functions
revisited. Tree-ring Bull. 44, 1–15.
G. Piovesan et al. / Acta Oecologica 27 (2005) 197–210
Blasi, C., Carranza, M.L., Filesi, L., Tilia, A., Acosta, A., 1999. Relation
between climate and vegetation along a Mediterranean-Temperate
boundary in central Italy. Global Ecol. Biogeogr. 8, 17–27.
Borghetti, M., Giannini, R., 1982. Indagini preliminari sulle variazioni di
alcuni caratteri in piantine di faggio di provenienza diversa. Annali
Accademia Italiana di Scienze Forestali 31, 119–134.
Bourquin-Mignot, C., Girardclos, O., 2001. Construction d’une longue
chronologie de hêtres au pays basque: la forêt d’Iraty et le Petit Age
Glaciaire. Revue de Géographie des Pyrénées et du Sud-Ouest Européen
11, 59–71.
Box, G.E.P., Jenkins, G.M., 1976. Time Series Analysis: Forecasting and
Control. Revised ed. Holden-Day, Oakland.
Briffa, K.R., Osborn, T.J., Schweingruber, F.H., Jones, P.D., Shiyatov, S.G.,
2002a. Tree-ring width and density data around the Northern
Hemisphere: Part 1, local and regional climate signals. Holocene 12,
737–757.
Briffa, K.R., Osborn, T.J., Schweingruber, F.H., Jones, P.D., Shiyatov, S.G.,
2002b. Tree-ring width and density data around the Northern
Hemisphere: Part 2, spatio-temporal variability and associated climate
patterns. Holocene 12, 759–789.
Briffa, K.R., Schweingruber, F.H., Jones, P.D., Osborn, T.J., Shiyatov, S.G.,
1998. Reduced sensitivity of recent tree-growth to temperature at high
northern latitudes. Nature 391, 678–682.
Brunetti, M., Buffoni, L., Mangianti, F., Maugeri, M., Nanni, T., 2004.
Temperature, precipitation and extreme events during the last century in
Italy. Global Planet. Change 40, 141–149.
Comps, B., Gömöry, D., Letouzey, J., Thiébaut, B., Petit, R.J., 2001. Diverging trends between heterozygosity and allelic richness during postglacial
colonization in the European beech. Genetics 157, 389–397.
Cook, E.R., Glitzenstein, J.S., Krusic, P.J., Harcombe, P.A., 2001. Identifying functional groups of trees in West Gulf Coast forests (USA): a
tree-ring approach. Ecol. Appl. 11, 883–903.
Cullen, L.E., Palmer, J.G., Duncan, R.P., Stewart, G.H., 2001. Climate
change and tree-ring relathionships of Nothofagus menziesii tree-line
forests. Can. J. For. Res. 31, 1981–1991.
Daget, P., 1977. Le bioclimat mediterraneen: caracteres generaux, modes de
caracterisation. Vegetatio 34, 1–20.
De Philippis, A., 1937. Classificazioni ed indici del clima in rapporto alla
vegetazione forestale italiana. Nuovo Giornale Botanico Italiano XLIV,
1–169.
Dittmar, C., Zech, W., Elling, W., 2003. Growth variations of common beech
(Fagus sylvatica L.) under different climatic and environmental conditions in Europe—a dendroecological study. For. Ecol. Manage. 173,
63–78.
Douglass, A.E., 1920. Evidence of climatic effects in the annual rings of
trees. Ecology 1, 24–32.
Eckstein, D., Bauch, J., 1969. Ein Beitrag zur Rationalisierung eines Verfahrens und zur Analyse seiner Aussagesicherheit. Forstwiss. Centralbl. 88,
230–250.
Eckstein, D., Frisse, E., 1982. The influence of temperature and precipitation
on vessel area and ring width of oak and beech. In: Hughes, M.K.,
Kelly, P.M., Pilcher, J.R., LaMarche Jr., V.C. (Eds.), Climate from Tree
Rings. Cambridge University Press, Cambridge, pp. 12.
Efron, B., Tibshirani, R., 1986. Bootstrap methods for standard errors,
confidence intervals, and other measures of statistical accuracy. Stat. Sci.
1, 54–75.
Ellenberg, H., 1988. Vegetation Ecology of Central Europe. Cambridge
University Press, Cambridge.
Essenwanger, O.M., 2001. Classification of Climates. In: Essenwanger, O.M. (Ed.), General Climatology. World Survey of Climatology.
1C. Elsevier, Amsterdam.
Falinski, J.B., Pedrotti, F., 1990. The vegetation and dynamical tendencies in
the vegetation of bosco Quarto, Promontorio del Gargano, Italy. Braun
Blanquetia 5, 1–31.
Fenaroli, L., Gambi, G., 1976. Alberi: Dendroflora Italica. Museo Tridentino
di Scienze Naturali, Trento, Italy.
Fritts, H.C., 1976. Tree Rings and Climate. Academic Press, London.
209
Guiot, J., 1991. The bootstrapped response function. Tree-ring Bull. 51,
39–41.
Guttman, L., 1954. Some necessary conditions for common-factor analysis.
Psychometrika 19, 149–161.
Holmes, R.L., 1983. Computer-assisted quality control in tree-ring dating
and measurement. Tree-Ring Bulletin 43, 69–78.
Holmsgaard, E., 1955. Tree-ring analyses of Danish forest trees. Det fortlise
Forsogsvaesen 22, 1–246.
Holmsgaard, E., 1962. Influence of Weather on Growth and Reproduction of
Beech. Commun. Inst. For. Fenn. 55, 1–5.
Jackson, J.B.C., Kirby, M.X., Berger, W.H., Bjorndal, K.A., Botsford, L.W.,
2001. Historical overfishing and the recent collapse of coastal ecosystems. Science 293, 629–637.
Jolliffe, I.T., 1986. Principal Component Analysis. Springer-Verlag, New
York.
Kaiser, H.F., 1992. On Cliff’s formula, the Kaiser-Guttman rule, and the
number of factors. Percept. Mot. Skills 74, 595–598.
Kalnay, E., Kanamitsu, M., Kistler, R., Collins, W., Deaven, D., 1996. The
NCEP/NCAR 40-year reanalysis project. Bull. Am. Meteorol. Soc. 77,
437–471.
Laurent, J.-M., Bar-Hen, A., François, L., Ghislain, M., Cheddadi, R., 2004.
Refining vegetation simulation models: from plant functional types to
bioclimatic affinity groups of plants. J. Veg. Sci. 15, 739–746.
Lausi, D., Pignatti, S., 1972. Die phänologie der europäischen buchenwälder
auf pflanzensoziologischer grundlage. Phytocoenologia 1, 1–63.
Leonardi, S., Menozzi, P., 1995. Genetic variability of Fagus sylvatica in
Italy: the role of postglacial recolonization. Heredity 75, 35–44.
Ludwig, J.A., Reynolds, J.F., 1988. Statistical Ecology. John Wiley & Sons,
New York.
Mäkinen, H., Nöjd, P., Kahle, H.-P., Neumann, U., Tveite, B., 2002. Radial
growth variation of Norway spruce (Picea abies (L.) Karst.) across
latitudinal and altitudinal gradients in central and northern Europe. For.
Ecol. Manage. 171, 243–259.
Nielsen, C.N., Jørgensen, F.V., 2003. Phenology and diameter increment in
seedlings of European beech (Fagus sylvatica L.) as affected by different
soil water contents: variation between and within provenances. For. Ecol.
Manage. 174, 233–249.
Peterken, G.F., 1996. Natural Woodland. Cambridge University Press.
Peters, R., 1997. Beech Forests. Kluwer Academic Publishers, Dodrecht.
Pignatti, S., 1979. I piani di vegetazione in Italia. Giornale Botanico Italiano
113, 411–428.
Pignatti, S., 1998. I boschi d’Italia. UTET, Torino.
Piovesan, G., Adams, J.M., 2001. Masting behaviour in beech: linking
reproduction and climatic variation. Can. J. Bot. 79, 1039–1047.
Piovesan, G., Bernabei, M., Di Filippo, A., Romagnoli, M., Schirone, B.,
2003. A long-term tree ring beech chronology from a high-elevation
old-growth forest of Central Italy. Dendrochronologia 21, 1–10.
Piovesan, G., Di Filippo, A., Alessandrini, A., Biondi, F., Schirone, B., 2005.
Structure, dynamics, and dendroecology of an Apennine old-growth
beech forest. J. Veg. Sci. 16, 13–28.
Piovesan, G., Schirone, B., 2000. Winter North Atlantic Oscillation effects
on the tree rings of the Italian beech (Fagus sylvatica L.). Int. J.
Biometeorol. 44, 121–127.
Power, S.A., 1994. Temporal trends in twig growth of Fagus sylvatica L. and
their relationships with environmental factors. Forestry 67, 511–515.
Romagnoli, M., Codipietro, G., 1996. Pointer years and growth in Turkey
oak (Quercus cerris L.) in Latium. Dendroclimatic approach. Ann. Sci.
For. 53, 671–684.
Sander, T., König, S., Rothe, G.M., Janßen, A., Weisgerber, H., 2000.
Genetic variation of European beech (Fagus sylvatica L.) along an
altitudinal transect at mount Vogelsberg in Hesse, Germany. Mol. Ecol.
9, 1349–1361.
SAS Institute Inc, 2000. SAS/STAT User’s Guide, Version 8. SAS Institute
Inc., Cary, NC.
Schaber, J., Badeck, F.W., 2003. Physiology-based phenology models for
forest tree species in Germany. Int. J. Biometeorol. 47, 193–201.
210
G. Piovesan et al. / Acta Oecologica 27 (2005) 197–210
Schirone, B., Pedrotti, F., Spada, F., Bernabei, M., Di Filippo, A., Piovesan,
G. (in press). The old-growth forest of Val Cervara (Abruzzo National
Park, Italy). Acta Bot. Gallica.
Schirone, B., Piovesan, G., Romagnoli, M., Bernabei, M., Lo Monaco, A.,
Di Primio, S., Di Filippo, A., 2002. Una rete di monitoraggio dendroecologico per identificare i cambiamenti climatici e valutarne l’effetto sulle
foreste italiane. Italian Agency for the Environmental Protection. ANPA,
Italy.
Stokes, M.A., Smiley, T.L., 1996. An Introduction to Tree-Ring Dating.
Reprint of 1968 U. of Chicago Press ed. University of Arizona Press,
Tucson, US.
Stribleya, G.H., Ashmore, M.R., 2002. Quantitative changes in twig growth
pattern of young woodland beech (Fagus sylvatica L.) in relation to
climate and ozone pollution over 10 years. For. Ecol. Manage. 157,
191–204.
Swetnam, T.W., Allen, C.D., Betancourt, J.L., 1999. Applied historical
ecology: using the past to manage for the future. Ecol. Appl. 9, 1189–
1206.
Tallis, J.H., 1990. Plant Community History—Long Term Changes in Plant
Distribution and Diversity. Chapman and Hall, London.
Wilkinson, L., 1997. SYSTAT Version 7. SPSS Inc., Chicago.
© Copyright 2026 Paperzz