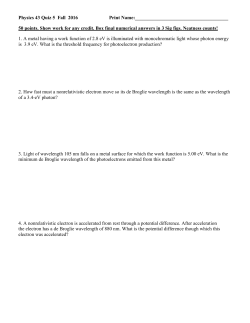
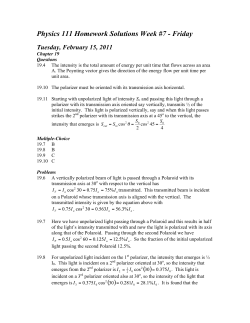
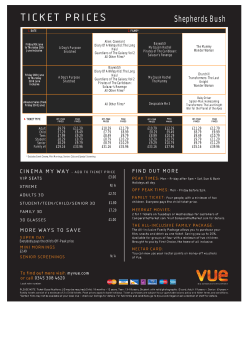
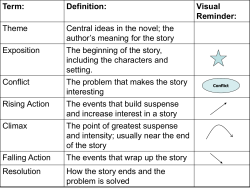
10-Element Bar Graph Array
Technical Data
HLCP-J100
HDSP-4820
HDSP-4830
HDSP-4832
Features
Description
• Custom Multicolor Array
Capability
• Matched LEDs for Uniform
Appearance
• End Stackable
• Package Interlock Ensures
Correct Alignment
• Low Profile Package
• Rugged Construction
• Large, Easily Recognizable
Segments
• High ON-OFF Contrast,
Segment to Segment
• Wide Viewing Angle
• Categorized for Luminous
Intensity
• HDSP-4832/4836/4840/4850
Categorized for Dominant
Wavelength
• HLCP-J100 Operates at Low
Current
Typical Intensity of 1.0 mcd at
1 mA Drive Current
These 10-element LED arrays are
designed to display information
in easily recognizable bar graph
form. The packages are end
stackable and therefore capable
of displaying long strings of
information. Use of these bar
graph arrays eliminates the
alignment, intensity, and color
matching problems associated
with discrete LEDs. The HDSP4820/4830/4840/4850 and HLCPJ100 each contain LEDs of one
color. The HDSP-4832/4836 are
multicolor arrays with High
Efficiency Red, Yellow, and High
Performance Green LEDs in a
single package.
CUSTOM MULTICOLOR ARRAYS
ARE AVAILABLE WITH
MINIMUM DELIVERY REQUIREMENTS. CONTACT YOUR LOCAL
DISTRIBUTOR OR HP SALES
OFFICE FOR DETAILS.
Package Dimensions
25.40 (1.000) MAX.
0.38
(0.015)
1. DIMENSIONS IN MILLIMETERS (INCHES).
2. ALL UNTOLERANCED DIMEMSIONS FOR
REFERENCE ONLY.
3. HDSP-4832/-4836/-4840/-4850 ONLY.
10.16
(0.400)
MAX.
5.08 (0.200)
Applications
•
•
•
•
•
Industrial Controls
Instrumentation
Office Equipment
Computer Peripherals
Consumer Products
2.54
(0.100)
LUMINOUS
INTENSITY
CATEGORY
DATE CODE
PIN ONE
MARKING
0.61
(0.024)
1.52
(0.060)
hp
COLOR BIN
(NOTE 3)
HDSP XXXX
XYY
6.10 ± 0.25
(0.240 ± 0.010)
5.08 (0.200)
ZW
2.54 ± 0.25
(0.100 ± 0.010)
4.06
(0.160)
MIN.
0.38
(0.015)
7.62 ± 0.38
(0.300 ± 0.015)
2
Absolute Maximum Ratings[7]
Red
AlGaAs Red
HER
Yellow
Parameter
HDSP-4820
HLCP-J100
HDSP-4830
HDSP-4840
Average Power
63 mW
37 mW
87 mW
50 mW
Dissipation per LED
(TA = 25°C)
Peak Forward Current
150 mA[1]
45 mA[2]
90 mA[3]
60 mA[3]
per LED
DC Forward Current
30 mA[4]
15 mA[4]
30 mA[5]
20 mA[5]
per LED
Operating
-40°C to +85°C -20°C to +100°C
-40°C to +85°C
Temperature Range
Storage Temperature -40°C to +85°C -55°C to +100°C
-40°C to +85°C
Range
Reverse Voltage per
3.0 V
5.0 V
3.0 V
LED
Lead Soldering
260°C for 3 seconds[8]
Temperature
(1.59 mm
(1/16 inch) below
seating plane)[6]
Green
HDSP-4850
105 mW
90 mA[3]
30 mA[5]
-20°C to +85°C
Notes:
1. See Figure 1 to establish pulsed operating conditions. Maximum pulse width is 1.5 ms.
2. See Figure 2 to establish pulsed operating conditions. Maximum pulse width is 1.5 ms.
3. See Figure 8 to establish pulsed operating conditions. Maximum pulse width is 2 ms.
4. Derate maximum DC current for Red above TA = 62°C at 0.79 mA/ °C, and AlGaAs Red above TA = 91°C at 0.8 mA/°C. See Figure 3.
5. Derate maximum DC current for HER above TA = 48°C at 0.58 mA/ °C, Yellow above TA = 70°C at 0.66 mA/°C, and Green above
TA = 37°C at 0.48 mA/°C. See Figure 9.
6. Clean only in water, isopropanol, ethanol, Freon TF or TE (or equivalent), or Genesolve DI-15 (or equivalent).
7. Absolute maximum ratings for HER, Yellow, and Green elements of the multicolor arrays are identical to the HDSP-4830/4840/
4850 maximum ratings.
8. Maximum tolerable component side temperature is 134°C during solder process.
Internal Circuit Diagram
1
2
3
a
b
c
20
19
18
4
d
17
5
e
16
6
7
8
9
10
f
g
h
i
j
15
14
13
12
11
Pin
1
2
3
4
5
6
7
8
9
10
Function
Anode a
Anode b
Anode c
Anode d
Anode e
Anode f
Anode g
Anode h
Anode i
Anode j
Pin
11
12
13
14
15
16
17
18
19
20
Function
Cathode j
Cathode i
Cathode h
Cathode g
Cathode f
Cathode e
Cathode d
Cathode c
Cathode b
Cathode a
3
Multicolor Array Segment Colors
Segment
a
b
c
d
e
f
g
h
i
j
HDSP-4832
Segment Color
HER
HER
HER
Yellow
Yellow
Yellow
Yellow
Green
Green
Green
HDSP-4836
Segment Color
HER
HER
Yellow
Yellow
Green
Green
Yellow
Yellow
HER
HER
Electrical/Optical Characteristics at TA = 25°C[4]
Red
HDSP-4820
Parameter
Luminous Intensity per LED
(Unit Average)[1]
Peak Wavelength
Dominant Wavelength[2]
Forward Voltage per LED
Reverse Voltage per LED[5]
Temperature Coefficient VF per LED
Thermal Resistance LED Junction-to-Pin
Symbol
IV
λPEAK
λd
VF
VR
∆VF /°C
RθJ-PIN
Min.
610
3
Typ. Max.
1250
655
645
1.6
12
-2.0
300
Units
µcd
nm
nm
2.0
V
V
mV/°C
°C/W/LED
Test Conditions
IF = 20 mA
IF = 20 mA
IR = 100 µA
AlGaAs Red HLCP-J100
Parameter
Luminous Intensity per LED
(Unit Average)[1]
Symbol
IV
Min.
600
Typ. Max.
1000
Units
µcd
5200
Peak Wavelength
Dominant Wavelength[2]
Forward Voltage per LED
Reverse Voltage per LED[5]
Temperature Coefficient VF per LED
Thermal Resistance LED Junction-to-Pin
λPEAK
λd
VF
VR
∆VF / °C
RθJ-PIN
5
645
637
1.6
1.8
15
-2.0
300
Test Conditions
IF = 1 mA
IF = 20 mA Pk;
1 of 4 Duty Factor
nm
nm
V
2.2
V
mV/°C
°C/W/LED
IF = 1 mA
IF = 20 mA
IR = 100 µA
4
High Efficiency Red
HDSP-4830
Parameter
Luminous Intensity per LED
(Unit Average)[1,4]
Peak Wavelength
Dominant Wavelength[2]
Forward Voltage per LED
Reverse Voltage per LED[5]
Temperature Coefficient VF per LED
Thermal Resistance LED Junction-to-Pin
Yellow
Symbol
IV
λPEAK
λd
VF
VR
∆VF / °C
RθJ-PIN
Min.
900
3
Typ. Max.
3500
635
626
2.1
30
-2.0
300
Units
µcd
nm
nm
2.5
V
V
mV/°C
°C/W/LED
Test Conditions
IF = 10 mA
IF = 20 mA
IR = 100 µA
HDSP-4840
Parameter
Luminous Intensity per LED
(Unit Average)[1,4]
Peak Wavelength
Dominant Wavelength[2,3]
Forward Voltage per LED
Reverse Voltage per LED[5]
Temperature Coefficient VF per LED
Thermal Resistance LED Junction-to-Pin
Symbol
IV
λPEAK
λd
VF
VR
∆VF / °C
RθJ-PIN
Min.
600
581
3
Typ. Max.
1900
583
585
2.2
40
-2.0
300
Units
µcd
nm
592
nm
2.5
V
V
mV/ °C
°C/W/LED
Test Conditions
IF = 10 mA
IF = 20 mA
IR = 100 µA
Green HDSP-4850
Parameter
Luminous Intensity per LED
(Unit Average)[1,4]
Peak Wavelength
Dominant Wavelength[2,3]
Forward Voltage per LED
Reverse Voltage per LED[5]
Temperature Coefficient VF per LED
Thermal Resistance LED Junction-to-Pin
Symbol
IV
λPEAK
λd
VF
VR
∆VF /°C
RθJ-PIN
Min.
600
3
Typ. Max.
1900
566
571
2.1
50
-2.0
300
577
2.5
Units
µcd
nm
nm
V
V
mV/°C
°C/W/LED
Test Conditions
IF = 10 mA
IF = 10 mA
IR = 100 µA
Notes:
1. The bar graph arrays are categorized for luminous intensity. The category is designated by a letter located on the side of the
package.
2. The dominant wavelength, λd, is derived from the CIE chromaticity diagram and is that single wavelength which defines the color of
the device.
3. The HDSP-4832/-4836/-4840/-4850 bar graph arrays are categorized by dominant wavelength with the category designated by a
number adjacent to the intensity category letter. Only the yellow elements of the HDSP-4832/-4836 are categorized for color.
4. Electrical/optical characteristics of the High-Efficiency Red elements of the HDSP-4832/-4836 are identical to the HDSP-4830
characteristics. Characteristics of Yellow elements of the HDSP-4832/-4836 are identical to the HDSP-4840. Characteristics of
Green elements of the HDSP-4832/-4836 are identical to the HDSP-4850.
5. Reverse voltage per LED should be limited to 3.0 V max. for the HDSP-4820/-4830/-4840/-4850/-4832/-4836 and 5.0 V max. for
the HLCP-J100.
5
100
1000
10000
DC OPERATION
2
1
1
10
tP – PULSE DURATION – µSEC
IDC MAX – MAXIMUM DC CURRENT
PER SEGMENT – mA
40
Rθ J-A = 600°C/W
35
RED
25
20
15
AlGaAs RED
10
5
0
25
35
45
55
65
75
85
95
105
η PEAK – RELATIVE EFFICIENCY (NORMALIZED TO
1 AT 20 mA FOR RED: AT 1mA FOR AlGaAs RED)
Figure 1. Maximum Tolerable Peak Current vs. Pulse
Duration – Red.
30
1000
10000
DC OPERATION
Figure 2. Maximum Tolerable Peak Current vs. Pulse
Duration – AlGaAs Red.
1.2
1.1
AlGaAs RED
RED
1.0
0.9
0.8
0.7
0.6
0.5
0.4
0
20
40
60
80
100 120 140 160
IPEAK – PEAK SEGMENT CURRENT – mA
TA – AMBIENT TEMPERATURE – °C
Figure 3. Maximum Allowable DC
Current vs. Ambient Temperature.
TJMAX = 100°C for Red and
TJMAX = 110°C for AlGaAs Red.
Figure 4. Relative Efficiency
(Luminous Intensity per Unit
Current) vs. Peak Current.
1.4
160
140
RED
120
100
80
60
40
AlGaAs RED
20
0
0
0.5 1.0
1.5
2.0
2.5
3.0
3.5 4.0
VF – FORWARD VOLTAGE – V
Figure 5. Forward Current vs.
Forward Voltage.
20
RELATIVE LUMINOUS INTENSITY
(NORMALIZED TO 1 AT 1mA)
RELATIVE LUMINOUS INTENSITY
(NORMALIZED TO 1.0 AT 20 mA)
100
tP – PULSE DURATION – µs
IF – FORWARD CURRENT PER SEGMENT – mA
10
TE
1
3
RA
1
OPERATION IN THIS
REGION REQUIRES
TEMPERATURE
DERATING OF IDC MAX
SH
1.5
E
EFR
f-R z
H
100
Hz
300
Hz
2
4
z
3
5
1K
ATE
6
5
4
10
9
8
7
6
Hz
10 K
OPERATION IN THIS
REGION REQUIRES
TEMPERATURE
DERATING OF IDC MAX
R
ESH
EFR
f-R
Hz
100
Hz
300
8
Hz
1K
15
12.5
10
3KH
IPEAK MAX RATIO OF MAXIMUM OPERATING
PEAK CURRENT TO TEMPERATURE
IDC MAX
DERATED MAXIMUM DC CURRENT
20
z
3KH
z
KH
10
IPEAK MAX RATIO OF MAXIMUM OPERATING
PEAK CURRENT TO TEMPERATURE
IDC MAX
DERATED MAXIMUM DC CURRENT
Red, AlGaAs Red
1.2
1.0
0.8
0.6
0.4
0.2
0
0
5
10
15
20
25
IF – FORWARD CURRENT PER SEGMENT – mA
Figure 6. Relative Luminous Intensity
vs. DC Forward Current – Red.
10
5
2
1
0.1
0.1
0.2
0.5
1
5
10
20
IF – FORWARD CURRENT PER SEGMENT
Figure 7. Relative Luminous Intensity
vs. DC Forward Current – AlGaAs.
For a Detailed Explanation on the Use of Data Sheet Information and Recommended Soldering Procedures,
See Application Note 1005.
6
IPEAK MAX RATIO OF MAXIMUM OPERATING
PEAK CURRENT TO TEMPERATURE
IDC MAX
DERATED MAXIMUM DC CURRENT
HER, Yellow, Green
20
15
GREEN
12
10
8
OPERATION IN
THIS REGION
REQUIRES
TEMPERATURE
DERATING OF
IDC MAX
HER
fES
FR
RE
6
YELLOW
4
H
30
z
Hz
z
Hz
0H
1K
KH
3K
10
2
TE Hz
RA 100
3
1.5
1
1
10
100
1000
10000
DC OPERATION
tP – PULSE DURATION – µSEC
Figure 8. Maximum Tolerable Peak Current vs. Pulse Duration –
HER/Yellow/Green.
IDC MAX – MAXIMUM DC CURRENT
PER SEGMENT – mA
Rθ J-A = 600°C/W
35
GREEN/HER
30
GREEN
25
HER
YELLOW
20
YELLOW
15
10
5
0
15
ηPEAK – RELATIVE EFFICIENCY
1.6
40
1.5
YELLOW SERIES
1.4
HER SERIES
1.3
GREEN SERIES
1.2
1.1
1.0
0.9
0.8
0.7
0.6
25
35
45
55
65
75
85
0 10 20 30 40 50 60 70 80 90 100
95
IPEAK – PEAK SEGMENT CURRENT – mA
TA – AMBIENT TEMPERATURE – °C
Figure 10. Relative Efficiency
(Luminous Intensity per Unit
Current) vs. Peak Current.
90
4.0
GREEN SERIES
80
70
60
YELLOW SERIES
50
40
30
HER
SERIES
20
10
0
1.0
RELATIVE LUMINOUS INTENSITY
IF – FORWARD CURRENT PER SEGMENT – mA
Figure 9. Maximum Allowable DC
Current vs. Ambient Temperature.
TJMAX = 100°C.
3.5
3.0
2.5
2.0
1.5
1.0
0.5
0
2.0
3.0
4.0
5.0
VF – FORWARD VOLTAGE – V
Figure 11. Forward Current vs.
Forward Voltage.
0
5
10
15
20
25
30
35
40
IF – FORWARD CURRENT PER SEGMENT – mA
Figure 12. Relative Luminous
Intensity vs. DC Forward Current.
For a Detailed Explanation on the Use of Data Sheet Information and Recommended Soldering Procedures,
See Application Note 1005.
7
Electrical/Optical
These versatile bar graph arrays
are composed of ten light emitting diodes. The light from each
LED is optically stretched to form
individual elements. The Red
(HDSP-4820) bar graph array
LEDs use a p-n junction diffused
into a GaAsP epitaxial layer on a
GaAs substrate. The AlGaAs Red
(HLCP-J100) bar graph array
LEDs use double heterojunction
AlGaAs on a GaAs substrate. HER
(HDSP-4830) and Yellow (HDSP4840) bar graph array LEDs use
a GaAsP epitaxial layer on a GaP
substrate. Green (HDSP-4850)
bar graph array LEDs use liquid
phase GaP epitaxial layer on a
GaP substrate. The multicolor bar
graph arrays (HDSP-4832/4836)
have HER, Yellow, and Green
LEDs in one package.
These displays are designed for
strobed operation. The typical
forward voltage values can be
scaled from Figures 5 and 11.
These values should be used to
calculate the current limiting
resistor value and typical power
consumption. Expected maximum VF values for driver circuit
design and maximum power
dissipation may be calculated
using the VFMAX models:
Standard Red HDSP-4820 series
VFMAX = 1.8 V + IPeak (10 Ω)
For: IPeak ≥ 5 mA
AlGaAs Red HLCP-J100 series
VFMAX = 1.8 V + IPeak (20 Ω)
For: IPeak ≤ 20 mA
VFMAX = 2.0 V + IPeak (10 Ω)
For: IPeak ≥ 20 mA
HER (HDSP-4830) and Yellow
(HDSP-4840) series
VFMAX = 1.6 + IPeak (45 Ω)
For: 5 mA ≤ IPeak ≤ 20 mA
VFMAX = 1.75 + IPeak (38 Ω)
For: IPeak ≥ 20 mA
Green (HDSP-4850) series
VFMAX = 2.0 + IPeak (50 Ω)
For: IPeak > 5 mA
Where:
IVAVG is the calculated time
averaged luminous intensity
resulting from IFAVG.
IFAVG is the desired time
averaged LED current.
IFAVG DATA SHEET is the data
sheet test current for IVDATA
SHEET.
ηpeak is the relative efficiency at
the peak current, scaled from
Figure 4 or 10.
IV DATA SHEET is the data sheet
luminous intensity, resulting
from IFAVG DATA SHEET.
For example, what is the
luminous intensity of an HDSP4830 driven at 50 mA peak 1/5
duty factor?
Figures 4 and 10 allow the
designer to calculate the
luminous intensity at different
peak and average currents. The
following equation calculates
intensity at different peak and
average currents:
IFAVG = (50 mA)(0.2) = 10 mA
IFAVG DATA SHEET = 10 mA
ηpeak = 1.3
IV DATA SHEET = 3500 µcd
IVAVG = (IFAVG/IFAVG DATA
SHEET)ηpeak)(IVDATA
SHEET)
IVAVG = (10 mA/10 mA)
(1.3)(3500 µcd)
= 4550 µcd
Therefore
For technical assistance or the location of
your nearest Hewlett-Packard sales office,
distributor or representative call:
Americas/Canada: 1-800-235-0312 or
408-654-8675
Far East/Australasia: Call your local HP
sales office.
Japan: (81 3) 3335-8152
Europe: Call your local HP sales office.
Data subject to change.
Copyright © 1997 Hewlett-Packard Co.
Obsoletes 5954-0869, 5954-8465
Printed in U.S.A.
5963-7037E (4/97)
© Copyright 2026 Paperzz