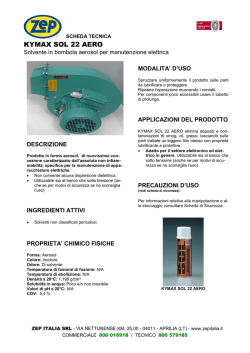
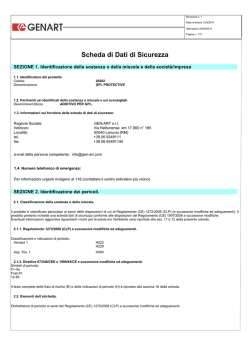
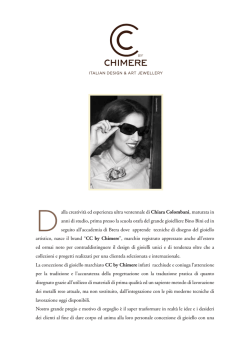
MULTI ANNUAL COMPARISON BETWEEN SATELLITE-BASED OBSERVATIONS AND CTM ESTIMATES
OF SURFACE AEROSOL CONCENTRATIONS IN NORTHERN ITALY
Enrico Minguzzi1, Giovanni Ballista2, Giovanni Bonafé1, Alessanda Cacciari2, Marco Deserti1, Walter Di Nicolantonio2,
Michele Sortini1 and Alessandro Tiesi2
1
ARPA Emilia Romagna, Servizio Idrometeoclima, Italy
Carlo Gavazzi Space SpA at Institute of Atmospheric and Climate Sciences – ISAC-CNR, Italy
2
Abstract: EU legislation in force requires that aerosol concentrations are evaluated on the whole territory, but ground based monitoring
network are not sufficient for this task; on the other hand, satellite observations and numerical models (CTM) can both provide spatially
homogeneous concentration maps, but also have important limitations.
In this study, PM2.5 surface concentrations in Northern Italy have been evaluated for an 8 years period (2003-2010); the domain of study
includes Po Valley, which is one of the most polluted and densely populated European areas, and where CTM have problems in correctly
simulating aerosol concentrations. Aerosol Optical Depth (AOD) and fine mode fraction retrieved from MODIS observations, together with
mixing height and relative humidity evaluated by a meteorological model (COSMO), have been used to produce a satellite-based estimate of
surface PM2.5. In the meantime, PM2.5 concentrations have also been simulated by running the Chimere CTM for the same years. The two
estimates have been compared and partially validated with a set of independent stations, with focus on the compliance with the new EU
legislation.
Satellite-based estimates appear sufficiently robust to make realistic long-term analysis, but care must be put in tuning the retrieval algorithm
and dealing with missing data. Errors of satellite-based and CTM-based maps are of the same order of magnitude, but essentially
independent: it is therefore useful to integrate and cross-validate the two. Despite the strong differences in absolute values, the spatial pattern
of PM2.5 produced with the two approaches is rather similar, although some important differences arise in winter months: they consistently
produce higher aerosol concentrations north of Po river, and predict an higher spatial variability in winter than in summer.
Key words: aerosol, PM2.5, remote sensing, CTM, Po Valley, multi-annual.
INTRODUCTION
Starting from 2015, EU legislation will require the annual average of PM2.5 concentrations to be less than 25 µg·m-3;
moreover, the same legislation requires that air pollutant is evaluated on the whole territory, and ground based monitoring
network are not sufficient for this task. Satellite observations and chemical Transport Models (CTM) can both provide
spatially homogeneous maps of aerosol concentrations, but they also have important limitations: satellite-based estimates are
only possible in clear sky conditions, while numerical models are affected by systematic errors, especially when aerosol are
considered. It could therefore be very useful to integrate the two methodologies, and a lot of work is presently being done in
this direction.
In this analysis, PM2.5 surface concentrations in Northern Italy have been evaluated for an 8 years period (2003-2010), based
on MODIS AOD measurements and on outputs of the Chimere CTM; the domain of study includes Po Valley, which is one
of the most polluted and densely populated European areas. Po Valley is almost entirely surrounded by Alps and Appennine
mountains, and this often determines weak winds and air stagnation; consequently, mixing in the lower troposphere is mainly
produced by thermal turbulence, and this determines a strong seasonal cycle in air pollution, with PM concentrations being
twice as high in winter than in summer. Moreover, a lot of pollutants are produced in this area, by traffic, industrial activities,
urban areas and intensive agriculture. Finally in Po Valley CTM have problems in correctly simulating aerosol
concentrations, and most of them underestimate their surface concentrations by 30-40% (Cuvelier et al, 2007, Angelino et al,
2008).
METHODOLOGY
Satellite-based PM2.5 mapping
The capability of NASA MODIS sensors to retrieve aerosol optical properties is used in a semi-empirical approach to
estimate PM2.5 concentrations at ground level. Aerosol Optical Depth at 550 nm (τa) and fine mode fraction (η) are retrieved
from MODIS observations following Levy et al., 2007. Assuming that the aerosol vertical profile is constant between surface
and mixing height, and neglecting the aerosol contained in the free atmosphere (days in which long distance transport of
aerosol is important are excluded from this analysis), the following linear relation can be expected to hold (Di Nicolantonio et
al., 2009):
PM 2.5 ≅ Ai , j
η ×τ a
+ Bi , j
Fhyg (RH ; γ ) H mix
Fhyg is a factor which takes into account the hygroscopic growth of aerosol, and it depends on relative humidity and on the
constant γ. Relative humidity (RH) and mixing height (Hmix) are evaluated by the meteorological model COSMO (Steppeler
et al, 2003), the latter through a bulk Richardson number post processing algorithm.
The coefficients of this regression (A and B) are first evaluated at 20 calibration sites where ground PM2.5 measurements are
available (figure 1, red diamonds); observations come from the air quality network of Regione Lombardia and from special
measurements campaigns, and were made in years 2004, 2007 and 2008. The values of A and B are then extrapolated with a
simple R-2 rule, to cover Northern Italy with a 10 km spaced grid. Since the optical and chemical properties of aerosol
changes through the year, the whole procedure is repeated independently for every month. Finally, maps of PM2.5 surface
concentration can be produced for every satellite overpass (ie. twice a day)
Six of the measuring sites (figure 1, blue diamonds) are not used in the calibration procedure, and provide a validation of
PM2.5 retrieval. Results are promising: the average correlation of daily PM2.5 in these sites is between 0.6 and 0.7, with an
RMSE of 8-10 µg·m-3 (Di Nicolantonio et al., 2009).
Figure 1. Example of Aerosol Optical Depth retrieved by MODIS (27 July 2007, 12UTC); the map also shows calibration (red diamonds)
and verification sites (blue diamonds).
CTM-based PM2.5 estimates
An independent estimate of surface PM2.5 has been produced by running the CTM Chimere (Bessagnet et al, 2004) for the
same 8 years period, on a domain covering Po Valley and the surrounding mountains with an horizontal resolution of 10 km.
Chimere CTM includes an aerosol module, which estimates and 8 chemical species (sulfate, nitrate, ammonia, primary, dust,
sea salt, anthropogenic organic, biogenic organic), each for 6 granulometric classes (from 10 nm to 40 µm).
Chimere has been driven by the meteorological model COSMO, run in continuous assimilation mode with an horizontal
resolution of 7 km. Chemical boundary conditions are taken from the same Chimere model, run by INERIS
(www.prevair.org) at continental scale with 50 km resolution. Pollutant emissions are derived from the Italian national
emission inventory updated to year 2000: the inventory is based on a top-down approach, but large point sources are
explicitly described; diurnal, weekly and seasonal modulation of emissions are taken into account, but their interannual trend
is neglected.
RESULTS
Verification
To perform a preliminary verification of this approach, PM2.5 measured by 24 surface stations of Emilia-Romagna regional
network is compared with satellite-based estimates and with Chimere outputs (figure 2). None of these stations were used in
the calibration procedure, and data belong to different years (2009-2010): this ensures that the verification is independent,
although the stations only cover a part of the domain of study (eastern and central Po Valley south of Po river). Since the aim
is to investigate the ability of satellite and CTM to assess the compliance with legislation requirements, only long term
averages are taken into account.
As expected, Chimere underestimates PM2.5 concentrations in both seasons, but it also underestimates their spatial
variability, especially in summer. On the other hand, satellite-based estimates have smaller biases (almost zero if annual
means are considered), smaller RMSE and they better reproduce the spatial variability of concentrations; nevertheless the
seasonal cycle is underestimated, since the ratio of summer to winter median concentrations is 43% in observations and 69%
in satellite-based estimates.
The main limitation to the use of satellite-based estimates is the high number of missing data: Aerosol Optical Depth can only
be retrieved in clear sky conditions, and the ground must not be snow-covered. In Po Valley days with valid data satellite
turned out to be ~ 60% in summer and only ~ 25% in winter; moreover, this approach is not applicable over sea, and results
are less reliable in highly complex terrain (Emili et al., 2010). These limitations probably prevent the practical use of day-today satellite estimates.
Figure 2. Average PM2.5 concentrations (µg·m-3) in years 2009/2010 at 24 stations in Emilia Romagna; winter (Oct-Mar, left) and summer
(Apr-Sep, right) months; observations (obs), MODIS-based estimates (sat) and Chimere outputs (mod); the vertical scale of the two figures is
different.
Comparison of Satellite and CTM
Figure 3 shows PM2.5 concentrations averaged over the whole period of study (8 years), estimated from satellite data and
Chimere outputs; because of the strong seasonal cycle of aerosols levels and of satellite missing values, the analysis is done
separately for winter (Oct-Mar) and summer (Apr-Sep) months.
In both seasons, Chimere concentrations in Po Valley are ~ 40% lower than satellite estimates; nevertheless, the spatial
pattern is rather similar, and the two approaches consistently produce higher aerosol concentrations north of Po river. In
summer months, the east-west gradients in Po Valley are relatively smooth, and no especially critical area can be identified;
on the other hand, during winter spatial gradients are sharper, and specific parts of the domain experience significantly higher
concentrations. However, Chimere outputs and satellite-based estimates predict the highest winter concentrations to happen
in different areas, and their estimates strongly diverge in the Milan area.
Finally, satellite-based estimates might be less reliable in certain parts of the domain of study. The maximum in the southeastern corner is likely to be spurious: since this area is outside Po Valley, aerosol composition and optical properties are
probably very different, and a specific calibration would be required. The uneven distribution of calibration sites (figure 1)
may also have led to excessively high concentrations in eastern and western edges of Po Valley (Piemonte and Veneto
regions).
Figure 3. Average PM2.5 concentrations (µg·m-3) in years 2003-2010; winter (Oct-Mar, left) and summer (Apr-Sep, right) months, satellitebased estimates (top) and CTM outputs (bottom); colour scales in the four pictures are different.
Use of satellite-based estimates
EU legislation requires that, starting from year 2015, annual average of PM2.5 concentrations shall not exceed 25 µg·m-3. In
order to use satellite-based estimates to investigate the compliance with this requirement, one must take into account that
aerosol concentrations are much higher in winter, when fewer satellite measurements are available: in figure 4, annual
average concentrations are therefore evaluated as the mean of summer and winter averages.
Figure 4a (left) shows the variations of PM2.5 at 4 selected locations in Po Valley: interannual variability is about 20% of
mean concentrations, while differences experienced by different locations can be as high as 50%. Moreover, areas with
higher concentrations have also a greater variability, and different locations seem to experience the highest concentrations in
different years. The map in Figure 4b (right) displays the number of years in which the 25 µg·m-3 threshold is exceeded;
according to satellite-based estimates, large areas of Northern Po Valley are not likely to fulfil the legislation requirements.
Nevertheless, in most locations the threshold is exceeded only in some years: although interannual variability is not very
large, it could significantly affect the areas where the 25 µg·m-3 threshold is exceeded.
Figure 4. Annual average PM2.5 concentrations according to satellite-based estimates. Left: interannual variability at some locations in Po
Valley (green circles in right picture). Right: number of years in which concentrations exceeded the 25 µg·m-3 threshold.
CONCLUSIONS
PM2.5 concentrations in Northern Italy have been evaluated for an 8 years period, based on satellite measurements and on
the Chimere CTM. The analysis has been focused on the spatial distribution and inter-annual variability of surface
concentrations, in connection with the compliance with EU legislation.
Satellite estimates resulted sufficiently robust to make realistic long-term analysis, and can be a useful tool in the assessment
of compliance with air quality legislation. This approach must be applied to an area where the chemical and optical properties
of aerosols are relatively uniform, and the retrieval algorithm must be specifically tuned: quality control of AOD, mixing
height estimates and the choice of calibration stations can all be critical. In the Po Valley context, missing values are
nevertheless a big issue, and they make day-to-day values difficult to use; moreover, missing values occur more frequently
during winter, when aerosol concentrations are higher, and this must be taken into account when annual average
concentrations are evaluated.
A partial validation has been preformed, by comparing estimated PM2.5 with a set of independent monitoring stations in
Emilia-Romagna region. Satellite estimates on the whole give slightly better estimates than CTM, but errors of the two
approaches are essentially independent, making it possible to integrate and cross-validate the two estimates. The spatial
pattern of PM2.5 based on satellite and CTM is rather similar: the two approaches consistently produce higher aerosol
concentrations north of Po river, and predict an higher spatial variability in winter than in summer; nevertheless some
important differences arise, especially in the localisation of the areas affected by the highest winter concentrations.
Future work will focus on the refinement of satellite-based estimates: this will include a revision of the set of calibration
stations, in order to investigate the winter pattern of highest concentrations at the edges of Po Valley. Taking into account
averages of 3 month (instead of 6) could help improving the seasonal cycle of satellite-based estimates.
REFERENCES
Angelino, E., M. Bedogni, C. Carnevale, G. Finzi, E. Minguzzi, E. Peroni, C. Pertot, G. Pirovano, M. Volta, 2008: PM10
chemical model simulations over Northern Italy in the framework of the Citydelta exercise. Jou. Env. Mod. and
Ass., 13, 401-413.
Bessagnet, B., A. Hodzic, R. Vautard, M. Beekmann, S. Cheinet, C. Honoré, C. Liousse and L. Rouil, 2004: Aerosol
modeling with CHIMERE: preliminary evaluation at the continental scale. Atmos. Environ., 38, 2803-2817.
Cuvelier, C., Thunis, P.,Vautard, R., Amann, M., Bessagnet, B., Bedogni, M., Berkowicz, R., Brandt, J., Brocheton, F.,
Builtjes, P., Carnavale, C., Coppalle, A., Denby, B., Douros, J., Graf, A., Hellmuth, O., Hodzic, A., Honoré, C.,
Jonson, J., Kerschbaumer, A., de Leeuw, F., Minguzzi, E., Moussiopoulos, N., Pertot, C., Peuch, V.H., Pirovano,
G., Rouil, L., Sauter, F., Schaap, M., Stern, R., Tarrason, L., Vignati, E., Volta, M.,White, L., Wind, P., and Zuber,
A., 2007: CityDelta: A model intercomparison study to explore the impact of emission reductions in European
cities in 2010. Atmos. Environ., 41, 189-207.
Di Nicolantonio, W., A. Cacciari, and C. Tomasi, 2009: Particulate Matter at Surface: Northern Italy Monitoring Based on
Satellite Remote Sensing, Meteorological Fields, and in-situ Samplings. IEEE J. of Selected Topics in Applied
Earth Observations and Remote Sensing, 2(4), 284-292.
Di Nicolantonio, W., and A. Cacciari, 2011: MODIS multiannual observations in support of air quality monitoring in
Northern Italy. Italian Journal of Remote Sensing, in press.
Emili, E., C. Popp, M. Petitta, M. Riffler, S. Wunderlea and M. Zebischc, 2010: PM10 remote sensing from geostationary
SEVIRI and polar-orbiting MODIS sensors over the complex terrain of the European alpine region. Remote sensing
of environment, 114, 2485-2499
Levy., R.C., L.A. Remer, S. Mettoo, E.F. Vermote and Y.J.Kaufman Y.J., 2007: Second generation operational algorithm:
Retrieval of aerosol properties over land from inversion of Moderate Resolution Imaging Spectroradiometer
spectral reflectance. J. Geophys. Res., 112, D13211.
Randriamiarisoa, H., P. Chazette, P. Couvert, J. Sanak, and G. Mègie, 2006: Relative humidity impact on aerosol parameters
in a Paris suburban area, Atmos. Chem. Phys., 6, 1289-1407
Steppeler, J., G. Doms, U. Schättler, H.W. Bitzer, A. Gassmann, U. Damrath, G. Gregoric, 2003: Meso-gamma scale
forecasts using the nonhydrostatic model LM. Meteorology and Atmospheric Physics, 82, 75-96
© Copyright 2026 Paperzz