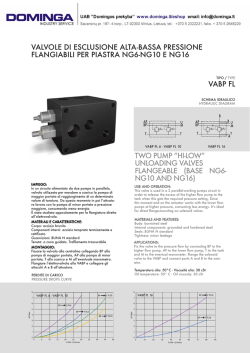
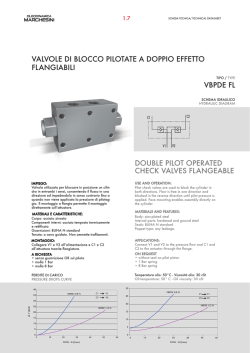
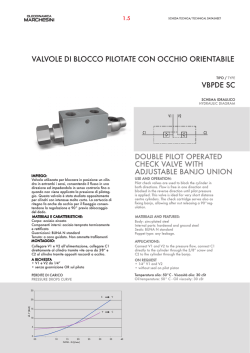
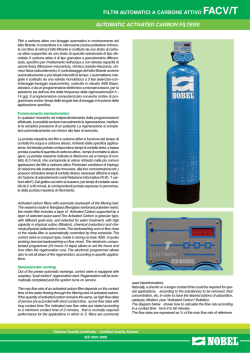
American Journal of Environmental Sciences 3 (3): 98-105, 2007
ISSN 1553-345X
© 2007 Science Publications
Evaluation of Nitrogen Non-Point Sources in Po River Near Turin
Giuseppe Genon, Franco Marchese
DITAG – Dipartimento del Territorio, dell’Ambiente e delle Geotecnologie
Politecnico di Torino – C.so Duca degli Abruzzi 24, 10129 - Torino, Italy
Abstract: The non-point hydraulic and nitrogen loads in the stretch of Po river upstream and
downstream from the city of Turin have been investigated, on the basis of regular data concerning
quality and flow rates in the river in different periods of a reference year.
The collected data have been organized in terms of hydraulic and mass balances, taking into account
input points, affluents and withdrawals, and the missing terms as concern non-point loads or transfer
phenomena with surrounding banks and connected aquifers have been identified.From the nitrogen
speciation it was possible to distinguish between different contributions to river load, and to estimate
presence of agricultural loads, run-off phenomena from impervious urban areas, aquifer connections.
All these information can be useful for a better assessment of the surrounding territory in order to
improve river quality for different uses.
Keywords: River model, nitrogen balance, non-point sources, sampling, river quality
INTRODUCTION
In the treatment plant of the city of Turin (SMAT plant)
the city wastewater (one million inhabitants) and a high
number of surrounding communities are treated; the
treated flow is introduced in Po river downstream of the
city, in Castiglione territory.
For the present study considered year (2003), the total
nitrogen removal rate was 4200 tons, and the residual
quantity that has been discharged in the river was 3900
tons, with an amount of 3100 in nitric form. This flow
rate in any case will be shortly strongly decreased in
account of final activation of denitrification stage.
The influence of nitrogen punctual sources on the water
quality in the river stretch downstream of input point
has been studied in the past [1], and it could be
calculated on the basis of introduced load. On the
contrary very little are the indications about effects
deriving from non-point sources, and chiefly the ones
corresponding to wash-out of rain impervious surfaces
of urban Turin area. The city of Turin rain waters, after
collection with a separate sewing systems flow in river
Po. The treatment necessity for this flux and the
urgency of this intervention will be defined after the
obtention of a complete knowledge of real load in
comparison total non-point load. This estimation can be
done for some pollutants, as example heavy metals, but
on the contrary it is very difficult for nitrogen.
The aim of this study was to individuate the non-point
nitrogen flows directly or indirectly introduced in the
urban stretch of the river, and to identify if it is possible
their origin [2]. In order to do this, all the pertaining
past data have been revised, and the useful ones have
been chosen in order to define a mass balance for loads
calculation. In order to be able to evaluate the effects of
urban area, in the study large river stretch upstream and
downstream from the city has been considered.
MATERIALS AND METHODS
Considered river stretch: The head of the Po river is
located in West Alps in Piedmont, it cross the Padana
plain and it flows in the Adriatic Sea after a run of 652
km. After 100 km from the head of the river arrives to
the place of the city of Turin; the considered river
stretch for this study was comprised between km 47 and
km 127 from the source. In fig. 1 the studied sections
are reported, together with affluents, withdrawals, input
point, and their distances.
Fig. 1 : Hydraulic scheme of considered river stretch
Sections : 1 = Cardè; 2 = Carignano; 3 = Moncalieri; 4
=Torino; 5 = San Mauro; 6 = Castiglione; 7 = Brandizzo
Corresponding Author: Giuseppe Genon, DITAG (Dipartimento del Territorio, dell’Ambiente e delle Geotecnologie)
Politecnico di Torino, c.so Duca degli Abruzzi 24, 10129 - Torino, Italy
98
Am. J. Environ. Sci., 3 (3): 98-105, 2007
about chemical characterization are point data with
monthly frequency: they are at disposal for all the
affluents and study Sections, with exception of Section
6 (Castiglione). For the treatment plant the mean
monthly values are known, and also more detailed
information.
There is not analytical information about Cimena
channel.
An inconvenient aspect arises from the consideration
that the samplings of each month have been realized in
different days, and not in each case in the same day for
the different sampling stations. Moreover for affluents
the sampling station in some cases doesn’t correspond
with closure section or the section where the flow rate
was measured.
The parameters taken into account in the study were:
pH, conductivity, chlorides, sulfates, total nitrogen,
nitric nitrogen, ammonia nitrogen, phosphorus. In the
present paper we will present only the data concerning
nitrogen different forms.
In the first upstream part, from section 1 to section 2
and nearly to section 3, it chiefly runs through rural
areas. On the contrary populated and industrial zones
are only present from km 90 more or less. The zone
corresponding to urban area is comprised between
Section 3 (Moncalieri) and Section 5 (San Mauro). The
river flows along a hills belt bounding the Turin city in
its South West part. The larger extension of the city is
in the left bank, between the confluence of the Sangone
tributary and the Stura one, and it is crossed from Dora
river. On the right bank the urban development was
limited to a narrow zone before extension on the hills.
The Section 4 (Torino) is located more or less at the
centre of urban stretch.
Downstream from the city immediately after Section 5
(San Mauro) the hydraulic scheme is complicated by
the Cimena channel derivation, and input
from
wastewater treatment plant of Turin district (SMAT),
after Section 6 (Castiglione). In account of Cimena
channel derivation the river flow rate is strongly
reduced, and in some seasonal periods the treatment
plant discharge can be of the same order of magnitude
of receiving body flow rate. Between section 3
(Moncalieri) and Section 7 (Brandizzo) theoretically
there are not conveyed untreated loads, with exception
of the flows deriving from rain water collection
obtained with the dedicated sewer network of the city.
Data processing and utilized balances
The hydraulic balance equation for
downstream river section is:
a
generic
Qv = Qm + ∑ Fi + ∑ Qpi + ∑ Qri + ∑ Qfei - ∑Qdi - ∑
Qfui
Available data
We chiefly used monitoring data of Piedmont Region,
but also data of different origin. The data have
reference to year 2003, as during this year we found the
maximum of available data.
where:
Qv = downstream river flow rate
Qm = upstream river flow rate
Fi = affluent flow rate
Qpi = input point flow rate
Qri = surface streaming flow rate in direction of river
Qfei = underground draining flow rate
Qfui = flow rate from river to underground
Qdi = derivation flow rate for irrigation, industrial use,
hydroelectric plants, drinking
As it is impossible to solve the balance equation for all
interesting stations as a consequence of difficulty to
determine all the unknown terms, we used a more
simplified balance equation
Flow rate data
The daily flow rates of all Po sections are available,
with exception of Section 7 (Brandizzo); also for
affluents it was possible to obtain these data, but on
some cases they are measured in sections different from
closure section or surrounding points. For the
Moncalieri Po Station (Section 3) the flow rate data are
referred to a different Section from the analytical
samples one; besides they are not part of the Regional
Monitoring Network.
For SMAT treatment plant we used available data of
monthly mean flow rate.
It was not possible to obtain data about Cimena
channel.
Qv = Qm + ∑ Fi - ∑Qdi +/- ∑ QDiff
where the term +/- ∑ QDiff represents the net nonpoint flow rates; in this term all the water exchanges
with underground, surface streaming flows and difficult
to estimate non-point fluxes have been included.
The balance resolution leads to flow rate improvements
in the stretch between two stations in account of these
fluxes, or its decreases if withdrawal from river are
prevailing.
The balance has been applied in cases where it was
possible with daily data, as an alternative with
aggregated data as monthly mean flow rates. The net
non-point flow rates that was possible calculate from
the balances have been indirectly verified, for upstream
Rainfall data
For different stations on the regional territory it was
possible to find data (rain mm every 10 min.).
Analytical data
For some Sections monitored physico-chemical data
automatically taken together with flow rate value are at
disposal, i.e. temperature, pH, electrical conductivity,
dissolved oxygen. On the contrary the information
99
Am. J. Environ. Sci., 3 (3): 98-105, 2007
account of reduced flow rate and wastewater treatment
plant discharge influence.
The third stretch has non been further divided has it was
difficult to evaluate the different effect of city load in
the two different stretches Moncalieri –Torino and
Torino – San Mauro. Moreover it has been evaluated
that the flow rate values concerning Moncalieri are not
completely reliable, so the consideration of a shorter
stretch could have an higher influence on obtained
results; lastly, by this definition, with exclusion of first
one all the stretches have a similar river length. The
data concerning section 4 (Torino) can be used for
verification purposes.
The decision to limit the investigated area to the section
7 (Brandizzo) where there are not at disposal flow rate
data is unavoidable, as the downstream hydraulic
situation is absolutely more complex, and consequently
it should be completely impossible to establish reliable
mass balances.
Turin river stretch, but means of comparison with
inflow and down flow year volumes that have been
calculated on the basis of rain quantities, and river basin
characteristics. For the stretches Carignano-Cardè and
Carignano-Moncalieri, the volumes that was possible to
determine were respectively 75 % and 92 % of the
values that were estimated from rain data processing.
From the simplified hydraulic balance equation it has
been possible to derivate the mass balance equation that
was used in order to define the mass loads in a generic
downstream section:
Qv Cv = QmCm + ∑ FiCi - ∑Qdi Cdi +/- ∑ QDiff CDiff
where together with hydraulic flow rates concentrations
are considered. The term +/- ∑ QDiff CDiff represents
the net load deriving from non-point introductions or
losses in the considered stretch. The term CDiff
indicates the concentration that can estimated for the
net flow.
In account of the fact of the non-conservative nature of
dissolved nitrogen, in the net load term it will be
included also the contribution deriving from chemical
and biological removal phenomena, or vegetative
uptakes [3]. If the net load value is negative, on the
basis of the known net non-point exchanged mass flow
rate it was possible in some cases to obtain semiquantitative estimations of nitrogen degradation or
uptake.
The point load data have not been evaluated, as the
analytical data at disposal are referred to different
month days for different sections and different
affluents. Therefore for the calculation of the nitrogen
net loads in the equation we introduced mean monthly
flow rates, and for concentration values instead of point
values it was used the mean value of two following
samplings, obviously by considering a linear variation
of concentration between two following determinations.
In order to be able to have a direct comparison the net
non-point loads have been also referred to the river
length unit.
Some other quantitative considerations have been
introduced about year mean values of volumes and
loads [4].
Methods for evaluation of lacking flow rate values:
For Cimena channel and Po river in Brandizzo it was
necessary to completely define flow rate values, and for
Po river at Moncalieri station it was necessary to revise
the measured values.
In order to evaluate the unknown flow rate values, it
was used a chloride mass balance, by considering the
conservative nature of this parameter. This assumption
was justified from the observation that this procedure
has been previously used by Authors with satisfying
results in the verification of flow rate balances in
stretch upstream from Moncalieri.
In order to calculate flow rates for Cimena channel, the
balance equations are:
QCimena = QSect. 5 + ∑ QDiff - QSect. 6
Q Sect.5 [Cl-] Sect. 5 = Q Sect. 6 [Cl-] Sect. 6 + Q Cimena [Cl-]
Cimena + ∑ QDiff [Cl ] Diff
The chlorides concentration of Cimena channel can be
taken as equal to the concentration in section 5 (San
Mauro), whereas the value in section 6 (Castiglione) is
not known. We have three parameters to be determined,
and the system cannot be solved. The net non-point
flow rate in stretch 5 – 6 is part of the measured value
in Castiglione station. The possible non-point chloride
input presents a very low influence in chloride
concentration in Castiglione, and so this concentration
can be considered corresponding to the value
determined for San Mauro. This simplification
corresponds to the adoption of the hydraulic flow rate
balance only, by assuming that in the flow rate value
determined for Castiglione the non-point input, that
really cannot be known for this stretch, are included.
In order to determine the Brandizzo section river flow
rate, the balance equations are:
Individuation and choosing of considered stretches:
Four different characteristics stretches have been
chosen to represent different aspects, namely
I
Cardè Carignano
II Carignano Moncalieri
III Moncalieri S. Mauro
IV San Mauro Brandizzo
In the first two stretches we could recognize a territorial
situation with an agricultural vocation; the third one
represents the influence of Turin and other urbanization
areas; the last one shows important aspects of interest in
Q Sect. 7 = Q Sect. 6 + QSMAT + ∑ QDiff
100
Am. J. Environ. Sci., 3 (3): 98-105, 2007
Table 1: Monthly flow rates for affluents, withdrawals, wastewater
Pellice Varaita
3 -1
3 -1
Maira
Banna
3 -1
3 -1
Chisola Sangone
3 -1
(m s ) (m s ) (m s ) (m s ) (m s )
January
8.01
6.22
17.15
2.11
5.62
7.16
Stura
3 -1
3 -1
Cimena a SMAT
(m s ) (m s )
21.30
(m3 s-1)
(m3 s-1)
-72.0
5.93
4.55
4.30
4.41
12.83
0.78
4.27
2.88
18.60
5.14
-84.4
5.77
March
4.45
4.46
14.64
0.54
3.30
3.66
20.10
4.66
-94.2
5.85
April
5.47
5.33
14.21
0.55
4.87
2.58
20.90
10.70
-106.1
6.11
May
17.97
8.86
23.49
0.50
4.50
4.96
36.80
20.70
-140.6
6.32
June
4.73
4.84
5.59
0.24
2.42
1.13
24.60
23.65
-135.0
6.98
July
1.46
0.45
0.30
0.15
0.70
1.47
6.55
5.14
-18.9
6.87
August
1.33
0.21
0.29
0.18
0.57
1.42
3.16
6.16
-13.3
5.41
September
1.06
0.39
0.60
0.19
1.19
1.84
7.20
10.17
-15.7
5.94
October
0.99
2.33
3.69
0.22
1.61
1.01
12.10
8.68
-33.0
5.79
November
1.55
4.77
7.56
0.73
3.89
1.60
14.00
17.30
-55.7
6.67
December
15.9
6.53
10.36
2.69
11.43
11.62
18.10
39.00
-89.1
6.77
annual average
a
calculated values
5.60
4.07
9.23
0.74
3.70
3.44
16.95
12.99
-71.5
6.20
RESULTS AND DISCUSSION
The values for different months of mean flow rate are
reported for the considered Sections in fig. 2: the values
concerning Section 7 (Brandizzo) have been calculated,
while the values for Section 3 (Moncalieri) have been
determined by using the above described procedure. It
is possible to observe two maximum values
corresponding to periods of April – May and November
– December, for all Sections.
In table 1 it is possible to observe the monthly and
yearly mean values of affluent flow rates, discharges
and derivations (the Cimena channel values have been
calculated, the derivations present a negative sign).
It is interesting to note the very high value for
derivation flow rate of Cimena channel.
By assuming the same concentration for chlorides in
Castiglione (Section 6) and S. Mauro (Section 5), and
by assuming for the value of chlorides in non-point
input a value equal to the mean chlorides concentration
in underground waters measured in this area (this value
has been experimentally determined), the system can be
solved.
The equation and this specific solution cases have been
considered by using mean monthly values for flow rate
and also mean values for concentrations, as previously
indicated.
As concerns Moncalieri section, the data have been
aggregated in mean monthly values, compared and
mediated with the values that were obtained by means
of a chlorides balance for section 4 (Torino).
200
8
Po Cardè
Po Carignano
Po Torino
Po San Mauro
Po Castiglione
Po Brandizzo*
Po Moncalieri**
160
140
120
7
6
Total Nitrogenl (mg/l)
180
100
80
60
5
4
3
2
40
20
1
1
be
r
be
r
0
01/2003
De
ce
m
No
ve
m
O
ct
ob
er
t
be
r
Au
gu
s
Time (months)
Se
pt
em
Ju
ly
Ju
ne
ay
M
Ap
ril
ar
ch
M
ry
Fe
br
ua
ry
0
Ja
nu
a
3 -1
(m s )
Dora
February
Q Sect. 7 [Cl-] Sect. 7 = Q Sect. 6 [Cl-] Sect. 6 + Q SMAT [Cl-]
SMAT + ∑ QDiff [Cl ] Diff
Flow rate (m s )
3 -1
02/2003
03/2003
04/2003
05/2003
06/2003
07/2003
2
08/2003
3
4
09/2003
5
10/2003
7
11/2003
Time (months)
Fig. 3a : Total nitrogen concentration in Po river
Fig. 2 : Monthly flow rates in the Po river
101
12/2003
Am. J. Environ. Sci., 3 (3): 98-105, 2007
In fig. 3 it is shown the time behavior of point
concentrations for different nitrogen forms. In absolute
terms the higher values can be observed in Section 7
(Brandizzo) as a consequence of wastewater treatment
plant discharge, taking into account that the mean
residual concentrations from the plant in total, nitric,
ammonia nitrogen are respectively 20, 16, 3 mg/l.
As these concentrations and also discharged flow rate
are generally constant, the receiving body impact is
totally dependent on its flow rate, and in general it is
possible to observe that concentration values present an
inverse relationship with river flow rate. The values for
November and December show an exception to this
observation, as both concentration and flow rates are
quite high. As a percentage the higher variations can be
observed for ammonia nitrogen parameter.
The calculated (mass balance) value for non-point
volumetric flow rate for the considered stretches can be
seen in fig. 4: higher values can be observed in stretch
III (Moncalieri – S. Mauro), while in correspondence
with flow rate peaks of May and December for
stretches II and IV significant negative values have
been obtained.
In fig. 5 the non-point loads for different nitrogen forms
as previously calculated are reported: as concerns total
and nitric nitrogen, highest values can be observed in
stretch III, for ammonia in stretches II and IV; chiefly
in stretches II and IV it is possible to observe negative
values for total and nitric nitrogen; for ammonia, the
negative loads are evident in stretches I (first part of the
year) and IV. The stretch I presents in all periods
positive net values for non-point total and nitric loads.
6
Nitric Nitrogen (mg/l)
5
4
3
2
1
1
0
01/2003
02/2003
03/2003
04/2003
05/2003
06/2003
07/2003
2
3
08/2003
4
09/2003
5
10/2003
7
11/2003
12/2003
Time (months)
Fig. 3b : Nitric nitrogen concentration in Po river
1,4
Ammonia Nitrogen (mg/l)
1,2
1
2
3
4
5
7
1
0,8
0,6
0,4
0,2
0
01/2003
02/2003
03/2003
04/2003
05/2003
06/2003
07/2003
08/2003
09/2003
10/2003
11/2003
12/2003
Time (months)
Fig. 3c : Ammonia nitrogen concentration in Po river
80
70
Cardè-Carignano
Carignano-Moncalieri
Moncalieri-San Mauro
San Mauro-Brandizzo
60
50
3 -1
Net flow(ms )
40
30
20
10
0
January
February
March
April
May
June
July
-10
-20
-30
Time (months)
Fig. 4 : Net non-point flows
102
August
September
October
November December
Am. J. Environ. Sci., 3 (3): 98-105, 2007
It can be observed the presence of decidedly higher
values for total and nitric nitrogen loads in stretch III
(Moncalieri – San. Mauro), chiefly if non-point specific
loads are considered. These values can be explained if
we consider the distributed high loads deriving from the
hills in the right bank and run-off phenomena. The total
quantity that in this urban stretch is introduced in the
river, is a little more that the quantity introduced
downstream from the SMAT discharge: it is in any case
quite impossible to distinguish between the nitrogen
load deriving from urban area and that one that is
connected with hills zone run-off.
200
Total nitrogen
Cardè-Carignano
Carignano-Moncalieri
Moncalieri-San Mauro
San Mauro-Brandizzo
150
-1
Net load (gs )
100
50
0
January
March
May
July
September
November
-50
50
-100
Time (months)
Fig. 5a : Net non-point loads of total nitrogen
40
150
Nitric nitrogen
30
20
10
50
-1
Net load (gs )
100
Rain (mm)
Cardè-Carignano
Carignano-Moncalieri
Moncalieri-San Mauro
San Mauro-Brandizzo
0
01/2003
0
January
March
May
July
September
02/2003
03/2003
04/2003
05/2003
06/2003
07/2003
08/2003
09/2003
10/2003
11/2003
12/2003
Time (days)
November
Fig. 6 : Precipitation in Turin
-50
On the annual balance in this stretch the nitric nitrogen
represents 72 % of total nitrogen. During the periods
when the total nitrogen load is the same, the ratio
nitric/total is 0.88 in May,0.78 in January, 0.23 in
December: it can be supposed that in December as a
consequences of high rain intensities of this period (as
it is reported in fig. 6) there is an high run-off from hills
zone with organic nitrogen entrainment. On the
contrary in May and June the less strong rain quantities
follow a four months period of dry weather, and so an
effective wash-out from urban areas is the origin of an
higher presence of nitrates [5].
In the first months of the year, in account of the very
low level of rains, the principal source of non-point
input can be considered underground drainage: the
underground waters in Turin show an high nitrate
concentration (more than 20 mg/l) and very low
concentrations of reduced nitrogen; so it can be
explained the high ratio in non-point loads. During
May and June the contribution deriving from urban
areas may be considered as an important aspect, as we
have seen, and at the same time this effect is not
compensated from a dilution effect arising from run-off
surface water where the content in nitric nitrogen is
lower.
During December the high rain volume determines an
effect of dilution of washed nitrogen, and the same time
there is an increase, as a percentage, of reduced
-100
Time (months)
Fig. 5b : Net non-point loads of nitric nitrogen
150
Nitric nitrogen
Cardè-Carignano
Carignano-Moncalieri
Moncalieri-San Mauro
San Mauro-Brandizzo
50
-1
Net load (gs )
100
0
January
March
May
July
September
November
-50
-100
Time (months)
Fig. 5c : Net non-point loads of ammonia nitrogen
In table 2 the yearly mean values for net non-point
volumetric flow rates and nitrogen loads are reported;
there is also an indication of total year contribution, and
specific values for each km of river length.
103
Am. J. Environ. Sci., 3 (3): 98-105, 2007
underground
water (4.3 mg/l). Also in this case an high
Table 2 : Net non-point flow and net nitrogen non-point load
(annual values)
nitric/total
nitrogen II
ratio can be observed.
I
III
IV
In stretch
the contraryMoncalieri
the percentageSan
of Mauro
nitric
from
Cardè II onCarignano
nitrogen was quite low (about 0.16), and at the same
Non-point flow
Total annual non-point flow
Linear total annual non-point flow
Non-point load of Ntot
Non-point load of Nnitr.
Non-point load of Nammt
Linear non-point load of Ntot
Linear non-point load of Nnitr
Linear non-point load of Nammt
Total annual non-point load of Ntot
Total annual non-point load of N nitr
Total annual non-point load of Namm
to
Carignano
Moncalieri
San Mauro
Brandizzo
m3 s-1
m3 y-1
m3 y-1 km-1
g s-1
g s-1
g s-1
g s-1 km-1
g s-1 km-1
g s-1 km-1
g y -1
g y -1
g y-1
11
347· 106
9.5
66.4
53.2
-1.7
1.81
1.45
-0.046
2094· 1012
1678· 1012
-54· 1012
1.8
57· 106
3.9
16
2.5
4.6
1.11
0.17
0.319
505· 1012
79· 1012
145· 1012
21.6
681· 106
49.3
76.4
55.1
2
5.54
3.99
0.145
2409· 1012
1738· 1012
63· 1012
6.4
202· 106
13.5
-13.7
-9.3
0.1
-0.92
-0.62
0.007
-432· 1012
-293· 1012
3 · 1012
nitrogen deriving from run-off from fields and exterior
surfaces with high vegetation presence.
In stretch IV, in comparison with positive values for
volumetric flow rates, the loads are negative for total
and nitric nitrogen, negligible for reduced nitrogen;
from the monthly balances of stretch IV it can be
observed that only in May, September and December
the sum of withdrawals from the river present higher
values than contributions, whereas there are negative
loads in more months for total and nitric nitrogen: this
fact can be considered an index of algae uptake or
biological and chemical degradation [6].
In the periods when both volumetric loads and mass
loads present negative values, these phenomena can be
taken into consideration; in fact if the load that can be
defined by multiplying volumetric withdrawal by mean
concentration parameter in the specific stretch, that can
be considered emitted load, presents a lower value in
comparison with the balance calculated load, this
difference should represent the effectively took in or
removed load; as concerns nitric nitrogen, in stretch IV
we observed values of 12 g/s in May and 36 g/s in
September; on the contrary in December the extracted
load is higher than the balance value, so it was not
possible to define an estimation of degradation.
In stretch I the non-point volumetric loads were all the
time positive, and on the contrary reduced nitrogen
loads that are in general negative; this fact is an
indication of removal phenomena, in account of the
streaming flow of this stretch that increases these
mechanisms. By considering the total flow rate
introduced in the river, and overall nitric nitrogen input,
in account of general positive river contribution of this
stretch, a mean concentration of non-point loads can be
estimated with a value of 4.8 mg/l, that is a value very
similar to the characteristic value of this zone
time the reduced nitrogen load is quite important. In
this case a suitable explanation could be found in
contributions from urban or livestock wastes, that it is
impossible to evaluate. In absolute terms the introduced
total and nitric nitrogen load is lower in comparison
with values for upstream stretch, this fact can be
explained with low values of contribution, in account of
flat situation of territory and at the same time utilization
of only nitric nitrogen as a fertilizer.
By using volumetric flow rate balances it was possible
to identify net hydraulic input for the different
considered stretches, and with mass balances we
estimated nitrogen non-point loads.
The stretch corresponding to the urban zone shows
higher hydraulic contributions, and also high values for
total and nitric nitrogen load; for the considered year
the introduced load of this stretch was 50 % of the
residual load introduced from city wastewater plant.
It was not possible to define the contribution to nonpoint loads of the run-off rain water that enters in the
Po river through the separate sewer network of the city,
also if an influence of this aspect has been identified:
the definition of this contribution will require a further
study activity.
We identified the presence of reduced and nitric
nitrogen removal mechanisms chiefly in the stretch
downstream from the city, and only in this stretch for
nitric nitrogen load negative values have been obtained.
On the basis of these observations, some general
indications of the present work can be drawn:
- from the point of view of phenomena estimation
and data acquisition, it is necessary to improve
sampling points, both from the point of view of
hydraulic data and also as concerns concentrations,
and to give a systematic approach to this scheme of
104
Am. J. Environ. Sci., 3 (3): 98-105, 2007
-
-
2.
data collection, in order to can be able to efficiently
use information;
from the point of view of phenomena
comprehension, it was possible to identify some
important impact transfer aspects from the river
banks, and dynamic transformations in the river,
that can be useful for a better approach to river
modeling for this stretch;
from the point of view of public policy, the
information about potential non-point transfer
phenomena from the surrounding territories or
from urban zones can support decisions of public
authorities in terms of better agricultural policies or
urban sewer network assessment, in order to better
protect the water resource.
3.
4.
5.
REFERENCES
6.
1.
Rosselli A., 2004. Verifica di un impianto di
denitrificazione. Politecnico di Torino, Tesi di
laurea
105
Gerda van Dijk, M., L. van Liere, W. Admiral,B.A.
Bannink, J.J. Cappon, 1994. Present state of the
water quality of European rivers and implication
for management. The Science of the Total
Environment,145,: 182-195.
Rauch, W., M. Henze, L. Koncsos, et al, 1998.
River water quality modeling : State of the art.
Water Science Technology, 38, (11) : 237-244.
Marchetti, R., N. Verna, 1990. Valutazione dei
carichi teorici di fosforo e di azoto dei bacini
costieri dell’Emilia Romagna. Acqua Aria, 1 : 4145
Capodaglio, A., V. Novotny, S. Zheng, 1990.
Modello di simulazione dell’inquinamento diffuso
di origine urbana per il bacino della laguna di
Venezia. Ingegneria Ambientale, XIX, (9) : 563573.
Warwick, J.J. and A.J. McDonnell, 1985.
Simultaneous in stream nitrogen and DO
balancing. ASCE, Journal of Environmental
Engineering, III, (4): 401-430
© Copyright 2026 Paperzz