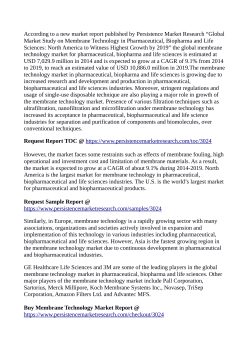
Articles
In d ian Jo urn al of Che mi cal T echn o logy
Vo l. 10, May 2003, pp. 3 11 -320
Mass transfer analysis of the extraction of Nickel(II) by emulsion liquid
membrane
Mousumi Chakraborty*", Chiranj ib Bhattacharyah& Siddhartha Dattab
" De partme nt of C he mi cal Eng ineerin g, S V Reg io nal Co llege of Eng in ee ri ng &Tec hn o logy, Sura t 395 007 . Ind ia
hDe partm e nt o f C he mica l Eng inee ring, Jada vpu r Uni ve rsity. Ko lk a ta 700 032 , India
Received 15 Julv 2002; revised received 17 January 2003; accepted 20 February 2003
A mathematical model for batch extraction of Nickei(II) with emulsion liquid membrane (ELM) from a dilute
sulphate solution and from industrial wastewater, using di-(2-ethylhexyl) phosphoric acid (D2EHPA) as extractant
and hydrochloric acid as stripping agent is reported. The model considers a reaction front within the emulsion
globule and assumes an instantaneous and irreversible reaction between the solute and the internal reagent at the
membrane internal droplet interface. Batch experiments are performed for separation of Nickei(II) from aqueous
sulphate solution of initial concentration in the range of 100-75 mgJL. The influence of Nickei(II) concentration on
the distribution coefficient at pH 3.5 is co-related by a semiempirical model, which has been used for simulation of
the extraction process. The simulated curves are found to be in good agreement with the experimental data.
A vari ety of separati on probl e ms have been
in vesti gated over the last three decades by usmg
e mul sion liquid me mbrane (ELM ) processes .
Compared to co nventi onal processes, ELM processes
have certainly so me attracti ve features e.g. simpl e
operati on, hi gh effic iency, ex tracti on and stripping in
one stage, larger interfac ial area, scope of co ntinuou s
operati on,
etc.
The
applicati o ns
include
16
hydrometallurgical recovery o f metal io ns - , re moval
of weak ac ids and bases from wastewater7- 11 , and
applicati on in bi ochemi cal and bi omedi cal fi elds 12- 14 •
ELM s are usuall y fo rmed first by makin g an e mul sion
of two immi sc ibl e phases and the n di spe rsing the
emul sion in a third phase (continuous phase). The
liquid me mbra ne ph ase refers to th e ph ase whi ch
separates the e ncapsul ated ph ase in the emul sion and
the ex tern al continu ous phase whi ch are, in general,
compl etely mi sc ibl e.
Th ere are two types of tra nsport mechani sms. In the
first mechani sm , call ed carri er-facilitated transport
mech ani sm, a carri er is incorporated in the me mbrane
phase to increase the mass tran sfer rates 5 . In th e
seco nd mechani sm, th e so lute firs t dissolves in the
me mbrane ph ase near th e ex ternal interface and th en
diffuses through it to the in ward reg ion of e mul sion
dro p in the di sso lved state and is released in to th e
intern al phase by reversin g the so luti o n process. Thus
*Fo r corres po nde nce
Fax: 026 1 3228394).
(E- mail:
mousumi_c ha kra @y ahoo.co m ;
a concentrati o n gradi e nt is maintained across the
me mbrane 7 .
A number of mathem atical models have been
de vel oped over the years to describe the mechani sm
o f solute tra nsfer th rough e mul sio n liquid me mbranes .
Based on the homogeneous di stribution of noncirculating intern al droplets w ithin the globule, Ho et
15
al. formul ated the advancing reactio n front model.
The me mbrane so luble so lute di ffuses th rough the
g lobul e to a reacti on front where it is re moved by an
instantaneo us and irre versibl e reacti on with the
internal reagent. As the reagent is consumed by
reacti o n, thi s reacti on front advances into the g lobul e.
17
Stroeve and Yaranas i 16 and Fales and Stroeve
ex te nded th e approach of Ho et a/. by including an
additi onal mass transfer res istance in the continuous
18
ph ase. Kim et al. assumed an additi onal thin liqu id
me mbra ne layer, which contained no inte rnal
dro pl ets.
An alte rn ate a pproach has been take n by Te ra mo to
19
20
et al. and Bunge a nd Nobl e . They incorporated
reacti on revers ibility in describing the transport
process in the e mul sio n g lobule. C han and Lee 11
assumed reacti on equilibrium to ex its in both th e
inte rnal and extern al continuous ph ases. They also
incorporated th e overall mass tra nsfer res istance in
their model. The reversibl e model was later extended
21
to predi ct the ex trac tion rate fo r
by Braid et a/.
multi co mpo ne nt systems.
Articles
Nickel, copper and chromium are the three most
commonly used metals for electroplating. The
wastewater of electroplating industries contains
22
Nickel(II) ions. Ku lkarni et al.
have used ELM
application for the recovery of Nickel(II) using
D2EHPA as a carrier. Katsushi et al. 23 have show n
that the use of a mixture of co mme rcial extractant
LIX63-DOLPA has a hi gh synergistic effect o n the
ex tracti on of Nickei(II) in the ELM system compared
24
to the LIX63-D2EHPA mixture. Serga et al. found
that app li cation of direct current to ex trac ti o n system
contributes to the complete extractio n of Nickei(II)
using D2 E HPA as carri er. Recentl y Kulkarni et al. 25
have studi ed the recovery of Nickci(II) usi ng methane
sulphonic ac id (MSA) as a strippant.
There still exists so me scope for better insight into
Nickei(II) recovery by ELM process. In thi s pape r the
effects of initial so lute (N ickel) concentrati on in feed
phase, internal reagent concentration, treat ratio and
volume fracti o n of internal phase on the extraction of
Nickei(II) are sys te maticall y in vestigated usi ng
D2EHPA as a ex tractant. In view of this, applicatio n
of thi s technique is investi gated for re mova l o f
Nickei(II), from wastewater using di-(2-ethylhexyl)
phosphoric acid (D2E HPA) as ex tractant, Sorbitan
mono-oleate (Span 80) as surfactant, kerosene as
me mbrane phase and hydrochl ori c ac id as stripping
so luti on. Here, di-(2-ethylhexyl) phosphoric acid
(D2E HPA ) faci litates the transport o f Nickei(IT) and
Nickei(II) ion is simultaneo usly changed by intern al
reagent, hydroc hl oric ac id, to ni ckel chl oride which
has a low so lubility in membra ne phase, so that
concentration grad ient of Ni ckei(II) between two
aqueous ph ases is mai ntain ed.
Experimental Procedure
Simulated feed
For the study of transport of Nickei(II) ions through
e mul sion liquid membrane, ni c kel sulphate (99.99 %
pure, Merck make) is used.
Industrial feed characteristics
Local electropl ating company supp lied the
industrial feed. The feed contains large concentration
of Nickel(II) and trace a mount of copper(II),
chromium(III)
a nd
iron(II).
Indu stri al
feed
composition is summ arized in Table I.
Commercial kerosene of specific gravity 0.798 and
boiling poi nt range 145-250°C is used as me mbra ne
phase. The extractant used is D2E HPA [CAS No.
298-07-7] hav in g 98.5% purity, Span 80 (Sorbitan
312
Indian J. Chem. Tec hno !., May 2003
Table !- S umm ary of expe rimental cond ition s for ELMs batc h
tests
Membrane phase (Oil)
Vo lume
Carrie r(D2EH P A)
Diluent (11-hepta ne )
S urfac tan t (Span 80)
Ke rose ne
25 mL
10 % V/V
5% V/V
5 % V/V
80% V/V
Exterior phase (Water)
Vo lume
Ni c kel(ll)
pH
Buffer ( NaAc-HA c)
450 mL
100-200 ppm
1- 6
0.05 mo i/ L
Interior phase (Water)
Vo lume
Ac idi ty
25mL
IN (HC I)
Industrial feed composition
E le me nt s
Co ne. (p pm )
Ni
900
Cr
45
Fe
40
Cu
50
Fo r preparati o n o f aqueo us soluti o ns do uble d istilled water has
bee n used.
monooleate containing 0 2 based mo ieties) as
surfacta nt; 11-hepta ne as a diluent and stabi li zer for the
membrane phase. Sodium acetate-Ace tic acid (NaAcHAc) is used as a buffer (to maintain pH) for ail the
ex peri me nts.
Method
Emulsion IS prepared by emu lsifying aqueo us
so luti on of ac id (s trip ph ase) with an organi c phase
(membrane ph ase) . The membrane co nsists of varying
proportio ns of surfactan t Span 80, extractant
D2EHPA, and dilu e nt (n-heptane ). Th e mixer is
st irred at 5000 rpm for 15 min using a homogenizer
(s ix blade turbine impell er of 30 mm diameter) to
form a uniform mixture. Then the internal strip phase
is added . The contents are again stirred at 5000 rpm
for 15 min. An exce ll e nt milky-white and stable
e mul sio n is obtained. The emul si on is dispersed in
feed phase CO!ltaining nickel ions from wh ich ni ckel
is to be ex tracted. A six-blade paddle impell er of 50
mm diameter rotating at 500 rpm is used for stirring.
For measuring speed o f the agitator and homogeni ser
a hand tachometer hav in g a range of 0-10000 rpm has
been used.
Samples of about 5 mL are w ithdrawn from the
extmc tor at different intervals of time and are filtered
through a sintered glass plug to separate emulsion and
aq ueous feed phase. At the e nd, the emul sio n phase is
Articles
Chakraborty et al.: Nickel(II) extraction by emulsion liquid membrane
separated from feed phase by gravity separation in a
separating funnel and finally the emulsion is broken
down by heating to 80°C for the analysis of strip
phase.
2
ex. phase
org. phase
in. phase
2(HR) 2
Analysis
Samples of aqueous phase, containing nickel, have
been analyzed by a spectrophotometer (CE1020, 1000
series manufactured by CECIL) according to the
standard methods 26 .
Results and Discussion
Mechanism of Nickel(II) extraction process using
ELM
The equations given below show the extraction and
stripping reactions of Nickel(ll) occurring in ELM
process, where RH represents the protonated form of
an extractant (D2EHPA, in this study). D2EHPA IS
known to dimerize in nonpolar aliphatic solvents.
Formation of the complex:
Ni 2+ + 2 (HRh = NiRiHRh + 2 H+
... (1)
Stripping reaction:
NiR2(HRh + 2H+ = Ni 2+ + 2(HRh
... (2)
Eq. (1) represents the complexation reaction, which
occurs at the membrane-external phase interface,
while Eq. (2) shows stripping reaction at the
membrane-internal aqueous phase interface. A
schematic presentation of the liquid membrane
globule and simultaneous extraction and stripping
mechanism in ELMs is exhibited in Fig. 1.
Mathematical description
In
the
present study,
an
unsteady-state
mathematical model is proposed for the separation
and concentration of Nickei(II) ions using liquid
surfactant membranes based on the advancing front
model developed by Ho et al. 15 • According to this
mathematical formulation, at the outer interface of the
emulsion globules, solutes (Nickel ions) from the
external phase reacts with the carrier contained in the
membrane phase, thus forming a complex. The
complex diffuses through the membrane phase until it
is removed by an instantaneous and irreversible
chemical reaction with the reagent (HCl solution)
contained in the internal droplets . The solute cannot
penetrate into the globule beyond those droplets ,
NiR2(HR)
2
(HR)l: dimer of carrier
Fig. !-Simultaneous extraction and st ripping mechanism m
ELMs
which are completely depleted of internal reagent,
because the solutes are immediately removed by
reaction with the internal reagent. Hence, there exists
a sharp boundary or a reaction front separating the
inner region containing internal reagent and no solute
from the outer region where the internal reagent has
been totally used up by reaction with the complex. As
time progresses, more and more reagent is used up
and the radius of the unreacted inner core shrinks. The
concentration of solutes at the surface of the reacted
core is zero. The following assumptions have been
made in developing the present model.
The size distribution of emulsion globules is
uniform. No coalescence or redispersion occurs
between the globules in which the encapsulated
droplets are uniformly distributed.
(ii) There is no internal circulation within all
emulsion globules due to the presence of
surfactants and the small dimension of the
globules.
(iii) The solute reacts with the internal reagent
irreversibly and instantaneously at the reaction
front. As the reaction proceeds, the reaction
front shrinks towards the core of the globules.
(iv) Both the important effects of resistance in the
external boundary layer and the membrane are
taken into account in the model.
(v) The breakage and the swelling of the emulsions
are neglected.
(i)
313
Articles
Indian J. Chern . Techno!., May 2003
A diagram of the model showing the above
assumptions is given in Fig. 2.
The rate of the solute diffusion in emulsion
globules can be described by the following equations:
The material balance for the solute in the membrane
phase
External phase
Ex(emol botrldary layer
............/
;
.-
-
---
'
I
I
Memtnne~
Rea<.iion frort
... (3)
/
where (RJ(t)< r < R, t>o)
(4)
(r..:;,R)
(5)
Fig. 2-Schematic diagram of the model
C=O,
t=O,
Then the diffusion equation becomes:
r=RJ(t),
C=O,
(t~O)
(6)
a8 = _
At r=R,
C=CoCe,
(t~O)
(7)
The material balance for the solute in the extemal
phase is
-v dCe
e dt
t=O,
acl
=lvD
R
e ar r = R
Ce =Ceo
... (8)
... (9)
The material balance of the solute at the reaction front
is
(4 3 ) =4n RJ2 Deacl
ar r=RJ(t)
a CTJ2 ag )
o7J
at
(X <TJ < 1,
r =0,
g =0,
TJ = x,
g =0,
oTJ
... (13)
r > 0)
(TJ..:;, I)
(14)
(r~O)
TJ = 1 then g = Coh at ( r
(15)
~
0)
(16)
The material balance equation in the external phase is:
dh
dr
d -n RJ ¢C
--
1
(1-¢)TJ 2
or
= _ Ea8
aT/ TJ =I
. .. (17)
h= 1
. . . (18)
dt 3
t
= 0,
Rr
=R
The above equations can be
dimensionless form by defining
transformed
(10)
r = 0,
(II)
The material balance equation at the reaction front is
as follows :
into
dx -1- -ag=
dr ¢ m aTJ TJ =x
r
TJ=R'
Del
RJ
x=- r = - 2 - ,
R'
R
c
Ce
c
g=-, h=-, m=-,
Ceo
Ceo
Ceo
314
r=O,
... (12)
X =I
. .. (19)
. . . (20)
The coupled Eqs (13), (17) and (19) have been solved
by numerical computation using an implicit finite
difference technique. A central difference scheme has
been used for integration along the d imensionless
Articles
Chakraborty eta/.: Nickel(II) extraction by emulsion liquid membrane
radial distance. The grid sizes in r and
X
directions
have been chosen by trial and error to obtain good
convergence. As none of the three equations can be
solved independently, an iterative process has been
adopted for each time step. The computational steps
for each time step are as follows:
(i)
Values of hand X have been assumed to be
equal to those in the previous time step.
(ii)
The assumed values of h and X have been
substituted in Eq. (13). Simultaneous linear
algebraic equations having a tridiagonal matrix
of coefficients obtained by representing Eq. (13)
in finite difference form have been solved by
matrix inversion and multiplication method to
obtain g as a function of X.
The solvent assoctat10n factor 1Jf has been taken as
1.0. The viscosity of the membrane phase is
determined to be 0 .0025 kg/ms and the molar volume
of the complex is estimated by additive volume
principle29 to be 0.5125m 3/kg .mol. The molecular
weight of kerosene is determined by obtaining
distillation data, and the average molecular weight of
the membrane phase is calculated to be 142.2. The
value of diffusivity of the complex in the membrane
phase thus obtained is 3.17 X 10- IO m2/s.
The effective diffusivity of the complex in the
emulsion is obtained by the Jefferson- Witzell-Sibbitt
correlation 30 , which in the present study becomes
-n]cm2/s
D . =104 D [4(1+2p) 2
e[f
m
4(l+2p) 2
... (23)
(iii) Whether the values of X and g thus obtained
satisfy Eq. (19) was checked. If they did not, a
new estimate for X was made and the process
from step 2 onward was repeated until the
matching was satisfactory.
(iv)
h has been calculated from Eq. ( 17) and th e
calculated and assumed values of h have been
matched by an iterative process similar to that
adopted in step 3 for solving X.
Estimation of model parameters
Emulsion globule size
The emulsion globule size (Sauter mean) ts
calculated by using the following correlation of
27
Ohtake et al.
... (21)
The value of the interfacial tension between
membrane and external phase is determined by a
tensiometer and found to be 23.5 dyne/em. The value
of d 32 was calculated to be 0.1 em.
Effective diffusivity
The value of the Effective diffusivity of D2EHPAMetal complex in the membran e phase is deter mined
by the correlation of Wilke and Chang 28 :
(117.3xi0 -' 8 )(!J! M )
D ill
05
T
_:______. . :. . _-,- ____
m /s
2
0 .6
J.lm V c
... (22)
where, p=0.403(¢)
I
3
-0.5
... (24)
From the above equation effective diffusivity of the
complex is found tO be 0.7832 X 10- IO m 2/s.
Distribution coefficient
Values of the distribution coefficient are calculated
from the experimental data at pH 3.5. The logarithm
of the distribution coefficient is correlated with the
logarithm of the aqueous phase equilibrium solute
concentration by the linear regression method.
The equation obtained is,
co= 56.23 c ~ l.ll
... (25 )
where C 0 = di stribution coefficient of the solute
(Nickel) between membrane and external phase, C5 =
equilibrium solute concentration in the aqueous ph ase,
mg/L.
The logarithmic values of the distribution
coefficient are plotted aga inst logarithmic values of
the equilibrium aqueous phase concentration, C5 , as
shown in Fig. 4. It can be observed from the figure
that at low concentration in the aqueous phase (< 5
mg/L), the curves slightly deviate from linearity.
Howeve r, under the present experimental conditions
the concentration range in the aqueous phase is
always much hi gher than this limit value and the
315
Articles
distribution coefficients of Ni(ll) ions throughout the
extraction run can be considered to fo llow Eq. (25).
The variables for the numerical calcul ations are
initial solute [Nickel(II)] concentration in feed phase,
internal reagent concentration, treat ratio and volume
fraction of internal phase. The experimental data
obtai ned for different values of the above variables
are compared with the simulated curves as shown in
Figs 5 to I 0. The operating conditions of the
extraction runs and the calculated values of the
different dimensionless variables are shown in
Table 2. The parameters, De. R0 and C 0 used in the
simulation are calculated as mentioned above.
Indian J. Chern. Techno!., May 2003
0.9 2
0
0.8
i=
u 0.7
~
!<w 0.6
;/!. 0.5
0.4
0.3
0
2
6
4
pH
Fig. }--Extraction profile of nickel (II) from a pure salt solution
Effect offeed phase Nickel (II) concentration
It is found from Fig.5 that the fraction of sol ute
[Nickel (II)] extracted is higher with a lower initial
external phase solute concentration. This is due to a
hi gher distribution coefficient for a lower initial
external phase solutes concentration. However, it has
been found that the time taken by the complex to
reach the center of the emulsion globule remains
almost unaffected and is only marginally higher with
a lower initial external phase solute concentration.
Effect of internal reagent concentration
From Fig. 6, it is ev ident that a variation in the
concentrations of stripping phase acid (0.5-1.0 N)
does not effect the removal of Nickel(II) at the
beginning of the process. However, towards the end
of the process, extraction is more effective when a
more concentrated stripping acid is used. This is
because at the beginning of the process, extraction
into the membrane phase is independent of the
composition of the stripping phase and is mainly
controlled by the continuous phase resistance. But at
the later stage owing to high H+ concentration in the
stri pping phase, reaction rate in stripping phase is
more than the reaction in membrane phase and the
capacity of the internal phase as a sink for metal io n
increases and, therefore, the solute penetrates at a
faster rate inside the emulsion globu les. This
increases the diffusional distance necessary for the
complex to reach the reaction front inside the
emulsion globule. It thus increases the mass transfer
resistance, thereby decreasing the extraction rate. The
reaction front movement is shown in Fig. 7.
Fig. 4-Distribution coefficients as a function of equilibrium
aqueous phase solute concentration
.c;;
c.i
z
1.2
•
•
0
u
w
en
Ellj>Oriment.ai.Ceo-100 fnlj/1
Ellj>Oriment.ai.Ceo-150 fnlj/1
-Thecrobcai.Ceo=100fnlj/1
<
::1:
-Theoreticai.Ceo=150fnlj/1
a..
..J
z<
w
Ill:
0.8
~
en
en
~
z
Q
en
z
w
::E
i5
• • • •
0.6
• • • •
0.-4
0
0 .05
0.1
0 .15
0 .2
DIMENSIONLESS TIME, "t
1:.1fect of treat ratio
The treat ratio is defined as ratio of emul sion phase
vol ume (Ve) to aqueous feed phase vol ume (V) . The
3 16
Fig . .5--Yariation of external phase nicke l ion concentration with
initia l external phase nickel concentration
Articles
Chakraborty et a!. : Nickel(Il) ex tracti on by emulsion liquid membrane
Table 2-0perating co nditions and parameters for the extraction runs
(Ro=0.05 em, D, = 0.7832 x 10' 10 m2/s, C0 =56.23 C ~ 111 )
Sample
Figure
C,, (mg /L)
E
q>
Ci (N)
2
3
4
5
6&7
8
9& 10
100,150
100
100
100
0.33
0.33
0.33, 0.25
0.33
0.5
0.5
0.5
0.5, 0.3
1.0
1.0, 0.5
1.0
1.0
.c
1.2
•
. , _ _,Ci• Ul(N)
E>cperirnerUI,Ci=0.5(N)
-Theoreticoi,CF1 .0 (N)
-Theoreticol,CP0.5(N)
u
z
0.9
A
0
u
w
)(
c(
:::l
J:
c..
z
w
..
0.8
0:
t<w
(/)
(/)
..
0
0.7
!z0
0.8
~
..
0.6
"...z
0 .5
;::
u
0 .4
"
0 .3
:i
• • • •
z
0
:::E
Ci=O .SN
0
~
iii
zw
-
..;
(/)
...J
c(
- Ci=1 .0N
0 .8
0 .4
0.2
0
0.05
0.1
0 .15
0.2
0.1
i5
DIMENSIONLESS TIME, 't
0 .000
0.018
Fig. 6-Variation of ex ternal phase nickel concentration with
internal reagent concentration
treat ratio is varied by changing the amount of
emulsion added to the feed phase and keeping the
volume of the later constant. Fig. 8 exhibits the time
profile of the feed phase concentration of Nickel(II) at
different treat ratios. The treat ratio is varied from
1:12 (£ = 0.25) to 1:9 (£ = 0.33). With increase in
treat ratio (E) the volumes of both the carrier and the
stripping agent increases. Therefore, the surface areas
for mass transfer owing to the formation of a larger
number of emulsion globules increases. Hence, a
hi gher degree of extraction is obtained. However, it
has been fo und that the reaction front movement is
not affected. This is because in each emu lsion
globule, the quantity of solute reacti ng with the carrier
at the globule surface and the amount of internal
reagent remains unaltered with a change in the value
of E.
Effect of volume fraction of internal phase
With a decrease in the volume fractio n of the
internal phase ( ¢ ), the amount of internal reagent
with the globule decreases, resulting in the
consumption of most of the reagents in the early
stage. This causes a faster advancement of the
reaction front towards the centre of the globu les
0.036
0.054
0 .090
0.072
0.108
OIM::NSIONLESS TIME, 't
Fig. ?-Variation of reacti on front progress with internal reagent
concentration
.c
0
1.2
z
..•
0
u
w
-
(/)
c(
J:
~. E=O. :D
E - -.E=0.2S
Th<creticai,Eo<l.:D
Th<creticai,E-D.25
c..
...J
c(
z
Ill:
w
t<w
0.8
.. .. .. ..
(/)
(/)
~
z
0
0 .6
iii
• • • •
zw
:::E
i5
0.4
0
0.05
0.1
0.15
0.2
DIMENSIONLESS TIME, T
Fig. 8---Yariati on of ex ternal phase ni ckel co ncen trati on with
volume ratio of em ul sion to ex ternal phase
(Fig. 9). The higher penetration leads to a lower
extraction rate because of the longer diffusion path
needed by the solute to reach the reaction front as
shown in Fig. 10.
317
Articles
Indian J. Chem . Techno!., May 2003
0 .9
0 .8
-
Theoretical, '=0.5
0 .7
-
Theoretical. f=O.J
.;
.
::0
i5
0 .6
0:
1-
z
0
0 .5
0:
u.
z
0
;::
.
u
w
0:
0.4
0 .3
0 .2
0 .1
0.018
0 .000
0.036
0.054
0.072
0 .090
0 .108
DIMENSIONLESS TIME, T
Fig. 9--Yariation of reaction front progress with volume fraction
of internal aqueous phase
..u
z
0
u
w
.,
------
"I
•...
-
<
using emulsion liquid membranes based on the
15
ad vancing front model developed by Ho et al. ,
neglects external phase mass transfer and the effect of
membrane breakage, and has no adjustable parameter.
The effects of variab les, such as initial solute
concentration in the external phase, internal reagent
concentration, treat ratio, vo lume fraction of interna l
phase on external phase solute concentration as well
as o n the reaction fro nt movement are studied. The
so lute distributio n coefficient is fo und to be
infl uenced by the ex ternal phase so lute concentration,
and a semiempirical correlation between the
distribution coefficient and the equi librium external
phase Nickel(Il) concentratio n has been developed for
use in the simul ation of mode l equations. The
theoretical resu lts obtained by numerical solution of
the model eq uations are found to be in good
agreement with the experimental data. Coexisting ions
(I ndustria l wastewater) copper(II), chro mium(III) and
iron(II) hardly affect the separation.
Nomenclature
Elq)erimental . t~.5
Experimental, t -<>.3
Theoretical, +=0.5
Theoretical, t=0.3
c
:r
0..
..J
<
z
a:
w
t)(
.,.,w
w
~
0 .8
~
...
...
• • • •
0
0
...
0 .6
..J
z
iii
z
w
...
•
0.4
0
0.05
0.1
0.15
0.2
DIMENSIONLESS TIME, T
Fig. LG-Yariation of external ph ~se nickel concentration with
volume fraction of internal aqueous phase
Comparison between experimental and computed
results
Tab le 3 shows the absolute deviatio n between
experimental and theoretical values of the external
phase solute concentration for each experi mental run .
The average absolute deviation s were found to be
between 0.024 and 0.048 for an initial dimension less
solute concentration (h) of 1.0. This shows that the
simulated curves are in good agreement with the
experimental data.
Conclusion
An unsteady- state mathematica l model is proposed
for the separation and concentration of Nicke l(! I) ions
3 18
r
R
Rr
T
v
metal ion (nickel) concentration in saturated
zone of emulsion globule, mol/L
initial internal reagen t concentration in internal
phase, moi!L
internal reagent concentration in internal phase,
mol/L
metal ions concentration in external phase,
moi/L
initial metal ion concentration in external phase,
moi/L
effective diffusivity of metal ions in saturated
zone of emu lsion globules, m2/s
distribution coefficients of the solutes (nickel)
between membrane and externa l phase
equi librium solutes concentrations in the
aqueous phase, mg/L
radial coord inate in emulsion globules, m
radius of emu lsion globules, m
reactio n fro nt position, m
time, min
total volume of emulsion phase, L
volume of external phase , L
avg. molecular wt. of the membrane phase
Articles
Chakraborty eta/.: Nickel(II) extraction by emulsion liquid membrane
Table 3---Absolute deviation between experimental and computed values of ex tern al phase solute concentration
Run
0.048
Maximum
absolute deviation
0.088
0.040
0.015
0.010
0.017
0.045
0.060
0.052
0.060
0.037
0.060
0.018
0.036
0.054
0.072
0.090
0.108
0.126
0.144
0.090
0.037
0.035
0.047
0.070
0.070
0.070
0.058
0.044
0.090
0.018
0.036
0.054
0.072
0.090
0.108
0.1 26
0.144
0.010
0.025
0.045
0.020
0.010
0.030
0.022
0.030
0.024
0.045
0.018
0.036
0.054
0.072
0.090
0.108
0.126
0.144
0.010
0.035
0.015
0.010
0.010
0.030
0.040
0.050
0.025
0.050
C"' =IOO mg/L
£= 0. 33
<p = 0.5
C; =I .O(N)
0.018
0.036
0.054
0.072
0.090
0.108
0.126
0.144
Absolute
dev iation
0.088
0.069
0.037
0.028
0.037
0.032
0.046
0.050
2
C,., = 150mg/L
£= 0. 33
<p = 0.5
C; =I.O(N)
0.018
0.036
0.054
0.072
0.090
0.108
0.126
0.144
3
C,., =100 mg/L
T
£= 0. 25
<p = 0.5
C; =l .O(N)
4
C,., =100 mg!L
£= 0. 33
<p = 0.5
C; =0.5(N)
5
C,, =100 mg!L
£= 0. 33
<p = 0.3
C;=I .O(N)
c
Ill = - '
C,o
Greek Letters
r
T} =-
R
x=f\
R
Average
absolute deviation
'II= solvent association factor
Jl rn= viscosity of the membrane phase
Vc= molar volume of the complex
¢
=volume fracti on of internal aq ueous phase in the emulsion
References
I Reis M T A & Carvalho J M R, J Membr Sci, 84 (1993) 20 1.
2 Teramato M T, Sakai M, Ohsuga K & Miyake Y, Sep Sci
Techno/, 18 ( 1983) 735.
3 Yang X J & Fane A G, J Membr Sci, 156 ( 1999) 25 1.
4 Sa fa vi A & Shams E, J Membr Sci, 144 ( 1998) 37.
5 Lee S C, AhnBS&Lee WK , JMembrSci, 11 4(1996) 171.
319
Articles
Bhowal A & Dutta S, J Membr Sci, 188 (200 I) I.
Fudu M, Xinpei L & Yuanqi Z, Desalination, 56 ( 1985) 355.
Bhowal A & Dutta S, J Membr Sci, 139 (1998) 103.
Takeshimal S, Wada S & Sakurai H, Sep Sci Techno!, 29
(1994) 2117.
10 Juangl R S, LeeS H & Huang R H P, Sep Sci Teclm ol, 33
(1998) 2379 .
l l Chan C C & Lee C J, Chem Eng Sci, 42 ( 1987) 83.
!2 Chan J H & Lee W K, Chem Eng Sci, 48 (1993) 2357.
13 Sahoo G C & Dutta N N, J Membr Sci, 145 (1998) 15.
14 Ghosh A C, Bo rthakur S, Roy M K & Dutta N N, Sep
Teclm ol, 5 ( 1995) l 2 1.
15 HoW S, Hatton T A, Lightfoot EN & LiNN, AICHE J, 28
( 1982) 662.
16 Stroeve P & Varanasi P P, AICHE J, 30 (1984) 1007.
17 Fales J L & Stroeve P, J Membr Sci, 21 ( 1984) 35.
l 8 Kim K, Cho i S & lhm S, lnd Eng Chem Fundem, 22 ( 1983)
167.
19 Teramoto M, Takihana H, Shibutani M , Yuasa T & HaraN ,
Sep Sci Techno/, 18 (1983) 397 .
6
7
8
9
320
Indian J. Chern. Techno!., May 2003
20
21
22
23
24
25
26
27
28
29
30
Bunge A L & NobleR D, J Membr Sci, 2 1 ( 1984) 55.
Braid R S, Bunge A L & Noble R D, AICH E J, 33 (1987) 43 .
Kulkarni P S, Tiwari K K & Mahajani V V, Indian J Chem
Techno/, 6 (1999) 329.
Katsu shi Y, Takashiko K, Hiroshi K & Masahiro G, Sep Sci
Techno!, 33 ( 1998) 369.
Serga V E, Kulikova L D, Purin B A, Sep Sci Techno/, 35
(2000) 299.
Kulkarni P S, Tiwari K K & Mahajani V V, Sep Sci Teclmol,
36 (2001) 639.
Basset J, Danney R C, Jaffery G H & Mendham J, Vogel 's
Text Book of Quantitative Inorganic Analysis (Longman,
London), 1978, XVIII-26.
Ohtake T, Hano T, Takagi K & Nakashio F, J Chem Eng
Japan , 20 ( 1987) 443 .
Wilke C R & Chang P, AICHE J, l (1955) 264.
Reid R C, Prausnitz J M & Sherwood T K, The Properties of
Gases and Liquids (McGrawHill Pub! , New York ), 1988.
Jefferson T B, Witze l! 0 W & Sibbitt W L, lnd Eng Chem,
50 (1958) 1589.
© Copyright 2026 Paperzz