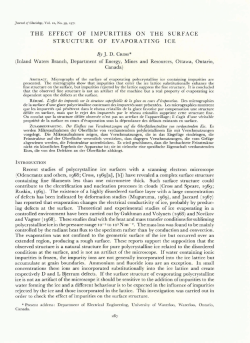
J ournal 01 Glaciology, Vol. 18, No. 79, 1977
SOUTHWARD DISPL ACEMENT OF THE DISTRIBUTIO
OF
GLACIATION DURING THE THREE MAXIMA OF THE
LAST ICE AGE
By NILs-AxEL MORNER
(G eologiska Institutionen, Universitet Stockholms, Box 6801 , 113 86 Stockholm , Sweden)
ABSTRACT. The Laurentid e and }'ennosca ndian ice sh eets had three major g laciation m axim a during the
Last Ice Age. A ll data from the southe rn margins of th e ice sheets indicate th a t these maxim a, as well as minor
flu ctuations, w e re syn chronous. The sam e sy nchrone ity is su pposed to a ppl y a lso for correl a ti ons b etween
fluctua tions o n the north and south m a rgins, which r evea l a continuously southwa rd displacem ent of the
distribution o f g lacia tion during the L ast Ice Age. This southwa rd displacemen t expl a ins th e saw-tooth
pa ttern o f .80 records from d eep-sea co res in whi ch the first glaciation maximum is und er-re presented due
to its distribution m ore towa rds th e n o rth. The synchron eity is consistent with a global clim a ti c co ntrol of the
stadi a l/interstad ial ch a nges and w ith th e record ed globa l e usta ti c changes. Th e southward displa cement of
glacia tion see m s to be a general ru le a lso a pplica ble to ea rlier Pleistoce ne g lacia ti ons.
R ESUM E. D eplacemenl veH le sud de la dislribulion de la glaciation pendanlles trois maxima du D emier Age Glaciaire.
Au cours du D e rni e r Age Glaciaire, les ca lottes gl acia ires d e Laurentide e t Fennosca ndia n ont e u tro is prin cipaux maxim a. Toutes les observa tion s fa ites a ux franges m eridiona les d e ces ca lottes indiqu e nt que ces
maxima, ai nsi que leurs petites flu c tu ations, on t e te syn chrones. On suppo e que ceUe simulta neite est
egalement vala bl e pour des correla ti ons entre les flu c tua ti ons sur les frang es n ord et sud, qui re vel e nt un
deplacement continu vers le sud d e la distri bution d e la g lacia tion a u COUl'S du D ernier Age Glac iaire. Ce
d eplaceme nt vers le sud explique I'a llure en dents d e scie d es enregistrements d e la teneur en .80 provena nt
de ca roUes profondes dans lesquell es le premier maximum d e la glaciation es t sous-represente e n r a ison d e sa
distributio n plus septentriona le. L a simulta neile es t une h ypothese cohe re nte avec un con tra le globa l pa r le
climat, d es cha ngements stade gla c ia ire/stade intergl acia ire, et avec les ch angemen ts eustatiques g lo ba ux
qu'on a enregistre. L e deplacem e nt vcr le sud d e la g lac ia tion sembl e e tre un e regi e gene r a le egalement
applica ble aux g laciations preced e ntes du Pleistoce ne.
Z USA MM ENFASSUNG. Siidverlagenmg der Vereisllng wiihrend der drei Maxima der lelzlen Eiszeit. Wahrend der
letz ten Eiszeit ha tte n d er La urentidi sch e und der Fenn oska ndische Eisschild dre i g rossere Vereisungsmax ima.
Alle Daten uber die Sudrander di eser E isschildc zcige n, dass diese Maxima , e benso wie kl ein e r e Schw a nkungen, synchron waren. Di esselbe G leichzeiligke it hiss t sich fur die W echselbeziehunge n z wi schen
Schwankungen a n d en Nord - und Sudrandern a nn ehm e n. woraus eine ko ntinuierli che Sud ve rl agerung
d er Vereisung wahrend d er letzte n E isze il hervorgeht. Di ese Sudverlagerung erkl a rt das Sligezahn-Muster
von .80-Aufzeichnungen a us Tiefsee-Bo hrkern en, in d enen das Maximum d e r erSlen Vereisung infolge von
d eren nordli che re r Lage schwache r zu m Ausdruck kommt. Die Gleichzeitigkeit iSI im Einkl ang mit einem
weltweiten Ablauf der stadia len und inlerstadia len Klim aschwa nkungen und mil den fes tges te llte n eusta lischen Schwankungen. Die Stid verl agerung der Vcreisung scheint sich a ls a llgem eingtdtig a uch a uf fruhere
pleistozline Vereisungen anwenden z u lasscn.
INTROD UCTION
In a recent paper (Mbrner, 19 74), I put forwal-d the theory that the European and North
American ice sheets of the Last I ce Age were continuously displaced southward during the
three main glaciation maxima and that this may explain the shape of 180 curves obtained
from deep-sea cores (e. g. Emiliani , 1966).
Broecker and van Donk (1970) suggested that th e saw-tooth pattern of the .80 curves
refl ect "gradual glacial buildups". However, a ll glacial records cl early indica te that this is
not the case but that the Last I ce Age is characterized by three major glaciation maxima of
roughly the same size (Mbrner, 1971 , 1972[a] , Cb]) though- as suggested by the author in
the above-mentioned paper (Mbrner, 1974)- with a continuously southward displacement
of the glacial distribution (the centre and margins) .
DISCUSSION
Numerous studi es (e.g. Gross, 1967 ; Mbrner, 19 70, 1972[b] , 197 3; Dreiman is and Karrow,
1972; Mbrner and Dreimanis, 1973 ; Dreimani s and Raukas, 1975) have docum ented that
not on ly do the major stadialjinterstadial changes, but also the second-order stadialjinterstadial changes during the late Wisconsin- Weich selian , show a remarkabl e corre lation on a
Downloaded from https:/www.cambridge.org/core. IP address: 88.99.165.207, on 16 Jun 2017 at 11:28:07, subject to the Cambridge Core terms of use, available at
https:/www.cambridge.org/core/terms. https://doi.org/10.1017/S0022143000021377
JOURNAL
OF
GLACIOLOGY
regional basis along the margins of the ice sheets as well as on an inte r-regional basis b e tween
the European and North American ice sheets . However, almost all of the data referring to
the Laurentide- Cordilleran and the Fennoscandian ice sheets come from the southern, southeastern and south-western margins of these ice sheets. The records from the northern margins
and the north- south correlations were forgotten. Thanks to the studies by the Institute of
Arctic and Alpine Research in Boulder, Colorado , a fairly detailed stratigraphy and chronology have been established for the Baffin Island region. Because the outermost glaciation
limit during the late Wisconsin was found to have been formed at about 8000 B.P. in Baffin
Island , because the margin of error in the dating for the older periods was large and because
the first glaciation maximum was the largest, the second was the second largest and the third
(at 8 000 B.P. ) was the smalles t, Pheasant and Andrews ( 1972 , 1973 ) and Andrews and others
(1972) arrived at the conclusion that the ice-marginal fluctuations at the northern and southern
margins of the Laurentide ice cap were out of phase.
However, this north- south out-of-phase theory is disbelieved by the present author for the
following reasons:
( I) Both first- and second-order stadial/interstadial changes, as reflected in glacial,
climatic and eustatic fluctuations , show such a remarkable global correlation (Mbrner,
1970, 1971 , 1972[b] , 1973) that they must be closely controlled by global climatic
changes, which also would have affected the Arctic region.
(2) The major eustatic changes during the last 130000 years (Steinen and others, 1973;
Chappeil, 1974) show major regressions and transgressions consistent with synchronous
glacial changes.
(3) The smaller Fennoscandian ice sheet shows synchronous ice-marginal fluctuations all
around the ice cap, but with the centre and margins continuously displaced south westward (Mbrner, 1974, 1976) .
It is therefore suggested that the Laurentide ice sheets underwent synchronous glacial volume
changes, with the centre and margins continuously displaced southward and westward.
This gives the following south- north correlations: Sangamon interglacial = Flitaway
interglacial, Pre-St. Pierre or N icolet stadial (smallest) = Alikdjuak stadial (largest), St.
Pierre interstadial = Quajon interstadial, early Wisconsin or Guildwood stadial = NonasiakNapiat stadial, mid-Wisconsin interstadial complex = Nonasiak/Kreager interval, late
Wisconsin stadial (largest) = Kreager stadial with Cock burn maximum (small est). Besides
the southward displacement, there was a similar westward displacement.
The corresponding south- north correlations of the Fennoscandian ice sheet are as follows
(M6rner, 1974, fig. 2, 1976) : Eemian interglacial = Mikulinskiy interglacial , Pre-Brbrup
stadial (smallest) = first glaciation maximum (largest), Brorup- Pilgrimstad interstadial =
Mologo- Shenska- Karukula interstad ial with a boreal transgression at the Kola Peninsula ,
early Weichselian or Anholt stadial = early Valday or Leningradskiy stadial, mid-Weichselian
interstadial complex (Glumslov interstadial) = Grazhdanskiy Prospekt interstadial with an
Arctic to Arctic-boreal transgression at the Kola Peninsula, late Weichselian or Brandenburg
stadial (largest) = late Valday (smallest).
Figure 1 gives a graph of the glacial volume changes of the Laurentide and Fennoscandian
ice sheets during the Last Ice Age, including the regional north- south correlations and the
inter-regional (trans-Atlantic) correlations. There are three major glaciation maxima (I- Ill ).
These maxima had roughly the same volume, though the distribution was different: migrating
from north to south with time. Prior to 50 000 B.P. the time-scale is so uncertain that no dates
have been applied to the graph in Figure I.
Certainly, many details remain to be determined before a final picture is established of the
glacial volume changes and areal distribution changes of the Laurentide and Fennoscandian
ice sheets during the Last Ice Age. However, Figure 1 is believed to show the fundamental
Downloaded from https:/www.cambridge.org/core. IP address: 88.99.165.207, on 16 Jun 2017 at 11:28:07, subject to the Cambridge Core terms of use, available at
https:/www.cambridge.org/core/terms. https://doi.org/10.1017/S0022143000021377
MAXIMA
OF
THE
LAST ICE
NORTH AMERICA
AGE
NORTHERN EUROPE
HOLO-
CE NE
,c.ooo
'0.000
ill
w
ill
20.000
ill
ill
• 30.000
3
20.000
z
30.000
'"w::;
Q
<0.000
<0.000
:>;
"'
I
~
W
~
;0
50.000
"'z
50.000
0
u
n
IT
II
~
er
«
"'~
w
~
"''!!
~
"«
w
N
Fig.
S
SW
NE
Ice-margin jluctuatiolls at the northern and sOllthem margins of the L al/rentide and FellllosCtlndian ice sheets of the Last
Ice Age. There are three synchronous glaciation maxima (I - Ill ), the distribution of which was continuously displaced
southward. No time-scale is applied to the period prior to 5 0 00 0 B.P. The details ill the curves of the northern margins
are not kll own but illferred from the analogy with the southern margin records. Th e deep-sea .80 records can only be understood if they (besides temperature and glacial volume) also rejlect this latitudinal distribution of glaciation, continuously
displaced southward.
!.
chronological correlations and ex tensional differences between the fluctuations along the
northern and southern margins of the two continental ice shee ts of th e Last Ice Age. The
corresponding geographical distribution of the Fennoscandian ice sheet has b een given in a
separate paper (Morner, 1974, fig. 2).
CONCLUSIONS
(I) The Laurentide and Fennoscandian ice sheets had three major maxima during the
Last Ice Age. These maxima were of roughly the same size (disregarding the theory of
"gradual glacial build-ups" ) . The distribution of these maxima was continuously displaced
southward (south-westward in northern Europe and southward and westward in North
America). This glacial migration explains the saw-tooth pattern of .80 curves from deep-sea
cores.
(2) As th e 180 records of the previous ice ages possess a similar saw-tooth pattern, it is
likely that the southward migration of the glacial distribution is typical for an ice age, i.e. the
accumulation starts in high latitudes and gives rise to an initial glacial phase centred far to the
north, this is displaced southward during the subsequent stadial jinterstadial changes, and
finally reach es so far south that the subsequent warming causes a rapid end to the whole ice
age (the " termination" by Broecker and van Donk (1970)) .
(3) The ice-marginal fluctuations along the southern and northern margins of the
Laurentide and Fennoscandian ice sheets were in phase (though of reversed order ofmagnitude). This is consistent with a global climatic control of th e major stadial jinterstadial
Downloaded from https:/www.cambridge.org/core. IP address: 88.99.165.207, on 16 Jun 2017 at 11:28:07, subject to the Cambridge Core terms of use, available at
https:/www.cambridge.org/core/terms. https://doi.org/10.1017/S0022143000021377
308
JOURNAL
OF
GLACIOLOGY
changes as well as of the minor fluctuations. It is also consistent with the recorded glacial
eustatic changes. (Furthermore, it seems to rule out the criticism by Andrews and others
(1974) for using south -margin data instead of north-margin data to interpret the Greenland
18 0 curve.)
(4) Much work remains to sharpen the details of the ice-marginal fluctuations around the
ice sheets and of the corresponding geographical distribution of the ice sheets. Still, the northsouth synchroneity and the southward migration of the ice sheets seem to be fundamental for
the Last Ice Age, and possibly also for the previous ice ages.
MS. received
20
October 1975
REFERENCES
Andrews, J. T., alld others. 1972. Past and present glaciological responses to climate in easte rn Baflin Island , [by]
J. T. Andrews, R. G. Barry, R. S. Bradley, G. H. Miller and L . D . Williams. Quaternary Research , Vol. 2,
No. 3, p . 30 3- 1 4.
Andrews, J. T., and others. 1974. Comparison of the glacial chronology of eastern Baffin Island, East Greenland ,
and the Camp Century accumulation record , by J. T. Andrews, S. Funder, C. Hjort and J. Imbrie. Geology,
Vol. 2, No. 7, p. 355- 58.
Broecker , W. S., and Donk, J. van. '970. Insolation changes, ice volumes, a nd the 0,8 record in deep-sea cores.
R eviews of Geophysics and Space Physics, Vol. 8 , No. I , p. 169- 98.
Chappell, J. 1974. Geology and coral terraces, Huon Peninsula, New Guinea: a study of Quaternary tectonic
movements and sea-level changes. Geological Society of America. Bulletin , Vol. 85, No. 4 , p. 553- 70.
Dreimanis, A., and K a rrow, P . F . '972. Glacial history of the Great Lakes- St. Lawrence r egion , the classification
of the Wisconsin (an ) stage, and its co rrelatives. Intemational Geological Congress, twenty-fourth session, Canada ,
1972, Sect. 12, p . 5- 15.
Dreimanis, A. , and Raukas , A. '975. Did Middle Wisconsin , Middle \,yeichsel ian , and their equivalents represent
an interglacial or an interstadial complex in the northern hemisph ere? Bulletin of the Royal Society of New
<ea land, No. '3, p. 109- 20.
Emiliani, C. 1966. Paleotemperature a nalysis of the Caribbean cores P6304-8 and P6304-9 and a generalized
te mperature curve for the past 425,000 years. Journal of Geology , Vol. 74, No. 2, p . 109- 24.
Gross, H. 1967. Eine ganz ungewiihnlich vollstandige Fernkonnektierung letzeiszeitlicher Schichtenfolgen von
Nordamerika nach Europa. Quartar, Vol. 18, p. 157- 61.
Miirner, N.-A. 1~170. Comparison between Late Weichselian and Late Wisconsin ice marginal changes.
Eiszeitalter und Gegenwart , Bd. 2 I , p. '73- 76.
Miirner, N.-A. '97'. The position of the ocean level during the interstadial at about 30,000 B.P. : a discussion
from a climatic-glaciologic point of view. Canadian Joumal of Earth Sciences, Vol. 8, No. I , p. '32-43.
M iirner, N .-A. 1972[a]. The cold /warm changes during the last Ice Age: with special reference to the stratigraphy at Diisebacka and Ellesbo in southwest Sweden. Stockholm Contributions in Geology, Vol. 24, No. 4 ,
p. 5 1 - 77.
Miirner, N.-A . 1972[b]. World climate during the last '30,000 years. International Geological Congress, twenty-fourth
session, Canada , 1972, Sect. 12, p. 72- 79.
Miirner, N.-A. '973. Climatic changes during the last 35,000 years as indicated by land, sea and air data.
Boreas, Vol. 2, No. I , p. 33- 53.
Miirner, N.-A. '974. Ocean pal eotemperature and continental glaciations. Colloques Internationaux du Centre
Na tional de la Recherche Scientijique, No. 2 '9, p . 43- 49.
Miirner, N .-A. 1976. G lobal correlations and Weichselian chrono-stratigraphy. (In Quaternary glaciations in the
northern hemisphere. IGCP session in BeLlingham, 1975, R eport 3, p. 327- 38. )
Miirner, N. -A. , and Dreimanis, A. '973. The Erie interstade. Memoirs . Geological Society of America, No. 136,
p . U)7-34·
Pheasant, D. R ., and Andrews, J. T. '972. The Quaternary history of the northern Cumberland Peninsula,
Baffin Island, N.W.T. Part VIII , chronology of Narpaing and Quajon Fiords, during the past 120,000 years.
International Geological Congress , twenty-fourth session, Canada, 1972, Sect. 12, p. 8, - 88.
Pheasant, D. R ., and Andrews, J. T. '973. [The Quaternary history of northern Cumberland Pensinula, Baffin
I sland, N.W.T. Part 7.] \,yisconsin glacial chronology and relative sea-level movemen ts, Narpaing FiordBroughton Island area, eastern Baflin Island, N.W.T. Canadian Journal of Earth Sciences , Vol. 10, No. I I ,
p. 1621 - 41.
Steinen, R. P. , and others. '973. Eustatic low stand of sea level between 125,000 and 105,000 B.P.: evidence from
the subsurface of Barbados, West Indies, by R . P. Steinen, R . S. H a rrison and R. K. Matthews. Geological
Society of America. Bulletin, Vol. 84, No. I , p. 63- 70.
Downloaded from https:/www.cambridge.org/core. IP address: 88.99.165.207, on 16 Jun 2017 at 11:28:07, subject to the Cambridge Core terms of use, available at
https:/www.cambridge.org/core/terms. https://doi.org/10.1017/S0022143000021377
© Copyright 2026 Paperzz