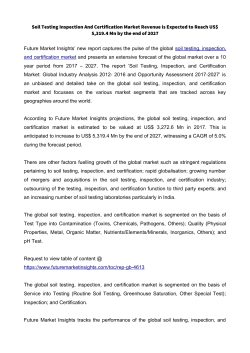
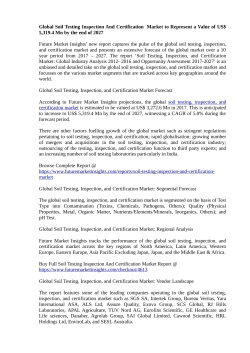
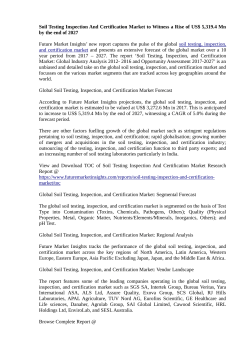
Environmental risk limits for organotin
compounds
RIVM report 607711009/2012
R. van Herwijnen
National Institute for Public Health
and the Environment
P.O. Box 1 | 3720 BA Bilthoven
www.rivm.com
Environmental risk limits for organotin
compounds
RIVM Report 607711009/2012
RIVM Report 607711009
Colophon
© RIVM 2012
Parts of this publication may be reproduced, provided acknowledgement is given
to the 'National Institute for Public Health and the Environment', along with the
title and year of publication.
R. van Herwijnen
Contact:
René van Herwijnen
Expertise Centre for Substances
[email protected]
This investigation has been performed by order and for the account of Ministry
of Infrastructure and the Environment (I&M), Directorate General of the
Environment (DGM), Directorate of Sustainable production (DP), within the
framework of project 607711, soil quality, prevention and risk assessment.
Page 2 of 74
RIVM Report 607711009
Abstract
Environmental risk limits for organotin compounds
RIVM has derived environmental risk limits (ERLs) for three organotin
compounds: dibutyltin, tributyltin and triphenyltin. These are the most widely
used organotin compounds. Dibutyltin has several uses, for example in the
plastic PVC and in printer toner. Tributyltin and triphenyltin are mainly used for
wood conservation and as antifouling. Triphenyltin was also used as plant
protection product for potatoes. The use as antifouling has been banned within
Europe since 2003, and there is no authorisation anymore for the use of
triphenyltin as plant protection product.
Intervention values for soil
The environmental risk limits have been derived because they are needed to
determine intervention values for soil and groundwater. In case an intervention
value is exceeded, the (polluted) soil will be considered for remediation. For this
purpose, ERLs for groundwater and soil are required. ERLs for soil were not
available and have been derived for this report. ERLs for water were already
derived within other frameworks and have been adopted. ERLs for surface water
and sediment are also reported in this report because they are related to soil
and groundwater. In this way a complete overview of the available ERLs for each
compound is given.
The derived environmental risk limits for soil and groundwater
One of the derived ERLs is the Serious Risk Concentration (SRC). At this
concentration, harmful effects for soil organisms are expected. The determined
SRCs for soil are 28; 0.052 and 0.24 milligram per kilogram dry weight soil for
dibutyltin, tributyltin and triphenyltin respectively. For groundwater, the SRCs
are respectively 50; 0.046 and 0.40 microgram per liter.
Direct and indirect effects
The SRC is based on the annual average concentrations in soil, water and
sediment. For this report, two routes of exposure have been examined: direct
exposure of water or soil organisms, and indirect exposure of birds or mammals
consuming water or soil organisms (food chain). Indirect exposure of humans
where it concerns intervention values is evaluated in a separate report (Brand et
al., 2012).
Keywords:
dibutyltin, triphenyltin, tributyltin, groundwater, water, soil, environmental risk
limits
Page 3 of 74
RIVM Report 607711009
Page 4 of 74
RIVM Report 607711009
Rapport in het kort
Milieurisicogrenzen voor organotinverbindingen
Het RIVM heeft in opdracht van het ministerie van Infrastructuur en Milieu
(I&M), milieurisicogrenzen voor drie organotinverbindingen in (grond)water,
sediment en bodem vastgesteld. De drie meest voorkomende verbindingen in
het milieu zijn: dibutyltin, tributyltin en trifenyltin. Dibutyltin wordt in
verscheidene toepassingen gebruikt, bijvoorbeeld in de kunststof pvc en in
printertoners. Tributyltin en trifenyltin zijn voornamelijk gebruikt als middel om
hout te conserveren en om te voorkomen dat er onder water op de romp van
schepen organismen groeien (aangroeiwerend middel). Trifenyltin werd ook
gebruikt als gewasbeschermingsmiddel in de aardappelteelt. Het gebruik als
aangroeiwerend middel is in Europa sinds 2003 niet meer toegestaan en
trifenyltin heeft ook geen authorisatie meer als gewasbescheringsmiddel.
Interventiewaarden bodem
De milieurisicogrenzen zijn afgeleid omdat ze nodig zijn om de zogeheten
interventiewaarden te bepalen. Als een interventiewaarde wordt overschreden,
komt de (vervuilde) bodem in aanmerking voor sanering. Voor dit doel zijn
alleen milieurisicogrenzen voor grondwater en bodem nodig. De
milieurisicogrenzen voor de individuele organotins in bodem waren nog niet
beschikbaar en zijn voor dit onderzoek afgeleid. Milieurisicogrenzen voor water
waren al eerder afgeleid binnen andere kaders en zijn overgenomen. De
milieurisicogrenzen voor oppervlaktewater en sediment zijn ook in het rapport
vermeld, omdat deze aan bodem en grondwater zijn gerelateerd. Dit geeft een
volledig overzicht.
De milieurisicogrenzen voor bodem en grondwater
Een van de afgeleide milieurisicogrenzen is het Ernstig Risiconiveau (ER). Dit is
de concentratie waarbij schadelijke effecten van de stof voor de bodem te
verwachten zijn. De bepaalde ER’s voor bodem zijn 28; 0.052 en 0.24 milligram
per kilogram drooggewicht bodem, voor achtereenvolgens dibutyltin, tributyltin
en trifenyltin. Voor grondwater zijn de ER’s respectievelijk 50; 0,046 en
0,40 microgram per liter.
Directe en indirecte effecten
Het ER is gebaseerd op de jaargemiddelde concentraties in bodem, water en
sediment. Hiervoor zijn in dit rapport twee routes onderzocht: de directe
effecten op waterorganismen en de indirecte effecten op vogels en zoogdieren
via het nuttigen van de waterorganismen (voedselketen). Effecten voor mensen
bij interventiewaarden worden in een separaat rapport geëvalueerd.
Trefwoorden:
dibutyltin, trifenyltin, tributyltin, grondwater, water, bodem, milieurisicogrenzen
Page 5 of 74
RIVM Report 607711009
Page 6 of 74
RIVM Report 607711009
Contents
Summary 9
1
1.1
1.2
1.3
1.3.1
1.3.2
1.3.3
1.3.4
1.4
Introduction 11
Project framework 11
Current MPCs 11
Methodology 11
Data collection 12
Data evaluation 12
Physico-chemical data 13
Species of organotin compounds 13
Status of the results 14
2
2.1
2.2
2.2.1
2.2.2
2.2.3
2.2.4
2.2.5
2.3
2.3.1
2.3.2
2.3.3
2.3.4
2.3.5
2.4
2.5
2.5.1
2.5.2
2.6
2.6.1
2.6.2
2.6.3
2.6.4
Dibutyltin 15
Data sources 15
Substance information 15
Information on production and use 15
Identification 15
Physico-chemical properties 15
Behaviour and distribution in the environment 17
Bioconcentration and biomagnification 17
Risk limits for water 17
Aquatic toxicity data 17
Treatment of fresh- and saltwater toxicity data 18
Derivation of the MPCwater 18
Derivation of the MACwater, eco 18
Derivation of the SRCwater 19
Risk limits for groundwater 19
Risk limits for sediment 19
Derivation of the MPCsediment, eco 19
Derivation of the SRCsediment, eco 20
Risk limits for soil 20
Soil toxicity data 20
Derivation of the MPCsoil 20
Derivation of the SRCsoil 21
Geometric mean of MPC and SRC 21
3
3.1
3.2
3.2.1
3.2.2
3.2.3
3.2.4
3.2.5
3.3
3.3.1
3.3.2
3.3.3
3.3.4
Tributyltin 23
Data sources 23
Substance information 23
Information on production and use 23
Identification 23
Physico-chemical properties 25
Behaviour and distribution in the environment 27
Bioconcentration and biomagnification 27
Risk limits for water 27
Aquatic toxicity data 27
Treatment of fresh- and saltwater toxicity data 28
Derivation of the MPCwater 28
Derivation of the MACwater, eco 29
Page 7 of 74
RIVM Report 607711009
3.3.5
3.4
3.5
3.5.1
3.5.2
3.6
3.6.1
3.6.2
3.6.3
3.6.4
Derivation of the SRCwater 30
Risk limits for groundwater 31
Risk limits for sediment 31
Derivation of the MPCsediment, eco 31
Derivation of the SRCsediment, eco 32
Risk limits for soil 32
Soil toxicity data 32
Derivation of the MPCsoil, 32
Derivation of the SRCsoil 33
Geometric mean of the MPC and SRC 34
4
4.1
4.2
4.2.1
4.2.2
4.2.3
4.2.4
4.2.5
4.3
4.3.1
4.3.2
4.3.3
4.3.4
4.3.5
4.4
4.5
4.5.1
4.5.2
4.5.3
4.6
4.6.1
4.6.2
4.6.3
4.6.4
Triphenyltin 35
Data sources 35
Substance information 35
Information on production and use 35
Identification 35
Physico-chemical properties 36
Behaviour and distribution in the environment 38
Bioconcentration and biomagnification 38
Risk limits for water 38
Aquatic toxicity data 38
Treatment of fresh- and saltwater toxicity data 40
Derivation of the MPCwater 40
Derivation of the MACwater, eco 40
Derivation of the SRCwater 40
Risk limits for groundwater 41
Risk limits for sediment 41
Sediment toxicity data 42
Derivation of the MPCsediment 42
Derivation of the SRCsediment, eco 42
Risk limits for soil 42
Soil toxicity data 42
Derivation of the MPCsoil 43
Derivation of the SRCsoil 43
Geometric mean of MPC and SRC 43
5
Conclusions 45
Literature 47
List of abbreviations 53
Appendix 1. Data on Koc studies 55
Appendix 2. Detailed soil toxicity data for tributyltin 61
Appendix 3. Detailed soil toxicity data for triphenyltin 67
Appendix 4. Detailed toxicity of triphenyltin to birds and mammals 71
Page 8 of 74
RIVM Report 607711009
Summary
In this report, the RIVM presents Environmental Risk Limits (ERLs) for organotin
compounds in surface water, groundwater, sediment and soil. The organotin
compounds involved are dibutyltin, tributyltin and triphenyltin. Dibutyltin
compounds are used in various applications like stabiliser in PVC and charge
regulator in printer toner; tributyltin and triphenyltin are/were mainly used in
biocidal applications like antifouling and wood preservation. The use of tributyltin
and triphenyltin as antifouling is not allowed anymore since 2003. Based on the
data from ERL derivation for other frameworks and additional information
obtained from the open literature, ecotoxicological environmental risk limits for
the three organotins in groundwater and soil have been derived that can be
used to set intervention values for contaminated soils. ERLs for fresh and salt
surface water and sediment are also presented when available to give a
complete overview of the available ERLs. The methods used are in accordance
with the methodology of the WFD (Water Framework Directive) and INS
(International and National environmental quality standards for Substances in
the Netherlands).
For the setting of intervention values, two types of ERL are considered, each
representing a different protection aim:
-
-
The Maximum Permissible Concentration for ecosystems (MPCeco) - the
concentration in an environmental compartment at which no effect to be
rated as negative is to be expected for ecosystems. Separate MPCeco
values are derived for the freshwater and saltwater environment;
Serious Risk Concentration for ecosystems (SRCeco) - the concentration in
(ground)water, sediment or soil at which possibly serious ecotoxicological
effects are to be expected.
The MPCwater is equivalent to the long-term water quality standards that is
indicated as AA-EQS in the WFD-guidance. Where applicable, ERLs are derived
for freshwater and saltwater. An overview of the ERLs is presented in Table 1. It
should be mentioned that these ERLs are only based on direct exposure of water
or soil organisms and indirect exposure of birds or mammals consuming water
or soil organisms (food chain). Indirect exposure of humans has not been
assessed.
Page 9 of 74
RIVM Report 607711009
Table 1. Environmental risk limits for the ecosystem for organotin compounds in
surface water, groundwater, sediment and soil
Compartiment
Surface water
MPCfw (µg/L)
MPCsw (µg/L)
MACfw, eco (µg/L)
MACsw, eco (µg/L)
SRCwater (µg/L)
Groundwater
MPCgw, eco (µg/L)
SRCgw, eco (µg/L)
Sediment a
MPCsediment, eco (µg/kgdwt)
SRCsediment, eco (µg/kgdwt)
Soil b
MPCsoil (mg/kgdwt)
SRCsoil (mg/kgdwt)
geometric mean of MPCsoil
and SRCsoil (mg/kgdwt)
dibutyltin
tributyltin
triphenyltin
0.15
0.15
0.30
0.15
16
0.2 x 10⁻³
0.2 x 10⁻³
1.5 x 10⁻³
0.2 x 10⁻³
26 x 10-3
0.23 x 10⁻³
0.23 x 10⁻³
0.47
0.47
0.10
0.15
50
0.2 x 10⁻³
46 x 10-3
0.23 x 10⁻³
0.40
0.37 x 10³
123 x 103
0.01 c
27
2.2 x 10⁻³
2.2
0.37
28
3.2
2.3 x 10⁻⁶
52 x 10-3
0.35 x 10⁻³
4.0 x 10⁻³
0.24
0.031
n.d. = not derived
a
Sediment values are expressed for Dutch standard sediment with 10% organic matter.
b
Soil values are expressed for Dutch standard soil with 10% organic matter.
c
This value should be considered as a worst case estimate.
Page 10 of 74
RIVM Report 607711009
1
Introduction
1.1
Project framework
In this report, Environmental Risk Limits (ERLs) for surface water (freshwater
and marine), groundwater, sediment and soil ecosystems are derived for three
organotin compounds: dibutyltin, tributyltin and triphenyltin. More details on the
compounds are given in the individual chapters. The aim of this report is to
present ERLs that are relevant for the setting of intervention values for soil
contamination. The intervention values are evaluated in a separate report
(Brand et al., 2012). ERLs for fresh and salt surface water and sediment are also
presented when available to give a complete overview of the available ERLs. In
this report, only ERLs relevant for the ecosystem are considered; the risk for
humans is not considered because this risk is approached differently for the
setting of intervention values for soil. The following ERLs are considered:
-
-
1.2
Maximum Permissible Concentration for ecosystems (MPCeco) - the
concentration in an environmental compartment at which no effect to be
rated as negative is to be expected for ecosystems. Separate MPCeco
values are derived for the freshwater and saltwater environment;
Serious Risk Concentration for ecosystems (SRCeco) - the concentration in
(ground)water, sediment or soil at which possibly serious ecotoxicological
effects are to be expected. The SRCeco is valid for the freshwater and
saltwater compartment.
Current MPCs
Risk limits at the time of publication of this report are given in Table 2. Actual
risk limits can be found at the website ‘Risico’s van stoffen’
(http://www.rivm.nl/rvs/). For the aquatic environment, no new ERLs are
derived, but ERLs derived in other frameworks are adopted. For soil, new ERLs
are derived since no ERLs are available.
Table 2. Risk limits for the three organotin compounds at the time of publication
of this report
DBT
TBT
TPT
Fresh surface water
(µg/L)
(µg/L)
MPC
MAC*
0.09
0.0002
0.0015
0.005
Salt surface water
(µg/L)
(µg/L)
MPC
MAC *
Groundwater
(µg/L)
MPC
0.0002
0.0009
1.0 x 10⁻⁴
5 x 10⁻⁵
0.0015
* MAC = Maximum Acceptable Concentration for short term exposure
1.3
Methodology
The methodology for risk limit derivation is described in detail in the INSguidance document (Van Vlaardingen and Verbruggen, 2007), which is further
referred to as the INS-Guidance. The methodology is based on the Technical
Guidance Document (TGD), issued by the European Commission and developed
in support of the risk assessment of new notified chemical substances, existing
Page 11 of 74
RIVM Report 607711009
substances and biocides (EC, 2003), and on the Manual for the derivation of
Environmental Quality Standards in accordance with the Water Framework
Directive (Lepper, 2005). The European guidance under the framework of WFD
is currently being revised; the final draft has been approved recently (March,
2011) by the Strategic Coordination Group under the European Water Directors.
The terminology is harmonised as much as possible and the new guidance is
followed in the case it deviates from the INS-guidance.
1.3.1
Data collection
For the water compartment, ERLs for all three compounds have recently been
derived within other frameworks (EC, 2005, ICBR, 2009, Van Herwijnen et al.,
2012). These ERLs have been adopted where available. In those cases that an
aquatic ERL was not derived in these reports, the collected dataset was used for
additional derivation. For soil toxicity data and soil/sediment sorption data, an
on-line literature search has been performed using Scopus (www.scopus.com).
The search for soil toxicity data was performed on 8 April 2011. Additionally, a
search for soil/sediment sorption data of dibutyltin and tributyltin was performed
on 19 August 2011. The latter search was performed because sorption data
were necessary for the application of equilibrium partitioning.
1.3.2
Data evaluation
Soil ecotoxicity studies were screened for relevant endpoints (i.e. those
endpoints that have consequences at the population level of the test species)
and thoroughly evaluated with respect to the validity (scientific reliability) of the
study. A detailed description of the evaluation procedure is given in section 2.2.2
and 2.3.2 of the INS-Guidance and in the Annex to the draft EQS-guidance
under the WFD. In short, the following reliability indices (Ri) were assigned,
based on Klimisch et al. (1997):
Ri 1: Reliable without restriction
’Studies or data […] generated according to generally valid and/or internationally
accepted testing guidelines (preferably performed according to GLP), or in which
the test parameters documented are based on a specific (national) testing
guideline […], or in which all parameters described are closely
related/comparable to a guideline method’
Ri 2: Reliable with restrictions
’Studies or data […] (mostly not performed according to GLP), in which the test
parameters documented do not totally comply with the specific testing guideline,
but are sufficient to accept the data or in which investigations are described
which cannot be subsumed under a testing guideline, but which are nevertheless
well documented and scientifically acceptable’
Ri 3: Not reliable
’Studies or data […] in which there are interferences between the measuring
system and the test substance, or in which organisms/test systems were used
which are not relevant in relation to the exposure (e.g. unphysiologic pathways
of application), or which were carried out or generated according to a method
which is not acceptable, the documentation of which is not sufficient for an
assessment and which is not convincing for an expert judgment’
Page 12 of 74
RIVM Report 607711009
Ri 4: Not assignable
’Studies or data […] which do not give sufficient experimental details and which
are only listed in short abstracts or secondary literature (books, reviews, etc.)’
Citations
In case of (self-)citations, the original (or first cited) value is considered for
further assessment, and an asterisk is added to the Ri of the endpoint that is
cited.
All available studies are summarised in data-tables that are included as annexes
to this report. These tables contain information on species characteristics, test
conditions and endpoints. Explanatory notes are included with respect to the
assignment of the reliability indices.
In the aggregated data tables only one effect value per species is presented.
When for a species several effect data are available, the geometric mean of
multiple values for the same endpoint is calculated where possible.
Subsequently, when several endpoints are available for one species, the lowest
of these endpoints (per species) is reported in the aggregated data table.
1.3.3
Physico-chemical data
The aquatic ERLs for dibutyltin and tributyltin are adopted from other reports
and some additional data have also been adopted. The physico-chemical data in
these reports are however limited. Therefore, for the physico-chemical data of
these substances, the original sources have been checked where possible and
supplemented with sources as indicated in the INS-guidance.
1.3.4
Species of organotin compounds
All three organotin compounds are available in different species that could have
a different toxicity. Therefore, endpoints for toxicity are not pooled for the
different species and the endpoint for the most toxic species is selected where
available.
1.3.5
Correction for the use of laboratory feed in bird and mammal test
In the assessment factors that are applied to use toxicity data for birds and
mammals for the assessment of secondary poisoning, a factor of three is
involved. This correction factor is applied to correct for the difference in calorific
value of the feed used in the laboratory trials in comparison to the feed
consumed by wild animals in the field. This value is based on the consumption of
fish for the assessment in aquatic ecosystems. This value is however also used
for the assessment in soil ecosystems and is currently under discussion for this
approach since the calorific value of earthworms is lower than that for fish.
Based on this, the exposure through secondary poisoning in soil ecosystems
might be underestimated using the factor of three. The factor of three is used
for as long as no alternative value is decided upon but the assessments for
secondary poisoning in soil ecosystems should be re-evaluated when a new
value becomes available.
Page 13 of 74
RIVM Report 607711009
1.4
Status of the results
The results presented in this report have been discussed by the members of the
scientific advisory group for the INS-project (WK-INS). It should be noted that
the ERLs in this report are scientifically derived values, based on
(eco)toxicological, fate and physico-chemical data. They serve as advisory
values for the Dutch Steering Committee for Substances, which is appointed to
set the Environmental Quality Standards (EQSs). ERLs should thus be
considered as advisory values that do not have an official status.
Page 14 of 74
RIVM Report 607711009
2
Dibutyltin
2.1
Data sources
For dibutyltindichloride, aquatic ERLs have been derived by the ‘Internationale
Commissie ter Bescherming van de Rijn – ICBR’ (International Commission for
the Protection of the Rhine) according to the requirements of the Water
Framework Directive. These ERLs are adopted in Dutch legislation and therefore
these ERLs are also adopted in this report. The derivation of these ERLs has
been reported in the report ‘Afleiding van milieukwaliteitsnormen voor
Rijnrelevante stoffen’ (ICBR, 2009). In ICBR (2009), the ecotoxicological ERLs
are expressed for dibutyltindichloride. In this report, the ERLs are expressed as
the DBT-cation.
2.2
Substance information
2.2.1
Information on production and use
Dibutyltin compounds are being used as stabilisers in PVC, as catalysers for
polymers and as coating for glass. Other uses are as regulator for the charge in
printer toner or as stabiliser of press ink.
2.2.2
Identification
Information on the identification of dibutyltindichloride is presented in Table 3.
Table 3. Identification of dibutyltindichloride
Chemical name
Synonyms
CAS-number
EC-number
Structural formula
Dibutyltindichloride
DBT, dibutyltin
683-18-1
211-670-0
Cl
H3C
Sn
CH3
Cl
Molecular formula
SMILES code
2.2.3
C8H18Cl2Sn
CCCCSn(Cl)(Cl)CCCC
Physico-chemical properties
Physico-chemical properties of dibutyltindichloride are presented in Table 4.
Since the ERLs for DBT in soil and sediment are calculated via equilibrium
partitioning, a literature search was performed on sorption parameters of DBT in
soils and sediments. Since only two studies with soils were available, also results
from studies with sediments were used. The available studies are validated and
the reliable endpoints are used to determine the average log Koc. Brief details of
the studies are given in Appendix 1. The Koc in ICBR (2009) originates from a
citation in the citation based on only two references. Only one of these
references could be retrieved and is included in the studies assessed in
Appendix 1. Figure 1 shows the correlation between the sorption constant Kd and
the fraction organic carbon for the reliable endpoints given in Appendix 1. From
this figure, it can be seen that the sorption of a soil is influenced by the faction
of organic carbon. Therefore, the derived ERLs for soil and sediment are
Page 15 of 74
RIVM Report 607711009
normalised standard Dutch soil with 10% organic matter and application of
equilibrium partitioning, based on the Koc, is considered acceptable.
30000
25000
y = 239827x
Kd
20000
2
R = 0.4012
15000
10000
5000
0
0
0.01
0.02
0.03
0.04
0.05
0.06
0.07
fraction OC
Figure 1. Correlation between sorption constant Kd and the fraction organic
carbon
Table 4. Physico-chemical properties of dibutyltindichloride
Bold values are used for ERL derivation.
Parameter
Molecular weight
Water solubility
Unit
[g/mol]
[mg/L]
Value
303.85
320
92
47.5
pKa
Log KOW
[-]
[-]
Log KOC
[-]
n.a.
1.5
1.56 a
1.56
0.97
4.62 b
Vapour pressure
[Pa]
5.07
0.16
Remark
Ref.
20°C, pH 2.5, exp.
according to OECD 105
exp. 20°C
EU-ECB (2000b)
MlogP
ClogP
average of 12 log Koc
values
US-EPA (2009)
EU-ECB (2000b)
ICBR (2009)
Biobyte (2006)
Biobyte (2006)
EU-ECB (2000b)
see Appendix 1
ICBR (2009)
ICBR (2009); EU-ECB
(2000b)
US-EPA (2009)
US-EPA (2009)
ICBR (2009)
values of 1.89 and 5.33 are
exp. 25°C
Melting point
[°C]
42
exp.
Boiling point
[°C]
135
exp.
Henry’s law constant
[Pa.m3/mol]
1-1.38
25°C
a
It should be noted that in ICBR (2009) calculated log Kow
reported for DBT-dichloride and DBT-oxide respectively.
b
Considering the poor correlation between Kd and fraction organic carbon, the log Koc is
based on the average log Koc values, rather than the slope of the fitted line.
Page 16 of 74
RIVM Report 607711009
2.2.4
Behaviour and distribution in the environment
Selected environmental properties of dibutyltin are presented in Table 5.
Table 5. Selected environmental properties of dibutyltin
Parameter
Hydrolysis half-life
Degradation
Photolysis half-life
Biodegradability
Relevant metabolites
2.2.5
Unit
Value Remark
DT50 [d]
DT50 [d]
122
in soil
DT50 [d]
0.6
inherently biodegradable
none
Ref.
ICBR (2009)
RPA (2005)
RPA (2005)
RPA (2005)
ICBR (2009)
Bioconcentration and biomagnification
In ICBR (2009) bioconcentration factors of 12-135 L/kg have been reported.
Considering the maximum BCF of 135 L/kg, the risk of secondary poisoning is
assessed for dibutyltin.
2.3
Risk limits for water
In ICBR (2009), aquatic risk limits have been derived for dibutyltindichloride.
These risk limits are taken over in this report where available, except for human
fish consumption.
2.3.1
Aquatic toxicity data
The selected fresh- and marine aquatic toxicity data for freshwater and marine
species, reported in ICBR (2009), are given in Table 6 and Table 7. All these
studies were evaluated for ICBR (2009) unless stated otherwise; it is however
not indicated which were considered valid. Therefore, it is presumed that this
involves only the studies adopted in the selected data tables.
Table 6. Dibutyltin: selected freshwater toxicity data for ERL derivation
expressed for dibutyltindichloride
Chronic
Taxonomic group
Algae
Scenedesmus obliquus
NOEC/EC10
(µg/L)
2.4
Pisces
Oncorhychus mykiss
48.6
Poecilia reticulata
1800
a
Geometric mean of 80 and 100 µg/L
b
Geometric mean of 900 and 317 µg/L
c
Acute
Taxonomic group
Algae
Ankistrodesmus falcatus acicularis
Scenedesmus obliquus
Crustacea
Daphnia magna
Pisces
Leuciscus idus
Oryzias latipes
L(E)C50
(µg/L)
17400
89.4 a
534 b
600
2933 c
Geometric mean of 5800, 1023, 3249, 981 and 11476 µg/L
Table 7. Dibutyltin: selected toxicity data for marine species for ERL derivation
expressed for dibutyltindichloride
Chronic
Taxonomic group
Crustacea
Rhithropanopeus harrisii
Mollusca
Mytilus edulis
NOEC/EC10
(µg/L)
85 a
2
Acute
Taxonomic group
Bacteria
Vibrio fischeri
Vibrio harveyi
Algae
Skeletonema costatum
Thalassiosira pseudonana
L(E)C50
(µg/L)
199 b
422 c
40
181
Page 17 of 74
RIVM Report 607711009
Chronic
NOEC/EC10
Acute
L(E)C50
Taxonomic group
(µg/L)
Taxonomic group
(µg/L)
Pisces
Rotifera
Cyprinodon variegatus d
453
Brachionus plicatilis
625
a
Geometric mean of 72.1 and 101 µg/L
b
Geometric mean of 182 and 217 µg/L
c
Geometric mean of 380, 440 and 450 µg/L
d
In ICBR (2009) the endpoint for this species was tabulated under freshwater; the
experiment is however performed in diluted seawater with a salinity of 15‰. Since the
fresh- and saltwater datasets are combined (see below), this does not affect the results.
2.3.2
Treatment of fresh- and saltwater toxicity data
In ICBR (2009), it is statistically shown that there is no significant difference
between fresh- and saltwater data (p = 0.14 and p = 0.46 for acute and chronic,
respectively). Therefore, the two datasets were combined.
2.3.3
Derivation of the MPCwater
2.3.3.1
Derivation of the MPCwater, eco
In ICBR (2009), a PNEC for fresh surface water of 0.2 µg/L expressed for
dibutyltindichloride has been derived on the basis of the NOEC of 2 µg/L for
mollusc with an assessment factor of 10 because chronic data are available for
an algae, a crustacean and fish. This value expressed for the dibutyltin cation as
0.15 µg/L is taken over as the MPCfw, eco. For the marine environment, the same
MPC of 0.2 µg/L expressed for dibutyltindichloride has been derived, using an
assessment factor of 10 because toxicity data were available for two specific
marine taxonomic groups. This value expressed as 0.15 µg/L for the dibutyltin
cation is taken over as the MPCsw, eco.
2.3.3.2
Derivation of the MPCwater, secpois
In ICBR (2009), a quality standard for animals eating aquatic organisms has
been calculated of 0.22 µg/L for the dibutyltin cation. The calculated MPC is
based on a NOEC of 30 mg/kgfood for growth reduction (FH-IME, 2007) from a
90 days oral study with rats. An assessment factor of 90 (resulting in an
MPCoral, min of 0.3 mg/kgfd), a BCF of 135 L/kg and an additional assessment
factor of 10 has been applied. The reason for the additional assessment factor is
unknown. Since this value is higher than the MPCs for fresh and salt surface
water based on direct ecotoxicity, these MPCs can be considered to be protective
for secondary poisoning.
2.3.3.3
Selection of the MPCwater
The MPCwater, secpois is higher than the MPCs for fresh and salt surface water,
based on direct ecotoxicity; these MPCs can be considered to be protective for
secondary poisoning. The MPCfw and MPCsw are 0.15 µg/L.
2.3.4
Derivation of the MACwater, eco
In ICBR (2009), a PNEC for short-term exposure has been derived by dividing
the lowest acute toxicity value of 40 µg/L for an algae, by a factor of 1000. This
factor has been used according to Lepper (2005) because dibutyltin has a BCF
>100 L/kg and therefore a potential to bioaccumulate, and an additional
assessment factor of 10 was applied over the standard assessment factor of
100. The derived value of 0.04 µg/L expressed for dibutyltindichloride was not
put forward as final value because it was lower than the PNEC for fresh surface
water. Currently, in accordance with the coming new guidance for derivation of
Page 18 of 74
RIVM Report 607711009
quality standards under the Water Framework Directive, the additional
assessment factor of 10 for bioaccumulating substances is not applied anymore
because bioaccumulation is not considered relevant for short-term exposure
toxicity. Therefore the MACfw, eco is set in line with the current methodology
expressed for the dibutyltin cation at 0.3 µg/L.
For the saltwater environment, also no MAC has been proposed because it was
lower than the PNEC. Since the datasets for fresh- and saltwater are combined,
the MACsw, eco is based on the combined dataset with an additional assessment
factor of 10 because no acute endpoints are available for specific marine
species. The MACsw, eco is 0.03 µg/L for the dibutyltin cation. However, this value
is lower than the MPCsw, eco, this is deemed unrealistic. Therefore, the MACsw, eco
is set equal to the MPCsw, eco at 0.15 µg/L.
2.3.5
Derivation of the SRCwater
2.3.5.1
Derivation of the SRCwater, eco
The SRCwater, eco is calculated as the geometric mean of the chronic endpoints
given in Table 6 and Table 7 and expressed for the dibutyltin cation: 50 µg/L.
2.3.5.2
Derivation of the SRCwater, secpois
For the SRCeco, oral, the NOEC of 30 mg/kgfood for growth reduction of rats, as
used for the MPC for secondary poisoning, is used as representative for rats.
Correction for laboratory feed (assessment factor 3) and correction from
subchronic to chronic (assessment factor 3) results in an NOEC for rats of
3.3 mg/kgfood. In addition, a LOAEL of 2.2 mg/kgbw/d for the dibutyltin cation is
available for maternal food consumption and fetal development of cynomolgus
monkeys (macaque) exposed from day 20 to 50 during pregnancy (Ema et al.,
2007). This is considered a chronic endpoint. Conversion to food with a factor 20
and after application of an assessment factor of 3 to correct for laboratory feed
and a factor 10 to convert from LOAEL to a NOAEL, the NOEC for monkeys is
1.5 mg/kgfood. The SRCeco, oral is equal to the geometric mean of the NOEC values
for rats and monkeys and is 2.2 mg/kgfood. With this value and the BCF of
135 L/kg, the SRCwater, secpois is 16 µg/L.
2.3.5.3
Selection of the SRCwater
The SRCwater is determined by the lowest value, this is the SRCwater, secpois of
16 µg/L.
The SRCwater is valid for the fresh- and saltwater environment.
2.4
Risk limits for groundwater
The MPCgw, eco and SRCgw, eco are equal to the MPCfw, eco and SRCfw, eco and are
0.15 µg/L and 50 µg/L respectively for the dibutyltin cation.
2.5
Risk limits for sediment
2.5.1
Derivation of the MPCsediment, eco
In ICBR (2009) a quality standard for sediment of 23.5 µg/kgdwt (and
51.1 µg/kgwwt) has been derived from the PNEC for water using equilibrium
partitioning. In this calculation, an additional assessment factor of 10 has been
used since the log Kow for DBT-oxide is higher than 5. This assessment factor
Page 19 of 74
RIVM Report 607711009
corrects for other exposures than via (pore)water which should be considered
for high Kow values. Calculation of this value in ICBR (2009) does however
contain an error since conversion from wet- to dry sediment should give a higher
concentration rather than a lower concentration. Application of the additional
assessment factor of 10 is considered not necessary since the maximum BCF of
135 L/kg indicated that the contribution of ingestion is not significant. Use of the
log Koc value derived in this report (this value is preferred since it is based on
endpoints for more (different) soils) results in a value of 0.37 mg/kgdwt for Dutch
standard soil.
2.5.2
Derivation of the SRCsediment, eco
An SRCsediment, eco has not been derived in ICBR (2009); application of equilibrium
partitioning on the SRCwater, eco provides a value of 123 mg/kgdwt for Dutch
standard sediment with 10% OM expressed for the dibutyltin cation. This
calculation has been performed with the log Koc derived in this report (see
section 2.2.3). The additional assessment factor of 10 as applied in ICBR (2009)
for substances with a log Kow > 5 is not applied for the reason given above.
2.6
Risk limits for soil
2.6.1
Soil toxicity data
No soil toxicity data are available from the public literature.
2.6.2
Derivation of the MPCsoil
2.6.2.1
Derivation of MPCsoil, eco
Since no soil toxicity data are available, the MPCsoil, eco is calculated from the
MPCfw, eco given above and the Koc value derived in this report using equilibrium
partitioning. The calculated MPCsoil, eco is 0.37 mg/kgdwt for the dibutylin cation in
Dutch standard soil with 10% organic matter.
2.6.2.2
Derivation of the MPCsoil, secpois
A BCF has been reported higher than 100 L/kg; therefore, secondary poisoning
is triggered. An MPCsoil, secpois can be calculated from the MPCoral, min of
0.3 mg/kgfd given above with the method as described in Van Vlaardingen and
Verbruggen (2007). A BCF for earthworms is not available and the use of a
QSAR on the basis of the log Kow is considered not appropriate considering the
large difference between the log Kow values of dibutyltindichloride and
bioaccumulation characteristics of dibutyltin. Therefore, the use of the BCF for
fish of 135 L/kg is considered the best alternative. The calculated MPCsoil, secpois is
3.8 mg/kgdwt for the dibutylin cation in Dutch standard soil with 10% organic
matter.
2.6.2.3
Selection of the MPCsoil
Since the MPCsoil, secpois is higher than the MPCsoil, eco (more than a factor of 10), it
can be considered that the MPCsoil, eco is protective for secondary poisoning.
Therefore, the MPCsoil is set by the MPCsoil, eco: 0.37 mg/kgdwt for the dibutylin
cation in Dutch standard soil with 10% organic matter.
Page 20 of 74
RIVM Report 607711009
2.6.3
Derivation of the SRCsoil
2.6.3.1
Derivation of the SRCsoil, eco
Since no soil toxcitiy data are available, the SRCsoil, eco is calculated from the
SRCfw, eco given above, using equilibrium partitioning. The calculated SRCsoil, eco is
123 mg/kgdwt for the dibutylin cation in Dutch standard soil with 10% organic
matter.
2.6.3.2
Derivation of the SRCsoil, secpois
For the SRCeco, oral, the geometric mean of the values for rats and monkeys of
2.2 mg/kgfood as determined above is used. With this value, the SRCsoil, secpois, as
calculated with the method as described in Van Vlaardingen and Verbruggen
(2007), is 28 mg/kgdwt for Dutch standard soil.
2.6.3.3
Selection of the SRCsoil
Since the SRCsoil, secpois is lower than the SRCsoil, eco, the SRCsoil will be
28 mg/kgdwt for dibutyltin cation in Dutch standard soil.
2.6.4
Geometric mean of MPC and SRC
The geometric mean of the MPCsoil and SRCsoil is 3.2 mg/kgdwt for the dibutyltin
cation. Since this value is based on two different routes of exposure, it is not
equivalent to an HC20.
Page 21 of 74
RIVM Report 607711009
Page 22 of 74
RIVM Report 607711009
3
Tributyltin
3.1
Data sources
For tributyltin compounds, aquatic ERLs have been derived by the European
Commission under the Water Framework Directive (EC, 2005). The ERLs for
tributyltin expressed for the TBT-ion are adopted as the ERLs for all tributyltin
compounds.
3.2
Substance information
3.2.1
Information on production and use
Tributyltin compounds are being used for wood preservation, antifouling in
marine paints and for antifungal action in textiles and industrial water systems.
The use of tributyltin as antifouling has been banned since 2003 in the EU
(RIVM, 2010, Norway, 2008) and other biocidal use should have ceased before
September 2006 (Norway, 2008). Other uses are still allowed and
bis(tributyltin)oxide as well as tributyltin chloride are registered under REACH.
Further marketing and use restrictions are currently under consideration within
the REACH framework (Norway, 2008) and tributyltin is placed on the REACH
candidate list for inclusion in Annex XIV (www.echa.europa.eu). This means that
only use in closed systems will be allowed.
3.2.2
Identification
Information on the identification of different species of tributyltin presented in
EC (2005) are given in the tables below. Details on three different forms of
tributyltin are presented, in the environment; all three will become available as
the tributyltin-cation.
Table 8. Identification of the tributyltin cation
Chemical name
Synonyms
CAS-number
EC-number
Structural formula
Tributyltin cation
TBT, tri-n-butyltin
36643-28-4
-
H3C
+
Sn
CH3
CH3
Molecular formula
SMILES code
C12H28Sn
CCCCSn(CCCC)CCCC
Page 23 of 74
RIVM Report 607711009
Table 9. Identification of tributyltin hydride
Chemical name
Synonyms
CAS-number
EU-number
Structural formula
Tributyltin hydride
TBT, tri-n-butyltin hydride
688-73-3
211-704-4
H3C
SnH
CH3
CH3
Molecular formula
SMILES code
C12H29Sn
CCCCSn(CCCC)CCCC
Table 10. Identification of tributyltin chloride
Chemical name
Synonyms
CAS-number
EC-number
Structural formula
Tributyltin chloride
TBT-Cl, tri-n-butyltinchloride; Tributylchlorostannane
1461-22-9
215-958-7
Cl
Sn
H3C
Molecular formula
SMILES code
CH3
C12H28ClSn
CCCCSn(Cl)(CCCC)CCCC
CH3
Table 11. Identification of bis(tributyltin)oxide
Chemical name
Synonyms
CAS-number
EC-number
Structural formula
Bis(tributyltin)oxide
TBT, tributyltin oxide
56-35-9
200-268-0
CH3
H3C
H3C
Sn
O
H3C
Sn
CH3
Molecular formula
SMILES code
Page 24 of 74
CH3
C24H54OSn
CCCCSn(CCCC)(CCCC)OSn(CCCC)(CCCC)CCCC
RIVM Report 607711009
Physico-chemical properties
Physico-chemical properties of different species of tributyltin presented in EC
(2005) are summarized in the tables below. Since the ERLs for TBT in sediment
are calculated through equilibrium partitioning and the Koc in EC (2005)
originates from only two unavailable studies, a literature search is performed on
sorption parameters of TBT in soil and sediments. Like the case for DBT, the
studies are validated and the reliable endpoints are used to determine the
average log Koc. Brief details if the studies are given in Appendix 1. Figure 2
shows the correlation between the sorption constant Kd and the fraction organic
carbon for the endpoints for tributyltin given in Appendix 1. From this figure, it
can be seen that the sorption of a soil to some extent is influenced by the
faction of organic carbon. Therefore, the derived ERLs for soil and sediment are
normalised standard Dutch soil with 10% organic matter, and application of
equilibrium partitioning, based on the Koc, is considered acceptable.
14000
12000
10000
8000
Kd
3.2.3
6000
y = 19868x + 1117
R2 = 0.0841
4000
2000
0
0.000
0.050
0.100
0.150
0.200
fraction OC
Figure 2. Correlation between sorption constant Kd and the fraction organic
carbon
Table 12. Physico-chemical properties of tributyltin hydride
Parameter
Molecular weight
Water solubility
Unit
[g/mol]
[mg/L]
pKa
Log KOW
[-]
[-]
Log KOC
Vapour pressure
[-]
[Pa]
Melting point
Boiling point
[°C]
[°C]
Henry’s law constant
[Pa.m3/mol]
Value
291.09
5.3
Remark
Ref.
25°, estimated
from log Kow of 4.00
US EPA (2009)
4.00
7.35
4.1
n.a.
766.6
5.3
80
250
122.5-113.5
42 x 103
estimated ClogP
estimated
experimental
see TBT-Cl
experimental, 25°C
estimated, 25°C
experimental
estimated
Biobyte (2006)
US EPA (2009)
SRC (2011)
25°C, calculated:
mw x vp/ws
US EPA (2009)
US EPA (2009)
US EPA (2009)
US EPA (2009)
HSDB (2005)
Page 25 of 74
RIVM Report 607711009
Table 13. Physico-chemical properties of tributyltin chloride
Parameter
Molecular weight
Water solubility
pKa
log KOW
Unit
[g/mol]
[mg/L]
[-]
[-]
Value
325.51
17
Remark
Ref.
experimental, 20°C
US EPA (2009)
4.25
4.25
4.76
estimated ClogP
experimental MlogP
experimental
Log KOC
[-]
4.5
average of 33
log Koc values
range for two
references, original
studies not
available, the actual
species of TBT
tested is unclear
estimated, 25°C
estimated, 20°C
experimental
experimental
Biobyte (2006)
Biobyte (2006)
US EPA (2009);
HSDB (2005)
see Appendix 1
2.5-6.2
Vapour pressure
[Pa]
Melting point
Boiling point
[°C]
[°C]
Henry’s law constant
[Pa.m3/mol]
48.5
30
53
193
171-173
574
EC (2005);
Hillenbrand et al.
(2006)
US EPA (2009)
US EPA (2009)
US EPA (2009)
US EPA (2009)
HSDB (2005)
20°C, calculated:
mw x vp/ws
* This value of 4.5 is used where necessary since this value is located within the range as
reported in EC (2005) and is based on a large number of studies. Considering the poor
correlation between Kd and fraction OC, the log Koc is based on the average log Koc values,
rather than the slope of the fitted line.
Table 14. Physico-chemical properties of bis(tributyltin)oxide
Parameter
Molecular weight
Water solubility
Unit
[g/mol]
[mg/L]
Value
596.12
19.5
4
18-61.4
0.75
pKa
Log KOW
[-]
[-]
Log KOC
Vapour pressure
Melting point
Boiling point
[-]
[Pa]
[°C]
[°C]
Henry’s law
constant
[Pa.m3/mol]
Remark
Ref.
Experimental, temperature
unknown
US EPA (2009)
pH 6.6
31
4
pH 8.1
pH 7, 20°C)
4.38
3.84
4.05
3.85
3.2-3.8
n.a.
0.001
< -45
220-230
173
180
0.15
estimated ClogP
experimental
estimated
see TBT-Cl
20°C, experimental
HSDB (2005)
EC (2005)
EC (2005), Hillenbrand et
al. (2006)
EC (2005)
Hillenbrand et al.(2006),
Norway (2008)
Biobyte (2006)
US EPA (2009)
US EPA (2009)
EC (2005)
EC (2005)
US EPA (2009)
EU-ECB (2000a)
EU-ECB (2000a)
EU-ECB (2000a)
EU-ECB (2000a)
20°C, calculated with water
solubility of 4 mg/L: mw x
vp/ws
* In EC (2005), also a value of 30 mg/L for a pH of 2.6 is reported. This value seems not
realistic for this pH. In the latest version of the original reference (Hillenbrand et al.,
2006); this value is not included anymore.
Page 26 of 74
RIVM Report 607711009
3.2.4
Behaviour and distribution in the environment
Selected environmental properties of tributyltin are presented in Table 15.
Table 15. Selected environmental properties of tributyltin
Parameter
Hydrolysis half-life
Degradation
Photolysis half-life
Biodegradability
Relevant metabolites
Unit
Value
Remark
DT50 [d]
no information
DT50 [d]
20-35
in freshwater
DT50 [d]
no information
not readily biodegradable
none
Ref.
Hillenbrand (2006)
US EPA (2009)
Bis(tributyltin) oxide has been considered as a PBT substance and fulfils the PBT
critera (Norway, 2008), and is placed on the REACH candidate list for inclusion
in Annex XIV (www.echa.europa.eu). Since this substance transforms to the
tributyltin cation in the environment, it can be concluded that the TBT-cation
also fulfils the PBT criteria.
3.2.5
Bioconcentration and biomagnification
In EC (2005), bioconcentration factors for fish are reported of 2600 and
52000 L/kg. The latter value is for liver only. For molluscs, values ranging from
1000 to 11400 L/kg are reported, and for a crustacean a value of 500-4400 L/kg
is reported. In EC (2005), a BCF of 6000 L/kg is used to assess the risk of
secondary poisoning and human health through fish consumption. In
Van Herwijnen et al. (2012), it is stated that TBT does not biomagnify. It should
be noted that the BCF for triphenyltin is determined to be 3500 L/kg
(Van Herwijnen et al., 2012). This value is lower than that for TBT; this is in
contradiction with, as is reported in Van Herwijnen et al. (2012), that the
biomagnification potential of triphenyltin is higher than for TBT. Therefore the
value of 6000 L/kg for TBT is considered very high and should be seen as a
worst case estimate.
3.3
Risk limits for water
In EC (EC, 2005), aquatic risk limits have been derived for the tributyltin ion.
These risk limits are taken over in this report where applicable.
3.3.1
Aquatic toxicity data
The fresh- and saltwater toxicity data selected in EC (2005) are given in
Table 16 and Table 17 respectively.
Table 16. Tributyltin: selected freshwater toxicity data for ERL derivation
Chronic
Taxonomic group
NOEC/EC10
(µg/L)
Algae
Chlorella pyrenoidosa
Pseudokirchneriella subcapitata
18
4
Mollusca
Lymnea stagnalis
0.32
Crustacea
Daphnia magna
0.16
Acute
Taxonomic group
Cyanobacteria
Anabaena flos aquae
Algae
Ankistrodesmus falcatus
Macrophyta
Azolla filiculoides
Lemna minor
Annelida
Tubifex tubifex
Crustacea
Daphnia magna
L(E)C/50
(µg/L)
13
5
8.3
30.8
0.1
0.03
Page 27 of 74
RIVM Report 607711009
Chronic
Taxonomic group
Insecta
Hexagenia sp.
Pisces
Oncorhynchus mykiss
Pimephales promelas
Poecilia reticula
NOEC/EC10
(µg/L)
0.5
0.04
0.17
0.01
Acute
Taxonomic group
Insecta
Chironomus plumosus
Pisces
Ictalurus punctatus
Oncorhynchus mykiss
Phoxinus phoxinus
Amphibia
Rana temporaria
L(E)C/50
(µg/L)
0.05
12
1.28
0.69
1.65
Table 17. Tributyltin: selected saltwater toxicity data for ERL derivation
Chronic
Taxonomic group
NOEC/EC10
(µg/L)
Acute
Taxonomic group
L(E)C/50
(µg/L)
Algae
Algae
Dunaliella tertiolecta
0.05
Enteromorpha intestinalis
0.027
Mollusca
Skelotonema costatum
0.33
Buccinum undatum
0.0028
Mollusc
Crassostrea gigas
0.005
Crassostrea virginica
0.13
Mercanaria mercanaria
0.0024
Mytilus edulis
0.006
Nucella lapillus
0.001
Nucella lima
0.0064
Saccostrea commercialis
0.005
Annelida
Neanthes arenaceodentata
0.05
Crustacea
Crustacea
Acartia tonsa
0.1
Acartia tonsa
0.015*
Eurytemora affinis
0.01
Gammarus oceanicus
0.3
Palaemonetes pugio
0.033
Echinodermata
Ophioderma brevispina
0.01
Pisces
Pisces
Cyprinodon variegatus
0.34
Solea solea
2.1
Gasterosteus aculeatus
0.1
* In EC (2005) a value of 0.0015 µg/L is tabulated, but in the text a value of 0.015 is used
to derive the MAC-QS. Verification in the original reference revealed that the latter value is
the correct one.
3.3.2
Treatment of fresh- and saltwater toxicity data
In EC (2005), it is reported that there is no difference between fresh- and
saltwater data, and the two datasets were combined. From Table 16 and
Table 17 can however be seen that a difference between the two datasets is not
unlikely (p = 0.076). Also, at the level of taxonomic groups, there seems to be a
difference, for example for molluscs and algae.
3.3.3
Derivation of the MPCwater
3.3.3.1
Derivation of the MPCwater, eco
In EC (2005), a quality standard for fresh surface water of 0.2 ng/L has been
derived on the basis of the HC5 of a Species Sensitivity Distribution (SSD) with
an assessment factor of 4. For this SSD, it has been considered that plants are
missing, but the quality standard derived through this method is preferred over
one derived through the assessment factor method. The quality standard from
the SSD is taken over as the MPCfw, eco. For the saltwater environment, the same
quality standard of 0.2 ng/L has been derived because a comprehensive data set
Page 28 of 74
RIVM Report 607711009
on marine species is available. This quality standard is taken over as the
MPCsw, eco.
3.3.3.2
Derivation of the MPCwater, secpois
In EC (2005), a quality standard for animals eating aquatic organisms has been
calculated of 38 ng/L. The calculated quality standard is based on a reproduction
NOAEL of 0.34 mg/kgbw/d for rats from a long term study, a conversion factor of
20, an assessment factor of 30 (resulting in an MPCoral, min of 0.23 mg/kgfd) and
a BCF of 6000 L/kg. The value of 38 ng/L is taken over as the MPCfw, secpois. The
BMF2 for the marine environment is set at 1; therefore, this value is also valid
for the marine environment.
3.3.3.3
Selection of the MPCwater
The MPCfw and MPCsw are determined by the lowest value: 0.2 ng/L.
3.3.4
Derivation of the MACwater, eco
In EC (2005), a MAC-QS has been derived by dividing the lowest acute toxicity
value, of 0.015 µg/L for Acartia tonsa, by a factor 10. This factor was used
because the large dataset on freshwater and marine taxonomic groups shows
that the other groups do not have a higher acute sensitivity to TBT-compounds.
The dataset does however fulfil the requirements to perform an SSD:
Fish: Ictalurus punctatus
A second family of fish: Oncorhynchus mykiss and others
A crustacean: Daphnia magna and Acartia tonsa
An insect: Chironomus plumosus
A family in a phylum other than Arthropoda or Chordata: Crassostrea
virginica
A family in any order of insect or any phylum not already represented:
Anabaena flos-aquae
Algae: Ankistrodesmus falcatus and others
Higher plants: Lemna gibba
The use of an SSD is preferred since all data are involved. The SSD determined
with ETX (Van Vlaardingen et al., 2004) is shown in Figure 3. The calculated HC5
is 0.010 µg/L, with a two sided 90% confidence interval of 0.0013 - 0.041 mg/L.
The goodness of fit is accepted at all levels by the three statistical tests available
in the program.
Page 29 of 74
RIVM Report 607711009
Figure 3 Species Sensitivity Distribution for tributyltin (acute data)
Nevertheless, for freshwater, the value of 1.5 ng/L derived in EC (2005), is
taken over as the MACfw, eco. For the saltwater environment no MAC has been
derived in EC (2005) and the MACsw, eco will be based on the SSD. Since acute
toxicity data are available for one specific marine species (Crassostrea virginica),
the MACsw, eco is derived from the HC5 by an assessment factor of 50 at
0.2 ng/L.
3.3.5
Derivation of the SRCwater
3.3.5.1
Derivation of the SRCwater, eco
The SRCwater, eco is determined by the HC50 of 46 ng/L from the SSD.
3.3.5.2
Derivation of the SRCwater, secpois
For the SRCeco, oral, the NOAEL of 0.34 mg/kgbw/d for rats from a long term
study, as used for the MPCs for secondary poisoning, is used as representative
for rats. Conversion to food (factor 20) and correction for laboratory feed
(assessment factor 3) results in an NOEC for rats of 2.3 mg/kgfood. In addition,
endpoints for two more species are available.
For mice, a NOAEL of 0.38 mg/kgbw/d for the tributyltin cation is available for
testicular sperm head counts in mice orally exposed to TBT-O for 4 weeks during
the premature period (Kumasaka et al., 2002). In contradiction, Yan et al.
(2009) and Chen et al. (2008) reported much lower NOAELs of < 0.45 µg/kgbw
for the tributyltin cation from a similar test with mice exposed to TBT-Cl once
every three days. Apart from the different test substance, there is also a
difference in the vehicle used. Kumasaka et al. (2002) used a solution in 0.2%
ethanol while the other two studies used a solution with an ethanol: 0.85%
sodium chloride ratio of 1:10 (v:v). In the case of Kumasaka et al. (2002), it
can be questioned if the ethanol concentration was high enough to enable a full
Page 30 of 74
RIVM Report 607711009
solubility of the TBT-O. Presuming a vehicle volume of 5 µl/g as used in the
other two studies, the doses would exceed the water solubility of TBT-O at a
neutral pH, and at a lower pH as in the stomach the solubility will be even lower.
If the substance would not be fully dissolved, this could influence the uptake and
actual exposure of the mice tested. Considering this and the fact that a different
substance is tested, the endpoint from Yan et al. (2009) and Chen et al. (2008)
is selected. This is considered a chronic endpoint. Conversion to food with a
factor 8.3 and after application of an assessment factor of 3 to correct for
laboratory feed, a correction for daily exposure (factor 3) and an assessment
factor of 10 to correct from LOAEL to NOAEL, the NOEC for mice is
0.04 µg/kgfood. For mice, a second NOEC of 19.5 mg/kgfood expressed for the
TBT-cation is available for maternal toxicity of mice exposed during pregnancy
(Baroncelli et al., 1990). This is also considered a chronic endpoint. Application
of an assessment factor of 3 to correct for laboratory feed results in an NOEC of
6.5 mg/kgfood. Penza et al. (2011) reported a not-dose-related but significant
effect on the fat/bodyweight ratio of mice exposed through diet at a
concentration of 5 µg/kgdiet for a period of three months. Since this effect is not
dose-related (higher and lower concentrations showed no significant effects), it
is unclear if this effect is caused by tributyltin or just an artefact. The first value
for mice is most critical and will be used for the SRCwater, secpois. It should be
noted that the fact that the selected endpoint for mice is much lower than that
for rats as used for the MPCwater, secpois indicates that the MPCwater, secpois is
probably underprotecting. This also involves the ADI as used in EC (2005).
Furthermore a chronic NOEC of 24 mg/kgfood is available for hatchability of
Coturnix coturnix eggs of which the parents were exposed for six weeks in the
egg laying period (Coenen et al., 1992). Correction for laboratory feed results in
an SRCoral for birds of 8 mg/kgfood. The geometric mean of the values for rats,
mice and birds is 0.09 mg/kgfood. With this value and the BCF of 6000 L/kg, the
SRCwater, secpois is 15 ng/L. Considering the fact that this value is based on a
worst-case BCF, this value can also be considered worst-case. A more realistic
approach would be to use the fish BCF for triphenyltin since this compound is
considered to have a higher bioaccumulation potential than TBT. With the BCF of
3500 L/kg for triphenyltin, the SRCwater, secpois is 26 ng/L. The latter value is
preferred.
3.3.5.3
Selection of the SRCwater
The SRCwater is determined by the lowest value; this is the SRCwater, secpois of
26 ng/L.
The SRCwater is valid for the fresh- and saltwater environment.
3.4
Risk limits for groundwater
The MPCgw, eco and SRCgw, eco are equal to the MPCfw, eco and SRCfw, eco and are
0.2 ng/L and 46 ng/L respectively.
3.5
Risk limits for sediment
3.5.1
Derivation of the MPCsediment, eco
In EC (2005), a quality standard for sediment of 0.02 µg/kgdwt has been derived
from the quality standard for fresh surface water using equilibrium partitioning
and a log Koc of 3.0. For Dutch standard soil with 10% OM, this value is
0.01 µg/kgdwt. Since this log Koc is relatively low compared to the range of
Page 31 of 74
RIVM Report 607711009
log Koc values tabulated in Appendix 1, the MPCsediment, eco should be seen as a
worst case estimate.
3.5.2
Derivation of the SRCsediment, eco
An SRCsediment, eco has not been derived in EC (2005); application of equilibrium
partitioning on the SRCwater, eco provides a value of 27 µg/kgdwt for Dutch
standard soil with 10% OM. This calculation has been performed with the log Koc
of 4.0 derived in this report.
3.6
Risk limits for soil
3.6.1
Soil toxicity data
Selected soil toxicity data are given in Table 18; details on these endpoints are
tabulated in Appendix 2.
Table 18. Tributyltin: selected soil toxicity data for ERL derivation
Chronic
Taxonomic group
Microbial processes
respiration/dehydrogenase/
ATP content
NOEC/EC10
(mg/kgdwt)
12
Macrophyta
Brassica rapa
Annelida
Eisenia fetida
Eisenia andrei
Collembola
Folsomia candida
37.4
a
7.2 b
2.4 c
Acute
Taxonomic group
Microbial processes e
Potential nitrification
Potential nitrification
Potential nitrification
Macrophyta
Avena sativa
Brassica rapa
Annelida
Eisenia fetida
L(E)C/50
(mg/kgdwt)
65
221
279
1395 f
63 g
7.9 h
55.6 d
a
Geometric mean of EC10 values of 205.2, 9.5, 26.1, 9.3, 72.0, 137.8, 9.0 and
91.3 mg/kgdwt for Dutch standard soil
b
Geometric mean of 7.6, 10.3 and 4.8 mg/kgdwt for Dutch standard soil
c
Most sensitive endpoint reproduction; geometric mean of 4.7, 5.1, 1.1, 0.2, 5.2, 1.0, 6.1,
8.7 and 2.1 mg/kgdwt for Dutch standard soil
d
Lowest geometric mean of 70.2, 26.4, 29.1, 72.6, 61.8, 110.4, 18.2, 89.9, 209.6 and
30.6 mg/kgdwt for mortality expressed for Dutch standard soil
e
Endpoints for microbial processes derived from tests with different soils are considered as
endpoints from different species, considering the different microbial populations present
in the different soils
f
Geometric mean of 1159, 1907 and 1227 mg/kgdwt for Dutch standard soil
g
Geometric mean of 64, 55 and 70 mg/kgdwt for Dutch standard soil
h
Geometric mean of 13.5 and 4.6 mg/kgdwt for Dutch standard soil
3.6.2
Derivation of the MPCsoil,
3.6.2.1
Derivation of the MPCsoil, eco
Chronic soil toxicity data are available for producers (Brassica rapa), consumers
(Eisenia sp. and Folsomia candida) and bacterial processes. With chronic data
representing three trophic levels, an assessment factor of 10 can be applied to
Page 32 of 74
RIVM Report 607711009
lowest value of 2.4 mg/kg. This results in an MPCsoil, eco of 0.24 mg/kgdwt for
Dutch standard soil with 10% organic matter.
3.6.2.2
Derivation of the MPCsoil, secpois
A BCF has been reported higher than 100 L/kg therefore secondary poisoning is
triggered. An MPCoral, min can be detrmined from the lowest NOAEL of
< 0.45 µg/kgbw for mice given in Section 3.3.5.2. This value can be considered a
chronic LOAEL. Conversion to food with a factor 8.3 and after application of an
assessmentfactor of 10 to correct from LOAEL to NOAEL, correction for daily
exposure (factor 3) and an assessmentfactor of 30 gives an MPC oral, min of
0.004 µg/kfood. From this value, an MPCsoil, secpois can be calculated with the
method as described in Van Vlaardingen and Verbruggen (2007). A BCF for
earthworms is not available and the use of a QSAR on the basis of the log Kow is
considered not appropriate considering the bioaccumulation characteristics of
TBT. Therefore, the use of the BCF for fish is considered the best alternative.
The Kow value used was 4.06 as it was the average of the experimental values
for the three TBT-species given in section 3.2.3. The Henry's law constant used
was 106 Pa/m3/mol as the geometric mean of the values for the three TBTspecies. With the log Koc value of 4.5 and the worst case BCF of 6000 L/kg, the
calculated MPCsoil, secpois is 1.4 ng/kgdwt for Dutch standard soil with 10% organic
matter. This value is much lower than the MPCsoil, eco of 0.24 mg/kgdwt.
Considering the fact that this value is based on a worst-case BCF, this value can
also be considered worst-case. A more realistic approach would be to use the
fish BCF for triphenyltin since this compound is considered to have a higher
bioaccumulation potential than TBT. With the BCF of 3500 L/kg for triphenyltin,
the MPCsoil, secpois is 2.3 ng/kgdwt for Dutch standard soil with 10% organic matter.
The latter value is preferred.
3.6.2.3
Selection of the MPCsoil
Since the worst-case MPCsoil, secpois is lower than the MPCsoil, eco, the first will set
the MPCsoil at 2.3 ng/kgdwt for Dutch standard soil with 10% organic matter.
3.6.3
Derivation of the SRCsoil
3.6.3.1
Derivation of the SRCsoil, eco
The SRCsoil, eco is calculated as the geometric mean of the chronic toxicity data in
Table 18. The SRCsoil, eco is 13 mg/kgdwt for Dutch standard soil with 10%organic
matter.
3.6.3.2
Derivation of the SRCsoil, secpois
For the SRCeco, oral, the geometric mean of the values for rats, mice and birds of
0.09 mg/kgfood as determined above is used for calculation of the SRCsoil, secpois.
With use of the log Koc value of 4.5 and a fish BCF of 6000 L/kg, the calculated
SRCsoil, secpois would be 31 µg/kgdwt for Dutch standard soil with 10% organic
matter. Considering the use of the worst-case BCF, this value should also be
seen as worst-case. A more realistic approach would be to use the fish BCF for
triphenyltin since this compound is considered to have a higher bioaccumulation
potential than TBT. With the BCF of 3500 L/kg for triphenyltin, the SRCsoil, secpois
is 52 µg/kgdwt for Dutch standard soil with 10% organic matter. The latter value
is preferred.
3.6.3.3
Selection of the SRCsoil
The SRCsoil is set by the lowest value, this is the SRCsoil, secpois of 52 µg/kgdwt for
Dutch standard soil with 10% organic matter.
Page 33 of 74
RIVM Report 607711009
3.6.4
Geometric mean of the MPC and SRC
The geometric mean of the MPCsoil and SRCsoil is 0.35 µg/kgdwt.
Page 34 of 74
RIVM Report 607711009
4
Triphenyltin
4.1
Data sources
Triphenyltin compounds are triphenyl derivatives of tetravalent tin. They are
lipophilic and have low solubility in water. Since triphenyltin compounds are
believed to dissociate in the environment and remain unchanged, data available
for all triphenyltin compounds (triphenyltin chloride, -acetate, -hydroxide) are
evaluated. The ERLs will be expressed in concentration of the dissociated cation.
In Van Herwijnen et al. (2012), aquatic risk limits have been derived for
triphenyltin. These risk limits are adopted in this report where applicable.
4.2
Substance information
4.2.1
Information on production and use
Triphenyltin compounds have been used extensively as algicides and
molluscicides in antifouling products since the 1960s. Use of triorganotins in
antifouling paints has been restricted in many countries because of their
catastrophic effects on the oyster industry and more general effects on the
aquatic ecosystem. Triphenyltin is used as a non-systemic fungicide with mainly
protective action.
4.2.2
Identification
Information on the identification of different species of triphenyltin are
presented in the tables below.
Table 19. Identification of triphenyltin
Chemical name
Synonyms
Structural formula
Triphenyltin
Fentin, TPT
Sn
Molecular formula
SMILES code
+
C18H15Sn
c1ccccc1[Sn+](c2ccccc2)c3ccccc3
Table 20. Identification of triphenyltin chloride
Chemical name
Synonyms
CAS number
EC number
Structural formula
Triphenyltin chloride
Fentin chloride, TPTCl
639-58-7
211-358-4
Sn
Cl
Molecular formula
SMILES code
C18H15SnCl
Cl[Sn](c1ccccc1)(c2ccccc2)c3ccccc3
Page 35 of 74
RIVM Report 607711009
Table 21. Identification of triphenyltin hydroxide
Chemical name
Synonyms
CAS number
EC number
Structural formula
Triphenyltin hydroxide
Fentin hydroxide, TPTH
76-87-9
200-990-6
Sn
OH
Molecular formula
SMILES code
C18H16SnO
O[Sn](c1ccccc1)(c2ccccc2)c3ccccc3
Table 22. Identification of triphenyltin acetate
Chemical name
Synonyms
CAS number
EC number
Structural formula
Triphenyltin acetate
Fentin acetate, TPTAc
900-95-8
212-984-0
Sn
Ac
C20H18O2Sn
Molecular formula
SMILES code
4.2.3
O=C(C)O[Sn](c1ccccc1)(c2ccccc2)c3ccccc3
Physico-chemical properties
Physico-chemical properties of triphenyltin are presented in the following tables
for different ionic forms.
Table 23. Physico-chemical properties of triphenyltin chloride
Bold values are used for ERL derivation.
Parameter
Molecular weight
Water solubility
Unit
[g/mol]
[mg/L]
pKa
Log KOW
[-]
[-]
Log KOC
[-]
Value
385.5
40
1.2
0.6
0.99
1
0.078
n.a.
3.56
4.19
4.19
3.89
3.5
5.7
3.6
5.09;
4.73
Page 36 of 74
Remark
20°C
10°C, pH 7.5, distilled water*
10°C, pH 7.5, seawater*
estimated from log Kow of 4.19,
25°C
25°C, from experimental database
estimated from fragments
estimated - ClogP
experimental - MlogP
Experimental calculated from
Freundlich log Kd of 1.81 and fom of
1.43%, 1/n = 0.793
QSAR Sabljic hydrophobics
MCI method
Kow method
Laboratory experiment with field
sediment; calculated from log Kd
and %oc
Ref.
HSDB (2005)
HSDB (2005)
Inaba et al. (1995)
Inaba et al. (1995)
US EPA (2009)
US EPA (2009)
US EPA (2009)
Biobyte (2006)
Biobyte (2006)
HSDB (2005)
Sun et al. (1996)
Van Vlaardingen and
Verbruggen (2007)
US EPA (2009)
US EPA (2009)
Berg et al. (2001)
RIVM Report 607711009
Parameter
Unit
Value
4.94;
5.37
Vapour pressure
[mPa]
0.8
Remark
Field measurements with contam.
sediment; calculated from log Kd
and %oc
estimated, 25°C
Ref.
Berg et al. (2001)
HSDB (2005), US EPA
(2009)
0.37
estimated, 20°C
US EPA (2009)
Melting point
[°C]
103.5
HSDB (2005)
Boiling point
[°C]
240
at 1.8 kPa
HSDB (2005)
Henry’s law
[Pa.m3/mol]
0.0036 MW x VP/WS, calculated with
Van Vlaardingen and
constant
values for 20°C
Verbruggen (2007)
0.3
MW x VP/WS, calculated with
Van Vlaardingen and
values for 25°C
Verbruggen (2007)
* The solubility is triphenyltin chloride is dependent on the salinity, the pH and the
temperature of the water.
Table 24. Physico-chemical properties of triphenyltin hydroxide
Bold values are used for ERL derivation.
Parameter
Molecular weight
Water solubility
Unit
[g/mol]
[mg/L]
Value
367.0
1.2
4.72
0.4
13.8
1.6
pKa
Log KOW
[-]
[-]
Log KOC
[-]
Vapour pressure
Melting point
Boiling point
Henry’s law
constant
[mPa]
[°C]
[°C]
[Pa.m3/mol]
1
5.20
3.50
3.53
3.53
4.4
3.5
3.0
5.7
3.1
0.047
119
n.a.
0.043
Remark
20°C
estimated from log Kow of 3.53,
25°C
from experimental database,
25°
estimated from fragments
± 0.2; determined with
saturator system
estimated – ClogP
experimental - MlogP
QSAR Sabljic hydrophobics
MCI method
Kow method
25 °C
MW x VP/WS, 25°C
Ref.
HSDB (2005)
HSDB (2005)
US EPA (2009)
US EPA (2009)
US EPA (2009)
Jarvinen et al. (1988)
Vogue et al. (1994)
Biobyte (2006)
Biobyte (2006)
Biobyte (2006)
HSDB (2005)
Vogue et al. (1994)
Footprint (2011)
Van Vlaardingen and
Verbruggen (2007)
US EPA (2009)
US EPA (2009)
HSDB (2005)
HSDB (2005)
Van Vlaardingen and
Verbruggen (2007)
Table 25. Physico-chemical properties of triphenyltin acetate
Bold values are used for ERL derivation.
Parameter
Molecular weight
Water solubility
Unit
[g/mol]
[mg/L]
Value
409.0
9
0.71
9
pKa
Log KOW
[-]
[-]
Log KOC
[-]
0.29
n.a.
3.46
3.43
3.3
2.9
4.9
2.6
Remark
Ref.
Tomlin (2002)
Tomlin (2002)
US EPA (2009)
20°c, pH 5
estimated from log Kow of 4.19,
25°C
from experimental database,
20°C
estimated from fragments
US EPA (2009)
US EPA (2009)
ClogP
QSAR Sabljic hydrophobics
MCI method
Kow method using log Kow of 3.43
Biobyte (2006)
Tomlin (2002)
Footprint (2011)
Van Vlaardingen and
Verbruggen (2007)
US EPA (2009)
US EPA (2009)
Page 37 of 74
RIVM Report 607711009
4.2.4
Parameter
Vapour pressure
Unit
[mPa]
Melting point
Boiling point
Henry’s law
constant
[°C]
[°C]
[Pa.m3/mol]
Value
1.9
0.038
122-123
n.a.
0.0017
Remark
60°C
estimated, 20°C
Ref.
Tomlin (2002)
US EPA (2009)
Tomlin (2002)
MW x VP/WS, 20°C
Van Vlaardingen and
Verbruggen (2007)
Behaviour and distribution in the environment
Selected environmental properties of triphenyltin are presented in Table 8.
Table 26. Selected environmental properties of triphenyltin
Parameter
Hydrolysis half-life
Unit
DT50 [h]
Photolysis half-life
Readily biodegradable
Relevant metabolites
DT50 [h]
Value
0.07
30
18
No
Remark
triphenyltin acetate, 20°C, pH 7
triphenyltin hydroxide, 20°C, pH 7
triphenyltin hydroxide, pH 7
Ref.
Footprint (2011)
Footprint (2011)
Footprint (2011)
US EPA (2009)
In water, both triphenyltin acetate and triphenyltin chloride hydrolyze to
triphenyltin hydroxide (HSDB, 2005). For the derivation of MPCs for the water
and sediment compartment, the physico-chemical properties of triphenyltin
hydroxide are therefore preferred.
4.2.5
Bioconcentration and biomagnification
In Van Herwijnen et al. (2012) a BCF value of 3500 L/kg is selected for
triphenyltin. The selected BMF1 and BMF2 are 3.7 and 1 respectively.
4.3
Risk limits for water
In Van Herwijnen et al. (2012), aquatic risk limits have been derived for
triphenyltin. These risk limits are taken over in this report where available.
4.3.1
Aquatic toxicity data
The fresh- and saltwater toxicity data selected in Van Herwijnen et al. (2012)
are given in Table 27 and Table 28 respectively.
Table 27. Triphenyltin: selected freshwater toxicity data for ERL derivation for
the triphenyltin ion
Chronica
Taxonomic group/species
Algae
Scenedesmus obliquus
Scenedesmus vacuolatus
Macrophyta
Lemna minor
Lemna polyrhiza
Mollusca
Marisa cornuarietis
Page 38 of 74
NOEC/EC10
(µg/L)
2.3
44.5
0.9 b
2.2 c
0.016 d
Acutea
Taxonomic group/species
L(E)C50
(µg/L)
Algae
Scendesmus obliquus
Scenedesmus vacuolatus
Macrophyta
Lemna minor
Lemna polyrhiza
Platyhelminthes
Dugesia sp.
Polycellis niger/tenius
Mollusca
Physa fontinalis
Planorbis contortis
Annelida
27
102
12 b
24 c,b
17.9 j
19.9 j
10.2 j
6.0 j
RIVM Report 607711009
Chronica
Taxonomic group/species
NOEC/EC10
(µg/L)
Crustacea
Daphnia magna
1.1 e
Insecta
Chironomus riparius
0.52 f
Pisces
Acutea
Taxonomic group/species
Tubifex sp.
Crustacea
Ceriodaphnia dubia
Daphnia magna
Daphnia pulex
Gammarus pulex
Insecta
Anopheles stephensi
Cloeon dipterum
Endochironomus albipennis
Pisces
Cyprinus carpio
Oncorhynchus mykiss
Oryzias latipes
Oncorhynchus mykiss
0.18
Oryzias latipes
0.00043 g
Phoxinus phoxinus
0.2 h
Pimephales promelas
0.154 i
Pimephales promelas
Amphibia
Pelophylax lessonae/esculenta
0.11
a
For detailed information see Appendix 1
b
Endpoint based on combined low ad high concentration range
c
Most sensitive endpoint: growth rate
d
Most sensitive endpoint: spawning mass production
e
Most sensitive endpoint: mortality; geometric mean of 0.73, 0.86 and 2.2 µg/L
f
Most sensitive endpoint: development rate
g
Most sensitive endpoint: larval survival
h
Most sensitive endpoint: mortality and morphological deformities
i
Most sensitive exposure period: 183d
j
Most sensitive exposure period: 96h
k
Most sensitive exposure period: 48h
l
Most sensitive stadium: 2nd instar and most toxic species TPT-Ac
m
Geometric mean of 14.3 and 40.1 µg/L
n
Geometric mean of 9.2, 6.8, 5.1, 5.7 and 5.7 µg/L
L(E)C50
(µg/L)
11.0 j
10.8
15.8 k
13.8
10.8 j
42 l
144.5 j
259.2 j
36.2
23.9 m
50.5
6.4 n
Table 28. Triphenyltin: selected marine toxicity data for ERL derivation for the
triphenyltin ion
Chronica
Taxonomic group/species
NOEC/EC10
(µg/L)
Acutea
Taxonomic group/species
Bacteria
Algae
Pavlova lutheri
Mollusca
Nucella lapillus
Crustacea
Rhithropanopeus harrisii
Echinodermata
Anthocidaris crassispina
Paracentrotus lividus
Ophiodermata brevispina
a
b
c
d
e
L(E)C50
(µg/L)
Vibrio fischeri
40 d
Pisces
Chasmichthys dolichognathus
19 e
0.04
0.15
9.5
245 b
1.0
0.011 c
For detailed information see Appendix 1
Most sensitive endpoint: embryo development
Geometric mean of 0.009 and 0.0126 µg/L
Geometric mean of 18 and 87 µg/L
Geometric mean of 17, 20 and 20 µg/L
Page 39 of 74
RIVM Report 607711009
4.3.2
Treatment of fresh- and saltwater toxicity data
According to Lepper (2005), data from fresh- and saltwater tests should be
pooled unless there are indications that sensitivity of species differs between the
two compartments. For organic pesticides and metals, however, data should be
kept separated. In the upcoming revision of the guidance for deriving water
quality standards with the context of the WFD (EU, 2000), this will be changed
and data for pesticides will be pooled as well, unless there is evidence that this
is not justified. Triphenyltin is an organometalloid and a pesticide as well, and
the speciation of the compound may vary among different water types. The
present data, however, do not indicate that there is a consistent difference
between freshwater and marine species with respect to their sensitivity towards
triphenyltin. Therefore, the combined dataset will be used for derivation of risk
limits. This is consistent with the use of combined datasets for derivation of
water quality standards for di- and tributyltin compounds by ICPR and European
Commission, respectively (ICBR, 2009, EC, 2005).
4.3.3
Derivation of the MPCwater
4.3.3.1
Derivation of the MPCwater, eco
In Van Herwijnen et al. (2012), an MPC for fresh surface water of 0.23 ng/L has
been derived on the basis of the HC5 of a Species Sensitivity Distribution (SSD)
with an assessment factor of 10. This MPC is adopted as the MPCfw, eco. For the
saltwater environment the same MPC of 0.23 ng/L has been derived because
three additional taxonomic groups are covered in the dataset. This MPC is
adopted as the MPCsw, eco.
4.3.3.2
Derivation of the MPCwater, secpois
In Van Herwijnen et al. (2012), it is concluded that the risk through secondary
poisoning is covered by the MPCwater, hh food of 1.4 ng/L. Since this value is higher
than the MPCfw, eco and MPCsw, eco, it can be concluded that the risk of secondary
poisoning is covered by the MPCs for direct toxicity.
4.3.3.3
Selection of the MPCwater
Since the risk of secondary poisoning is covered by the MPCs for direct toxicity,
these MPC will set the MPCfw and MPCsw at 0.23 ng/L.
4.3.4
Derivation of the MACwater, eco
In Van Herwijnen et al. (2012), a MACfw, eco and MACsw, eco have been derived by
application of an SSD over the acute toxicity data. An assessment factor of 10
has been applied on the HC5 of 4.7 µg/L and an additional assessment factor for
the saltwater environment is considered not necessary because the chronic data
indicate that marine species are not more sensitive than freshwater species. The
MACfw, eco and MACsw, eco are both 0.47 µg/L, but are considered irrelevant in view
of the large difference with the chronic toxicity data.
4.3.5
Derivation of the SRCwater
4.3.5.1
Derivation of the SRCwater, eco
In Van Herwijnen et al. (2012), the SRCwater, eco is calculated as the HC50 from
the SSD: 0.40 µg/L.
Page 40 of 74
RIVM Report 607711009
4.3.5.2
Derivation of the SRCwater, secpois
For derivation of the SRCwater, secpois the most relevant endpoints are selected and
presented in Table 29. Because for guinea pigs, hamsters, mice, rabbits and rats
more than one study is available, the most appropriate MPCoral for these
organisms was selected. According to the INS-Guidance (section 3.1.4.2,
point 2, last lines), it is recommended in this case ‘to use the most sensitive
endpoint divided by the appropriate assessment factor (i.e. the factor implied by
the study with the longest test duration)’. A full overview is given in Appendix 4.
The MPCoral per species is calculated, applying the appropriate assessment factor
(see Table 29).
Table 29. Toxicity data for birds and mammals
Species
Birds
Bobwhite
quail
Japanese
quail
Mallard Duck
Mammals
guinea pig
hamster
mouse
rabbit
rat
Duration of exposure NOEC
diet
[mg/kg
fd]
AF for
AF for
conversion correction to
to chronic laboratory
feed
MPCoral, mammal Reference
MPCoral, bird
[mg/kg fd]
20/21 weeks
5.2*
1
3
1.7
EC (1996a, 1996b)
6 weeks
2.9
1
3
1.0
Grote et al. (2006)
20 weeks
2.9
1
3
1.0
EC (1996a, 1996b)
90 days
4.8
3
3
0.53
10 days during
gestation
80 weeks
12 days during
gestation
2 years/2 generations
39
3
3
4.3
Verschuuren et al.
(1966)
US EPA (1982)
4.8
3.2
1
3
3
3
1.6
0.36
US EPA (1989)
US EPA (1987d)
4.8
1
3
1.6
US EPA (1989,
1991b, 1987c,
1991a)
* Geometric mean of 9.5 and 2.9 mg/kgdiet of two similar studies.
The geometric mean of the MPCoral values in Table 29 is 1.3 mg/kgfood. With this
value, the BCF of 3500 L/kg and the BMF1 of 3.7, the SRCwater, secpois is
0.10 µg/L.
4.3.5.3
Selection of the SRCwater
The SRCwater is determined by the lowest value; this is the SRCwater, secpois of
0.10 µg/L.
The SRCwater is valid for the fresh- and saltwater environment.
4.4
Risk limits for groundwater
The MPCgw, eco and SRCgw, eco are equal to the MPCfw, eco and SRCfw, eco and are
0.23 ng/L and 0.40 µg/L respectively.
4.5
Risk limits for sediment
In Van Herwijnen et al. (2012), risk limits for sediment have been derived for
triphenyltin. These risk limits are taken over in this report where available.
Page 41 of 74
RIVM Report 607711009
4.5.1
Sediment toxicity data
The sediment toxicity data selected in Van Herwijnen et al. (2012) are given in
Table 30.
Table 30. Triphenyltin: selected sediment toxicity data for ERL derivation for the
triphenyltin ion
Chronic a
Taxonomic group/species
NOEC/EC10
(mg/kgdwt)
Acute a
Taxonomic
group/species
Insecta
Chironomus riparius
Mollusca
Potamopyrgus antipodarum
0.22 x 10⁻³
Ephoron virgo
0.023 c
a
for detailed information see Appendix 2
b
geometric mean of 3.10 mg/kgdwt and 2.49 mg/kgdwt
c
Most sensitive endpoint: survival
4.5.2
L(E)C50
(mg/kgdwt)
2.8 b
Derivation of the MPCsediment
In Van Herwijnen et al. (2012), an MPC for fresh water sediment of 2.2 ng/kgdwt
has been derived on the basis of the chronic NOEC for the mollusc
Potamopyrgus antipodarum and an assessment factor of 100. This MPC is
adopted as the MPCsediment, fw. For the saltwater environment the same MPC of
2.2 ng/kgdwt has been derived because it was concluded that marine species are
not more sensitive to triphenyltin than freshwater species.
4.5.3
Derivation of the SRCsediment, eco
In Van Herwijnen et al. (2012), the SRCsediment, eco was based on the two NOECs
available, which was lower than derived through equilibrium partitioning or than
the only acute value divided by 10. The SRCsediment, eco is 2.2 µg/kgdwt for
standard Dutch sediment with 10% OM and is valid for the marine and the
freshwater environment.
4.6
Risk limits for soil
4.6.1
Soil toxicity data
Selected soil toxicity data are given in Table 31, details on these endpoints are
tabulated in Appendix 3.
Table 31. Triphenyltin: selected soil toxicity data for ERL derivation
Chronic
Taxonomic group
Microbial processes
Acetate mineralization
Annelida
Eisenia andrei
Collembola
Folsomia candida
a
NOEC/EC10
(mg/kgdwt)
910
9.1
Acute
Taxonomic group
Microbial processes
Acetate mineralization
Annelida
Eisenia fetida
L(E)C/50
(mg/kgdwt)
3810
29
37.4 a
Geometric mean of 191.0 mg/kgdwt, 10.5 mg/kgdwt, 56.1 mg/kgdwt and 17.3 mg/kgdwt for
four clones representing the variety of sensitivity in the environment. The values are
expressed for Dutch standard soil.
Page 42 of 74
RIVM Report 607711009
4.6.2
Derivation of the MPCsoil
4.6.2.1
Derivation of the MPCsoil, eco
Chronic soil toxicity data are available for decomposers (acetate mineralization)
and consumers (Eisenia andrei and Folsomia candida). With chronic data
representing two trophic levels, an assessment factor of 50 can be applied to
lowest value of 9.1 mg/kg. This results in an MPCsoil, eco of 0.18 mg/kgdwt for
Dutch standard soil with 10% organic matter.
4.6.2.2
Derivation of MPCsoil, secpois
A BCF has been reported higher than 100 L/kg; therefore, secondary poisoning
is triggered. An MPCsoil, secpois can be calculated from the worst-case MPCoral, min of
0.019 mg/kgfd (Van Herwijnen et al., 2012) with the method as described in
Van Vlaardingen and Verbruggen (2007). A BCF for earthworms is not available
and the use of a QSAR on the basis of the log Kow is considered not appropriate
because of the bioaccumulation characteristics of triphenyltin. Therefore, the use
of the BCF for fish is considered the best alternative. Additional factors for
bioaccumulation are not considered necessary because the BMF2 is set 1 (see
Van Herwijnen et al. (2012)), The log Kow value used was 3.53 and the
log Koc value used was 4.0 as used in (Van Herwijnen et al., 2012). The Henry
value used was 4.3 Pa/m3/mol as the geometric mean of the values for the three
TPT-species. With these values, the calculated MPCsoil, secpois is 4.0 µg/kgdwt for
Dutch standard soil with 10% organic matter.
4.6.2.3
Selection of the MPCsoil
Since the MPCsoil, secpois is lower than the MPCsoil, eco, it will set the MPCsoil:
4.0 µg/kgdwt for Dutch standard soil with 10% organic matter.
4.6.3
Derivation of the SRCsoil
4.6.3.1
Derivation of the SRCsoil, eco
The SRCsoil, eco is calculated as the geometric mean of the chronic toxicity data in
Table 31. The SRCsoil, eco is 68 mg/kgdwt for Dutch standard soil with 10% organic
matter.
4.6.3.2
Derivation of the SRCsoil, secpois
For the SRCeco, oral, the geometric mean of 1.3 mg/kgfood as determined above is
used for calculation of the SRCsoil, secpois. With use of the log Koc value of 4.0 and
the BCF for fish of 3500 L/kg, the calculated SRCsoil, secpois is 0.24 mg/kgdwt for
Dutch standard soil with 10% organic matter.
4.6.3.3
Selection of the SRCsoil
The SRCsoil is set by the lowest value, this is the SRCsoil, secpois of 0.24 mg/kgdwt
for Dutch standard soil with 10% organic matter.
4.6.4
Geometric mean of MPC and SRC
The geometric mean of the MPCsoil and SRCsoil is 31 µg/kgdwt.
Page 43 of 74
RIVM Report 607711009
Page 44 of 74
RIVM Report 607711009
5
Conclusions
In this report, the risk limits Maximum Permissible Concentration for ecosystems
(MPCeco), Maximum Acceptable Concentration (MACeco) and Serious Risk
Concentration for ecosystems (SRCeco) are derived for three organotin
compounds in surface water, groundwater and soil. The MPC values are
considered to be protective for direct toxicity and exposure through secondary
poisoning. The risk for humans consuming fishery product or food from
contaminated soil is not considered in these values. The ERLs that were obtained
are summarised in Table 32.
Table 32. Derived MPCeco, MACeco and SRCeco values for dibutyltin-, tributultinand triphenyltin-cations
Compartiment
Surface water
MPCfw (µg/L)
MPCsw (µg/L)
MACfw, eco (µg/L)
MACsw, eco (µg/L)
SRCwater (µg/L)
Groundwater
MPCgw, eco (µg/L)
SRCgw, eco (µg/L)
Sediment a
MPCsediment, eco (µg/kgdwt)
SRCsediment, eco (µg/kgdwt)
Soil b
MPCsoil (mg/kgdwt)
SRCsoil (mg/kgdwt)
geometric mean of MPCsoil
and SRCsoil (mg/kgdwt)
dibutyltin
tributyltin
triphenyltin
0.15
0.15
0.30
0.15
16
0.2 x 10⁻³
0.2 x 10⁻³
1.5 x 10⁻³
0.2 x 10⁻³
26 x 10-3
0.23 x 10⁻³
0.23 x 10⁻³
0.47
0.47
0.10
0.15
50
0.2 x 10⁻³
46 x 10-3
0.23 x 10⁻³
0.40
0.37 x 10³
123 x 103
0.01 c
27
2.2 x 10⁻³
2.2
0.37
28
3.2
2.3 x 10⁻⁶
52 x 10-3
0.35 x 10⁻³
4.0 x 10⁻³
0.24
0.031
n.d. = not derived
a
Sediment values are expressed for Dutch standard sediment with 10% organic matter.
b
Soil values are expressed for Dutch standard soil with 10% organic matter.
c
This value should be considered as a worst-case estimate.
Page 45 of 74
RIVM Report 607711009
Page 46 of 74
RIVM Report 607711009
Literature
Amorim MJB, Novais S, Römbke J, Soares AMVM. 2008. Enchytraeus albidus
(Enchytraeidae): A test organism in a standardised avoidance test?
Effects of different chemical substances. Environment International. 34:
363-371.
Attahiru US, Iyaniwura TT, Adaudi AO, Bonire JJ. 1991. Subchronic toxicity
studies of tri-N-butyltin and triphenyltin acetates in rats. Veterinary and
Human Toxicology. 33: 499-502.
Bangkedphol S, Keenan HE, Davidson C, Sakultantimetha A, Dyer M, Songsasen
A. 2009. Development and application of an analytical method for the
determination of partition coefficients of tributyltin in the forth and clyde
canal, Glasgow, Scotland. Journal of ASTM International. 6.
Baroncelli S, Karrer D, Turillazzi PG. 1990. Embryotoxic evaluation of bis (tri-nbutyltin)oxide (TBTO) in mice. Toxicology Letters. 50: 257-262.
Berg M, Arnold CG, Muller SR, Mühlemann J, Schwarzenbach RP. 2001. Sorption
and desorption behavior of organotin compounds in sediment-pore water
systems. Environmental Science and Technology. 35: 3151-3157.
Biobyte. 2006. Bio-Loom for Windows (computer program). Version 1.5.
Claremont, USA, Biobyte Corp.
Brand E, Bogte JJ, Baars AJ, Janssen PJCM, Otte PF, Tiesjema G, Van Herwijnen
R, Vlaardingen PLA, Verbruggen EMJ. 2012. Proposed intervention
values for soil and groundwater for the 2nd, 3rd and 4th series of
compounds. Bilthoven: National Institute for Public Health and the
Environment. Report no. 607711006.
Brändli RC, Breedveld GD, Cornelissen G. 2009. Tributyltin sorption to marine
sedimentary black carbon and to amended activated carbon.
Environmental Toxicology and Chemistry. 28: 503-508.
Burton ED, Phillips IR, Hawker DW. 2004. Sorption and desorption behavior of
tributyltin with natural sediments. Environmental Science and
Technology. 38: 6694-6700.
Chen Y, Zuo Z, Chen S, Yan F, Chen Y, Yang Z, Wang C. 2008. Reduction of
spermatogenesis in mice after tributyltin administration. Toxicology.
251: 21-27.
Chernoff N, Woodrow Setzer R, Miller DB, Rosen MB, Rogers JM. 1990. Effects of
chemically induced maternal toxicity on prenatal development in the rat.
Teratology. 42: 651-658.
Coenen TMM, Brouwer A, Enninga IC, Koeman JH. 1992. Subchronic toxicity and
reproduction effects of tri-n-butyl oxide in Japanese quail. Archives of
Environmental Contamination and Toxicology. 23: 457-463.
Cornelis C, Bierkens J, Joris I, Nielsen P, Pensaert S. 2006. Quality criteria for
re-use of organotin-containing sediments on land. Journal of Soils and
Sediments. 6: 156-162.
Crommentuijn T, Stab JA, Doornekamp A, Estoppey O, Van Gestel CAM. 1995.
Comparative ecotoxicity of cadmium, chlorpyrifos and triphenyltin
hydroxide for four clones of the parthenogenetic collembolan Folsomia
candida in an artificial soil. Functional Ecology. 9: 734-742.
Cukrowska EM, Nsengimana H, Tutu H, Chimuka L. 2010. Adsorption and
desorption of tetraalkyllead and dibutyltin compounds on contaminated
soils. Toxicological and Environmental Chemistry. 92: 1613-1626.
Dacasto M, Valenza F, Nebbia C, Re G, Cornaglia E, Soffietti MG. 1994.
Pathological findings in rabbits and sheep following the subacute
Page 47 of 74
RIVM Report 607711009
administration of triphenyltin acetate. Veterinary and Human Toxicology.
36: 300-304.
Dai SG, Sun HW, Wang YQ, Chen WP, Li N. 2002. Sorption Behavior of Butyltin
Compounds in Estuarine Environments of the Haihe River, China. In: Cai
Y, Braids OC (Eds.) ACS Symposium Series. pp. 370-387. Washington,
American Chemical Society.
Delgado Filho VS, Lopes PFI, Podratz PL, Graceli JB. 2011. Triorganotin as a
compound with potential reproductive toxicity in mammals. Brazilian
Journal of Medical and Biological Research. 44: 958-965.
EC. 1996a. Monograph prepared in the context of the inclusion of the following
active substance in Annex I of the Council Directive 91/414/EEC. Active
substance: fentin acetate, Rapporteur Member State: United Kingdom.
Brussels: European Commission - Health & Consumer Protection
Directorate-General.
EC. 1996b. Monograph prepared in the context of the inclusion of the following
active substance in Annex I of the Council Directive 91/414/EEC. Active
substance: fentin hydroxide, Rapporteur Member State: United
Kingdom. Brussels: European Commission - Health & Consumer
Protection Directorate-General.
EC. 2003. Technical Guidance Document on risk assessment in support of
Commission Directive 93/67/EEC on risk assessment for new notified
substances, Commission Regulation (EC) No 1488/94 on risk assessment
for existing substances and Directive 98/8/EC of the European
Parliament and of the Council concerning the placing of biocidal products
on the market. Ispra, Italy: European Commission Joint Research
Centre.
EC. 2005. Common implementation strategy for the Water Framework Directive
- Environmental Quality Satandards (EQS) substance datasheet Tributyltin compounds (TBT-ion). Brussles: European Commission.
Ema M, Fukunishi K, Matsumoto MH, A., Kamata E, Ihara T. 2007.
Developmental toxicity of dibutyltin dichloride in cynomolgus monkeys.
Reproductive Toxicology. 23: 12-19.
Ema M, Miyawaki E. 2001. Roles of progesterone on suppression of uterine
decidualization and implantation failure induced by triphenyltin chloride
in rats. Congenital Anomalies. 41: 106-111.
Ema M, Miyawaki E, Harazono A, Ogawa Y. 1997. Effects of triphenyltin chloride
on implantation and pregnancy in rats. Reproductive Toxicology. 11:
201-206.
Ema M, Miyawaki E, Kawashima K. 1999. Developmental toxicity of triphenyltin
chloride after administration on three consecutive days during
organogenesis in Rats. Bulletin of Environmental Contamination and
Toxicology. 62: 363-370.
EU-ECB. 2000a. IUCLID dataset - bis(tributyltin)oxide. Brussels: European
Chemicals Bureau.
EU-ECB. 2000b. IUCLID dataset - dibutyltin dichloride. Brussels: European
Chemicals Bureau.
EU. 2000. Directive 2000/60/EC of the European Parliament and of the Council
establishing a framework for the Community action in the field of water
policy. In: Union E (Ed.) 2000/60/EC. Brussels.
FH-IME. 2007. Strategie für ein stoffangepasstes Gewässermonitoring Machbarkeitsstudie. Aachen: Fraunhofer-Institut für Molekularbiologie
und Angewandte Oekologie.
Footprint. 2011. Pesticide Properties Database. University of Hertfordshire.
Gaines TB, Kimbrough RD. 1968. Toxicity of fentin hydroxide to rats. Toxicology
and Applied Pharmacology. 12: 397-403.
Page 48 of 74
RIVM Report 607711009
Giavini E, Prati M, Vismara C. 1980. Effects of triphenyltin acetate on pregnancy
in the rat. Bulletin of Environmental Contamination and Toxicology. 24:
936-939.
Grote K, Niemann L, Gericke C, Selzsam B, Chahoud I. 2006. Effects of fentin
hydroxide on reproduction of the Japanese quail (Coturnix coturnix
japonica). Environmental Research. 101: 81-88.
Hillenbrand T, Marscheider-Weidemann F, Strauch M, Heitmann K. 2006.
Prioritare Stoffe der Wasserrahmenrichtlinie - Datenblatt Tributylzinn.
Munich: Fraunhofer.
Hoch M, Alonso-Azcarate J, Lischick M. 2003. Assessment of adsorption behavior
of dibutyltin (DBT) to clay-rich sediments in comparison to the highly
toxic tributyltin (TBT). Environmental Pollution. 123: 217-227.
HSDB. 2005. Hazardous Substances Data Bank (HSDB) - Datasheet on
triphenyltin hydroxide. 2005 ed., National Library of Medicine's
Huang JH, Matzner E. 2004. Adsorption and desorption of organotin compounds
in organic and mineral soils. European Journal of Soil Science. 55: 693698.
Hund-Rinke K, Lindemann M, Simon M. 2005. Experiences with novel
approaches in earthworm testing alternatives. Journal of Soils and
Sediments. 5: 233-239.
Hund-Rinke K, Simon M. 2005. Terrestrial ecotoxicity of eight chemicals in a
systematic approach. Journal of Soils and Sediments. 5: 59-65.
ICBR. 2009. Afleiding van milieukwalitietsnormen voor Rijnrelevante stoffen.
Koblenz: Internationale Commissie ter Bescherming van de Rijn. Report
no. 164.
Inaba K, Shiraishi H, Soma Y. 1995. Effects of salinity, pH and temperature on
aqueous solubility of four organotin compounds. Water Research. 29:
1415-1417.
Jarvinen AW, Tanner DK, Kline ER, Knuth ML. 1988. Acute and chronic toxicity of
triphenyltin hydroxide to fathead minnows (Pimephales promelas)
following brief or continuous exposure. Environmental Pollution. 52:
289-301.
Kumasaka K, Miyazawa M, Fujimaki T, Tao H, Ramaswamy BR, Nakazawa H,
Makino T, Satoh S. 2002. Toxicity of the tributyltin compounds on the
testis in premature mice. Journal of Reproduction and Development. 48:
591-597.
Langston WJ, Pope ND. 1995. Determinants of TBT adsorption and desorption in
estuarine sediments. Marine Pollution Bulletin. 31: 32-43.
Lepper P. 2005. Manual on the Methodological Framework to Derive
Environmental Quality Standards for Priority Substances in accordance
with Article 16 of the Water Framework Directive (2000/60/EC).
Schmallenberg, Germany: Fraunhofer-Institute Molecular Biology and
Applied Ecology.
Mushak P, Krigman MR, Mailman RB. 1982. Comparative organotin toxicity in
the developing rat: somatic and morphological changes and relationship
to accumulation of total tin. Neurobehavioral Toxicology and Teratology.
4: 209-215.
Noda T, Morita S, Yamano T, Shimizu M, Yamada A. 1991. Effects of triphenyltin
acetate on pregnancy in rats by oral administration. Toxicology Letters.
56: 207-212.
Norway. 2008. Proposal for identification of a substance as a PBT substance Bis(tributyltin) oxide. Helsinky: ECHA.
RIVM. 2010. Datasheet on organotin compounds. Biltoven: RIVM.
Römbke J, Jänsch S, Junker T, Pohl B, Scheffczyk A, Schallnaß HJ. 2007. The
effect of tributyltin-oxide on earthworms, springtails, and plants in
Page 49 of 74
RIVM Report 607711009
artificial and natural soils. Archives of Environmental Contamination and
Toxicology. 52: 525-534.
Rossel D, Tarradellas J. 1991. Dehydrogenase activity of soil microflora:
Significance in ecotoxicological tests. Environmental Toxicology and
Water Quality. 6: 17-33.
RPA. 2005. Risk assessment studies on targeted consumer applications of
certain organotin compounds. Loddon, Norfolk, UK: Risk & Policy
Analysts Limited.
Sarpa M, De-Carvalho RR, Delgado IF, Paumgartten FJR. 2007. Developmental
toxicity of triphenyltin hydroxide in mice. Regulatory Toxicology and
Pharmacology. 49: 43-52.
Snoeij NJ, Van Iersel AAJ, Penninks AH, Seinen W. 1985. Toxicity of triorganotin
compounds: Comparative in vivo studies with a series of trialkyltin
compounds and triphenyltin chloride in male rats. Toxicology and
Applied Pharmacology. 81: 274-286.
SRC. 2011. Interactive PhysProp Database. SRC.
Stang PM, Seligman PF. 1987. In situ adsorption and desorption of butyltin
compounds from Pearl Harbor, Hawaii sediment. Oceans 87 - The Ocean,
An International Workplace. Halifax, Canada.
Sun H, Huang G, Dai S. 1996. Adsorption behaviour and QSPR studies of
organotin compounds on estuarine sediment. Chemosphere. 33: 831838.
Tomlin CDS (Ed.) 2002. The e-pesticide manual, Alton, UK, British crop
protection council.
Trott D, Dawson JJC, Killham KS, Miah MRU, Wilson MJ, Paton GI. 2007.
Comparative evaluation of a bioluminescent bacterial assay in terrestrial
ecotoxicity testing. Journal of Environmental Monitoring. 9: 44-50.
Unger MA, MacIntyre WG, Huggett RJ. 1987. Equilibrium sorption of tributyltin
chloride by chesapeake bay sediments.
US EPA. 1982. Teratogenic evaluation of triphenyltin. Washington: United States
Environmental Protection Agency. Report no. CSR-PC-083601-006.
US EPA. 1985. Review of rat teratology study with triphenyltin hydroxide.
Washington: United States Environmental Protection Agency. Report no.
CSR-PC-083601-014.
US EPA. 1986. Review of rat and mouse subchronic feeding studies with
triphenyltin hydroxide. Washington: United States Environmental
Protection Agency. Report no. CSR-PC-083601-041.
US EPA. 1987a. EEB review of mallard dietary study. Washington: United States
Environmental Protection Agency. Report no. CSR-PC-083601-067.
US EPA. 1987b. Triphenyltin hydroxide: Review of a dog chronic feeding study.
Washington: United States Environmental Protection Agency. Report no.
CSR-PC-083601-060.
US EPA. 1987c. Triphenyltin hydroxide: Review of a two generation reproduction
study in rats. Washington: United States Environmental Protection
Agency. Report no. CSR-PC-083601-048.
US EPA. 1987d. Triphenyltin hydroxide: Review of pilot and definitive rabbit
teratology studies. Washington: United States Environmental Protection
Agency. Report no. CSR-PC-083601-053.
US EPA. 1989. Triphenyltin hydroxide: Review of rat chronic
feeding/oncogenicity and mouse oncogenicity studies. Washington:
United States Environmental Protection Agency. Report no. CSR-PC083601-078.
US EPA. 1991a. Peer review of triphenyltin hydroxide (TPTH). Washington:
United States Environmental Protection Agency. Report no. CSR-PC083601-080.
Page 50 of 74
RIVM Report 607711009
US EPA. 1991b. Triphenyltin hydroxide: Request for an updated DER for the rat
two-year chronic feeding study. Washington: United States
Environmental Protection Agency. Report no. CSR-PC-083601-082.
US EPA. 2004. Triphenyltin hydroxide. Review of a subchronic neurtoxicity
study. Washington: United States Environmental Protection Agency.
Report no. CSR-PC-083601_18-jun-04_a.
US EPA. 2005. Triphenyltin hydroxide. Review of the developmental
neurotoxicity study. Washington: United States Environmental Protection
Agency. Report no. CSR-PC-083601_3-Oct-05_a.
US EPA. 2009. EPI Suite (computer program). Version 4.0. Washington, DC,
U.S. Environmental Protection Agency (EPA) Office of Pollution
Prevention Toxics and Syracuse Research Company (SRC).
Van Beelen P, Fleuren-Kemila AK. 1993. Toxic effects of pentachlorophenol and
other pollutants on the mineralization of acetate in several soils.
Ecotoxicology and Environmental Safety. 26: 10-17.
Van Gestel CAM, Dirven-Van Breemen EM, Baerselman R, Emans HJB, Janssen
JAM, Postuma R, Van Vliet PJM. 1992. Comparison of sublethal and
lethal criteria for nine different chemicals in standardized toxicity tests
using the earthworm Eisenia andrei. Ecotoxicology and Environmental
Safety. 23: 206-220.
Van Herwijnen R, Moermond CTA, Van Vlaardingen PLA, De Jong FMW,
Verbruggen EMJ. 2012. Environmental risk limits for triphenyltin in
water. Bilthoven: RIVM. Report no. 601714018.
Van Vlaardingen P, Traas TP, Wintersen AM, Aldenberg T. 2004. EtX 2.0. A
program to calculate hazardous concentrations and fraction affected,
based on normally distributed toxicity data. Bilthoven, The Netherlands:
National Institute for Public Health and the Environment. Report no.
601501028.
Van Vlaardingen PLA, Verbruggen EMJ. 2007. Guidance for the derivation of
environmental risk limits within the framework of "International and
national environmental quality standards for substances in the
Netherlands" (INS). Bilthoven: RIVM. Report no. 601782001.
Verschuuren HG, Kroes R, Vink HH, Van Esch GJ. 1966. Short-trm toxicity
studies with triphenyltin compounds in rats and guinea-pigs. Food and
Cosmetics Toxicology. 4: 35-45.
Visser JT, Linders JBHJ. 1992. Fentin acetate. Bilthoven: RIVM. Report no.
92/670104/006.
Vogue PA, Kerle EA, Jenkins JJ. 1994. OSU Extension Pesticide Properties
Database. Corvallis, USA: National Pesticide Information Center.
Vos JG, Van Logten MJ, Kreeftenberg JG, Kruizinga W. 1984. Effect of
triphenyltin hydroxide on the immune system of the rat. Toxicology. 29:
325-336.
WHO. 1999. Concise international chemical assessment document 13 Triphenyltin compounds. Geneva: World Health Organization.
Winek CL, Marks Jr MJ, Shanor SP, Davis ER. 1978. Acute and subacute
toxicology and safety evaluation of triphenyl tin hydroxide (Vancide KS).
Clinical Toxicology. 13: 281-296.
Yan F, Chen Y, Zuo Z, Chen Y, Yang Z, Wang C. 2009. Effects of tributyltin on
epididymal function and sperm maturation in mice. Environmental
Toxicology and Pharmacology. 28: 19-24.
Yousef MI, Kamel KI, Hassan MS, El-Morsy AMA. 2010. Protective role of
propolis against reproductive toxicity of triphenyltin in male rabbits.
Food and Chemical Toxicology. 48: 1846-1852.
Page 51 of 74
RIVM Report 607711009
Zsombok A, Holnár L, Fischer E. 1997. Neurotoxicity of paraquat and triphenyltin
in the earthworm, Eisenia fetida sav. A histo- and cytopathological
study. Acta Biologica Hungarica. 48: 485-495.
Page 52 of 74
RIVM Report 607711009
List of abbreviations
ADI
BCF
ECx
EQS
ERL
INS
LC50
MACeco
MACfw, eco
MACsw, eco
Marine
species
MPC
MPCeco
MPCfw
MPCsw
MPCfw, eco
MPCsw, eco
MPCfw, secpois
MPCsw, secpois
NOEC
NOAEL
SRCeco
SRCfw, eco
SRCsw, eco
TDI
TGD
WFD
Acceptable Daily Intake
Bioconcentration Factor
Concentration at which x% effect is observed
Environmental Quality Standard
Environmental Risk Limit
International and National Environmental Quality Standards for
Substances in the Netherlands
Concentration at which 50% mortality is observed
Maximum Acceptable Concentration for ecosystems
Maximum Acceptable Concentration for ecosystems in freshwater
Maximum Acceptable Concentration for ecosystems in the
saltwater compartment
Species that are representative for marine and brackish water
environments and that are tested in water with salinity > 0.5‰.
Maximum Permissible Concentration
Maximum Permissible Concentration for ecosystems (based on
ecotoxicological data)
Maximum Permissible Concentration in freshwater
Maximum Permissible Concentration in the saltwater
compartment
Maximum Permissible Concentration in freshwater based on
ecotoxicological data
Maximum Permissible Concentration in the saltwater
compartment based on ecotoxicological data
Maximum Permissible Concentration in freshwater based on
secondary poisoning
Maximum Permissible Concentration in the saltwater
compartment based on secondary poisoning
No Observed Effect Concentration
No Observed Adverse Effect Level
Serious Risk Concentration for ecosystems
Serious risk concentration for freshwater ecosystems
Serious risk concentration for saltwater ecosystems
Tolerable Daily Intake
Technical Guidance Document
Water Framework Directive (2000/60/EC)
Page 53 of 74
RIVM Report 607711009
Page 54 of 74
RIVM Report 607711009
Appendix 1. Data on Koc studies
Log Koc
5.29
5.37
4.88
5.47
5.78
5.51
4.73
3.39
3.73
3.21
3.59
5.09
5.20
4.08
5.36
4.78
Table A1.1. Brief summaries of available Koc studies for dibutyltin
brief summary
Determined from desorption from a natively contaminated freshwater sediment
using a sediment:water ratio of 1:2000 and an equilibrium time of 72 h at pH 7.4;
analysis in water and sediment. Log Kd = 4.05, %oc = 5.8.
Determined from desorption from a natively contaminated marine sediment using a
high sediment:water ratio of 1:2000 and an equilibrium time of 72 h at pH 7.4;
analysis in water and sediment. Log Kd = 3.95, %oc = 3.7.
Determined from desorption from a natively contaminated marine sediment using a
high sediment:water ratio of 1:2000 and an equilibrium time of 72 h at pH 7.4;
analysis in water and sediment. Log Kd = 3.38, %oc = 3.2.
Calculated from in situ distribution (porewater) in natively contaminated freshwater
sediment, pH 7.3; analysis in water and sediment. Log Kd = 4.11, %oc = 4.4.
Calculated from in situ distribution (porewater) in natively contaminated freshwater
sediment; pH 7.3; analysis in water and sediment. Log Kd = 4.44, %oc = 4.6.
Determined from desorption from a natively contaminated marine sediment using a
sediment:water ratio of 1:18 (based on wet weight sediment) and an equilibrium
time of 42 days + 1 day for settling before analysis; pH 7.7; analysis in water and
sediment. Log Kd = 4.07, %oc = 3.7.
Geometric mean of Koc based on desorption for six treated contaminated sediments
obtained using a sediment:water ratio of 1:2 and an equilibrium time of 6 h;
analysis in water only; pH unknown. Considered unreliable because of the short
equilibrium time and lack of analysis in sediment
Value from test with soil, determined with data from graph with Freundlich sorption
curve; soil:water ratio of 1:50; pH 6.32; equilibrium time of 24 h; analysis in water
only. % sorbed 86%; %oc = 6.56; log Kf = 2.21 and 1/n = 1.2. Considered
unreliable because 1/n > 1.1.
Value from test with soil, determined with data from graph with Freundlich sorption
curve; soil:water ratio of 1:50; pH 6.52; equilibrium time of 24 h; analysis in water
only. % sorbed 83%; %oc = 3.79; log Kf = 2.31 and 1/n = 1.05.
Value from test with soil, determined with data from graph with Freundlich sorption
curve; soil:water ratio of 1:50; pH 6.92; equilibrium time of 24 h; analysis in water
only. % sorbed 47%; %oc = 2.81, log Kf = 1.66 and 1/n = 0.90.
Value from test with soil, determined with data from graph with Freundlich sorption
curve; soil:water ratio of 1:50; pH 6.68; equilibrium time of 24 h; analysis in water
only. % sorbed 38%; %oc = 1.89, log Kf = 1.86 and 1/n = 0.89.
Value based on Kf for Freundlich sorption on marine sediment; sediment:water
ratio of 1:50; equilibrium time of 24 h; pH 7.57; analysis in water and sediment.
%oc = 1.23; log Kf = 3.18 and 1/n = 0.98.
Experiment performed with sediment and artificial seawater with salinity of 32‰
and pH 8; sediment:water ratio of 1:50; equilibrium time of 24 h; analysis in water
only. Fraction sorbed 47%. Calculated from data in graph using Freundlich;
%oc = 0.06; log Kf = 1.98 and 1/n = 0.857. The fraction of oc in the soil is
considered too low to determine a reliable Koc.
Experiment performed with sediment and artificial seawater with salinity of 32‰
and pH 8; sediment:water ratio of 1:50; equilibrium time of 24 h; analysis in water
only. Fraction sorbed 39%. Calculated from data in graph using Freundlich;
%oc = 0.25; log Kf = 1.48 and 1/n = 1.01.
Experiment performed with sediment and artificial seawater with salinity of 32‰
and pH 8; sediment:water ratio of 1:50; equilibrium time of 24 h; analysis in water
only. Fraction sorbed 37%. Calculated from data in graph using Freundlich;
%oc = 0.16, log Kf = 2.57 and 1/n = 0.532. Considered unreliable because
1/n < 0.7
Experiment performed with sediment and artificial seawater with salinity of 32‰
and pH 8; sediment:water ratio of 1:50; equilibrium time of 24 h; analysis in water
only. Fraction sorbed 20%. Calculated from data in graph using Freundlich;
%oc = 0.06; log Kf = 1.56 and 1/n = 0.816. The fraction of oc in the soil is
considered too low to determine a reliable Koc.
Ri
2
ref
Berg et al.
(2001)
2
Berg et al.
(2001)
2
Berg et al.
(2001)
2
Berg et al.
(2001)
Berg et al.
(2001)
Brändli et al.
(2009)
2
2
3
Cornelis et
al. (2006)
3
Cukrowska
et al. (2010)
2
Cukrowska
et al. (2010)
2
Cukrowska
et al. (2010)
2
Cukrowska
et al. (2010)
2
Dai et al.
(2002)
3
Hoch et al.
(2003)
2
Hoch et al.
(2003)
3
Hoch et al.
(2003)
3
Hoch et al.
(2003)
Page 55 of 74
RIVM Report 607711009
Log Koc
4.31
4.10
3.54
4.74
3.4
brief summary
Experiment performed with soil with pH 4.7; soil:water ratio of 1:50; equilibrium
time of 24 h; analysis of water only. Fraction sorbed 99.8%. Calculated from data
in graph using Freundlich; %oc = 44.3, log Kf = 3.96 and 1/n = 3.96. Considered
unreliable because of 1/n > 1.1 and fraction sorbed very high while no analysis of
solid phase
Experiment performed with soil with pH 5.5; soil:water ratio of 1:50; equilibrium
time of 24 h; analysis of water only. Fraction sorbed 92.7%. Calculated from data
in graph using Freundlich; %oc = 1.55, log Kf = 2.29 and 1/n = 2.30. Considered
unreliable because of 1/n > 1.1
Experiment performed with soil with pH 3.8+ soil:water ratio of 1:50+ equilibrium
time of 24 h+ analysis of water only. Fraction sorbed 98.0%. Calculated from data
in graph using Freundlich, %oc = 31.4, log Kf = 3.04 and 1/n = 0.887. Considered
unreliable because fraction sorbed very high while no analysis of solid phase
Experiment performed with soil with pH 3.9+ soil:water ratio of 1:50 equilibrium
time of 24 h; analysis of water only. Fraction sorbed 98.0%. Calculated from data
in graph using Freundlich; %oc = 4.82, log Kf = 3.42 and 1/n = 1.01. Considered
unreliable because fraction sorbed very high while no analysis of solid phase
In situ determination of distribution in natively contaminated marine harbour
sediment; analysis in water and sediment; no details on sediment reported and
%oc unknown. Reported log Kd values range from 3.8 to 4.4 for two locations and
two timepoints.
Experiment performed with sediment and artificial seawater with salinity of 15‰
and pH 8.0; sediment:water ratio of 1:45; equilibrium time of 18-24 h; analysis in
water only. Fraction sorbed 32%. %oc = 0.84; log Kf = 1.33 and 1/n = 0.969.
Page 56 of 74
Ri
3
ref
Huang and
Matzner
(2004)
3
Huang and
Matzner
(2004)
3
Huang and
Matzner
(2004)
3
Huang and
Matzner
(2004)
4
Stang and
Seligman
(1987)
2
Sun et al.
(1996)
RIVM Report 607711009
Table A1-2. Koc values for tributyltin from public literature
Log Koc
4.6
species
TBTCl
4.2
TBTCl
5.5
?
5.1
?
4.5
TBTCl
4.1
TBTCl
3.8
TBTCl
3.2
TBTCl
4.7
TBTCl
4.7
TBTCl
4.9
TBTCl
5.0
TBTCl
5.0
TBTCl
4.3
TBTCl
5.0
TBTCl
4.4
TBTCl
brief summary
Determined on sediment from potentially polluted area according to ASTM
method. Kd determined from intercept of the adsorption isotherm based on the
Freundlich equation. Standard Freundlich parameters (Kf and 1/n) not reported.
Equilibrium time 12 h. Equilibrium time shown to be suitable with initial test.
Log Kd 3.63; %oc = 12.1.
Determined on sediment from potentially polluted area according to ASTM
method. Kd determined from intercept of the adsorption isotherm based on the
Freundlich equation. Standard Freundlich parameters (Kf and 1/n) not reported.
Equilibrium time 12 h. Equilibrium time shown to be suitable with initial test.
Log Kd 3.48; %oc = 17.42.
Determined from desorption from a natively contaminated marine sediment using
a sediment:water ratio of 1:18 (based on wet weight sediment) and an
equilibrium time of 42 days + 1 day for settling before analysis; pH 7.7; analysis
in water and sediment. Log Kd = 4.07 %oc = 3.7.
Determined on marine sediment using a sediment:water ratio of 1:25 and an
equilibrium time of 42 days + 1 day for settling before analysis; pH7.7 analysis
in water and sediment. Log Kd = 3.35; %oc = 1.98.
Determined on natural pristine sediment with varying salinity (5 and 30‰) and
pH (4, 6 and 8) of the water; the reported values are the geometric mean for six
scenarios; sediment:water ratio = 1:10; equilibrium time 24 h at 20°C;
%oc: 4.8; analysis of water only; considered unreliable because of high fraction
sorbed in most cases and lack of analysis in sediment; log Kd = 3.19.
Determined on natural pristine sediment with varying salinity (5 and 30‰) and
pH (4, 6 and 8) of the water; the reported values are the geometric mean for six
scenarios; sediment:water ratio = 1:10; equilibrium time 24 h at 20°C;
%oc: 2.6; analysis of water only; log Kd = 2.48.
Determined on natural pristine sediment with varying salinity (5 and 30‰) and
pH (4, 6 and 8) of the water; the reported values are the geometric mean for six
scenarios; sediment:water ratio = 1:10; equilibrium time 24 h at 20°C;
%oc: 0.2; analysis of water only; log Kd = 1.09.
Determined on natural pristine sediment with varying salinity (5 and 30‰) and
pH (4, 6 and 8) of the water; the reported values are the geometric mean for six
scenarios; sediment:water ratio = 1:10; equilibrium time 24 h at 20°C;
%oc: 2.2; analysis of water only; log Kd = 1.56.
Geometric mean of Koc based on desorption for six treated contaminated
sediments obtained using a sediment:water ratio of 1:2 and an equilibrium time
of 6 h; analysis in water only; pH unknown. Considered unreliable because of the
short equilibrium time and lack of analysis in sediment
Value based on Kf for Freundlich sorption on marine sediment; sediment:water
ratio of 1:50; equilibrium time of 24 h; pH 7.57; analysis in water and sediment;
%oc = 1.23; log Kf = 2.76 and 1/n = 0.90.
Value based on Kf for Freundlich sorption on marine sediment; geometric mean
for two different water phases tested (salinity/pH: 22.6‰/7.24 and
30.8‰/7.57); sediment:water ratio of 1:50; equilibrium time of 24 h; analysis in
water and sediment; %oc = 2.54; log Kf = 3.29 and 1/n = 0.92 for both tests.
Value based on Kf for Freundlich sorption on marine sediment; geometric mean
for two different water phases tested(salinity/pH: 3.0‰/6.58 and 30.8‰/7.57);
sediment:water ratio of 1:50; equilibrium time of 24 h; analysis in water and
sediment; %oc = 2.62; log Kf = 3.37 and 1/n = 0.90 for both tests.
Experiment performed with sediment and artificial seawater with salinity of 32‰
and pH 8; sediment:water ratio of 1:50; equilibrium time of 24 h; analysis in
water only; fraction sorbed 60%. %oc = 0.06; log Kd = 1.80. The fraction of OC
in the soil is considered too low to determine a reliable Koc.
Experiment performed with sediment and artificial seawater with salinity of 32‰
and pH 8; sediment:water ratio of 1:50; equilibrium time of 24 h; analysis in
water only; fraction sorbed 36%. %oc = 0.16; log Kd = 1.46.
Experiment performed with sediment and artificial seawater with salinity of 32‰
and pH 8; sediment:water ratio of 1:50; equilibrium time of 24 h; analysis in
water only; fraction sorbed 59%. %oc = 0.06; log Kd = 1.77. The fraction of OC
in the soil is considered too low to determine a reliable Koc.
Experiment performed with sediment and artificial seawater with salinity of 32‰
and pH 8; sediment:water ratio of 1:50; equilibrium time of 24 h; analysis in
water only fraction sorbed 63%. %oc = 0.25; log Kd = 1.85.
Ri
2
ref
Bangkedphol
et al. (2009)
2
Bangkedphol
et al. (2009)
2
Brandli et al
(2009)
2
Brandli et al
(2009)
3
Burton et al.
(2004)
2
Burton et al.
(2004)
2
Burton et al.
(2004)
2
Burton et al.
(2004)
3
Cornelis et al.
(2006)
2
Dai et al.
(2002)
2
Dai et al.
(2002)
2
Dai et al.
(2002)
3
Hoch et al.
(2003)
2
Hoch et al.
(2003)
3
Hoch et al.
(2003)
2
Hoch et al.
(2003)
Page 57 of 74
RIVM Report 607711009
Log Koc
4.5
species
?
4.3
?
4.4
?
3.1
?
4.2
TBTCl
4.0
TBTCl
4.1
TBTCl
4.4
TBTCl
5.0
TBTCl
4.6
TBTCl
4.6
TBTCl
4.5
TBTCl
4.5
TBTCl
4.5
TBTCl
5.0
TBTCl
4.2
TBTCl
brief summary
Experiment performed with soil with pH 4.7; soil:water ratio of 1:50; equilibrium
time of 24 h; analysis of water only; fraction sorbed 99.6%. %oc = 44.3;
log Kd = 4.18. Considered unreliable because fraction sorbed very high while no
analysis of solid phase
Experiment performed with soil with pH 3.7; soil:water ratio of 1:50; equilibrium
time of 24 h; analysis of water only; fraction sorbed 99.1%. %oc = 31.4;
log Kd = 3.75. Considered unreliable because fraction sorbed very high while no
analysis of solid phase
Experiment performed with soil with pH 3.9; soil:water ratio of 1:50; equilibrium
time of 24 h; analysis of water only; fraction sorbed 96.5%. %oc = 4.82;
log Kd = 3.12. Considered unreliable because fraction sorbed very high while no
analysis of solid phase
Experiment performed with soil with pH 5.50; soil:water ratio of 1:50;
equilibrium time of 24 h; analysis of water only; fraction sorbed 37.2%.
%oc = 1.55; log Kd = 1.33.
Experiment performed with marine sediment, natural filtered seawater and 14C
labelled TBT; sediment:water ratio 1:500;equilibrium time 24 h; analysis in both
water and sediment; log Kd = 4.09; OC = 6.9%; Koc recalculated from Kd and
fraction OC
Experiment performed with marine sediment, natural filtered seawater and 14C
labelled TBT; sediment:water ratio 1:500;equilibrium time 24 h; analysis in both
water and sediment; log Kd = 3.42; OC = 4.0%; Koc recalculated from Kd and
fraction OC
Experiment performed with marine sediment, natural filtered seawater and 14C
labelled TBT; sediment:water ratio 1:500;equilibrium time 24 h; analysis in both
water and sediment; log Kd = 3.92; OC = 6.2%; Koc recalculated from Kd and
fraction OC
Experiment performed with marine sediment, natural filtered seawater and 14C
labelled TBT; sediment:water ratio 1:500;equilibrium time 24 h; analysis in both
water and sediment; log Kd = 2.39; OC = 0.8%; Koc recalculated from Kd and
fraction OC
Experiment performed with marine sediment, natural filtered seawater and 14C
labelled TBT; sediment:water ratio 1:500;equilibrium time 24 h; analysis in both
water and sediment; log Kd = 3.91; OC = 2.2%; Koc recalculated from Kd and
fraction OC
Experiment performed with marine sediment, natural filtered seawater and 14C
labelled TBT; sediment:water ratio 1:500;equilibrium time 24 h; analysis in both
water and sediment; log Kd = 3.92; OC = 3.5%; Koc recalculated from Kd and
fraction OC
Experiment performed with marine sediment, natural filtered seawater and 14C
labelled TBT; sediment:water ratio 1:500;equilibrium time 24 h; analysis in both
water and sediment; log Kd = 4.22; OC = 4.7%; Koc recalculated from Kd and
fraction OC
Experiment performed with marine sediment, natural filtered seawater and 14C
labelled TBT; sediment:water ratio 1:500;equilibrium time 24 h; analysis in both
water and sediment; log Kd = 4.25; OC = 5.8%; Koc recalculated from Kd and
fraction OC
Experiment performed with marine sediment, natural filtered seawater and 14C
labelled TBT; sediment:water ratio 1:500;equilibrium time 24 h; analysis in both
water and sediment; log Kd = 4.23; OC = 5.5%; Koc recalculated from Kd and
fraction OC
Experiment performed with marine sediment, natural filtered seawater and 14C
labelled TBT; sediment:water ratio 1:500;equilibrium time 24 h; analysis in both
water and sediment; log Kd = 4.07; OC = 4.6%; Koc recalculated from Kd and
fraction OC
Experiment performed with marine sediment, natural filtered seawater and 14C
labelled TBT; sediment:water ratio 1:500;equilibrium time 24 h; analysis in both
water and sediment; log Kd = 4.03; OC = 2.6%; Koc recalculated from Kd and
fraction OC
Experiment performed with marine sediment, natural filtered seawater and 14C
labelled TBT; sediment:water ratio 1:500;equilibrium time 24 h; analysis in both
water and sediment; log Kd = 3.95; OC = 5.9%; Koc recalculated from Kd and
fraction OC
Page 58 of 74
Ri
3
ref
Huang and
Matzner
(2004)
3
Huang and
Matzner
(2004)
3
Huang and
Matzner
(2004)
2
Huang and
Matzner
(2004)
Langston and
Pope (1995)
2
2
Langston and
Pope (1995)
2
Langston and
Pope (1995)
2
Langston and
Pope (1995)
2
Langston and
Pope (1995)
2
Langston and
Pope (1995)
2
Langston and
Pope (1995)
2
Langston and
Pope (1995)
2
Langston and
Pope (1995)
2
Langston and
Pope (1995)
2
Langston and
Pope (1995)
2
Langston and
Pope (1995)
RIVM Report 607711009
Log Koc
4.9
species
TBTCl
4.7
TBTCl
4.6
TBTCl
4.7
TBTCl
3.2
TBTCl
5.3
TBTCl
4.7
TBTCl
5.3
TBTCl
4.1
TBTCl
brief summary
Experiment performed with marine sediment, natural filtered seawater and 14C
labelled TBT; sediment:water ratio 1:500;equilibrium time 24 h; analysis in both
water and sediment; log Kd = 3.71; OC = 2.0%; Koc recalculated from Kd and
fraction OC
Experiment performed with marine sediment, natural filtered seawater and 14C
labelled TBT; sediment:water ratio 1:500;equilibrium time 24 h; analysis in both
water and sediment; log Kd = 4.39; OC = 5.2%; Koc recalculated from Kd and
fraction OC
Experiment performed with marine sediment, natural filtered seawater and 14C
labelled TBT; sediment:water ratio 1:500;equilibrium time 24 h; analysis in both
water and sediment; log Kd = 4.23; OC = 5.2%; Koc recalculated from Kd and
fraction OC
Experiment performed with marine sediment, natural filtered seawater and 14C
labelled TBT; sediment:water ratio 1:500;equilibrium time 24 h; analysis in both
water and sediment; log Kd = 4.30; OC = 4.8%; Koc recalculated from Kd and
fraction OC
Experiment performed with sediment and artificial seawater with salinity of 15‰
and pH 8.0; sediment:water ratio of 1:45; equilibrium time of 18-24 h; analysis
in water only. %oc = 0.84; log Kf = 1.07 and 1/n = 0.359; study considered
unreliable becauseof low 1/n.
Experiment performed with sediment and artificial seawater; sediment:water
ratio 1:33 and 1:333; equilibrium time of 24 h; analysis in water only.
%oc = 4.2; log Kd = 3.91.
Experiment performed with sediment and artificial seawater; sediment:water
ratio 1:33 and 1:333; equilibrium time of 24 h; analysis in water only.
%oc = 2.9; log Kd = 3.11.
Experiment performed with sediment and artificial seawater; sediment:water
ratio 1:33 and 1:333; equilibrium time of 24 h; analysis in water only.
%oc = 0.34; log Kd = 2.78.
Experiment performed with sediment and artificial seawater; sediment:water
ratio 1:33 and 1:333; equilibrium time of 24 h; analysis in water only.
%oc = 0.90; log Kd = 2.04.
Ri
2
ref
Langston and
Pope (1995)
2
Langston and
Pope (1995)
2
Langston and
Pope (1995)
2
Langston and
Pope (1995)
2
Sun et al.
(1996)
2
Unger et al.
(1987)
3
Unger et al.
(1987)
3
Unger et al.
(1987)
2
Unger et al.
(1987)
Page 59 of 74
RIVM Report 607711009
Page 60 of 74
RIVM Report 607711009
Appendix 2. Detailed soil toxicity data for tributyltin
Table A2.1. Acute toxicity of tributyltin (and tributyltin-oxide) for soil organisms
Species
Species
Soil type
properties
A Test
Purity pH o.m. Clay T
comp.
(age, sex)
[%]
Macrophyta
Avena sativa
Avena sativa
Avena sativa
Brassica rapa
Brassica rapa
Brassica rapa
sandy soil
silty soil
loamy soil
sandy soil
silty soil
loamy soil
Y
Y
Y
Y
Y
Y
Annelida
Enchytraeus albidus
Eisenia fetida
Eisenia fetida
sandy loam
sandy soil
loamy soil
N TBT-O 97.8
N TBT-Cl
N TBT-Cl
TBT-Cl
TBT-Cl
TBT-Cl
TBT-Cl
TBT-Cl
TBT-Cl
Exp. Crit.
time
Test
Result test
endpoint soil
Result test
soil TBTion
[mg/kgdwt] [mg/kgdwt]
8.2
14.6
31.5
8.2
14.6
31.5
14
14
14
14
14
14
biomass
biomass
biomass
biomass
biomass
biomass
452
553
687
25
16
39
6
20
3.6
20
31.5 20
48 h
48 h
48 h
EC50 avoidance 95
EC50 avoidance
EC50 avoidance
2.3
2.6
[%] [%] [°C]
5.8
6.1
5.4
5.8
6.1
5.4
3.9
2.9
5.6
3.9
2.9
5.6
5.5 3.9
5.5 1.7
5.4 5.6
d
d
d
d
d
d
EC50
EC50
EC50
EC50
EC50
EC50
Result
stand. soil
Result
stand. soil
TBT-ion
[mg/kgdwt] [mg/kgdwt]
Ri Notes Reference
1159
1907
1227
64
55
70
2
2
2
2
2
2
1
1
1
1
1
1
Hund-Rinke
Hund-Rinke
Hund-Rinke
Hund-Rinke
Hund-Rinke
Hund-Rinke
13.5
4.6
3
2
2
2
3
3
Amorim et al. (2008)
Hund-Rinke et al. (2005)
Hund-Rinke et al. (2005)
244
Notes
1
Test performed according to ISO guidelines; organic matter content calculated from reported organic carbon content; 14-d aging period at 4°C after
contamination; measured concentrations within 25% of nominal; endpoint based on nominal concentrations; endpoint expressed as TBT-ion confirmed by author.
2
Estimated value, no dose-response pattern, no significant difference from control.
3
Endpoint expressed as TBT-ion confirmed by author.
Page 61 of 74
and
and
and
and
and
and
Simon
Simon
Simon
Simon
Simon
Simon
(2005)
(2005)
(2005)
(2005)
(2005)
(2005)
RIVM Report 607711009
Table A2.2. Chronic toxicity of tributyltin (and tributyltin-oxide) for soil organisms
Species
Species
properties
Soil type
A Test
Purity pH
comp.
(age, sex)
Bacteria
Escherichia coli
Pseudomonas
fluorescens
Vibrio fischeri
[%]
o.m. Clay T
Exp.
time
Crit.
Test
endpoint
[%] [%] [°C]
Result test
soil
Result test Result
soil TBTstand. soil
ion
[mg/kgdwt] [mg/kgdwt] [mg/kgdwt]
Result
Ri Notes Reference
stand. soil
TBT-ion
[mg/kgdwt]
sandy loam
sandy loam
Y TBT
Y TBT
6.32 3.8
6.32 3.8
11.5 25
11.5 25
15 min
15 min
EC20
EC20
luminescence 11.2
luminescence 21.5
29.5
56.6
3
3
1
1
Trott et al. (2007)
Trott et al. (2007)
sandy loam
Y TBT
6.32 3.8
11.5 22
10 min
EC20
luminescence 9.41
24.8
3
1
Trott et al. (2007)
OECD
OECD
OECD
silty clay loam
silty clay loam
silty clay loam
loamy sand
loamy sand
loamy sand
silt loam
silt loam
silt loam
Loam
Loam
loam
silt loam
silt loam
silt loam
silt loam
silt loam
silt loam
sandy loam
sandy loam
sandy loam
N
N
N
N
N
N
N
N
N
N
N
N
N
N
N
N
N
N
N
N
N
N
N
N
TBT-O
TBT-O
TBT-O
TBT-O
TBT-O
TBT-O
TBT-O
TBT-O
TBT-O
TBT-O
TBT-O
TBT-O
TBT-O
TBT-O
TBT-O
TBT-O
TBT-O
TBT-O
TBT-O
TBT-O
TBT-O
TBT-O
TBT-O
TBT-O
6
6
6
4.9
4.9
4.9
5.5
5.5
5.5
5.2
5.2
5.2
5.8
5.8
5.8
7.4
7.4
7.4
6.6
6.6
6.6
6.1
6.1
6.1
8
8
8
4
4
4
1.6
1.6
1.6
4.5
4.5
4.5
5.7
5.7
5.7
3.8
3.8
3.8
2.8
2.8
2.8
4.6
4.6
4.6
8
8
8
29.7
29.7
29.7
3.82
3.82
3.82
24.9
24.9
24.9
25.9
25.9
25.9
22.5
22.5
22.5
15
15
15
6.84
6.84
6.84
35
35
35
35
35
35
35
35
35
35
35
35
35
35
35
35
35
35
35
35
35
35
35
35
d
d
d
d
d
d
d
d
d
d
d
d
d
d
d
d
d
d
d
d
d
d
d
d
EC50
EC10
NOEC
EC50
EC10
NOEC
EC50
EC10
NOEC
EC50
EC10
NOEC
EC50
EC10
NOEC
EC50
EC10
NOEC
EC50
EC10
NOEC
EC50
EC10
NOEC
biomass
biomass
biomass
biomass
biomass
biomass
biomass
biomass
biomass
biomass
biomass
biomass
biomass
biomass
biomass
biomass
biomass
biomass
biomass
biomass
biomass
biomass
biomass
biomass
649.3
205.2
269.4
74.4
9.5
< 59.9
116.4
26.1
49.7
41.4
9.3
17.7
93.4
72.0
42.0
483.0
137.8
63.1
37.1
9.0
9.4
160.1
91.3
52.1
2
2
2
2
2
2
2
2
2
2
2
2
2
2
2
2
2
2
2
2
2
2
2
2
2
2,3,4
2,3,4
2
2,4,5
2,4,5
2
2,3,4
2,3,4
2
2,3,4
2,3,4
2
2,4
2,4
2
2,4,6
2,4,6
2
2,4,6
2,4,6
2
2,4
2,4
Rombke
Rombke
Rombke
Rombke
Rombke
Rombke
Rombke
Rombke
Rombke
Rombke
Rombke
Rombke
Rombke
Rombke
Rombke
Rombke
Rombke
Rombke
Rombke
Rombke
Rombke
Rombke
Rombke
Rombke
Annelida
Eisenia fetida
sandy
Y TBT-Cl
5.5
1.7
3.6
56 d
EC50
reproduction
1.3
7.6
2
8
Eisenia fetida
silty
Y TBT-Cl
6.1
2.9
14.6
56 d
EC50
reproduction
3
10.3
2
8
Hund-Rinke and Simon
(2005)
Hund-Rinke and Simon
(2005)
Macrophyta
Brassica rapa
Brassica rapa
Brassica rapa
Brassica rapa
Brassica rapa
Brassica rapa
Brassica rapa
Brassica rapa
Brassica rapa
Brassica rapa
Brassica rapa
Brassica rapa
Brassica rapa
Brassica rapa
Brassica rapa
Brassica rapa
Brassica rapa
Brassica rapa
Brassica rapa
Brassica rapa
Brassica rapa
Brassica rapa
Brassica rapa
Brassica rapa
Page 62 of 74
Seeds
Seeds
Seeds
Seeds
Seeds
Seeds
Seeds
Seeds
Seeds
Seeds
Seeds
Seeds
Seeds
Seeds
Seeds
Seeds
Seeds
Seeds
Seeds
Seeds
Seeds
Seeds
Seeds
Seeds
23
23
23
23
23
23
23
23
23
23
23
23
23
23
23
23
23
23
23
23
23
23
23
23
535.5
169.2
222.2
30.7
3.9
< 24.7
19.2
4.3
8.2
54.9
42.3
24.7
189.2
54
24.7
10.7
2.6
2.7
75.9
43.3
24.7
149.3
34.7
24.71
519.4
164.1
215.5
29.8
3.8
< 24.0
18.6
4.2
8.0
53.3
41.0
24.0
183.5
52.4
24.0
10.4
2.5
2.6
73.6
42.0
24.0
144.8
33.7
24.0
669.4
211.5
277.8
76.8
9.8
< 61.8
120.0
26.9
51.3
42.7
9.6
18.2
96.3
74.2
43.3
497.9
142.1
65.0
38.2
9.3
9.6
165.0
94.1
53.7
et
et
et
et
et
et
et
et
et
et
et
et
et
et
et
et
et
et
et
et
et
et
et
et
al.
al.
al.
al.
al.
al.
al.
al.
al.
al.
al.
al.
al.
al.
al.
al.
al.
al.
al.
al.
al.
al.
al.
al.
(2007)
(2007)
(2007)
(2007)
(2007)
(2007)
(2007)
(2007)
(2007)
(2007)
(2007)
(2007)
(2007)
(2007)
(2007)
(2007)
(2007)
(2007)
(2007)
(2007)
(2007)
(2007)
(2007)
(2007)
RIVM Report 607711009
Species
Species
properties
Soil type
A Test
Purity pH
comp.
Eisenia fetida
Exp.
time
Crit.
Test
endpoint
loamy
Y TBT-Cl
5.4
[%] [%] [°C]
5.6
31.5
56 d
EC50
reproduction
Eisenia fetida
sandy
N TBT-Cl
5.5
1.7
3.6
56 d
EC10
reproduction
0.26
Eisenia fetida
loamy
N TBT-Cl
5.4
5.6
31.5
56 d
EC10
reproduction
0.47
OECD
OECD
OECD
OECD
silty clay loam
silty clay loam
silty clay loam
silty clay loam
loamy sand
loamy sand
loamy sand
loamy sand
loamy sand
loamy sand
loamy sand
loamy sand
silt loam
silt loam
silt loam
silt loam
loam
loam
loam
loam
silt loam
silt loam
silt loam
silt loam
silt loam
silt loam
silt loam
silt loam
N
N
N
N
N
N
N
N
N
N
N
N
N
N
N
N
N
N
N
N
N
N
N
N
N
N
N
N
N
N
N
N
6
6
6
6
4.9
4.9
4.9
4.9
3.8
3.8
3.8
3.8
5.5
5.5
5.5
5.5
5.2
5.2
5.2
5.2
5.8
5.8
5.8
5.8
7.4
7.4
7.4
7.4
6.6
6.6
6.6
6.6
8
8
8
8
4
4
4
4
2.6
2.6
2.6
2.6
1.6
1.6
1.6
1.6
4.5
4.5
4.5
4.5
5.7
5.7
5.7
5.7
3.8
3.8
3.8
3.8
2.8
2.8
2.8
2.8
8
8
8
8
29.7
29.7
29.7
29.7
5.1
5.1
5.1
5.1
3.82
3.82
3.82
3.82
24.9
24.9
24.9
24.9
25.9
25.9
25.9
25.9
22.5
22.5
22.5
22.5
15
15
15
15
28
28
56
56
28
28
56
56
28
28
56
56
28
28
56
56
28
28
56
56
28
28
56
56
28
28
56
56
28
28
56
56
LC50
LC10
EC10
NOEC
LC50
LC10
EC10
NOEC
LC50
LC10
EC10
NOEC
LC50
LC10
EC10
NOEC
LC50
LC10
EC10
NOEC
LC50
LC10
EC10
NOEC
LC50
LC10
EC10
NOEC
LC50
LC10
EC10
NOEC
mortality
mortality
reproduction
reproduction
mortality
mortality
reproduction
reproduction
mortality
mortality
reproduction
reproduction
mortality
mortality
reproduction
reproduction
mortality
mortality
reproduction
reproduction
mortality
mortality
reproduction
reproduction
mortality
mortality
reproduction
reproduction
mortality
mortality
reproduction
reproduction
(age, sex)
Eisenia
Eisenia
Eisenia
Eisenia
Eisenia
Eisenia
Eisenia
Eisenia
Eisenia
Eisenia
Eisenia
Eisenia
Eisenia
Eisenia
Eisenia
Eisenia
Eisenia
Eisenia
Eisenia
Eisenia
Eisenia
Eisenia
Eisenia
Eisenia
Eisenia
Eisenia
Eisenia
Eisenia
Eisenia
Eisenia
Eisenia
Eisenia
andrei
andrei
andrei
andrei
andrei
andrei
andrei
andrei
andrei
andrei
andrei
andrei
andrei
andrei
andrei
andrei
andrei
andrei
andrei
andrei
andrei
andrei
andrei
andrei
andrei
andrei
andrei
andrei
andrei
andrei
andrei
andrei
Adult
Adult
Adult
Adult
Adult
Adult
Adult
Adult
Adult
Adult
Adult
Adult
Adult
Adult
Adult
Adult
Adult
Adult
Adult
Adult
Adult
Adult
Adult
Adult
Adult
Adult
Adult
Adult
Adult
Adult
Adult
Adult
[%]
TBT-O
TBT-O
TBT-O
TBT-O
TBT-O
TBT-O
TBT-O
TBT-O
TBT-O
TBT-O
TBT-O
TBT-O
TBT-O
TBT-O
TBT-O
TBT-O
TBT-O
TBT-O
TBT-O
TBT-O
TBT-O
TBT-O
TBT-O
TBT-O
TBT-O
TBT-O
TBT-O
TBT-O
TBT-O
TBT-O
TBT-O
TBT-O
o.m. Clay T
18-22
18-22
18-22
18-22
18-22
18-22
18-22
18-22
18-22
18-22
18-22
18-22
18-22
18-22
18-22
18-22
18-22
18-22
18-22
18-22
18-22
18-22
18-22
18-22
18-22
18-22
18-22
18-22
18-22
18-22
18-22
18-22
d
d
d
d
d
d
d
d
d
d
d
d
d
d
d
d
d
d
d
d
d
d
d
d
d
d
d
d
d
d
d
d
Result test
soil
Result test Result
soil TBTstand. soil
ion
[mg/kgdwt] [mg/kgdwt] [mg/kgdwt]
2.7
56.2
37
3.9
3.2
8.6
6
2.1
1
15.3
4.4
0.3
0.3
8.5
4.5
0.03
< 0.3
10.4
6.5
2.4
1
12.6
6
0.6
0.3
12.6
6
2.4
1
12.3
8.8
2.5
1
54.5
35.9
3.8
3.1
8.3
5.8
2.0
1.0
14.8
4.3
0.3
0.3
8.2
4.4
0.0
< 0.3
10.1
6.3
2.3
1.0
12.2
5.8
0.6
0.3
12.2
5.8
2.3
1.0
11.9
8.5
2.4
1.0
70.3
46.3
4.9
4.0
21.5
15.0
5.3
2.5
58.8
16.9
1.2
1.2
53.1
28.1
0.2
< 1.2
23.1
14.4
5.3
2.2
22.1
10.5
1.1
0.5
33.2
15.8
6.3
2.6
43.9
31.4
8.9
3.6
Result
Ri Notes Reference
stand. soil
TBT-ion
[mg/kgdwt]
4.8
2 8
Hund-Rinke and Simon
(2005)
1.5
3 9
Hund-Rinke et al.
(2005)
0.84
3 9
Hund-Rinke et al.
(2005)
68.1
2 2
Rombke et al. (2007)
44.9
2 2,7
Rombke et al. (2007)
4.7
2 2
Rombke et al. (2007)
3.9
2 2
Rombke et al. (2007)
20.9
2 2
Rombke et al. (2007)
14.6
2 2,7
Rombke et al. (2007)
5.1
2 2
Rombke et al. (2007)
2.4
2 2
Rombke et al. (2007)
57.1
2 2
Rombke et al. (2007)
16.4
2 2,7
Rombke et al. (2007)
1.1
2 2
Rombke et al. (2007)
1.1
2 2
Rombke et al. (2007)
51.5
2 2
Rombke et al. (2007)
27.3
2 2,7
Rombke et al. (2007)
0.2
2 2
Rombke et al. (2007)
< 1.1
2 2
Rombke et al. (2007)
22.4
2 2
Rombke et al. (2007)
14.0
2 2,7
Rombke et al. (2007)
5.2
2 2
Rombke et al. (2007)
2.2
2 2
Rombke et al. (2007)
21.4
2 2
Rombke et al. (2007)
10.2
2 2,7
Rombke et al. (2007)
1.0
2 2
Rombke et al. (2007)
0.5
2 2
Rombke et al. (2007)
32.2
2 2
Rombke et al. (2007)
15.3
2 2,7
Rombke et al. (2007)
6.1
2 2
Rombke et al. (2007)
2.6
2 2
Rombke et al. (2007)
42.6
2 2
Rombke et al. (2007)
30.5
2 2,7
Rombke et al. (2007)
8.7
2 2
Rombke et al. (2007)
3.5
2 2
Rombke et al. (2007)
Page 63 of 74
RIVM Report 607711009
Species
Species
properties
Soil type
A Test
Purity pH
comp.
(age, sex)
Adult
Adult
Adult
Adult
sandy
sandy
sandy
sandy
N
N
N
N
Collembola
Folsomia candida
juvenile
Folsomia candida
Crit.
Test
endpoint
28
28
56
56
d
d
d
d
LC50
LC10
EC10
NOEC
mortality
mortality
reproduction
reproduction
Result test
soil
Result test
soil TBTion
[mg/kgdwt] [mg/kgdwt]
15
14.6
8.3
8.1
1
1.0
1
1.0
6.1
6.1
6.1
6.1
[%]
4.6
4.6
4.6
4.6
[%]
6.84
6.84
6.84
6.84
sandy soil
Y TBT-Cl
5.5
1.7
3.6
28 d
EC50
reproduction
22
juvenile
silty soil
Y TBT-Cl
6.1
2.9
14.6
28 d
EC50
reproduction
Folsomia candida
juvenile
loamy soil
Y TBT-Cl
5.4
5.6
31.5
28 d
EC50
reproduction
Folsomia
Folsomia
Folsomia
Folsomia
Folsomia
Folsomia
Folsomia
Folsomia
Folsomia
Folsomia
Folsomia
Folsomia
Folsomia
Folsomia
Folsomia
Folsomia
Folsomia
Folsomia
Folsomia
Folsomia
Folsomia
Folsomia
Folsomia
Folsomia
Folsomia
Folsomia
juv.,
juv.,
juv.,
juv.,
juv.,
juv.,
juv.,
juv.,
juv.,
juv.,
juv.,
juv.,
juv.,
juv.,
juv.,
juv.,
juv.,
juv.,
juv.,
juv.,
juv.,
juv.,
juv.,
juv.,
juv.,
juv.,
OECD soil
OECD soil
OECD soil
OECD soil
silty clay loam
silty clay loam
silty clay loam
silty clay loam
loamy sand
loamy sand
loamy sand
loamy sand
loamy sand
loamy sand
loamy sand
loamy sand
loamy sand
loamy sand
loamy sand
loamy sand
silt loam
silt loam
silt loam
silt loam
loam
loam
N
N
N
N
N
N
N
N
N
N
N
N
N
N
N
N
N
N
N
N
N
N
N
N
N
N
6
6
6
6
4.9
4.9
4.9
4.9
3.8
3.8
3.8
3.8
3.1
3.1
3.1
3.1
5.5
5.5
5.5
5.5
5.2
5.2
5.2
5.2
5.8
5.8
8
8
8
8
4
4
4
4
2.6
2.6
2.6
2.6
8.7
8.7
8.7
8.7
1.6
1.6
1.6
1.6
4.5
4.5
4.5
4.5
5.7
5.7
8
8
8
8
29.7
29.7
29.7
29.7
5.1
5.1
5.1
5.1
4.67
4.67
4.67
4.67
3.82
3.82
3.82
3.82
24.9
24.9
24.9
24.9
25.9
25.9
28
28
28
28
28
28
28
28
28
28
28
28
28
28
28
28
28
28
28
28
28
28
28
28
28
28
LC50
LC10
EC10
NOEC
LC50
LC10
EC10
NOEC
LC50
LC10
EC10
NOEC
LC50
LC10
EC10
NOEC
LC50
LC10
EC10
NOEC
LC50
LC10
EC10
NOEC
LC50
LC10
mortality
mortality
reproduction
reproduction
mortality
mortality
reproduction
reproduction
mortality
mortality
reproduction
reproduction
mortality
mortality
reproduction
reproduction
mortality
mortality
reproduction
reproduction
mortality
mortality
reproduction
reproduction
mortality
mortality
andrei
andrei
andrei
andrei
candida
candida
candida
candida
candida
candida
candida
candida
candida
candida
candida
candida
candida
candida
candida
candida
candida
candida
candida
candida
candida
candida
candida
candida
candida
candida
Page 64 of 74
10-12 d
10-12 d
10-12 d
10-12 d
10-12 d
10-12 d
10-12 d
10-12 d
10-12 d
10-12 d
10-12 d
10-12d
10-12 d
10-12 d
10-12 d
10-12 d
10-12 d
10-12 d
10-12 d
10-12 d
10-12 d
10-12 d
10-12 d
10-12 d
10-12 d
10-12 d
loam
loam
loam
loam
TBT-O
TBT-O
TBT-O
TBT-O
TBT-O
TBT-O
TBT-O
TBT-O
TBT-O
TBT-O
TBT-O
TBT-O
TBT-O
TBT-O
TBT-O
TBT-O
TBT-O
TBT-O
TBT-O
TBT-O
TBT-O
TBT-O
TBT-O
TBT-O
TBT-O
TBT-O
[°C]
18-22
18-22
18-22
18-22
Exp.
time
TBT-O
TBT-O
TBT-O
TBT-O
Eisenia
Eisenia
Eisenia
Eisenia
[%]
o.m. Clay T
18-22
18-22
18-22
18-22
18-22
18-22
18-22
18-22
18-22
18-22
18-22
18-22
18-22
18-22
18-22
18-22
18-22
18-22
18-22
18-22
18-22
18-22
18-22
18-22
18-22
18-22
d
d
d
d
d
d
d
d
d
d
d
d
d
d
d
d
d
d
d
d
d
d
d
d
d
d
345.8
57.9
17.7
10
113.1
10.9
9.9
10
20.7
7.8
15.6
10
127.1
65.1
28.5
10
91.9
10.2
9.8
10
806.5
51.2
145.8
100
109.2
10.7
Result
stand. soil
Result
stand. soil
TBT-ion
[mg/kgdwt] [mg/kgdwt]
32.6
31.6
18.0
17.5
2.2
2.1
2.2
2.1
Ri Notes Reference
2
2
2
2
2
2,7
2
2
Rombke
Rombke
Rombke
Rombke
129
2
8
11
37.9
2
8
66
118
2
8
419.3
70.2
21.5
12.1
274.3
26.4
24.0
24.3
77.2
29.1
58.2
37.3
141.7
72.6
31.8
11.1
557.1
61.8
59.4
60.6
1738.5
110.4
314.3
215.6
185.8
18.2
2
2
2
2
2
2
2
2
2
2
2
2
2
2
2
2
2
2
2
2
2
2
2
2
2
2
2
2,7
2
2
2
2,7
2
2
2
2,7
2
2
2
2,7
2
2
2
2,7
2
2
2
2,7
2
2,3,4
2
2,7
Hund-Rinke and Simon
(2005)
Hund-Rinke and Simon
(2005)
Hund-Rinke and Simon
(2005)
Rombke et al. (2007)
Rombke et al. (2007)
Rombke et al. (2007)
Rombke et al. (2007)
Rombke et al. (2007)
Rombke et al. (2007)
Rombke et al. (2007)
Rombke et al. (2007)
Rombke et al. (2007)
Rombke et al. (2007)
Rombke et al. (2007)
Rombke et al. (2007)
Rombke et al. (2007)
Rombke et al. (2007)
Rombke et al. (2007)
Rombke et al. (2007)
Rombke et al. (2007)
Rombke et al. (2007)
Rombke et al. (2007)
Rombke et al. (2007)
Rombke et al. (2007)
Rombke et al. (2007)
Rombke et al. (2007)
Rombke et al. (2007)
Rombke et al. (2007)
Rombke et al. (2007)
335.4
56.2
17.2
9.7
109.7
10.6
9.6
9.7
20.1
7.6
15.1
9.7
123.3
63.1
27.6
9.7
89.1
9.9
9.5
9.7
782.3
49.7
141.4
97.0
105.9
10.4
432.3
72.4
22.1
12.5
282.8
27.3
24.8
25.0
79.6
30.0
60.0
38.5
146.1
74.8
32.8
11.5
574.4
63.8
61.3
62.5
1792.2
113.8
324.0
222.2
191.6
18.8
et
et
et
et
al.
al.
al.
al.
(2007)
(2007)
(2007)
(2007)
RIVM Report 607711009
Species
Folsomia
Folsomia
Folsomia
Folsomia
Folsomia
Folsomia
Folsomia
Folsomia
Folsomia
Folsomia
Folsomia
Folsomia
Folsomia
Folsomia
Species
properties
candida
candida
candida
candida
candida
candida
candida
candida
candida
candida
candida
candida
candida
candida
(age, sex)
juv., 10-12 d
juv., 10-12 d
juv., 10-12 d
juv., 10-12 d
juv., 10-12 d
juv., 10-12 d
juv., 10-12 d
juv., 10-12 d
juv., 10-12 d
juv., 10-12 d
juv., 10-12 d
juv., 10-12 d
juv., 10-12 d
juv., 10-12 d
Soil type
A Test
Purity pH
comp.
loam
loam
silt loam
silt loam
silt loam
silt loam
silt loam
silt loam
silt loam
silt loam
sandy loam
sandy loam
sandy loam
sandy loam
N
N
N
N
N
N
N
N
N
N
N
N
N
N
[%]
TBT-O
TBT-O
TBT-O
TBT-O
TBT-O
TBT-O
TBT-O
TBT-O
TBT-O
TBT-O
TBT-O
TBT-O
TBT-O
TBT-O
5.8
5.8
7.4
7.4
7.4
7.4
6.6
6.6
6.6
6.6
6.1
6.1
6.1
6.1
o.m. Clay T
[%]
5.7
5.7
3.8
3.8
3.8
3.8
2.8
2.8
2.8
2.8
4.6
4.6
4.6
4.6
[%]
25.9
25.9
22.5
22.5
22.5
22.5
15
15
15
15
6.84
6.84
6.84
6.84
[°C]
18-22
18-22
18-22
18-22
18-22
18-22
18-22
18-22
18-22
18-22
18-22
18-22
18-22
18-22
Exp.
time
Crit.
Test
endpoint
28
28
28
28
28
28
28
28
28
28
28
28
28
28
EC10
NOEC
LC50
LC10
EC10
NOEC
LC50
LC10
EC10
NOEC
LC50
LC10
EC10
NOEC
reproduction
reproduction
mortality
mortality
reproduction
reproduction
mortality
mortality
reproduction
reproduction
mortality
mortality
reproduction
reproduction
d
d
d
d
d
d
d
d
d
d
d
d
d
d
Result test
soil
Result test
soil TBTion
[mg/kgdwt] [mg/kgdwt]
72
69.8
31.6
30.7
66.1
64.1
35.2
34.1
20.8
20.2
10
9.7
134
130.0
60.5
58.7
19.8
19.2
10
9.7
137.2
133.1
14.5
14.1
27.8
27.0
10
9.7
Result
stand. soil
Result
stand. soil
TBT-ion
[mg/kgdwt] [mg/kgdwt]
126.3
122.5
55.4
53.8
173.9
168.7
92.6
89.9
54.7
53.1
26.3
25.5
478.6
464.2
216.1
209.6
70.7
68.6
35.7
34.6
298.3
289.3
31.5
30.6
60.4
58.6
21.7
21.1
Ri Notes Reference
2
2
2
2
2
2
2
2
2
2
2
2
2
2
2
2
2
2,7
2
2
2
2,7
2
2
2
2
2
2
Notes
1 Tests were performed with soil extracts and water:soil ratio for the extraction is not reported; it is unclear how this relates to the actual toxicity in soil; the used
chemical form of TBT is not reported.
2 OM content calculated from reported OC content; 16:8 h L:D
3 LOEC higher than EC50
4 EC10 considered more relevant for risk limit derivation than NOEC
5 LOEC is lowest concentration tested
6 LOEC close to EC50
7 LC10 values not the paper; provided by the author through personal communication
8 Test performed according to ISO guidelines; organic matter content calculated from reported organic carbon content; 14-d aging period at 4°C after contamination;
measured concentrations within 25% of nominal; endpoint based on nominal concentrations; endpoint expressed as TBT-ion confirmed by author
9 Test according to ISO; 27% reduction at 0.3 mg/kg but no statistics available, authors use 50% inhibition of reproduction as threshold; EC10 estimated from original
data, but only three concentrations tested, which makes estimation not reliable; endpoint expressed as TBT-ion confirmed by author.
Page 65 of 74
Rombke
Rombke
Rombke
Rombke
Rombke
Rombke
Rombke
Rombke
Rombke
Rombke
Rombke
Rombke
Rombke
Rombke
et
et
et
et
et
et
et
et
et
et
et
et
et
et
al.
al.
al.
al.
al.
al.
al.
al.
al.
al.
al.
al.
al.
al.
(2007)
(2007)
(2007)
(2007)
(2007)
(2007)
(2007)
(2007)
(2007)
(2007)
(2007)
(2007)
(2007)
(2007)
RIVM Report 607711009
Table A2.3. Toxicity of tributyltin (and tributyltin-oxide) to soil microbial processes and enzyme activity
Process/activity
Soil type
A Test
Purity pH
comp.
[%]
Microbial processes
Basal respiration
Basal respiration
Basal respiration
Substrate induced
respiration
Substrate induced
respiration
Substrate induced
respiration
Potential nitrification
Potential nitrification
Potential nitrification
Respiration
o.m. Clay T
Exp. Crit.
time
Test endpoint
[%] [%] [°C]
Result test
soil
Result test Result
soil TBTstand. Soil
ion
[mg/kgdwt] [mg/kgdwt] [mg/kgdwt]
Result
Ri Notes Reference
stand. soil
TBT-ion
[mg/kgdwt]
sandy soil
silty soil
loamy soil
sandy soil
Y
Y
Y
Y
TBT-Cl
TBT-Cl
TBT-Cl
TBT-Cl
5.5
6.1
5.4
5.5
1.7
2.9
5.6
1.7
3.6
14.6
31.5
3.6
EC50
EC50
EC50
EC50
Respiration
Respiration
Respiration
Respiration
rate
rate
rate
rate
>1000
>1000
>1000
>1000
>
>
>
>
5882
3448
1786
5882
2
2
2
2
1,2,3
1,2,3
1,2,3
1,2,4
Hund-Rinke
Hund-Rinke
Hund-Rinke
Hund-Rinke
silty soil
Y TBT-Cl
6.1
2.9
14.6
EC50
Respiration rate
>1000
> 3448
2
1,2,4
Hund-Rinke and Simon (2005)
loamy soil
Y TBT-Cl
5.4
5.6
31.5
EC50
Respiration rate
>1000
> 1786
2
1,2,4
Hund-Rinke and Simon (2005)
sandy soil
silty soil
loamy soil
luvisol
Y
Y
Y
Y
5.5
6.1
5.4
7.88
1.7
2.9
5.6
4.9
3.6
14.6
31.5
18
6h
6h
6h
64 d
EC50
EC50
EC50
NOEC
Ammonium oxidation
Ammonium oxidation
Ammonium oxidation
CO2 evolution
6.7
11
64
156
6.0
14
65
221
279
12
2
2
2
2
1
1
1
5
Hund-Rinke and Simon (2005)
Hund-Rinke and Simon (2005)
Hund-Rinke and Simon (2005)
Rossel and Tarradellas (1991)
Enzymatic activity
Dehydrogenase
luvisol
Y TBT-Cl
7.88 4.9
18
64 d
6.7
6.0
14
12
2
5
Rossel and Tarradellas (1991)
ATP content
Esterase activity
luvisol
luvisol
Y TBT-Cl
Y TBT-Cl
7.88 4.9
7.88 4.9
18
18
64 d
64 d
NOEC dehydrogenase
activity
NOEC ATP content
NOEC esterase activity
6.7
67
6.0
60
14
137
12
122
2
2
6
6
Rossel and Tarradellas (1991)
Rossel and Tarradellas (1991)
TBT-Cl
TBT-Cl
TBT-Cl
TBT-Cl
Notes
1 Test performed according to ISO guidelines; organic matter content calculated from reported organic carbon content; 14-d aging period at 4°C after contamination;
measured concentrations within 25% of nominal; endpoint based on nominal concentrations; endpoint expressed as TBT-ion confirmed by author.
2 Actual exposure time not reported.
3 Exposure is as long as period of measurement: ‘the respiration rates should be measured until constant rates are obtained’.
4 Exposure lasted from addition of growth substrate untill ‘respiration curve reaches its peak and respiration rates are declining’.
5 After contamination, soil moisture content was kept at 23% (pF 2.1) for 64 days, after which soil was air-dried to 1.5% and remoistened on day 120; results of the
first phase are used only; organic matter content calculated from reported organic carbon content. Endpoint based on initial measured concentration recalculated to
time weighted average; reduction in TBT concentration during exposure period of 64 days about 40-80% half-life = 70 d; unclear if endpoint is expressed as TBT-ion
or TBT-Cl; the latter is presumed.
6 Organic matter content calculated from reported organic carbon content. Endpoint based on initial measured concentration recalculated to time weighted average;
reduction in TBT concentration during exposure period of 64 d about 40-80%; half life = 70 d; unclear if endpoint is expressed as TBT-ion or TBT-Cl; the latter is
presumed.
Page 66 of 74
and
and
and
and
Simon
Simon
Simon
Simon
(2005)
(2005)
(2005)
(2005)
RIVM Report 607711009
Appendix 3. Detailed soil toxicity data for triphenyltin
Table A3.1. Acute toxicity of triphenyltin for soil organisms
Species
Species
properties
Soil type
A Test
comp.
(age, sex)
Annelida
Eisenia fetida
Eisenia fetida
Eisenia fetida
Eisenia fetida
Eisenia fetida
2 months old
2 months old
2 months old
> 2 months old, 338479 mg/10 worms
> 2 months old, 338479 mg/10 worms
Purity pH o.m. Clay T
Exp. Crit.
time
Test
Result test
endpoint soil
Result test Result
soil TBTstand. soil
ion
[mg/kgdwt] [mg/kgdwt] [mg/kgdwt]
Result
Ri Notes Reference
stand. soil
TBT-ion
[mg/kgdwt]
[%]
[%] [%] [°C]
20
20
20
20
7d
14 d
14 d
7d
LC50
LC50
NOEC
LC50
mortality
mortality
weight
mortality
362
128
10.7
30.5
310
110
9.2
29
362
1128
10.7
30.5
310
110
9.2
29
2
2
2
2
1
1
1
2
EU-DAR
EU-DAR
EU-DAR
EU-DAR
20
14 d
LC50
mortality
30.5
29
30.5
29
2
2
EU-DAR (1996a, 1996b)
artificial
artificial
artificial
artificial
N
N
N
N
TPT-Ac
TPT-Ac
TPT-Ac
TPT-OH
40.7
10
10
10
10
artificial
N TPT-OH
40.7
10
Notes
1
Performed according to OECD 207 guideline; orig ref: Fischer 1990B not available
2
Performed according to OECD 207; TPT applied as SC formulation 500 g TPT-OH L; endpoints in abstract reported for SC-formulation; therefore corrected to a.s.
using a density of 1.23 g/ml as given in the DAR; orig ref: Fischer 1990 not available
Page 67 of 74
(1996a,
(1996a,
(1996a,
(1996a,
1996b)
1996b)
1996b)
1996b)
RIVM Report 607711009
Table A3.2. Chronic toxicity of triphenyltin for soil organisms
Species
Species
properties
Soil type
A Test
comp.
(age, sex)
Bacteria
Escherichia coli
Pseudomonas
fluorescens
Vibrio fischeri
Eisenia andrei
Eisenia andrei
Eisenia andrei
Eisenia andrei
Eisenia andrei
o.m. Clay T
[%]
[%] [%] [°C]
Eisenia fetida
Crit.
Test
endpoint
Result test
soil
Result test Result
soil TBTstand. soil
ion
[mg/kgdwt] [mg/kgdwt] [mg/kgdwt]
Result
Ri Notes Reference
stand. soil
TBT-ion
[mg/kgdwt]
6.32 3.8
6.32 3.8
11.5 25
11.5 25
15 min EC20
15 min EC20
luminescence 24.8
luminescence 41.2
65.3
108.4
3
3
1
1
Trott et al. (2007)
Trott et al. (2007)
sandy loam Y TPT
6.32 3.8
11.5 22
10 min EC20
luminescence 11.5
30.3
3
1
Trott et al. (2007)
22
28 d
LC50
mortality
3
2
EC50
TPT
8.5-15.5 weeks,
170-582 mg
8.5-15.5 weeks,
170-582 mg
8.5-15.5 weeks,
170-582 mg
8.5-15.5 weeks,
170-582 mg
8.5-15.5 weeks,
170-582 mg
8.5-15.5 weeks,
170-582 mg
Exp.
time
sandy loam Y TPT
sandy loam Y TPT
Annelida
Eisenia andrei
Eisenia andrei
Purity pH
cocoon
production
NOEC cocoon
production
LC50 mortality
28
25.48
28
25.48
2
3
Visser and Linders
(1992)
Van Gestel et al (1992)
10
9.1
10
9.1
2
3
Van Gestel et al (1992)
57
51.87
57
51.87
2
3
Van Gestel et al (1992)
≥32
≥29
≥32
≥29
2
3
Van Gestel et al (1992)
21 d
NOEC cocoon
hatchability
NOEC reproduction
10
9.1
10
9.1
2
3
Van Gestel et al (1992)
20
21 d
NOEC growth
10
9.1
10
9.1
2
3
Van Gestel et al (1992)
20
28 d
EC50
body mass
3.9
3
4
Zsombok et al. (1997)
Crommentuijn
(1995)
Crommentuijn
(1995)
Crommentuijn
(1995)
Crommentuijn
(1995)
Crommentuijn
(1995)
Crommentuijn
(1995)
Crommentuijn
(1995)
OECD
Y TPT-Cl
>99
6
10
20
20
21 d
OECD
Y TPT-Cl
>99
6
10
20
20
21 d
OECD
Y TPT-Cl
>99
6
10
20
20
21 d
OECD
Y TPT-Cl
>99
6
10
20
20
21 d
OECD
Y TPT-Cl
>99
6
10
20
20
OECD
Y TPT-Cl
>99
6
10
20
mixture
N TPT
> 50
27
≤ 0.78
Collembola
Folsomia candida
Norwich clone
OECD
Y TPT-OH
6
10
20
20
35 d
LC50
mortality
> 2323
> 2207
> 508
> 483
2
5
Folsomia candida
Brunoy clone
OECD
Y TPT-OH
6
10
20
20
35 d
LC50
mortality
1152
1094.4
126
119.7
2
5
Folsomia candida
Haren clone
OECD
Y TPT-OH
6
10
20
20
35 d
LC50
mortality
1546
1468.7
226
214.7
2
5
Folsomia candida
OECD
Y TPT-OH
6
10
20
20
35 d
LC50
mortality
1115
1059.3
127
120.7
2
5
Folsomia candida
Roggebotzand
clone
Norwich clone
OECD
Y TPT-OH
6
10
20
20
35 d
EC50
reproduction
508
482.6
508
482.6
2
5
Folsomia candida
Brunoy clone
OECD
Y TPT-OH
6
10
20
20
35 d
EC50
reproduction
126
119.7
126
119.7
2
5
Folsomia candida
Haren clone
OECD
Y TPT-OH
6
10
20
20
35 d
EC50
reproduction
226
214.7
226
214.7
2
5
Page 68 of 74
et al.
et al.
et al.
et al.
et al.
et al.
et al.
RIVM Report 607711009
Species
Species
properties
Soil type
A Test
comp.
Purity pH
o.m. Clay T
OECD
Y TPT-OH
[%]
6
OECD
Y TPT-OH
Exp.
time
Crit.
Test
endpoint
Result test
soil
[%] [%] [°C]
10
20
20
35 d
EC50
reproduction
Result test
soil TBTion
[mg/kgdwt] [mg/kgdwt]
127
120.7
6
10
20
20
35 d
EC10
reproduction
508
482.6
Folsomia candida
(age, sex)
Roggebotzand
clone
Norwich clone
Folsomia candida
Brunoy clone
OECD
Y TPT-OH
6
10
20
20
35 d
EC10
reproduction
126
119.7
Folsomia candida
Haren clone
OECD
Y TPT-OH
6
10
20
20
35 d
EC10
reproduction
226
214.7
Folsomia candida
Roggebotzand
clone
OECD
Y TPT-OH
6
10
20
20
35 d
EC10
reproduction
127
120.7
Folsomia candida
Result
stand. soil
Result
Ri Notes Reference
stand. soil
TBT-ion
[mg/kgdwt] [mg/kgdwt]
127
120.7
2 5
Crommentuijn
(1995)
201
191.0
2 5
Crommentuijn
(1995)
11
10.5
2 5
Crommentuijn
(1995)
59.1
56.1
2 5
Crommentuijn
(1995)
18.2
17.3
2 5
Crommentuijn
(1995)
Notes
1 Tests were performed with soil extracts and water:soil ratio for the extraction is not reported; it is unclear how this relates to the actual toxicity in soil; the used
chemical form of TPT is not reported.
2 From original reference, it is known that the TPT was tested in combination with another active ingredient (maneb).
3 Actual concentration at 0.32 mg/kg was 0.56 mg/kg at the start and 0.34 mg/kg at the end of the test; result based on nominal.
4 The worms were exposed in a mixture of peaty marshland soil and horse manure at a ratio of 1:1. The OM concent of the marshland soil is unknown; the used
chemical form of TPT is not reported.
5 Actual concentrations at 300 and 3000 mg/kg nominal were 282 and 2320 mg/kg at the start, and 132 and 1604 mg/kg at the end (47 and 69% of nominal);
metabolites diphenyltin and monophenyltin were present; endpoint based on estimated actual initial concentrations, obtained from regression between nominal and
actual.
Page 69 of 74
et al.
et al.
et al.
et al.
et al.
RIVM Report 607711009
Table A3.3. Toxicity of triphenyltin to soil microbial processes and enzyme activity
Process/activity
Soil
type
A Test
comp.
Purity pH o.m. Clay T
[%]
Exp.
time
Crit.
Test endpoint
Result test
soil
Result test Result
soil TBTstand. soil
ion
[mg/kgdwt] [mg/kgdwt] [mg/kgdwt]
Result
Ri Notes Reference
stand. soil
TBT-ion
[mg/kgdwt]
[%] [%] [°C]
Microbial processes
Acetate mineralization
sandy
N TPT-OH
97
4.4 1
0.4
10
2d
EC50
mineralization
1700
1619
17000
16190
2
1
Acetate mineralization
sandy
N TPT-OH
97
4.4 1
0.4
10
2d
EC10
mineralization
640
610
6400
6100
2
1
Acetate mineralization
sandy
N TPT-OH
97
4.4 1
0.4
10
2d
IC50
mineralization rate
400
381
4000
3810
2
2
Acetate mineralization
sandy
N TPT-OH
97
4.4 1
0.4
10
2d
IC10
mineralization rate
96
91
960
910
2
2
Nitrification
Respiration
Respiration
Nitrogen metabolism
Nitrogen metabolism
Nitrogen metabolism
loamy
loamy sand
clay silt
clay silt
loamy sand
clay silt
N
N
N
N
N
N
7.6 1.6
11
120 h
56 d
56 d
28 d
56 d
56 d
NOEC
NOEC
NOEC
NOEC
NOEC
NOEC
nitrification rate
respiration rate
respiration rate
nitrification
nitrification
nitrification
> 10
< 0.267
≥2.67
≥2.67
≥2.67
≥2.67
> 8.6
< 0.254
≥2.54
≥2.54
≥2.54
≥2.54
> 62.5
> 53.5
40.7
40.7
40.7
40.7
40.7
4
3
3
3
3
3
3
4,5,6
4,5,7
4,5,8
4,5,9
4,5,9
TPT-Ac
TPT-OH
TPT-OH
TPT-OH
TPT-OH
TPT-OH
Van Beelen and FleurenKemila (1993)
Van Beelen and FleurenKemila (1993)
Van Beelen and FleurenKemila (1993)
Van Beelen and FleurenKemila (1993)
Visser and Linders (1992)
EU-DAR (1996a, 1996b)
EU-DAR (1996a, 1996b)
EU-DAR (1996a, 1996b)
EU-DAR (1996a, 1996b)
EU-DAR (1996a, 1996b)
Notes
1
Endpoint represents effect on final percentage mineralized, taking into account that mineralization by the un-intoxicated part of the microflora continues; endpoint
expressed as TPT-OH confirmed by author; organic matter content calculated from reported organic carbon content.
2
Endpoint represents effect on initial mineralization rate, without taking into account that mineralization by the un-intoxicated part of the microflora continues;
endpoint expressed as TPT-OH confirmed by author.
3
Original reference not available.
4
Unknown if substance is sprayed or mixed into the soil.
5
TPT-OH applied as formulation.
6
Effect of 2.3% compared to the control after 56 days; orig ref: Baedelt 1991A not available.
7
No effect in comparison with the control after 56 days; orig ref: Baedelt 1991A not available.
8
Orig ref: Baedelt 1991B not available.
9
Orig ref: Baedelt 1991C not available.
Page 70 of 74
RIVM Report 607711009
Appendix 4. Detailed toxicity of triphenyltin to birds and mammals
Table A4.1. Toxicity of triphenyltin to mammals and birds
Species
Properties
(age, sex)
Mammals
Dog
Dog
Test
Purity Application Vehicle
compound
route
[%]
Test
duration
Exposure time Criterion Test endpoint
Criterion –
Criterion - Criterion – Ri Notes Reference
oral dosing
diet
diet – TPT+
[mg/kgb.w./d] [mg/kgdiet] [mg/kgdiet]
Guinea pig
Guinea pig
Guinea pig
TPT-OH
beagel, 4TPT-OH
6 months, males
5.1-11.8 kg, female
5.4-9.6 kg
TPT-OH
TPT-Ac
male and female
TPT-OH
Guinea pig
male and female
TPT-Ac
Hamster
pregnant female
TPT-OH
gavage
15 days
day 5-14 of
gestation
NOAEL
Hamster
pregnant female
TPT-OH
gavage
15 days
NOAEL
Mouse
female, 5060 days, 30-35 g
pregnant female
TPT-OH
97.3
gavage
corn oil
18 days
NOAEL
embyo toxicity
TPT-OH
97.3
gavage
corn oil
40 days
day 5 to 15 of
gestation
day 6 17 of
gestation
day 6 to 17 of
gestation
maternal
toxicity/embryo
toxicity
maternal toxicity
NOAEL
male and female
5 weeks, males 2630 g, females 2125 g
male and female
male and female
pregnant female
TPT-OH
TPT-OH
97.2
97.2
diet
80 weeks
13 weeks
80 weeks
13 weeks
NOEC
NOEC
TPT-OH
TPT-OH
TPT-Ac
97.2
97.2
diet
diet
gavage
80 weeks
80 weeks
29 days
80 weeks
80 weeks
day 6 to 18 of
gestation
NOEC
NOEC
NOAEL
maternal body
7.5
weight gain/embryo
toxicity/litter
viability
growth
body weight
gain/food
consumption
mortality
body weight
maternal
0.32
toxicity/embryo
toxicity
Mouse
Mouse
Mouse
Mouse
Mouse
Rabbit
diet
diet
52 weeks
52 weeks
52 weeks
52 weeks
NOAEL
NOEC
toxicology
overall
≥ 0.6
97.2
≥ 24
≥ 18
≥ 23
≥ 17
4
2
2
4
EC (1996a, 1996b)
US EPA (1987b)
13 weeks
13 weeks
90 days
13 weeks
13 weeks
90 days
NOAEL
NOAEL
NOEC
body weight gain
body weight gain
growth
< 0.2
< 0.2
<4
<4
10
< 3.8
< 3.6
9.5
4
4
2
2
2
97.1
diet
diet
diet
90 days
90 days
NOEC
growth
5
4.8
2
5.08
42
40
4
EC (1996a, 1996b)
EC (1996a, 1996b)
Verschuuren et al.
(1966)
Verschuuren et al.
(1966)
WHO (1999)
4.91
41
39
2
4
US EPA (1982)
< 3.75
< 31
< 30
2
Sarpa et al. (2007)
62
59
2
Delgado Filho et al.
(2011)
5
≥ 100
4.8
≥ 95
4
2
20
5
11
19
4.8
9.1
2
2
4
95-96 diet
4
4
4
Page 71 of 74
WHO (1999)
US EPA (1986)
US EPA (1989)
US EPA (1989)
WHO (1999)
RIVM Report 607711009
Species
Properties
Rabbit
(age, sex)
pregnant female
Rabbit
Rabbit
Rabbit
Rabbit
male,
7 months, 2.9kg
Test
Purity Application Vehicle
compound
route
[%]
TPT-OH
gavage
Test
duration
Exposure time Criterion Test endpoint
29 days
TPT-Cl
12 weeks
day 6 to 18 of
gestation
12 weeks
99
orally
pregnant female
TPT-OH
TPT-OH
TPT-OH
gavage
gavage
gavage
Rabbit
pregnant female
TPT-OH
gavage
Rabbit
male, 6-11 weeks
TPT-Ac
Rat
neonatal
Rat
NOAEL
maternal toxicity
Criterion –
oral dosing
[mg/kgb.w./d]
0.1
Criterion diet
[mg/kgdiet]
3.3
Criterion – Ri Notes Reference
diet – TPT+
[mg/kgdiet]
3.2
4
WHO (1999)
NOAEL
sperm production
< 0.5
< 17
< 15
3
1
Yousef et al (2010)
NOAEL
NOAEL
NOAEL
maternal toxicity
embryotoxicity
embryotoxicity
0.1
0.3
1
3.3
10
33
3.1
9.5
32
4
4
2
2
2
4
EC (1996a, 1996b)
EC (1996a, 1996b)
US EPA (1987d)
day 6 to 18 of
gestation
NOAEL
maternal toxicity
0.1
3.3
3.2
2
4
US EPA (1987d)
75
71
2
4
Dacasto et al.
(1994)
Mushak et al.
(1982)
US EPA (1991a)
day 6 to 18 of
gestation
diet
1% aqueous
29 days
carboxymethylcellulose
1% aqueous
29 days
carboxymethylcellulose
70 days
70 days
NOEC
body weight gain
TPT-Ac
gavage
milk+tween
NOAEL
body weight
3
60
51
2
pregnant female
TPT-OH
gavage
corn oil
28 days
NOAEL
body weight
2.8
56
53
2
Rat
pregnant female
TPT-Cl
gavage
olive oil
20 days
day 2 to 29 of
age
day 6 to 15 of
gestation
day 0 to 3 of
gestation
NOAEL
< 3.1
< 62
< 59
2
Ema et al. (1997)
Rat
pregnant female
TPT-Cl
gavage
olive oil
20 days
day 4 to 6 of
gestation
NOAEL
< 6.3
< 126
< 120
2
Ema et al. (1997)
Rat
pregnant female
TPT-Cl
98
gavage
olive oil
20 days
of NOAEL
6.3
126
115
2
Ema et al. (1999)
Rat
pregnant female
TPT-Cl
98
gavage
olive oil
20 days
of NOAEL
embryo toxicity
6.3
126
115
2
Ema et al. (1999)
Rat
pregnant female
TPT-Cl
98
gavage
olive oil
20 days
of NOAEL
< 126
< 115
2
Ema et al. (1999)
pregnant female
TPT-Cl
98
gavage
olive oil
20 days
< 6.3
< 126
< 115
2
Ema et al. (1999)
Rat
pregnant female
TPT-Cl
98
gavage
olive oil
20 days
maternal body
weight gain
maternal body
weight gain
maternal body
weight gain/embryo
toxicity
maternal body
weight gain/litter
growth and viability
maternal toxicity
< 6.3
Rat
day 10 to 12
gestation
day 13 to 15
gestation
day 10 to 12
gestation
day 13 to 15
gestation
day 7 to 9 of
gestation
body weight
gain/food
consumption
body weight
gain/food
consumption
embryo toxicity
3.1
62
56
2
Ema et al. (1999)
1.4-1.7
28-34
27-32
4
1
20
19
4
Rat
Rat
TPT-OH
pregnant female
Page 72 of 74
TPT-OH
diet
2 gen
20 days
of NOAEL
NOAEL
NOAEL
day 6-15 of
gestation
NOAEL
2
EC (1996a, 1996b)
WHO (1999)
RIVM Report 607711009
Species
Properties
Test
Purity Application Vehicle
compound
route
[%]
TPT-OH
97.3
corn oil
Test
duration
Exposure time Criterion Test endpoint
Rat
(age, sex)
pregnant female
20 days
TPT-Ac
gavage
aqueous
suspension
corn oil
21 days
Rat
pregnant female,
200 g
pregnant female
Rat
pregnant female
TPT-OH
gavage
corn oil
20 days
day 5 to 19
gestation
day 6 to 15
gestation
day 6 to 15
gestation
day 5 to 15
gestation
Rat
pregnant female
TPT-OH
gavage
Rat
Rat
10-11 weeks, 225- TPT-OH
334 g
pregnant female
TPT-Cl
Rat
pregnant female
Rat
Rat
TPT-OH
gavage
97.1
of
NOAEL
maternal toxicity
Criterion –
oral dosing
[mg/kgb.w./d]
2.8
of
NOAEL
maternal toxicity
5
100
86
2
of
NOAEL
maternal toxicity
1
20
19
2
4
Giavini et al.
(1980)
US EPA (1985)
of
NOAEL
5
100
95
3
5
US EPA (1991a)
20 days
day 7 to 20 of
gestation
NOAEL
4
80
76
2
4
US EPA (1991a)
day 6 to 20 of
gestation
first three days
of gastation
day 0 to 3 of
gestation
day 4 to 6 of
gestation
day 7-17 of
gestation
5 weeks
NOAEL
2.5
50
48
2
4
US EPA (2005)
NOAEL
maternal
toxicity/embryo
toxicity
maternal
toxicity/embryo
toxicity
maternal
toxicity/reproduction
pregnancy rate
< 4.7
< 94
< 86
2
NOAEL
reproduction
3.1
62
59
2
Ema and Miyawaki
(2001)
Ema et al. (1997)
NOAEL
reproduction
6.3
126
120
2
Ema et al. (1997)
NOAEL
embryo toxicity
3
60
57
2
Noda et a. (1991)
NOAEL
mortality
5
100
95
3
7
NOAEL
maternal toxicity
< 13
< 260
< 247
3
1
NOAEL
NOEC
body weight
body weight gain
≥25
20
≥24
19
2
2
1
4
Attahiru et a.
(1991)
Chernoff et al.
(1990)
Vos et al. (1984)
US EPA (1986)
body weight, food
and water
consumption
bodyweight/food
consumption
5
4.8
2
4
US EPA (1989)
20
19
2
4
US EPA (2004)
mortality
mortality
reproduction
reproduction
reproduction
5
5
5
50
5
4.8
4.8
4.8
48
4.8
4
2
2
4
2
4
4
6
4
WHO (1999)
US EPA (1991b)
US EPA (1987c)
US EPA (1991a)
US EPA (1991a)
20 days
97.5
gavage
corn oil
85 days
98
gavage
olive oil
9 days
TPT-Cl
gavage
olive oil
20 days
pregnant female
TPT-Cl
gavage
olive oil
20 days
Rat
pregnant female
TPT-Ac
gavage
olive oil
20 days
Rat
male and female
TPT-Ac
gavage
5 weeks
Rat
pregnant female
TPT-OH
gavage
5% tween
solution
corn oil
Rat
Rat
male, 3-4 weeks
TPT-OH
4-5 weeks, males
TPT-OH
92-117 g, females
71-95 g
male and female, 5 TPT-OH
weeks
> 96
97.2
diet
diet
3 weeks
17 weeks
day 6 to 15 of
gestation
3 weeks
13 weeks
97
diet
2 years
2 years
NOEC
44 days, males
TPT-OH
167-232 g, females
132-177 g
male and female
TPT-OH
male and female
TPT-OH
TPT-OH
male and female
TPT
male and female
TPT-OH
96
diet
91 days
91 days
NOEC
diet
diet
diet
diet
diet
2
2
2
1
2
Rat
Rat
Rat
Rat
Rat
Rat
Rat
100
97.2
20 days
gen
years
gen
gen
gen
2 years
NOEC
NOEC
NOEC
NOEC
NOEC
Criterion diet
[mg/kgdiet]
22.4
Criterion – Ri Notes Reference
diet – TPT+
[mg/kgdiet]
21
2 4
US EPA (1982)
Page 73 of 74
RIVM Report 607711009
Species
Properties
Test
duration
Exposure time Criterion Test endpoint
(age, sex)
male and female
Test
Purity Application Vehicle
compound
route
[%]
TPT-OH
97.1
diet
Rat
90 days
90 days
NOEC
growth
Rat
male and female
TPT-Ac
95-96 diet
90 days
90 days
NOEC
growth
10
Rat
TPT-OH
diet
90 days
90 days
NOEC
mortality
< 1000
TPT-OH
diet
90 days
90 days
NOEC
mortality
100
95
2
Rat
Rat
male and female,
21 days
male and female,
2-3 months
male
male, 4-5 weeks
Criterion – Ri Notes Reference
diet – TPT+
[mg/kgdiet]
24
2
Verschuuren et al.
(1966)
9.5
2
Verschuuren et al.
(1966)
< 950
2
Winek et al. (1978)
TPT-Cl
TPT-OH
>98
tg
diet
diet
2 weeks
99 days
2 weeks
99 days
NOEC
NOEC
15
100
14
95
2
2
Rat
male, 8-9 weeks
TPT-OH
tg
diet/gavage peanut oil
276 days
276 days
NOEC
body weight
body weight/food
consumption
male fertility
50
48
Sheep
male, 5-6 months
TPT-Ac
gelatin
capsule
70 days
70 days
NOAEL
body weight gain
8 days
21 weeks
20 weeks
6 weeks
5 days
21 weeks
20 weeks
6 weeks
LC50
NOEC
NOEC
NOEC
21 weeks
25 weeks
8 days
5 days
21 weeks
20 weeks
5 days
5 days
NOEC
NOEC
LC50
LC50
mortality
reproduction
reproduction
egg
production/hatching
reproduction
reproduction
mortality
Rat
Birds
Bobwhite
Bobwhite
Bobwhite
Japanese
quail 12 days
quail 20 weeks
quail 18 weeks
quail
Malard duck
Malard duck
Mallard duck
Mallard duck
16
18
14
10
weeks
weeks
days
days
TPT-OH
TPT-OH
TPT-OH
TPT-OH
97.1
97.2
97.9
> 99
diet
diet
diet
diet
TPT-OH
TPT-OH
TPT-OH
TPT-OH
formulation
97.2
97.9
96
40%
diet
diet
diet
diet
corn oil
corn oil
Notes
1
Only one concentration tested.
2
Summary in DAR not available; data from overview.
3
Summary in the DAR sufficient to evaluate the study.
4
Summary in EPA document sufficient to evaluate the study.
5
Considered irreliable because of an unexplained inconsistency between data in the report.
6
Summary in EPA document too brief to evaluate the study.
7
Unclear if reported mortality is related to the substance.
8
No conversion factor to food available.
9
Other effects than mortality not reported.
10 During the mating period, the animals were dosed through a gavage.
Page 74 of 74
Criterion –
Criterion oral dosing
diet
[mg/kgb.w./d] [mg/kgdiet]
25
≥ 7.5
9
Winek et al. (1978)
2
10
2
8
Snoeij et al. (1985)
Gaines and
Kimbrough (1968)
Gaines and
Kimbrough (1968)
Dacasto et al.
(1994)
253
10
3
3
240
9.5
2.9
2.9
2
2
2
2
3
3
3
EC (1996a, 1996b)
EC (1996a, 1996b)
EC (1996a, 1996b)
Grote et al. (2006)
> 10
3
533
168.4
> 9.5
2.9
506
160
2
2
2
2
3
3
3
4
EC (1996a, 1996b)
EC (1996a, 1996b)
EC (1996a, 1996b)
US EPA (1987a)
Environmental risk limits for organotin
compounds
RIVM report 607711009/2012
R. van Herwijnen
National Institute for Public Health
and the Environment
P.O. Box 1 | 3720 BA Bilthoven
www.rivm.com
© Copyright 2026 Paperzz