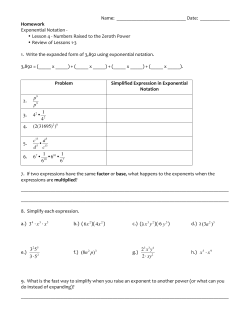
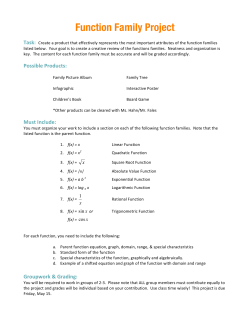
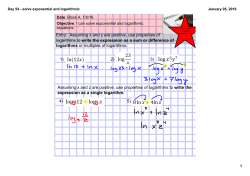
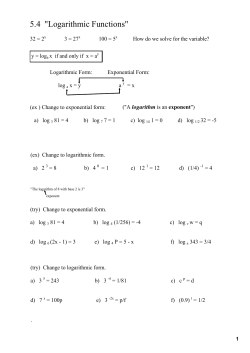
Chapter 43 Populations and Exponential Population Growth Population – Group of individuals of a single species living in the same general area Population ecology studies: –Density –Distribution –Age structure –Variations in population size Population density –#of individuals per unit area or volume Population size –Total # of individuals in a population –This is usually estimated using density and distribution Life Tables Survivorship Curves graphic way of representing the data in a life table Number of survivors (log scale) 1000 100 Females 10 Males 1 0 2 4 6 Age (years) 8 10 Survivorship Curves the survivorship curves for: – Oysters – Squirrels – Humans % of Survivors Predict % of maximum life span Survivorship Curves Three types:Type I, Type II, and Type III 1,000 I Number of survivors (log scale) 100 II 10 III 1 0 50 Percentage of maximum life span 100 Reproductive Table REPRODUCTIVE STRATEGIES semelparous species – “big-bang” reproduction – Reproduce a single time and die – Must be synchronized (do you know why?) Figure 52.6 Iteroparous species – produce offspring repeatedly over time Why? Likely explanation is that semelparous species have a high adult mortality. It’s better to put all of one’s reproductive effort in early, while still alive. Parents surviving the following winter (%) “Trade-offs” and Life Histories 100 Male Female 80 60 40 20 0 Reduced brood size Normal brood size Enlarged brood size “Trade-offs” and Life Histories Strategy #1: Many, small seeds What are the “trade-offs”? (a) Most weedy plants, such as this dandelion, grow quickly and produce a large number of seeds, ensuring that at least some will grow into plants and eventually produce seeds themselves. Figure 52.8a “Trade-offs” and Life Histories Strategy #2: Few, large seeds What are the “trade-offs”? (b) Some plants, such as this coconut palm, produce a moderate number of very large seeds. The large endosperm provides nutrients for the embryo, an adaptation that helps ensure the success of a relatively large fraction of offspring. Figure 52.8b POPULATION GROWTH Population Growth Population growth (ignores immigration and emigration) dN dt # births - # deaths Population Growth Zero population growth population growth curve 30 25 B=D N 20 15 N 10 5 0 1 2 3 4 time 5 6 7 Exponential population growth Occurs under ideal conditions Under these conditions the rate of reproduction is at its maximum (rmax) Exponential Growth Equation: Nt+1 = Nt + rmaxNt N = population size t = generation rmax = max reproductive rate Exponential Growth Exponential population growth J-shaped curve 2,000 r=1 r = 0.5 Population size (N) 1,500 1,000 500 0 0 10 5 Number of generations 15 Exponential Growth Characteristic of rebounding populations 8,000 Elephant population 6,000 4,000 2,000 0 1900 1920 1940 Year 1960 1980 END OF PART 1
© Copyright 2026 Paperzz