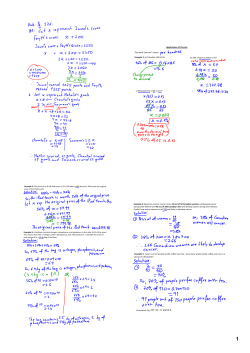
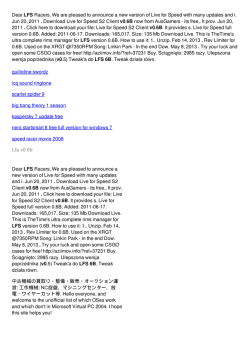
Demonstrate the value of a long-term investment strategy
1-888-4-CHARTS
Risk and Return
www.andexcharts.com
1-year periods (727)
Positive Returns
74.6%
77.9%
82.4%
80.2%
3-year periods (703)
100%
88.9%
83.8%
94.2%
90.2%
5-year periods (679)
100%
98.7%
86.5%
100%
10-year periods (619)
97.5%
100%
100%
94.0%
100%
100%
20-year periods (499)
100%
100%
100%
100%
100%
30-year periods (379)
100%
100%
100%
100%
100%
100%
This number represents the percentage of positive returns.
90%
Jun 83
86.9%
$187
90%
85%
80%
75%
70%
65%
Jul 83
56.8%
$157
60%
Jun 83
50.8%
$151
55%
Jun 83
55.6%
$156
It’s About Time
An analysis of rolling 1, 3, 5, 10, 20 and 30-year periods
January 1, 1950 – June 30, 2011
The bar charts below show how rates of return from
74.6% of the time—that’s 542 of the 727 rolling 1-year
various asset categories have varied over many
different holding periods. In the past, longer holding
periods since 1950. Of all of those 1-year periods,
$187—a gain of 86.9%.
An initial $100 invested in Canadian stocks
on November 1, 1977 grew to $3,599 by October 31,
By contrast, buying and holding Canadian stocks for a
2007— a compound return of 12.7% per year.
periods have generally resulted in a lower likelihood
the worst for Canadian stocks ended on June 30, 1982.
That year saw Canadian stocks turn an initial $100
full 30 years—starting at anytime since 1950—would
of loss.
investment into $61—a loss of 39.2%. Interestingly,
The worst 30-year period extended from July 1, 1952
through June 30, 1982—during which a $100 initial
For example, an investor holding Canadian stocks
the best year for Canadian stocks began immediately
have produced positive returns (i.e. no losses) in each
of the 379 rolling 30-year periods. October 31, 2007
for just one year has historically made money
thereafter—ending on June 30, 1983. That year saw
marked the end of the best 30-year period since 1950.
Graph Legend
85%
80%
Canadian stocks turn an intial $100 investment into
S&P/TSX Composite Total Return Index
U.S. Large Stock Total Return Index in CAD
Hypothetical Moderate Portfolio
DEX Long Bond Index
investment grew at a rate of 8.6% per year for an
5 Year Guaranteed Investment Certificates
ending value of $1,204.
70%
65%
60%
55%
50%
50%
45%
Nov 80
39.3%
$270
40%
35%
40%
Jul 87
30.4%
$222
Jun 85
28.9%
$214
Jul 87
31.1%
$388
Jul 87
27.8%
$340
Positive returns
35%
Jul 87
27.8%
$340
Sep 86
26.6%
$325
25%
Jun 82
17.5%
$118
20%
Aug 87
19.5%
$594
Jan 83
15.0%
$152
15%
Oct 84
13.9%
$192
Oct 00
22.7%
$771
Aug 87
18.6%
$552
Sep 91
18.3%
$538
Oct 97
14.1%
$1,408
Jun 89
12.3%
$319
Mar 00
19.4%
$3,470
5%
0%
$107
2.2%
Jun 11
$102
1.9%
Mar 10
$82
$79
–6.5%
–7.7%
Mar 03
Sep 81
(10%)
(15%)
$84
–15.9%
Sep 81
(20%)
(25%)
$70
–11.1%
Aug 03
$132
2.8%
Aug 10
$125
2.3%
Jun 10
$60
–5.1%
Feb 09
$68
–7.5%
Feb 09
$110
1.0%
Dec 59
$133
2.9%
Jun 11
$243
4.5%
Jun 11
55%
25%
50%
Jul 96
9.8%
$1,673
$659
6.5%
Dec 79
$269
3.4%
Sep 81
15%
89.1%
92.5%
94.4%
Jul 83
10%
Hypothetical Moderate Portfolio
56.8%
$157
If each monthly return is ranked from highest
to lowest, the median figure is that which
falls in the middle of the entire series.
Other 90%
Most Recent Return
Worst 5%
$102
0.4%
Feb 09
This shows the return for each asset class
over the most recent holding period (ending
June 30, 2011).
30% Bonds
10% Cash
100%
100%
100%
100%
100%
100%
100%
100%
55%
An analysis of rolling 1, 3, 5, 10, 20 and 30-year periods
January 1, 1950 - June 30, 2011
50%
40%
Jul 87
30.4%
$222
Jun 85
25.5%
$198
35%
Jul 87
29.6%
$365
Jul 87
27.8%
$340
30%
Sep 86
22.0%
$270
Aug 87
21.1%
$678
20%
25%
Aug 87
18.6%
$552
0%
Sep 91
16.0%
$441
Feb 98
16.3%
$2,051
Beginning of Period
Order of Period
1st Rolling period
Feb 1, 50
2nd
Mar 1, 50
3rd
727th
Assumes reinvestment of all income and no transaction costs or taxes. This is for illustrative purposes only and not indicative of any investment. An investment cannot be made directly in an index. Past performance is no guarantee of future results. Government bonds and Treasury bills are guaranteed by the full faith and credit of the Canadian government as to the timely payment of principal and interest,
while stocks are not guaranteed and have been more volatile than the other asset classes. International investments involve special risks such as fluctuations in currency, foreign taxation, economic and political risks, liquidity risks, and differences in accounting and financial standards. Source: U.S. Large Stocks—represented by the Standard and Poor’s 90® index from 1950 through February 1957 and the
S&P 500 index thereafter, which is an unmanaged group of securities and considered to be representative of the U.S. stock market in general; S&P/TSX Composite—Canadian Financial Markets Research Center for 1950–1955 and Standard and Poor’s/TSX Composite Index total return series thereafter, which replaced the TSE300 Total Return Index on May 1, 2002; World Markets ex-U.S.—Global Financial
Data for 1950–1969 and Morgan Stanley Capital International (MSCI) World ex-U.S. Index thereafter; DEX Long Bond Index—PC-Bond, a business unit of TSX, Inc.; 5 Year Guaranteed Investment Certificates—Bank of Canada; Cash—90 Day Canada Treasury Bills, Bank of Canada. ©2011 Morningstar. All Rights Reserved.
Feb 98
15.1%
$1,656
Mar 00
13.4%
$1,227
10%
(25%)
Jan 1, 50
months: J F M A M J J A S O N D J F M
100%
15%
Rolling Periods
The Moderate Portfolio was created for illustrative
purposes only. It is neither a recommendation,
nor an actual porfolio. Trading costs, expenses and
taxes were ignored. All income was reinvested and
the portfolio was rebalanced every 12 months.
100%
Hypothetical Portfolios
45%
Jul 87
32.3%
$231
25%
5%
(5%)
Rolling periods are periods of consecutive months (e.g. 12 months)
with new periods beginning on the first day of each month.
20% Canadian Stocks
20% U.S. Large Stocks
20% World ex-U.S. Stocks
100%
60%
30%
(10%)
Median Return
99.0%
Jun 83
48.6%
$149
5%
0%
$102
0.6%
Feb 09
(5%)
Understanding the Graph
100%
Jun 83
50.8%
$151
35%
(20%)
Best 5%
$61
$60
–39.2%
–40.2%
Jun 82
Sep 74
82.1%
Jul 83
57.7%
$158
40%
$60
–15.7%
Mar 03
(35%)
80.1%
20%
(15%)
$76
–24.2%
Sep 74
(30%)
$102
$95
0.4%
Feb 09 –1.0%
Sep 59
$91
–1.9%
Mar 03
$114
2.6%
Jun 11
$387
$338
$334
7.0%
6.3%
6.2%
Dec 74
Dec 74 $154
May 77
2.2%
Dec 69
$1,661
$1,204 9.8% $1,120
8.6% Nov 10 8.4%
Jun 82
Sep 81
60%
30%
45%
Jun 00
15.9%
Oct 07 $8,410 Jun 00
13.4% May 11
12.7%
$4,357 11.8%
$3,599
$2,870
Feb 98 Sep 01
15.1% 14.6%
$1,656 $1,534 Jun 92
11.1%
$815
10%
(5%)
Risk and Return
45%
Apr 98
34.4%
$243
30%
(40%)
75%
$82
–2.0%
(35%)
$111
1.1%
Jun 10
$125
2.3%
Jun 10
$139
3.3%
Sep 74
$236
4.4%
Sep 74
20%
Sep 05
11.4%
$2,570
$74
–9.6%
Mar 03
(15%)
$484
5.4%
Sep 81
Sep 74
(25%)
0%
(10%)
Understanding the Graph
Jul 83
56.8%
$157
Best 5%
$76
Other 90%
Sep 74
Worst 5%
–24.2%
5%
(5%)
Mar 03
–11.6%
(20%)
15%
10%
$1,120
8.4%
Sep 81
–6.5%
(10%)
(30%)
(40%)
$108
1.6%
May 70
$338
6.3%
Dec 74
$1,820
10.2%
Jul 82
Jun 00
13.4%
$4,357
Feb 09
$88
(30%)
$102
0.4%
Feb 09
$90
$402
7.2%
Feb 09
Jun 00
14.6%
$5,900
If each monthly return is ranked from highest
to lowest, the median figure is that which
falls in the middle of the entire series.
Most Recent Return
$70
$102
0.4%
Sep 74
Feb 09
–29.7%
Hypothetical portfolios were created for illustrative purposes only. They are neither a recommendation, nor actual portfolios. All income was
reinvested and the portfolios were rebalanced every 12 months. Assumes no transaction costs or taxes. Past performance is no guarantee of
future results. Source: In addition to the asset classes presented inside the handout, U.S. Small Stocks are represented by the fifth
Aggressive
Moderate
Conservative
25% Canadian Stocks
25% U.S. Stocks
10% U.S. Small Stocks
20% World ex-U.S. Stocks
20% Canadian Stocks
20% U.S. Stocks
20% World ex-U.S. Stocks
10% Canadian Stocks
10% U.S. Stocks
(15%)
Median Return
This shows the return for each asset class
over the most recent holding period (ending
June 30, 2011).
(20%)
15% Bonds
5% Cash
30% Bonds
10% Cash
60% Bonds
20% Cash
(25%)
(30%)
capitalization quintile of stocks on the NYSE for 1950–1981 and the performance of the Dimensional Fund Advisors, Inc. U.S. Micro Cap
Portfolio thereafter. ©2011 Morningstar. All Rights Reserved.
Bonus Graph: Risk and Return Analysis
Handout (8.5”x11” opens to 11”x 16.5”)
Risk and Return Chart
Product Information
Illustrating the performance of Canadian and U.S. stocks, bonds, and
fixed-term investments over several holding periods since 1950,
the Morningstar® Risk and Return Chart helps advisors set appropriate
investment expectations by highlighting the range of potential returns
in a client’s portfolio.
Key Features
1 Depicts the range of compound annual returns
for four asset classes over one-, three-, five-,
ten-, 20-, and 30-year holding periods
1 Asset classes include the S&P 500, S&P/TSX,
Key Uses
1 Arm sales, advisors, and broker teams with
professionally designed, independent investment analysis
1 Validate portfolio recommendations and
DEX Long Bond Index, and 5-Year GICs
demonstrate sound investment strategies
1 Updated with June 2012 month-end data
1 Set appropriate investment expectations by
1 Bonus Graph: Risk and Return Analysis
(Hypothetical Portfolios)
Illustrates the range of compound annual returns
for three hypothetical portfolios (Aggressive,
Moderate, and Conservative) over one-, three-,
five-, ten-, 20-, and 30-year holding periods
Available in English and French
Customization options for orders of 500+
Purchase Information
For complete 2012 chart pricing, please refer to the backside.
Order Today!
Call +1 888 4-CHARTS (+1 888 424-2787)
Visit
English: http://global.morningstar.com/CA/RiskEng
French: http://global.morningstar.com/CA/RiskFR
Bulk discounts available! Order more, save more!
highlighting historical market trends
1 Satisfy clients’ hunger for reliable investment
education and insight
© 2012 Morningstar, Inc. All rights reserved. 1 Toronto Street, Suite 500,
Toronto, Ontario M5C 2W4. The Morningstar name and logo are trademarks of Morningstar, Inc. Past performance is no guarantee of future
results. Images are for illustrative purposes only and are not indicative
of any investment.
Risk and Return Chart
Order Today!
Standard Pricing
Call +1 888 4-CHARTS (+1 888 424-2787)
Visit English: http://global.morningstar.com/CA/RiskEng
French: http://global.morningstar.com/CA/RiskFR
QuantityHandout
1
$16.50
2-9
$13.75
10-49
$9.90
50-99
$8.25
100-499
$5.50
500-999
$3.30
1,000-9,999
$2.20
10,000-19,999
$1.65
20,000-49,000
$1.30
50,000-74,999
$1.10
75,000-99,000
$0.95
100,000+
Call for Quote
Bulk discounts available. Order more, save more!
d. Add firm specific disclosure
Imprint:
2
The Risk and Return Chart can be purchased off
the shelf, or can incorporate as much or as little
customization to match firm specific branding
standards.
Front and back cover personalization
a. Add firm name, logo, email, phone number,
address, website, and more
b. Include a brief bio about your firm and
highlight information about its history, products,
and services
c. Summarize key points and tie action steps
to data outlined within the chart, offer product
solutions, or discuss particular investment
strategies
1
Customize:
_
_______
____________
_________________
_________________________________
_
_
_ _ _ _ _ _
________________________________
_____________________________________
___________________________________________________________
______________________________________
________________________________
_________________________
__________________
____________
_____
Alter portfolios, and add, remove, or substitute
an index
ABCo.
3
2
Risk and Return
1-year periods (727)
Positive Returns
74.6%
77.9%
82.4%
80.2%
3-year periods (703)
100%
___
________
______________
___________________
____________________________________
_
_
_
_______ ____________________
_____________________________________
___________________________________________________________
______________________________________
________________________________
_________________________
__________________
____________
_____
Personalization Options
88.9%
83.8%
94.2%
90.2%
5-year periods (679)
100%
98.7%
86.5%
100%
97.5%
ABCo.
100%
94.0%
100%
Minimum quantity required.
Imprinting = 500
Customization = 1,000
1-888-4-CHARTS
www.andexcharts.com
10-year periods (619)
100%
For complete customization options, please call
a member of our sales team. Custom analysis
and design fees may be applicable.
100%
20-year periods (499)
100%
100%
100%
100%
100%
30-year periods (379)
100%
100%
100%
100%
100%
100%
This number represents the percentage of positive returns.
Jun 83
86.9%
$187
65%
Jun 83
50.8%
$151
55%
For example, an investor holding Canadian stocks
for just one year has historically made money
Jun 83
55.6%
$156
By contrast, buying and holding Canadian stocks for a
full 30 years—starting at anytime since 1950—would
have produced positive returns (i.e. no losses) in each
of the 379 rolling 30-year periods. October 31, 2007
marked the end of the best 30-year period since 1950.
U.S. Large Stock Total Return Index in CAD
DEX Long Bond Index
5 Year Guaranteed Investment Certificates
50%
60%
65%
60%
Risk and Return
55%
$84
–15.9%
Sep 81
(20%)
(25%)
$76
–24.2%
Sep 74
(30%)
$70
–11.1%
Aug 03
0%
(5%)
(10%)
(20%)
Hypothetical Moderate Portfolio
Understanding the Graph
Jul 83
56.8%
$157
If each monthly return is ranked from highest
to lowest, the median figure is that which
falls in the middle of the entire series.
Most Recent Return
Worst 5%
$102
0.4%
Feb 09
Rolling Periods
This shows the return for each asset class
over the most recent holding period (ending
June 30, 2011).
(25%)
Rolling periods are periods of consecutive months (e.g. 12 months)
with new periods beginning on the first day of each month.
Median Return
20% Canadian Stocks
20% U.S. Large Stocks
20% World ex-U.S. Stocks
The Moderate Portfolio was created for illustrative
purposes only. It is neither a recommendation,
nor an actual porfolio. Trading costs, expenses and
taxes were ignored. All income was reinvested and
the portfolio was rebalanced every 12 months.
30% Bonds
10% Cash
Beginning of Period
Order of Period
Jan 1, 50
1st Rolling period
Feb 1, 50
2nd
Mar 1, 50
3rd
months: J F M A M J J A S O N D J F M
(30%)
ABCo.
sdfsRerum quae pligendissi odicaborum es dis eate cum lam nonOptature cusant hit
labo. Et ut quam volupta tiaest ut parum consente occatur, solo te liqui restrum ad
(35%)
(40%)
727th
qui volorem debis et quiasi apistincto eossequ iduciti dolum sit omnisto repudiam,
quo blabo. Es dolorer citius, sequat es represecest
sdfsRerum quae pligendissi odicaborum es dis eate cum lam nonOptature cusant hit
Assumes reinvestment of all income and no transaction costs or taxes. This is for illustrative purposes only and not indicative of any investment. An investment cannot be made directly in an index. Past performance is no guarantee of future results. Government bonds and Treasury bills are guaranteed by the full faith and credit of the Canadian government as to the timely payment of principal and interest,
while stocks are not guaranteed and have been more volatile than the other asset classes. International investments involve special risks such as fluctuations in currency, foreign taxation, economic and political risks, liquidity risks, and differences in accounting and financial standards. Source: U.S. Large Stocks—represented by the Standard and Poor’s 90® index from 1950 through February 1957 and the
S&P 500 index thereafter, which is an unmanaged group of securities and considered to be representative of the U.S. stock market in general; S&P/TSX Composite—Canadian Financial Markets Research Center for 1950–1955 and Standard and Poor’s/TSX Composite Index total return series thereafter, which replaced the TSE300 Total Return Index on May 1, 2002; World Markets ex-U.S.—Global Financial
Data for 1950–1969 and Morgan Stanley Capital International (MSCI) World ex-U.S. Index thereafter; DEX Long Bond Index—PC-Bond, a business unit of TSX, Inc.; 5 Year Guaranteed Investment Certificates—Bank of Canada; Cash—90 Day Canada Treasury Bills, Bank of Canada. ©2011 Morningstar. All Rights Reserved.
ABCo.
labo. Et ut quam volupta tiaest ut parum consente occatur, solo te liqui restrum ad
qui volorem debis et quiasi apistincto eossequ iduciti dolum sit omnisto repudiam,
___
________
______________
___________________
____________________________________
_
_
_
_______ ____________________
_____________________________________
___________________________________________________________
______________________________________
________________________________
_________________________
__________________
____________
_____
quo blabo. Es dolorer citius, sequat es represecest
ABCo.
Outside (Front and Back)
2
100%
100%
100%
100%
10-year periods (619)
10%
100%
5%
$269
3.4%
Sep 81
(15%)
Other 90%
$61
$60
–39.2%
–40.2%
Jun 82
Sep 74
$243
4.5%
Jun 11
$60
–15.7%
Mar 03
Best 5%
(35%)
$133
2.9%
Jun 11
50%
(15%)
$60
–5.1%
Feb 09
$110
1.0%
Dec 59
An analysis of rolling 1, 3, 5, 10, 20 and 30-year periods
January 1, 1950 - June 30, 2011
(10%)
$68
–7.5%
Feb 09
$125
2.3%
Jun 10
15%
$659
6.5%
Dec 79
Hypothetical Portfolios
$82
$79
–6.5%
–7.7%
Mar 03
Sep 81
$91
–1.9%
Mar 03
$132
2.8%
Aug 10
ABCo.
Jul 96
9.8%
$1,673
Jun 83
48.6%
$149
(5%)
$114
2.6%
$102
$95
Jun 11
0.4%
Feb 09 –1.0%
Sep 59
$1,661
$1,204 9.8% $1,120
8.6% Nov 10 8.4%
Jun 82
Sep 81
55%
$107
2.2%
Jun 11
$102
1.9%
Mar 10
20-year periods (499)
Jun 83
50.8%
$151
$387
$338
$334
7.0%
6.3%
6.2%
Dec 74
Dec 74 $154
May 77
2.2%
Dec 69
_____
__________
________________
______________________________
_
_
_
_
_ _ _ _ __ __ _ __ __
________________________________
_____________________________________
___________________________________________________________
______________________________________
________________________________
_________________________
__________________
____________
_____
0%
10-year periods (619)
100%
10%
5%
5-year periods (679)
20%
100%
Jun 89
12.3%
$319
3-year periods (703)
25%
Jun 00
15.9%
Oct 07 $8,410 Jun 00
13.4% May 11
12.7%
$4,357 11.8%
$3,599
$2,870
Feb 98 Sep 01
15.1% 14.6%
$1,656 $1,534 Jun 92
11.1%
$815
5-year periods (679)
Oct 97
14.1%
$1,408
99.0%
Sep 91
18.3%
$538
100%
15%
Oct 84
13.9%
$192
30%
1-year periods (727)
Mar 00
19.4%
$3,470
94.2%
Jan 83
15.0%
$152
Oct 00
22.7%
$771
Aug 87
18.6%
$552
3-year periods (703)
Jun 82
17.5%
$118
20%
Aug 87
19.5%
$594
91.9%
1
25%
89.3%
Sep 86
26.6%
$325
100%
35%
Jul 87
27.8%
$340
82.4%
Jul 87
27.8%
$340
1-year periods (727)
Jun 85
28.9%
$214
80.5%
Jul 83
57.7%
$158
30%
40%
Jul 87
30.4%
$222
Jul 87
31.1%
$388
60%
35%
45%
Apr 98
34.4%
$243
Positive returns
Nov 80
39.3%
$270
_
_______
_________________
_
_
_
_
_ _ _ _ __ __
_______________________
_________________________________________
_
_
_ _ _ _ _ _ _
_____________________________________
___________________________________________________________
______________________________________
________________________________
_________________________
__________________
____________
_____
45%
20-year periods (499)
50%
40%
Inside
+1 888 4-CHARTS
www.andexcharts.com
70%
Hypothetical Moderate Portfolio
50%
(40%)
1 Toronto Street, Suite 500
Toronto, Ontario M5C 2W4
75%
2011 Risk and Return
60%
Jul 83
56.8%
$157
S&P/TSX Composite Total Return Index
An initial $100 invested in Canadian stocks
on November 1, 1977 grew to $3,599 by October 31,
2007— a compound return of 12.7% per year.
The worst 30-year period extended from July 1, 1952
through June 30, 1982—during which a $100 initial
investment grew at a rate of 8.6% per year for an
ending value of $1,204.
100%
70%
85%
80%
Canadian stocks turn an intial $100 investment into
$187—a gain of 86.9%.
100%
75%
74.6% of the time—that’s 542 of the 727 rolling 1-year
periods since 1950. Of all of those 1-year periods,
the worst for Canadian stocks ended on June 30, 1982.
That year saw Canadian stocks turn an initial $100
investment into $61—a loss of 39.2%. Interestingly,
the best year for Canadian stocks began immediately
thereafter—ending on June 30, 1983. That year saw
30-year periods (379)
The bar charts below show how rates of return from
various asset categories have varied over many
different holding periods. In the past, longer holding
periods have generally resulted in a lower likelihood
of loss.
100%
80%
Graph Legend
An analysis of rolling 1, 3, 5, 10, 20 and 30-year periods
January 1, 1950 – June 30, 2011
55%
90%
It’s About Time
85%
_
_______
____________
_________________________
_
_
_ _ _ _ _
__________________________
________________________________
_____________________________________
___________________________________________________________
______________________________________
________________________________
_________________________
__________________
____________
_____
90%
© Copyright 2026 Paperzz