PALEOCEANOGRAPHY,VOL. 10, NO. 3, PAGES593-610,JUNE 1995
Sortablesilt and fine sedimentsize/composition
slicing:
Parametersfor palaeocurrent
speedandpalaeoceanography
I. N. McCave,B. Manighetti,andS. G. Robinson
Department
ofEarthSciences,
University
ofCambridge,
Cambridge,
England,
UnitedKingdom
Abstract.Finesediment
size(< 63 Ixm)isbestmeasured
bya sedimentation
technique
whichrecordsthewholesizedistribution.
Repeatedsizemeasurement
with
intermediate
steps
ofremoval
ofcomponents
bydissolution,
allows
inference
of thesize
distribution
of theremoved
component
aswellastheresidue.In thisway,thesizeof
thebiogenic
andlithogenic
(noncarbonate)
fractions
canbedetermined.
Observations
of manysizedistributions
suggest
a minimum
in grainsizefrequency
curves
at 8 to 10
Ixm.The dynamics
of sediment
erosion,
deposition,
andaggregate
breakup
suggest
that
finesediment
behavior
is dominantly
cohesive
below10-1xm
grainsize,.andnoncohesive
abovethat size. Thussilt coarserthan10 Ixmdisplays
sizesortingin response
to
hydrodynamlc
processes
anditsproperties
maybeusedto infercurrent
speed.Siltthat
isf'merthan10 Ixmbehaves
in thesamewayasclay(< 2 !xm).Usefulparameters
of the
distribution
are the10-63Ixmmeansizeandthepercentage
10-63Ixmin thefine
fraction.We cannotusesizedistributions
to distinguish
the natureof the currents.
Therefore,
to inferwatermassadvection
speeds
(i.e.,themeankineticenergyof the
flow,Ku),regions
ofhigheddykinetic
energy
(KE)mustbeavoided.
At thepresent,
suchabyssal
regions
lie underthehighsurface
KEof majorcurrent
systems:
Gulf
Stream,Kuroshio,
Agulhas,
AntarcticCircmpolarCurrent,andBrazil/Falldand
currents
in theArgentheBasin.Thisis probably
a satisfactory
guidefor the
Pleistocene.
With regardto thecarbonate
subfraction
of thesizespectrum,
sizemodes
dueto bothcocco!iths
andforamlnlferal
fragments
canbe recognized
andanalyzed,
withtheboundary
betweenthemagainat about10 l•m. The fluxof lessthan10 l•m
carbonate,
at pelagicsitesabovethelysocline,
is anothercandidate
for a productivity
indicator.
Introduction
Use of the distributionof sedimentcomponents
as
a functionof grainsizeand of sizeparametersfor the
inferenceof currentstrengthhasbeencommonplace
in
marinegeologyfor sand-sizedmaterial. "Coarse-fraction"analyses
(generallymaterial>63 or > 150 •m in
diameter)are madeon selectedsizefractionsbecause
the screeningprocedureresultsin greaterprecision
(eliminationof size-dependant
bias) and is easy to
perform using sieves. This applies particularlyto
shallowmarinesedimentsand otherswith an appreci-
iNowat Department
ofEnvironmental
and
Geographical
Sciences,
Manchester
Metropolitan
University,Manchester,
UnitedKingdom.
Copyright1995by the AmericanGeophysical
Union.
Paper number94PA03039.
0883-8305/95/94PA-03039510.00
ablesandfraction. For deep-seapelagicand hemipelagicsediments
the sandfractionis mainlybiogenic(and
is size-fractionated
for isotopicwork). Lithogenic
components
are usuallyeitherice raftedor volcanicin
origin. Proceduresand permissibleinferencesfor
material of this size are well documented in standard
textson sedimentology
and marine geology. Here we
explorenewwaysof obta_ining
andinterpretingcompositional and size data from the fine fractionof deep-sea
sediments. We use the terms "fine fraction" and "mud"
to refer to the total material <63 !xm; "silt"for the
fraction63 to 2 !xm;and "day"for <2 •m material.
Severalattempts
havebeenmadeto providegrainsize parametersthat respondto changesin current
strength. Traditionaltexturaldiagrams(trianglesof
Shepardand Folk) displaygrossaspectsof sortingbut
not in a way that can be usedas an indexof current
strength.In sand-sized
sediments
the characteristics
of
stratification
andbedforms(ripples,dunes,etc.)maybe
usedto estimatepalaeocurrent
strength,
minimumflow
speeds
canbe obtainedfromcriticalerosioncurves,
and
modesof transportand shearstresses
canbe inferred
594
McCAVE ET AL: SORTABLE SILT AND PALEOCURRENT
from the shape of size distributions[Southardand
Boguchwal,1990;Miller et al., 1977;Middleton,1976;
Bridge,1981].Deep-seacurrents
arerarelyableto move
quartzsandbut canin placesmoveforamsandto form
dunes[e.g.,LonsdaleandMallair,1974],andappropriate
criticalcur•eshavealsobeendeveloped
for thismaterial
[Miller and Komar, 1977]. Such occurrences
involve
significant
removalof f'mersediments
to leavea foram
residue,with consequentlow accumulation
rates and
lackof stratigraphic
resolution.Periodsof highcurrent
speedmaythereforebe inferredfromsandsbutwiththe
penaltyof low temporalresolution.Ideally,one needs
semifiveparametersfrom continuously
depositedfine
sediments.As thesenormallyshowfew structures
other
than biological disturbance,size parameters are
reqtfired.
Considerable
effort
in this direction
has been
devotedby Ledbetterandhisassociates
[Ledbetter,
1979,
1986;Johnsonet al., 1988; Haskell et al., 1991; Haskell
Measurement
SPEED
of Fine Grain
Sizes
Broadly, methods of size measurementmay be
dividedinto thosewhichyieldinformationon the whole
size distribution and those for which the information
comesfrom a sizewindowwith upperandlowerlimits.
Wholesalemisunderstanding
hasarisenfromattemptsto
attribute significanceto differencesin parameters
obtainedfor the samesedimentby differentmethods;
for examplewhenthe meanor sortingfrom a Coulter
Counteranalysis
with a 2 to 40 •m windowis compared
witha Sedigraph
analysis
whichhasa 0-63•m window.
The CoulterCounterin thiscasedoesnot "see"the clay
whichmaycomprisea significant
part of the sizespectrum. The problemsare compounded
bymanufacturers
who makeunrealisticclaimsfor the analyticalrangeof
their instruments
(see alsoMcCaveand Syvitsla'
[1991]
and Syvitski[1991]). The bottomline is the following:
(1) measurements
usinga sedimentation
principle(e.g.,
andJohnson,1993]. Their choseninstrumenthasbeen
the Elzoneparticlecounter,and favoredparameterthe
noncarbonate
silt (4 or 5.6 to 63 or 70 •m) meansize.
Comparisonof the late Glacial time trendsshownby
Ledbetter
andBalsam[1985]andHaskellet al. [1991]for
regionsnot far aparton the U.S. EasternMargin shows
a lack of congruence
for inferredcurrentspeedtrends
Size Am
1
•
10
•
SEDIGRAI•h
,•,
;'"
:.. i .•'.'
,,;..
:':
•':l
of the same water mass. It is not clear whether this is
dueto the parameterchosenbeingrelativelyinsensitive,
the influenceof nearbysources,
a differencein the type
of currentrecorded(eddyor meanflow), stratigraphic
ntiscorrelation
or a real spatialdifferencein meanflow
speed. There is a needto examineall of thesefactors,
includingtheparameterization
of sizein relationto flow
speed.
One of the centralproblemsof inferringcurrents
/
2o
•
100
/ -' g.,./
.'.:
' :'.
::::
.%.
A
.:.ß
4'.'
I' / ;1'
'.•,
..•
.:-
.:.•,
i!
::.
:?.
:':.'
B
10
2o
::: ".'! ::: C
•,
';'. ": !.::
1o
"
from size is the influence of source. We seek to elimin-
ate the effectsof sourcein differingways. One is to
determinean externalinput functionand compare
deviations
of the sizetime-trendfromthatof theinput
[Manighetti
and McCave,this issue]. Another is to
i
determine the carbonate and noncarbonate size trends
and look for commonbehavior[Wangand McCave,
1990;Robinsonand McCave,1994]. However,we argue
below that mixing in the delivery systemsresultsin
elimination of systematicsource effects on short
timescales
(orderof 100ka andless).
Size Measurement
:.,::,.:.
5
,
of Fine Sediment
Components
It is possible,by repeatedsize measurement
of a
samplewithremovalof components,
to inferthecompo-
9
7
5
3
Size phi
nent size distributions. Size measurementitself, how-
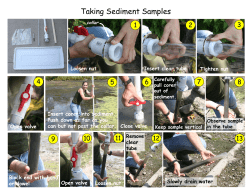
Figure1. Examples
of sizedistributions
measured
by
different
instruments
[fromSinger
etal.,1988,
Agrawal
et
ever,is surprisingly
widelymisunderstood.
a/., 1991]
McCAVIE
ET AL: SORTABLE
SILT AND
PALEOCURRENT
SPEED
595
pipettemethod,Sedigraph)are capableof sensing
the
total amountof material presentand giviaga fairly
Size Distributionsof Components
accuratemeasurement
of the 1 to 100 Ixmsizedistribu-
The size distributionof compositionally
distinct
partsof the sediment
canbe obtainedby determining
tion (butbewareof montmorillonite
[Stein,1985]);(2)
electricalsensing
zonecounters(Coulter,Elzone)give
an accuratemeasurementin the 0.5 to 100 Ixm range,
buttheydonotseeanything
outsidethechosen
window
(e.g.,1 to 40 Ixm,2 to 80 p.m),in particulartheymiss
someof the clay;(3) laserdiffractionsizers(Malvern,
CILAS, Horiba,Fritsch,Coulter,Sympatek)
givea fairly
accuraterepresentation
of the size distributionfor
materialoverabout5 p.mbut againdo not "see"all the
clay(Figure1).
We haveusedtheSedigraph
in thisworkbecause
it
givesthewholesizespectrum
withsatisfactory
resolution
above1 Ixm[Jones
etal., 1988;Coakley
& Syvitsld,
1991].
Althoughseveral
instruments
giveoutputascumulative
curves,we prefer to differentiatetheseto obtainthe
frequency
curves,(n.b.,a cumulative
curveon log-log
the size distribution of the sediment before and after
removal of the componentand determinationof its
amount. The mostobviousone is carbonate.Simply,
the total free fractionis size analyzed,carbonateis
removedgentlyif daysaxeto be analyzed
later(e.g.,by
sodiumacetateor EDTA), andtheamountof carbonate
C (where1> C > 0) isdetermined
ona subsample.
The
size distribution of the residue is then determined. The
sizedistribution
of thecarbonate
is givenbythedifferencebetween
thesizedistribution
of thetotalminus(l-
C) timesthesizedistribution
of theresidue
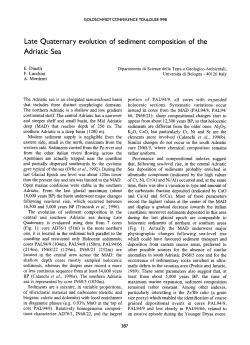
(Figure2).
Formally,in unit massof sediment,
definingthe size
distribution
function
f(dp)asf(dp)= dm/ddp,
where
drn
isthemass
ofparticles
between
size
dpand(dp+ ddp),
then,
axescan concealmostsignificantaspectsof grain-size
f(d•)o = f(an)r - (1-c•(an)•
wherethe subscripts
C, T andR denotethe carbonate
data). One methodof analyzingcomponents
is to
andnoncarbonate
residue,T=
dissectthefrequency
curveintoits component
distribu- fraction,totalsediment
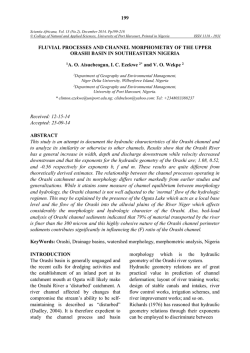
flowchartfor
tionsand to seewhethertheyhavedistinctivecomposi- (C +R)= 1. Figure3 givesthe analytical
requiredto generatethesedata.
tion or other propertiesloser, 1972;vanAndel, 1973]. the operations
Modern computerprograms[e.g.,Sheridanet al., 1987;
PeakFit,1990]allowthisto be doneinteractively.
The Inferenceof Current Speedfrom Particle
Size
Many sizeanalyses
of contourites
madewith different instruments
on samplesfrom severalplacesshowa
minimum in the size distribution be•een
20
104•
•
-
20
about 8 and 10
Ixm[Driscoll et al., 1985; McCave, 1985; Wang •d
McCave, 1990;Massd,1993]. We will review •e
erosionaland depositionalbehaviorof fine sediments
and the nature of deep-seacurrentsto examinethe
possiblesignificance
of •s sizebreakand determine
what parametersfor palaeocurrentinferencehave a
goodexperimentaland theoreticalbasis.
0/25
Sorting
2O
10
•,B
I
2
Sedimentsortingoccursprincipallyduringresuspe
•nsionor depositionby processes
of aggregate
breakup
andparticleselectionaccording
to settling'velocity
and
stress. Sortingtak,• pla• throughdifferingrat,• of
sedimenttra_n•port,
so that
originallyunsorted
•ure
10 ,um
63
100
is converted downstrem into narrower distribu-
tions;residuethat is s•eely moved
at all, andsuccessFigure
2. Size
frequen
cydistributions
ofcomponents
of ive •ures dominatedby tr•port as bed load and
a samplecontaining
65.8%CaCOa.(top) Totalsediment, thenassuspended
load. Thereis a substantial
regionof
(middle) noncarbonate
fraction, Coottom)carbonate overlapbetweenthese populations. The controlling
fraction. Each of the componentsize distributionsis variablesare the criticalerosionstress(%) whichenters
rescaled to 100% of the fraction. On each curve the
into manyformulationsof bed-loadsedimenttransport
percentage
lessthan2 Ixmis indicated.Verticalaxisis rate,thecriticalsuspension
stress(%) which,contraryto
frequency
in percentper • unit.
the supposition
of McCaveandSwift[1976]andMcCave
596
McCAVE ET AL: SORTABLE
SILT AND PALEOCURRENT
SPEED
SAMPLE
CORES
I
(approx
10cm
3)j
SUBSAMPLE[,
.
Approx
0.5g!
IWEIGHI
IWBGHi
IF RESIDUE CONTAINS
> >5% Biosiliceous
(Estimated
from Co. Fract
1
PRETREATMENT(Wet)
Digestorganicmatter
(HeO• / boil/ wash)
GASOMETRIC
CALCIMETRY
(3N Hcl Soln)
aJ3dSmear Slide examination)
[FREEZE
DRYJ
ß
Ultrasonicdispersion;
Overnightagitationin
0.1% Calgon solution
WASH/CENTRIFUGE/I
IIC.arbonate
Conte
FREEZE-DRY/WEIGH
J
, Bulk
Sediment
nt!l
REMOVE
BIO-OPA•
(2NNaOHSolution
I
[WET
Sl/•
(63Hm)
SUBS.
•MPLEL
••,•n'•'•
Piperr,
,-•0.5g
at85øCfor5-8hrs)l
1
DISPERSE
in0.1M SMEAR
SLIDE:[
JCo
Erect
%caco,II
Calgon
solution, MICROSCOPICl
I co.,.t(For-)II
AGITATE
for12hr•I EXAM,INATION
I
,,
Bulk Sediment
%Terrigenous
Content; DERIVE:
I
GAsOMETRIC
..........
%Biosiliceous
,
CALCIMETRY
FineFraction !FurtherCo.Fract.
(3N Hcl Soln)
Composition
'Studies
(Foram
'counts, Stable
,[
::isotope
ratios,
>5%Bio-Opal
Fine Fra•ion
IN RESIDUE
%Carbonate;
!Cd/Ca ratios,etc)i
Bulk Fine
Fraction
DERIVE:
Particle-Size
Coarse Fract.
%Carbonate
Distribution
REMOVE
CaCO3:
Slow
digestion
in
1MAcetic
acidsoln
WASH;
(ForamCarb)
CENTRIFUGE
FREEZE-DRY
WEIGH
'
-•DRY/•
lEIGH[
'"•'"'/.•" '1Toothpick
/ %Coars;
Fractionll
IDRYA
IDRY
,/•VEIGH.I
JSUBSAMPLE•
1,
REMOVE
BIO-OPAL
1(2MNeeCO3Soln.
let85øCfor5 hours)
IDRY./V?EIGH
l
TRIPLE WASH
(neutralisepH) CENTRIFUGE
DERIVE:
Biosiliceous
Fraction >63urn
(Radiolarians)
,
REMOVE
Bio-Opal
1
ß(2MNa2CO
3SolnI
at85•Cfor5 hrs) I
I•ine
F•actiøn
11
.........
%Biosiliceous/I
(Diatoms,
Sponge
]1
Spicules,
Rad,Frags)l
DERIVE:FF
%Terrieo.:
I
:
DISPERSE
in0.1
MI
Calgon
solution,
AGITATE
for12 hrs
Carbonate
%t ....
#2I'
IF
Bio-Opal
<5%
: ISEDIGRAPH
DERIVE:
<10/Jm
....
(= Coccoltths)
,
,
'
Y
Y
¾
..........>.'Fraction
(eg.XRD,i
ß
:XRF, Wet Chem)
,
,
Fine-Fraction
Size
Distribution
Fraction
Size
Distribution
IDERIVE:
Carbonate
(or
Biogenic)
.....
tlFine
Non-C{rbonate
(or
Lithogenic)
I
Figure3. Analyticalflow chartfor size/composition
slicing.
bedformscomprisevarioustypesof siltytipples [Rees,
1968;Mantz, 1978;Hollisterand McCave, 1984]. The
suspensionthat occurs as a result of bedform and
biogenicroughnesshoweverwill narrow this bedload
betweenXoand%, particlemotionwill be asbedload region. During depositionsomegrainsand aggregates
[Dade et al., 1992]. Grain-bedcontactbedformsand are sortedby being trapped in the viscoussublayer,
associated
bedloadsortingmechanisms
will occur. The
whileothersof smallersettling
velocity
w•, in generalof
[1984],may be greater than the erosionstressfor free
noncohesive
silts,accordingto Dade et al. [1992],and
the criticaldeposition
stress('r,•).In general,'r,•< % <
'rs for noncohesive
material. In the transportregion
McCAVE
ET AL: SORTABLE
SILT AND
PALEOCURRENT
SPEED
597
w• < 0.64u. [Allen,1971],whereu. istheshearvelocity, gates,and erosionas involvingtheirrupture. The sea
bedgenerally
hasa looselayerof materialproduced
by
are not, and are transportedfurtherdomcurrent.
biologicalaction,weaklyboundto the substrate.The
Critical
Erosion
field erosion threshold
Conditions
data of Drake
and Caccione
[1986]fromthenorthernCalifornian
shelffallwithinand
Well-sorted fine sediments behave in a non-cohesive
justabovethenoncohesive
envelope
definedbyMilleret
havea meansize
mannerdownto about10 Ixmdiameter. Belowthissize, al. [1977](Figure4). Thesesediments
modeat 25 Ixm, and contain
particlesstart to becomecohesivepartly becauseclay of 18 Ixm,a pronounced
minerals,withtheirchargeirabalances,
enterthe compo- -15% day. The authorsconcludethat the Shields
thresholderosioncurveappliesto natural
sitionalspectrum[Weaver, 1989 p. 10; McCave, 1985, noncohesive
Figure 20]. Also, below this order of size, van der clayeysilts.We believethesedifferentlinesof evidence
showingthat belowabout10-lxm cohesion
Waals forcesbecomesignificantin particle adhesion converge,
role, and that coarsersized
[Russel,1980]. For equalsizedquartzparticlesat 50-nm startsto play a significant
particleswill experience
sortingduringpickup,dependseparation,the ratio of van der Waals attraction to
particleweightis 0.2 for 10 •m, and 20 for 1 Ixm diam- ant on primaryparticlesize.
eter. A 50-nmseparationtakesinto accountreal rough
particlebehaviorratherthanidealspherebehaviourfor
which 5rim would be more appropriate[Jamesand
Williams,1982;Dade and Nowell, 1991]. The critical
erosion behavior of quartz in seawatershowsthat
cohesion starts to dominate for sizes less than about 10
Critical DepositionConditions
Measurements
of criticaldeposition
stressbySelfet
al. [1989]
givetheapproximate
relation
,• = 10ad(inSI
units),thus depositionof 10-•m particlesoccursat
Ixm[Unsold,1982] (Figure4). Silt flakesof > 10
stresses
< 0.010Pa (shearvelocityu. < 0.32cms'•).
have a thresholdshearvelocitybelow that of equant Thesevalues,obtainedin a radial laminarflow cell, are
grains of similar size, regardlessof whether a linear ratherlessthanthe criticaldeposition
stresses
takenby
dimensionor a volme equivalentdiameter is used McCaveand Swift[1976]to be approximately
equalto
[Mantz,1977]. The viewdevelopedbyKrone[1962]and erosionstressof particleswiththesamesettlingvelocity,
Partheniades
[1965]of theerosion
process
for cohesive andwhichyield- 0.045Pa (u, = 0.67cms'•) for 10-1xm
of
materialrecognises
thebedasbeingmadeup of aggre- silt, or 0.015to 0.03 Pa via the analyticalexpression
5
I /
x
r
a /
bhay,our
I1•!
• I neSI
I
10
100
000
grain size, d ,urn
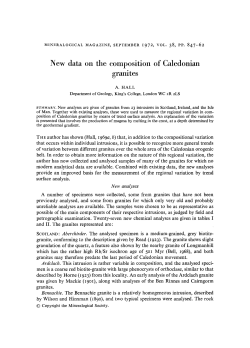
Figure4. Criticalbed shearstress% for erosionof
quartzshowing
the onsetof a cohesion
effectat about
10 Ixm,after Unsold[1982]. The datain the clayrange
were taken from various authors and contoured for voids
ratio. "MMK data limits" refers to the limits of available
high-quality
dataevaluated
byMilleret al. [1977]."C +
D California"is the mean and rangeof in situ critical
erosionstressfor clayeysilt measuredby Caccioneand
Drake [1986].
Dade et al. [1992]. The trend of thesecurves,however
is the same.Thisrangeof shearstresses
(0.01-0.045Pa)
is a little lower than that indicatedby Hunt's [1986]
experimentsfor the breakup of montmorilloniteand
illite flocs due to shear,namely0.04 to 0.16 Pa. For
shear stressesless than the critical breakup value,
aggregates
are likelyto remainintactin the highshear
regionof the viscoussublayer,
but at highervaluesthey
are likelyto be brokenup, and deposition
will occuras
primaryparticles. The implicationis that mostaggregateslessthan about 10 Ixm in diameterwill survive
duringdeposition
fromcurrents,but abovethatsizethey
areincreasingly
likelyto be disaggregated
in theviscous
sublayer. Hydrodynamlcprocesses
of sortingin the
viscoussublayerwill thustend to act on primaryparticlesfor sizesgreaterthan 10 Ixm.There is alsosome
primarydepositionof muchlarger aggregates
(marine
snow)on theseafloor.Thesearesubjectto degradation
and,in current-swept
areas,resuspension
anddeposition
of their survivingcomponents
[Lampitt,1985].
Thusbotherosionalanddepositional
considerations
indicatethat primarydisaggregated
particlesizesshould
be related
to the fluid
shear environment
when the
particlesare largerthanabout10-lxm.The dataare not
sopreciseasto specify10 Ixmexactly,
andtheregion8
Ixm(= 7 phi) to 11 Ixm(6.5 phi) maybe considered
a
transition
regionfor thisbehaviour,
but for the sakeof
598
McCAVE
ET AL: SORTABLE
SILT AND
PALEOCURRENT
SPEED
1976] and hydrography[Georgi,1981; Weatherlyand
Kelley,1985].The available
data,however,donotallow
a relationship
to be derivedbetweensiltmeansizeand
Size Distributions Under Modern Ocean Currents
long-termmeancurrentvelocity.Indeed,simplyusing
andmean
Sedimentsfrom the continentalmargins of the meanscalarspeedwouldnot be appropriate
of theeffectiveness
easternUnitedStates,NovaScotianRise,andArgentine velocityevenlessso. Somemeasure
currents,thosewith flow speedsyielding
Basin have been examinedby Bulfinchand Ledbetter of competent
shearvelocity
u,, _>0.7cms'• (equival[1984],Dtiscoll et el. [1985] and Ledbetterand Klaus a criticalerosion
definiteness
(andotheranthropomorphic
reasons)
we
will use 10 Ixm.
[1987]. In the casesof the easternUnited Statesand
Argentine Basin, the noncarbonatesilt-mean size
approachof Ledbetter showsa general relationship
betweencoursersiltmeanandthe pathof deepwestern
boundarycurrentsasdefinedby turbidity[Eittreimet el.,
ent to geostrophic
velocityover 15 to 21 cm s'l,
[Weatherly,
1984]),would need to be extractedfrom
records of current meters set at 50 to 100 m above the
bed.Such
a measure
might
be(u,- u,•)•tforu, > u,•,
wheret is the fractionof a year that a givenu, acts.
',: ..:::::.:.:.::.:.i..¾.o
"•' .'
'•'
'::•PLb•%6
•'•,,•}•
•'FLOW
TO
E
4000 ""
•'.X.
•'
•'/'.."
aTO•
'..-.'.-.';'.;.;' .'•..
5000
-•
•
km 1•0
•
•
•
•
42 ø.
2000-
•
•
3500
X
3000
J •
41 ø
-
I
I
I
I
40 ø
•
1-7
4000-
%X
';;.. ' N' '•---
i
I
I
I
39
•to•r
1980
m//
"::""
":•
4O00
Suspended
sed•me•;
42 ø
41 ø
4
3•
-
C
18.8 • E5.75
•
8.0
3•0
'
4200
DEPTH
I
I
41500
5000
(m)
Figure5. Distributionof (a) measured
meancurrentvelocity[Hogget el., 1986],Co)
suspended
sediment
concentration
ppbby volume[McCave,
1983]and(c) siltmeansize
[Bulfinchand Ledbetter,1984]acrossthe Nova ScoffartRisebetween60ø and 65øW.
M½CAVE ET AL: SORTABLE
SILT AND PALEOCURREI•
SPEED
599
the laboratoryerosionand depositionstresses
(Figure
4). (Geostrophic
velocities
are relatedto shearvelocity
by Ug = 30u.to 22u.depending
on dragcoefficient
[Weatherly,
1984]). Thus experimentaldata indicatea
criticalerosionshearvelocityof =0.70 cm/sfor 16
silt, which is dose to the 0.68 cm/s deduced for the
HEBBLE sitebyMcCave[1988]from the data of Gross
andWilliams
[1988],
andisproduced
byU• of 15to20
cm s'•. The coarsesilt sizeparameters
recordthe
effectiveness
(durationx work rate) of currentsfaster
than this.
Nature of the Currents That Sort Deep-SeaSediment
lO
lOO
We mustnowenquireaboutthe dynamicaloriginof
the currentsresponsible
for resuspension
of sediments,
for withoutresuspension
therewill be little sorting.We
Figure 6. Size distributionsof sedimentfrom the Nova
ScotianRise measuredby Coulter Counter[McCave, needto knowthissothatwe mayhavea securebasisfor
interpretationof the propertiesof sorted sediments.
1985],showing(a) dominanceof a 4-1•mmode and a
Severalidea!i?.ed
casesof currenttime seriesmay be
weak 10-1•mmodeunder slowcurrentsat 4000 m water
imagined
(Figure
8). In Figure8a the flow speedis
depth,(b) bimodalstructureat 4800m depositedafter
constantly
above
critical
for a certainsize,resultingin
moderatecurrentsof 5-10cm/s,and(c) well developed
erosion of that material and a residue of coarser sedi16-g•mmode at 4800m depositedafter strongcurrents
ment. A currentthat neverreachescritical(Figure8b)
cm/s).
,um grain size
18
The data for the Nova Scotian Rise were obtained
bothby Elzonecounterandexpressed
assiltmeansize
[Bulfinchand Ledbetter,1984]and by classicalpipette
methoddisplayedas frequencycurves[Dtiscollet al.,
1985]. The curveswere clearlybitnodalwith a coarse
siltmodeat about16 !•m and a claymodebelow2 !•m.
The heightof the '* 16-1•mmodeandthe siltmeansize
increasedtowards the lower part of the rise where
turbidity,hydrographic
and currentmeterdataindicate
strongercurrents [Weatherlyand Kelley, 1982, 1985;
McCave, 1983;Richardsonet al., 1981;Hogget al., 1986;
Ezerand Weatherly,
1991](Figure5). Detailedanalyses
by CoulterCounterat the HEBBLE site on the Nova
16
coarse
mode
size
.,um
14
12
10
indicates the size-sorted behavior of the silt coarser than
2•0per'
cent
•lay5Jo
8
fine
mode
6
peak
height
4
r
%
2
ScotJan Rise showed a bimodal size structure in the
window1.6 !•m to 80 !•m with modesat 3-4 !•m and 1217 !•m (Figure6) [McCave,1985].The 3-4 !•m fine silt
modeis positively
correlatedwithpercentage
of clayand
is thoughtto be an instrumentally
truncatedremnantof
the main clay peak below2 !•m. The coarsemodeis
inverselycorrelatedwith % clay (Figure 7). This
r
,
I
2•oper'cent
clay5o
16
coarse
mode
size
14
.,um
12
n
10
= 21
•) 12 15%18
I
I
i
coarse mode peak height
about10 !•m in diameter,versusthe tinsortedcohesive
Figure 7. Correlationsbetween parametersof size
behaviorof the f'mesilt and day, and lendscredenceto
the notion of sortable, noncohesivebehavior of the
distributions
fromtheNovaScotianRiseshowing
sorting
coarsesiltfraction. However,we cannotyet obtaina in the siltrange(seeFigure5b for meaningof fine and
quantitative
relationship
betweensedimentary
parame- coarsemodes).(a) coarsesiltmodeis coarserwithless
ters and measuredcurrentspeeds. Nevertheless,
the clay,(b) thereis morefinesiltmodewithmoreclay,(c)
related.
rangeof measured
erodinganddepositing
velocities
on coarsemodesizeandpeakheightarepositively
the Nova ScotianRise is consistent
with applicabilityof
Figureis afterMcCave[1985].
600
McCAVE
ET AL: SORTABLE
A'
KM
high
SILT AND PALEOCURRENT
KE
zero
SPEED
LedbetterandKlaus[1987]certainlyfollowsthe residual
flow.
Tidal andinertialmotionsare averaged
outpriorto
•
mod
zero
low
mod
Uc'
OUDO
high
estimation
ofdeviations
fromthemeanin calculating
K•.
Howeverthereare settingswherethe internaltide is of
significant
magnitudeand providesthe necessary
addition to the mean to push the speedbeyondcritical
erosionconditions
(Figure8), (thedirectbaroclinic
tidal
currentdueto seasurfaceslopeis small,1 or 2 cms'• at
most). The internaltide is intensifiedin regionswhere
the localbottomslope(c•) matchesthat of the charac-
I.)•_Uc-•t-zero
o
•,
time
Figure 8. Idealized time seriesof currents. The time
axiscouldrepresenta scaleof daysor months.
teristic.Thisis mostsimplygivenby o• = N• sin%•+
ff cos2e•
[Thorpe
and White,1988],in whichthe frequenciesare , for the internal tide, f for inertia
(Coriolis)
andN forbuoyancy,
givenby3F = (g/0)(0%
/&), wherep is the in situ densityand % the usual
will produceno effect,eventhoughit hasa fastermean
thana variablecurrent(Figure8c) whichoccasionally densityparameter. The key variablesare the bottom
slope and the potentialdensitygradient. Work on
exceeds critical. This is the common case of a current
Porcupine
Bank has shown internal tidal control of
with an underlyingmean and an added source of
resuspension
at two depths[DicksonandMcCave,1986;
variability.Finally,Figure8d represents
the situationof
Thorpe
and
White,
1988].At the deeplevels(1800-2800
zero (or verysmall)meancurrentandlargevariability
m),
currents
near
the bed exceed15 cm s'• for 1.8 to
such that currents in several directions are able to move
4.1%
of
the
time
[Thorpe,
1987]. The tidal casesillussedimentbut with zero net transport.The important
casesare clearlyshownin Figures8c and8d. The key tratedin Figure9 are from regionswith sedimentary
featuresof currentorigin;foraminiferalsanddunesat
questionis whether the inferenceto be drawn from a
change
in sortedsediment
is of a change
in theunderly- thefootof HattonDrift (Figure9a);mudwavesontop
ing flow(meankineticenergyKu) or a changein the of HattonDrift (Figure9b);andfurrowsontheSaharan
Rise (Figure 9c). At the sand dune site the flow
variability
(eddykineticenergyK•.
15cms'• mostofthetimeandisexpected
tobe
The originsof the mean flow are mainlydeep exceeds
geostrophic
currentsdrivenby temperature
andsalinity erosional(for silt),whereasthe flow on top of Hatton
for
differences[Pondand Pickard,1983;Warren,1981]. Drift is, in thisveryshortrecord,alwayssubcritical
Thereis alsoa stronginfluence
of themagnitude
of the erosionbut has sufficientstressto resultin sorting
slopealongwhichgeostrophic
currentsflow. A steeper duringdeposition.
In recentyearsthe pronouncedeffectsof eddy
bed slopesupports
a locallysteeperisopycnal
gradient
as"benthic
andfastercurrent,[Bowden,
1960;McCave,1982].Thus energyontheseabedhavebeenrecognized
[Hollister
andMcCave,1984;GrossandWilliams,
on steepscarpsveryfastcurrentsareinferredgeostrop- storms"
variabilityof the deepflow
hicallyand measuredby currentmeters[e.g.,Warren, 1991]. In these,long-period
1973;Bird et al., 1982]. In someregionsof significant showsshortepisodesof intensesedimentresuspension
eddyactivitya deepmeanflowmaybe drivenbyeddies (Figure9d). Stormshavebeen examinedin anydetail
[Hollandand Rhines,1980], and Hogg et al. [1986] onlyon the NovaScotianRise wheretheyare westward
directedbursts'ofenergyresultingfrom Rossbywavesuggest
thatthe deepflowovertheNovaScotianRiseis
like
motionswhich are probably forced by the Gulf
drivenin thi.qway.Thereis embedded
withinthiseddyStream
[Welshet al., 1991]. The motionsare coherent
drivenflowa deepwestern
boundary
current(DWBC)
throughout
the water colnmnfrom top to bottom, a
of Norwegian
Sea OverflowWater and a deepercold
filamentof AntarcticBottomWater [Weatherly
and
Kelley,1985]. Thus,eventhe meanflow of a DWBC, in
feature
also seen in the eddies near the Kuroshio
Extension,
wheretheabyssal
K• isabout100cm• s'• less
specialsettings,
maynot be entirelydueto geostrophy. thanbeneaththe Gulf Stream[Schmitz,1984a,b]. This
meansthatregionsof highabyssal
K•
The settingontheNovaScoffanRiseisjustto thenorth verticalcoherence
underlie
high
surface
K•
which
is
mapped
by
satellites
of the meanpositionof the Gulf Streamandunderthe
path of warm-coreringsshedfrom it. The idealized usingvariabilityof seasurfaceelevation[Zlotnickiet al.,
1989]or slope[Sandwelland Zhang, 1989;Shumet al.,
time seriesof Figure8d is thusratherunrealisticin that
1990].
regionsof higheddyenergyare likelyto havea mean
Purely on the basisof sedimentary
propertieswe
flowdrivenbyeddies.The ArgentineBasinmaywellbe
cannot
distinguish
whether
a
change
in
size
is dueto an
a placewherethe eddy and mean-flowenergyboth
contributeto sedimentsorting,but theirrelativecontri- increasein the meanspeedor an increasein the vaributionscannot-bgidentified. The net size trend of
abilityof speed. On the otherhand,one canidentify
McCAVE
ET AL: SORTABLE
2O
•.
I
SILT AND
_
PALEOCURRENT
!
SPEED
I
601
-.
15
10 f2
3130m
Hatton Drift
.
2O
1=
I
I,u = om$-'
A
C
5
o
3O
•
3976 m
1week
"I
Saharan
_1
Rise
•
.
2O
,_1
u.
lO
o
¾ 1.5•,
-
locally
resuspended
e
-
._o
E1.0
I
•
=
advected peak
0.5
v•
-
-
22/10/•
5
29/10
Figure9. Timeseriesof deepoceancurrents
measured
nearbed. Internaltideson (a)
a strongmeanflowand (b) a weakmeanflow(bothon HattonDrift fromMcCaveet al.
[1980]),(c) a moderate
meanflowovera furrowed
bed[Lonsdale,
1982],(d) twoanda half
weeksrecordof a stormat theHEBBLE siteontheNovaScotian
Risewith(e) turbidity
recordshowing
mainstormon 27 October. Note tidal signalalsopresentin Figure9d,
from Grossand Williams[1991].
thoseoceanic
regions
wherestrong
meanflowandthose [1985]showsthat there is a goodrelationshipbetween
wherestrong
eddyvariability
islikelyto occur[Dickson, modalsizeand peakheightso eitherwoulddo, but size
1983].In someregions
bothsignals
arefoundandthese wouldbe preferableasit is relatedto flowspeedexperiwill presentdifficultiesin interpretation
of sediment. mentally.These are both rather sensitiveto analytical
Clearly,animportantstrategy
for theinference
of flow method,so we have selectedthe mean size of the 10-63
speeds
bearing
onpalaeocirculation
istosample
regions Ixmfractionwhichis more robust. Ledbetter's4-63 Ixm
wheretheeddyK• is likelyto havebeenlowandmean siltmeanincludespart of the spectrumwhichis sensitive
Ku relativelyhigh. Placesto avoid are the North to currentsortingand part whichis not (Figure7).
AmericanBasinnorthof about30øN,the Argentine Ledbetter[1986]showsthatthemeanresponds
positively
Basin,
theNorthPacific
neartheKuroshio,
theAgulhas to measured currents in Verna Channel. We think it
offSouth
AfricaandmostoftheAntarctic
Circumpolarwiseto cut out the 4-10 Ixm part of the sizespectrum
Current[Shumet al., 1990].Thisshouldholdgoodfor
which tends to make the parameterless precisely
the Pliocene
andPleistocene
wheremeridional
plate responsive
because
it behaves
in theopposite
wayto the
displacements
are notmorethana fewhundredkilomet- 10-63 Ixm fraction(Figures7a and 7b). Note that
ers,but for earliertimes,difficultieswill be encountered. Ledbetter's[1986] Figure 2 givesU = 183.4 - 30•,
relatingmeanspeedin centimeters
per secondto • size,
Current Related Sediment Parameters
a relationship
with a muchsteeperslopethan that
expected
froma graphofcriticalconditions
[Milleretal.,
Thebestcurrent-related
parameters
areprobably 1977],whichis U = 48 - 4.5•.
If thedeposition
rateoff'mermaterial(< 10 Ixm)is
modalor meansizeof the 10-63•m fraction.McCave
602
McCAVE ET AL: SORTABLE SILT AND PALEOCURRENT
diminishedunder faster currents,because,on average,
finer particlesare found in aggregates
of lower settling
velocity[Migniot,1968],and largerfastersettlingaggregateswhich might otherwisebe depositedare weaker
and tend to break up, then one wouldexpectthe ratio
of 10-63 •m material to total fine fractionto increase
with current speed.A useful index could thus be a
percentage-based
enrichmentfactor usingthe ratio of
10-63•m material to the total fine fraction. This index
is very dependanton locationin relation to sediment
focusing(e.g.,on a slopeor at the bottomof a slope).
Deeper areas or depressionssimplytend to receive
more f'meswlnnowedfrom areas higher up, due to
gravitationalsettling. Two areas may have similar
currentspeedsandthiswill be reflectedin similartrends
in coarse silt mean, but each will have a different
percentage
of fine silt and claydependanton its topographicsetting.Nevertheless,
if onewishesto compare
time-trendsat a singlepointwherethe topography
has
remainedfairly constantover the sampledperiod,the
percent> 10 •m is useful.It doesnotbehavein exactly
> 10um Non-Carbonate
Silt'
Mean
Grain
Size
vPercentage
-1
I
0.85
0I
I
I
1I
the sameway as the coarsesilt size as the long time
seriesof Figure10 shows.The amplitudeof the coarse
silt sizeand percentage> 10 Ixmis stronglycoherentat
the major orbitalfrequencies,but the percentagepeak
leads(occurs
before)thesizepeakbyabout17ka at the
125ka periodand 1.7ka at the precession
periods.The
part of the recordillustrated(1.2 to 0.85Ma) is dominated by precessionand tilt forcing, for which the
temporallagsare not important,but we cannotexplain
the 17ka lagin the eccentricity
band,unlessit is related
to a precession
effect.
With compositional
slicinga percentage
basedindex
can be made for terrigenousand carbonatemateriM
combined[Robinsonand McCave,1994]. This givesa
way of eliminatingcompetinginfluenceson sediment
texture,namelyto record the commonvarianceof the
sizeof the carbonateand terrigenousfractions.It was
suggested
by WangandMcCave[1990]thatonlycurrents
can act to producemore or lesssimilar effectson the
> 10 Ixmbiogenicandlithogenicfractions(Figure11).
The interglacial
samples
from HattonDrift showa clear
Amplitudein > 10umNoncarbonateSilt MeanGrainSize
CoherentwithAmplitudein % > 10umNoncarbonateSilt
•18
O
:• (S.iD.
Units)
Stage
I
SPEED
125-95
23
41
ß
19
(Periods,ky)
0.15
BW
0.9
ß
.
.:::
.....ß
0,10
..
0.95
0.05
Q-
1.0
ß
E BAND
T
1.0
<( 1.05
•
0.5
',
ß
1,1
...........i:.'..i"
o.o
...
..
............
...'•2::-
;..
......
---•'-•2•
+90
. ."'12::'.,.
1.15
o
... ......
•
-90
:..
-180
ß
ß
ß
ß
ß
ß
ß
1.2
•
MeanParticle
Size 100-%CaCO3
....... Percentage
0.0
0.01
0.02
0.03
0,04
0.05
0.06
0.07
Frequency(cycles/ky)
Figure10. (left) Time seriesof coarsesiltmeansizeandpercentage
expressed
in variance
units,and (right) frequencyspectrumof the coherentamplitudeof the two time series
(DSDP Site 610A, Feni Drift).
0.08
McCAVE ET AL: SORTABLE SILT AND PALEOCURRENT
HATTON
9
a)
8
7
6
5
phi
phi
9
4
•'
8
6
5
4
I
I
I
I
552A glacial carbonate'.
c)
552A inte glacial carbonate
20
I
totalCaCO3
> 75%
total CaCO3 < 25%
Foram
0
\J
30
'
%/phi
b)
603
DRIFT
301
• • •i • • •
%/phi
SPEED
•
10
• i •
x
um
•
i
0
100
I
'
I
d)
552A interglacial terrigenous
I
um
I
I
100
I
552A glacial terrigenous
I Typical
unsorted
20•...1
Fragments
_•.
•'..
_•.e•"'
/•.
\.
I
•
IRD - dominated
spectra
10-
0
cohesive
silt
•'••'J
I'sortable'
silt
..
1
10
100
10
100
Figure11.Average
sizedistributions
ofinterglacial
andglacial
samples
forcarbonate
and
terrigenous
components
fromDSDPSite552AonHattonDriftfromWangandMcCave
[1990].
Notethepronounced
> 10-•xm
mode
inbothinterglacial
components,
coccolith
size
peaks,
andlackofthese
intheglacial
samples.
Solidanddashed
linesdistinguish
setsof
four-sample
averages
fromglacialandinterglacial
periods.
correspondence
of botha sizemodeandenrichment
of
sediment size.
There are several modes of sediment
deliverywhichmay vary on glacialto interglacialand
other time scales. We must focuson the deliveryof
sediments
to depthsat whichthedeepcirculation
affects
them. This deliveryis largelyby gravitational
processes
not obviouswhether this should increase or decrease (turbiditycurrentsand debrisflows)but alsovia wind
andshelfedgeand sloperesuspension
by internaltides
withincreasing
currentspeed,probablydecrease.
with subsequent
rain-outfrom intermediatenepheloid
An Aside:Wind Speed-Related
SedimentParameters
layers. It is oftenassumedthat turbiditycurrentsare
more frequentat low standsof sealevel,yet the availall of the following;triggeringat times
Par/an [1974]formulatedan atmospheric
dust abledatasuggest
winnowing
modelin whichparticles
f'merthan7 ixmare of sealevelchange,triggeringby 23 ka climaticchanges,
from glacialto Holocene
scavenged
by rain with no sizedependence
(i.e., an and uniformhigh-frequency
aggregation
process
ofparticles
withraindrops),
whereas [Weaveret al., 1992;Weltjeand deBoer,1993;SchOnfeld
largersizesfall out by gravitational
settlingdepending and Kudrass,1991]. The massfailuresyieldinglarge
turbiditycurrentsand debrisflowsinvolvefailureof ten
on d2. This size limit is comparablewith the 10
chosenhere for singleparticledeposition
underwater. to several tens of meters of sediment on the slope
Parkin related the slope of the cumulativeweight [Embleyand Jacobi,1977],therebymixingthe products
cycles[Weaverand Thomspercentage
sizedistribution
to the wind"vigour"
Uz in of severalglacial-interglacial
whichz is the heightto whichthe dustis initiallymixed on, 1993]. Basalerosionby turbidity-currents
will also
in the atmosphere
andU is themeanmigration
velocity producea mixture,andit is hardto seehowanyresediof the depositing
air massacrossthe sea. This gave mentationmechanismcan deliver a pure glacial or
plausible
estimates
of glacialwindsoffWestAfrica.
interglacialsignature.
Fluvial deliverydirect to the mid-latePleistocene
Provenance
shelfedgeoccursonlyat the rninlmaof sealevel(120to
130 m lowering,e.g. in stage2, part of stage6, etc.)
Corliss
etal. [1986]madetheunsupported
assertion whichrepresentonly a smallproportionof the whole
that there will be an influenceof changingsediment glacialperiod [Shackleton,
1987]. For the rest of the
provenance
throughtheglacial-interglacial
cyclewhich time, sea level loweringof lessthan '• 90 m puts the
affects the inference of water mass velocities from
shorelinesomeway back from the edgeon the middle
the coarseterrigenous
and carbonatesilt relativeto
thosefromtheglacial(Figure11). Themass
accumulationfluxof 10-63•xmcarbonate
andterrigenous
sedimentcanalsobe derived,givenan agemodel,but it is
604
McCAVE
ET AL: SORTABLE
SILT AND
P ALEOCURRENT
SPEED
28
1A
_
20 ...........
_
8 K "AABW"
_
0
5000
10000
15000
20000
25000
30000
Age (cal years)
28
E
26
I
•IBYD <IA.• •L .....I .
I
' 'FI/t
22
20
--
18
t
....
1610
5000
I
10000
15000
20000
I
25000
-I
30000
Age (cal years)
Figure 12. Changein the coarsesilt mean size at two current-affected
sitesin the NE
Atlanticcompared
withthesizeof theinputfunction
froma nearby
pelagic
siterelatively
unaffected
bycurrents.Thetimescaleisin calender
yearsandthetimesofthelastglacial
maximum,
terminations
IA andIB andtheYoungerDryasareshown
for reference
[after
Manighetti
andMcCave,thisissue).
of the shelf. The point is that materialis deliveredto in the glacials,at leastin the trade wind belt [Parkin,
the deep sea via resuspension
processes,
not direct 1974].Thereisno clearreasonfor supposing
thatwinddelivery,most of the time. The sea level miniran do
resultin somerapid supplyof continentaldetritusto the
deep-seacirculation,as demonstrated
by maximain
red/pink colorationof sedimentsbeneaththe Western
wave erosion of the outer shelf at low sea level stand
will yield a suspension
with a coarsersilt (> 10 •m)
meanthaninternalwaveerosionat highsealevelstand.
TheinputfunctionofManigheta'
andMcCave[thisissue],
Boundary Undercurrent originating from Upper spanning
the last30 ka of pelagic(includingice rafted)
Palaeozoic
redbedsof theCanadianMaritimeProvinces, depositionon the East ThuleanRise showsan increase
duringglacialstages[Hollister
andHeezen,1972]. On in the coarsesilt meansizeof about3 •m in the last7
glaciated
margins
directdelivery
byiceoccurs
to thetop ka (Figure12). Althoughthemassfluxmaybe greater
of theslope,andfromiceraftingto theslopeanddeep in the glacial,the materialdoesnot havea coarsersilt
seabeyond[Fillon,1985;Boulton,1990]. Ice-rafting size. We wouldnotwishto generalize
fromthisprofile
increasesNorth Atlantic sedimentation rates from about
to other regions,but arguethat there is no a priori
2 cm/ka[Balsom& McCoy,1987]to 3 to 4 cm/kaat reasonwhythe sedimentavailableto be transported
by
mostonaverage[Manigheta'
& McCave,thisissue],
much deep-seacurrentsshouldshowsystematic
short-term
lessthantheenhancement
thatcanoccurunderdeep shiftson timescales
of 100 ka or lesswhichmightbe
currentsystems
on sedimentdrifts(up to 25 cm/ka). confusedwith a current-controlled
origin. On much
Therearebriefperiodsof veryrapidice-rafted
despos- longertimescales,
majortectonicandclimaticchanges
ition (Heinrichlayers)in whichdirectdeliverydomi- will influencedifferencesin deliveredsize through
nates[Bondet al., 1992]. Samplingschemes
need to changes
in mountainelevation
andstreamgradientand
recognize
theexistence
of suchlayersfor sedimentolog-weatheringstyleand intensity.
ical andstratigraphic
analysis.
It is not obviousthattheseprocesses
woulddeliver Size-Composition
Slicing
a coarser
mixturein thecoarse
siltrangeduringglacials.
The earlier section on inference of size distributions
A coarsebaseto turbiditcunitswouldbe expected,
but
the currents
startoff by erodingthefinetop of earlier of components
meansthat we can now subdividethe
turbidites.Windsdo appearto delivera coarsermixture terrigenous
andcarbonate
fractions.That is to saywe
McCAVE
ET AL: SORTABLE
SILT AND
PALEOCURRENT
SPEED
605
Table 1. SizeDifferentiatedComponents
of Deep-SeaSediments
Coarse Fraction
Fine Fraction
Clay,
Composition <2 txm
clayminerals
Lithogenic
Fe/Mn oxides/
hydroxides
Silt
Sand,
2-10 txm
10-63txm
>63 txm
quartz,feldspar, quartz,feldspar, rock fragments(IRD)
mica, clayminerals mica,glassshards quartz,feldspar,
glassshards,pumice
Biogenic
small coccoliths
Carbonate
Silica
(Gephyrocapsa
spp),
coccolithfragments
diatomfragments
coccoliths(except foram.fragments
Gephyrocapsa
spp.) (andlarvae)
foraminifera,
detrital carbonate
(m•)
spongespicules
diatomfragments
diatoms,
radiolaria
radiolarianfragments
candeterminetheproportions
andsizecharacteristics
of
differentparts of the spectrum.The significance
of a
10-•m boundaryhas been urged in relation to the
terrigenous
fraction. Thissizeis alsoa usefulboundary
in carbonatesediments,becausevery few Pleistocene
coccoliths
havea settlingvelocity(Stokesian)
equivalent
size greater than 10 txm[Okada and Mcintyre,1977].
Abovethe lysocline,carbonate< 10 txmis dominantly
coccoliths.Below the lysoclinethere may also be a
componentof very small foram fragments. In North
AtlanticHeinrichlayersthereis an appreciableamount
procluctus,
but it showsthat somedistinctions
can be
rapidlymadevia modalpeakheightswhichotherwise
wouldrequirea lot of counting.Plottingthe downcore
peakheightratiosfor Sites552Aand610Ain the upper
Pliocene,Jones[1988] found a synchronous
shift in
relativespeciesabundances
whichmaybe relatedto a
circulationor productivitychange.
Usingthe percentage
of free (coccolith)carbonate
in conjunction
with an agemodelpermitsderivationof
havesufficientopal to makethe effortworthwhile.
Adoptionof a 10 •m boundaryallowsus to pick
four sizerangesfor materialusingcommonlyaccepted
classes
(< 2, 2-10,10-63,> 63•m), thatis clay,freesilt,
ice volume. The 10 to 63 txm carbonatematerial is
mainlyfragments
andlarvaeof foraminifera.In glacial
sedimentsthere is sometimessignificantcarbonatesilt
continuous
massaccumulationrateswhich,at a shallow
site like 610 (2500 m), are relatedto productivity.
of free Palaeozic carbonateand Cretaceouschalk, so
Spectralanalysisof theseby Robinsonand McCave
vigilanceis required. In theorythe componentsubtrac- [1994]showsvery clear coherence
with the modelof
tion methodcouldyield the sizedistributionof carbon- orbitallyforcedicevolumefluctuations
of Shackleton
et
ate, opal, and terrigenousfractions. However the
al. [1990]at 41 and23 ka (Figure14). Thereis a very
compounded
errorsof sizeand componentdetermina- slightphaselag of 2 to 3 ka withproductivity
following
tionmeanthatit is notpossibleto determinereliablythe
ice volumepeaks. The coccolithproductivityis not
sizedistributionof a component
of lessthan 10% of the
strongly
drivenby the 100ka glacial-interglacial
cycle,
whole. Most of the sediments we have dealt with do not
andit is not alwaysassociated
withwarmperiodsof low
coarsesilt, and sand. Within the sand fraction it is a
simplematter to physicallyseparatesubsamples
using
sieves.Thesesizerangeshavefairly dear (thoughnot
exclusive)
identities(Table 1).
An exampleof what canbe donethroughrecognition of components
is shownin Figure 13 wheretwo
peaks in the size spectrumcan be associatedwith
differentcoccolithspecies.Figure11 alsoshowstwo
coccolithsizepeaksin the < 10-•m fraction. Because
of the overlapin the sizeof species
it hasbeennecessary to lump Reticulofenestra
minuta and Dictycoccites
(suchasin the ice-raftingpulsesdocumented
byAndrews and Tedesco[1992]),but normallythe material
consistsof foram fragments. This material is also
sortable, and allows derivation of a parallel current
strengthindex(the meansizeof the > 10-1xmcarbonate
silt) to go alongsidethat based on the terrigenous
fraction. Thiswill clearlybe suspect
nearor belowthe
lysoclineand even above that level this size should
alwaysbe considered
alongside
the noncarbonate
silt
size.
Datafromcoarsefractionanalysis
maybecombined
with information
from the fine fraction. For example,
606
McCAVIE ET AL: SORTABLE SILT AND PALEOCURRENT SPEED
2
5O
size
10
!
,um
63
i
100
I
A
_
4O
ß
610A
Feni
3O
%/•
20
552A
Hatton
0
.
0
I
9
I
8
7
size,
I
5
6
I
4
(D
B
ß
•.o
0.5
o0
/al
I I I I I
I
2
as singleparticlesto hydrodynamicforceson erosion
and depositionbecauseof the breakageof aggregates
and is thereforesize-sortedaccordingto shearstress.
Thus the size of the > 10-•m silt is a usefulcurrent
strengthindicator. Becausedepositionof coarser
materialunderfastercurrentsalsoinvolves
suppression
of deposition
of freersediments,
thepercentage
of > 10•m siltin the freefraction(< 63 •m) is alsoanindicator of current strengthat a point, but variabilityof
sediment
focussing
posesproblemswhencomparing
time
seriesof percentagedata from differenttopographic
settings.
There is no good reasonto believethat there are
systematicshort-term changesin delivered silt size
relatedto provenanteon time scales< 100ka. Mixing
of sedimentduringturbiditycurrent,debrisflow and
sloperesuspension
deliveryto the siteof deepcurrent
sortingmeansthat systematicchangesare not to be
expected. For somesitesfar from continentalmargin
input, definitionof a pelagicinput functionfrom sites
relativelyunaffected
by currentsgivesa basisfor assessment of relativechangesin currentspeed. In general
the increaseover generalpelagicsedimentation
rates
causedby current-controlled
focusingis muchgreater
than that causedby ice-rafting,otherthanin Heinrich
events.
3
Thesesedimentpaxmetersare not capableof
resolving
whetherthe currents
responsible
for sorting
Figure13. (a) Sizedistribution
of Pliocene
carbonate- havea smallmeanandlargevariability
or largemean
rich(94%)sample
fromFeniDrift (DSDPSite610A/17- andsmallvariability.
Forinference
of theflowspeeds
/3/78)showing
modesat 9.3• (1.60•m) and7.4• (5.9 ofwatermasses
thelattersituation
isrequired.Forthe
p,m)whichrepresent
R.minutaplusD.productus
and lateQuaternary
at leastwe suggest
thatthedistribution
C.pelagicus
respectively.
The comparable
samplefrom ofeddykinetic
energy
wassimilar
tothepresent
(though
Modal height (7.6•)
/ Modal height (9.3(:1:))
Hatton Drift (DSDP Site 522A/11/1/6)alsoshowsa
strong
foramfragment
modeat4.7•. Co)Closerelationshipbetween
modalpeakheightratioandabundance
ratio of speciescountedin smearslide[fromJones,
988].
withsomelatitudinalcompression
in the Gulf Stream
area),andthatplaces
to avoidcanbeassessed
using
the
products
of satellitealtimetry.ThesearetheN. AmericanBasinnorthof 30ø,ArgentineBasin,Kuroshio
area,
Agulhas
retroflection
andAntarcticCircumpolar
Current. Steepening
of the density
gradient
0or
r/Oz can
also result in local intensification of internal tidal
terrigenous
sandis an excellent
indicatorof icerafting currents,
andthiscontributes
another
interpretive
pitfall
andexpressing
its abundance
in variance
unitsprovides to be examined
caxefully.
a basisfor subtracting
ice-raftingeffectsfromtimeseries
The sizeof compositionally
distinctcomponents
of
of silt abundancein order to try and eliminateprovchanceartifacts.In the samewaymoreforamfragments
are expectedin the siltfractionwhenforamabundance
is greatest,and subtractionof foram variancehelps
isolatecurrenteffects. This operationcan be carried
out on either percentages
or massaccumulation
rates
and is illustratedfor Feni Drift (DSDP Site 610) by
Robinsonand McCave [1994].
aftera component
hasbeenremoved
by dissolution.
Thisallowsestimation
of sizepaxameters
of carbonate
separate
fromterrigenous
material,
andinprinciple
opal
Conclusions
The coarsecarbonatesilt fraction is also currentsorted
a sedimentcan be inferred from the differencebetween
the total size distribution and the size of the residue
if sedimentscontain sufficientbiosiliceousmaterial for
precise
determination
(morethan10to 15%).Thefree
carbonate
is dominated
by coccoliths
below10 •m and
foramfragments
or larvaein the fraction10 to 631xm.
and,whencombined
withtheindexbased
onterrigenous
We conclude
thatfinesediment
shows
increasingly silt,givesa morerobustcurrentspeedindex.Coccolith
noncohesive
behaviorabove10•m and cohesive
below carbonate
massaccumulation
rateisprincipally
related
thatsize. Thesiltcoarser
than10•m responds
largely to productivityfor pelagicsitesabovethe lysocline
McCAVE ET AL: SORTABLE SILT AND PALEOCURRENT SPEED
•)le
O Log
MAR
(g/cm2/kyr)
aage
-0.6 0
0.6
0.5
3 ....',
100
2
41
\'
,
23
-'"""!'"',
607
19 Periods
(k'yr)
,"
0.6
.•
',,
.
/
ICE
VOLUME
0.7
.,-
n'
0.8
<
o.g
•o
•
E
T
•,1.0
O 0
P1
P2
...:....•
• 0.5
1.o
COCCOLITH
-..i
.......... i......
:.......
!....
+90
-90
-180
1.2 Coccolith
(<10um)
CarbonateMAR
o.o
o.o•
o:o2 o:o•
0.04
o.•
Frequency
(cycles/ky)
o.'oe
0.07
Figure
14. (left)Earlytomid-Pleistocene
variation
incoccolith
(< 10txmCaCO3)mass
accumulation
rate(loggcm'2ka'•) expressed
invariance
units
ofthetimeseries.
Spectrum
oflogMAR,icevolume
model
andthecoherehey
between
them.Pronounced
coherehey
atobliquity
andprecession
frequencies
isapparent
witha small
phase
lag[fromRobinson
andMcCave,1994]DSDPSite610,FeniDrift.
(though
clearlystrongcurrents
wouldrendersuchan
Allen, J.R.L., A theoreticaland experimental
studyof
inferenceunsound).
Thesetechniques
are somewhat
laborious(Figure
climbing-ripple
cross-lamination,
witha fieldapplicationto the Uppsolaesker,Geogr.Ann., 53A, 157-
3), but it is possible
to process
50 to 100samples
per
187, 1971.
week and thus obtainhigherresolutionquantitative Andrews,J.T., andK. Tedesco,Detritalcarbonate-rich
sediments,
northwestern
LabradorSea:Implications
sedimentological
datathanhithertofor longtimeseries
for ice-sheet
dynamics
andicebergrafting(Heinrin whichboth currentand productivity-related
effects
ich)events
in theNorthAtlantic,Geology,
20,1087maybe important.
1090, 1992.
Acknowledgments.
We thankGillianForemanand
Nell Pickard for laboratoryassistance,
Eric Browne,
Dave Martel, andPravinPatel for assistance
in interfacing and programming
the Sedigraph,
KarenJonesfor
Balsam,
W.L., andF.W.McCoy,Atlanticsediments:
glacial/interglacial
comparisons,
Paleoceanography,
2,
her work on coccolithsizesand counts,JeremyYoung
and Jan Backman for advice on coccolith sizes, and
BrianDade, Mike LedbetterandBrianHaskellfor their
reviewof the manuscript.We thankthe NERC of U.K.
531-542, 1987.
Bird,A.A., G.L. Weatherly,andM. Wirebush,
A study
of the bottomboundarylayer over the eastward
scarpof the BermudaRise,J. Geophys,
Res.,87,
7941-7954, 1982.
Bond, G., H. Heinrich,S. Huon, W.S. Broecker,L.
for grantsGST/02/426
(McCave,Elderfield,Shackleton,
Labeyrie,J. Andrews,J. McManus,S. Clasen,K.
Manighetti)for BOFS,and GST/02/436(McCaveand
Tedesco,
R. Jantschink,
C.Sirnet,
andK. MieczyslaRobinson)
for DSP/ODPcorework. Cambridge
Earth
wa,Evidence
formassive
discharges
oficebergs
into
Sciences 3715. BOFS Publication 207.
References
Agrawal,
Y.C.,
I.N.McCave,
and
J.B.
Riley,
Laser
diffrac-
theglacial
northern
Atlantic,
Nature,
360,245-249,
1992.
Boulton,
G.S.,Sedimentary
andsealevelchanges
during
glacial
cycles
andtheircontrol
onglacimarine
facies
architecture,
in Glacimarine
Environments:
Processes
tion size analysis,in Principles,
McthodsandApplication of ParticleSize Analysis,edited by J.P.M.
Syvitski,pp.119-128,CambridgeUniversityPress,
andSediments,
editedbyJ.A.Dowdeswell
andJ.D.
Scourse,
Geol.Soc.LondonSpec.Publ.,53, 15-52,
New York, 1991.
1990.
608
McCAVE ET AL: SORTABLE SILT AND PALEOCURRENT SPEED
westernSouthAtlantic,Deep-SeaRes.,PartA 28,
Bowden,K.F., The dynamicsof flow on a submarine
959-979, 1981.
ridge, Tellus,12, 418-426,1960.
Gross,
T.F., and A.J. Williams, A deep-seasediment
Bridge, J.S., Hydraulic interpretationof grain-size
transportstorm,Nature,331, 518-521,1988.
distributions
usinga physicalmodelfor bedload
transport,J'.Sediment.
Petrol.,51, 1109-1124,
1981. Gross, T.F., and A.J. Williams, Characterizationof
Bulltach, D.L., and M.T. Ledbetter, Deep western
deep-seastorms,Mar. Geol., 99, 281-301,1991.
boundaryundercurrentdelineatedby sediment Haskell, B.J., and T.C. Johnson, Surface sediment
texture at base of North American continentalrise,
responseto deep water circulationon the Blake
Geo. Mar. Lett., 3, 31-36, 1984.
Outer Ridge,WesternNorth Atlantic:palaeoceanographicimplications,Sediment.Geol., 82, 133-144,
Coakley,
J.P.,andJ.P.M.Syvitski,
SediGraph
techniques,
1993.
in Principles,Methodsand Applicationof Particle
Haskell,
B.J., T.C. Johnson,and W.J. Showers,FluctuSizeAnalysis,edited by J.P.M. Syvitski,pp. 129ations
in deepwesternNorth Atlanticcirculationon
142,Cambridge
UniversityPress,New York, 1991.
Corliss,B.H., D.G. Martinson, and T. Keffer, Late
Quaternarydeep-ocean
circulation,Geol.Soc.Am.
Bull., 97, 1106-1121, 1986.
Dade, W.B., and A.R.M. Nowell,Movingmudsin the
marine environment, in Coastal Sediments '91
Proceedings
SpecialtyConferencepp.
54-71,American
Societyof Civil Engineers,New York, 1991.
Dade, W.B., A.R.M. Nowell, and P.A. Jumars,Predictingerosionresistance
of muds,Mar. Geol.,105,285-
the Blake Outer Ridge duringthe lastdeglaciation,
Paleoceanography,
6, 21-31, 1991.
Hogg, N.G., R.S. Pickart, R.M. Hendry, and W.J.
Smethie,The NorthernRecirculation
Gyre of the
Gulf Stream,DeepSeaRes.,33, 1139-1165,
1986.
Holland,W.R., andP.B.Rhines,An example
of eddyinducedoceancirculation,
J. Phys.Oceanogr.,
10,
1010-1031, 1980.
Hollister,C.D., and B.C. Heezen,Geologiceffectsof
297, 1992.
oceanbottomcurrents:WesternNorth Atlantic,in
Dickson,R.R., Globalsummaries
andintercomparisons:
Studiesin PhysicalOceanography,
vol.2, editedby
Flow statisticsfrom long-termcurrentmetermoorA.L. Gordon,pp. 37-66,Gordonand Breach,New
ings,in Eddiesin Marine Science,edited by A.R.
York, 1972.
Robinson,pp. 278-353,Springer-Verlag,
New York,
Hollister,C.D. and I.N. McCave,Sedimentation
under
1983.
deep-seastorms,Nature,309, 220-225,1984.
Dickson,R.R., and I.N. McCave,Nepheloidlayerson Hunt,J.R.,Particleaggregate
breakupbyfitfidshear,in
thecontinental
slopewestof Porcupine
Bank,Deep
EstuatineCohesive
Sediment
Dynamics,
editedby
Sea Res., 33, 791-818, 1986.
A.J.Mehta,pp.85-109,Springer-Verlag,
NewYork,
1986.
Drake, D.E., andD.A. Cacchione,Field observations
of
bed shear stressand sedimentresuspension
on James,A.E., and D.J.A. Williams, Flocculationand
continental
shelves,
AlaskaandCalifornia,
Coht.
rheologyof kaolinite/quartz
suspensions,
Rheol.
ShelfRes., 6, 415-429, 1986.
Acta, 21, 176-183,1982.
Driscoll, M.L., B.E. Tucholke, and I.N. McCave,
JohnsonT.C., E.L. Lynch, W.J. Showers,and N.C.
Seafloor zonation in sediment texture on the Nova
Palczuk, Pleistocene fluctuations in the western
ScotJanLower Continent• Rise,Mar. Geol., 66, 2541, 1985.
boundary
undercurrent
on the BlakeOuterRidge,
Eittreim,S.,E.M. Thorndike,andL. Sullivan,
Turbidity
distribution
in the AtlanticOcean,DeepSeaRes.,
23, 1115-1127, 1976.
Embley,R.W., and R.D. Jacobi,Distributionand morphologyof large submarineslidesand slumpson
Atlantic continentalmargins,Mar. Geotechnol.,
2,
205-228, 1977.
Ezer, T., and G.L. Weatherly,Small-scale
spatialstructure and long-termvariabilityof near-bottomlayers
in the HEBBLE area,Mar. Geol.,99, 319-328,1991.
Fillon,R.H., NorthwestLabradorSeastratigraphy,
sand
inputandpaleoceanography
duringthe last160,000
years, in QuaternaryEnvironments:the Eastern
CanadianArctic, Baffin Bay and WestGreenland,
edited by J.T. Andrews,pp. 210-247,Allen and
Unwin, Winchester,Mass., 1985.
Georgi,D.T., Circulationof bottomwatersin the south-
Paleoceanography,
3, 191-207,1988.
Jones,K.P.N. Studiesof frae-grained,
deep-seasediments,Ph.D. thesis,248 pp.,Urdv.of Cambridge,
Cambridge,Engl., 1988.
Jones,K.P.N., I.N. McCave, and P.D. Patel,A computer-interfaced
SediGraph
for modalsizeanalysis
offine-grained
sediment,
Sedimentology,
35,163-172,
1988.
Krone,
R.B.,Flume
studies
ofthetransport
ofsediment
in estuarialshoalingprocesses,
report,110 pp.,
Hydraul.Eng. and Sanit.Eng. Res.Lab. Univ. of
Calif.,Berkeley,1962.
Lainpitt,R.S.,Evidencefor the seasonal
deposition
of
detritusto the deep-sea
floorandits subsequent
resuspension,
DeepSeaRes.,32, 885-897,1985.
Ledbetter, M.T., Fluctuations of Antarctic Bottom
Waterin theVernaChannelduringthelast160,000
years,Mar. Geol., 33, 71-89, 1979.
McCAVE
ET AL: SORTABLE
SILT AND PALEOCURRENT
Ledbetter,M.T., A late Pleistocenetime-seriesofbottom-
currentspeedin the Verna Channel,Palaeogeogr.
Palaeoclimatol.Palaeoecol.,53, 97-105, 1986.
Ledbetter,M.T., andW.L. Balsam,Paleoceanography
of
the Deep WesternBoundaryUndercurrenton the
North Americancontinentalmarginfor the past
25,000yr, Geology,13, 181-184,1985.
Ledbetter, M.T., and A. Klaus, Influence of bottom
currentson sedimenttextureandsea-floormorphologyin the ArgentineBasin,in Geologyand Geochemistryof AbyssalPlains,editedby P.P. Weaver
andJ. Thomson,Geol.Soc.LondonSpec.Publ.,31,
23-31, 1987.
Lonsdale,P., SedimentDrifts of the NorthwestAtlantic
SPEED
609
methodsof geologicalparticle size analysis,in
Principles,Methodsand Applicationof ParticleSize
Analysis,edited by J.P.M. Syvitski,pp. 3-21, CambridgeUniversityPress,New York, 1991.
McCave, I.N., P.F. Lonsdale, C.D. Hollister, and W.D.
Gardner,Sedimenttransportover the Hatton and
Gardar contourire drifts, J. Sediment.Petrol., 50,
1049-1062, 1980.
Middleton, G.V., Hydraulicinterpretationof sandsize
distributions,J. Geol., 84, 405-426,1976.
Migniot,C., Etude despropri6t6sphysiques
de diff6rentss6diments
tr6sfins et de leur comportement
sousdesactionshydrodynamiques,
HouilleBlanche,
7, 591-620, 1968.
and their relationshipto the observedabyssal Miller,M.C., andP.D.Komar,Thedevelopment
of sedicurrents,Bull. Inst. Geol.BassinAquitaine,31, 141149, 1982.
Lonsdale,P., and B. Malfait, Abyssal dunes of
foraminlferal
sandon the CarnegieRidge,Geol.
ment threshold curves for unusual environments
(Mars) and for inadequatelystudied materials
(foramsands),Sedimentology,
24, 709-721,1977.
Miller M.C., I.N. McCave,and P.D. Komar,Threshold
of sediment motion under unidirectional currents.
Soc.Am. Bull., 85, 1697-1712,1974.
Manighetti,B., and I.N. McCave,Late glacialand
Holocene palaeocurrentsaround South Rockall
Bank,northeastern
Ariantic,
Paleoceanography,
this
Sedimentology,
24, 507-527,1977.
Okada,H., andA. Mcintyre,Moderncoccolithophores
of the Pacific and North Atlantic Oceans,
issue.
Mantz,P.A.,Incipienttransport
of finegrainsandflakes
- An extended
Shieldsdiagram,
]. Hydraul.Div.Am.
Micropalaeontology,
23, 1-55, 1977.
Oser, R.K., Sedimentarycomponentsof northwest
Pacificpelagicsediments,
J. Sediment.Petrol.,42,
461-467, 1972.
$oc. Civ.Eng;, 103, 601-615,1977.
Mantz,P.A., Bedformsproducedby fine, cohesionless, Parkin,D.W., Trade-windsduringthe glacialcycles,
Proc.R. Soc.London Ser•l, 337, 73-100,1974.
granular and flakey sedimentsunder subcritical
Partheniades,
E., Erosionand depositionof cohesive
waterflows,Sedimentology,
25, 83-103,1978.
Mass6,L., Sedimentation
oceanique
profondeau Quasoils,J. Hydraul.Div. Am. Soc.Civ.Eng.,91, 105139, 1965.
ternaire.Flux sedimentes
et paleocirculations
dans
l'Atlantique sud-ouest: Bassin sud-Brezilien et
PeakFit, Peak Analysis Software, Jandel Scientific,
prismed'accretionsud-Barbade.
Ph.D. thesis,339
Erkrath, Germany,1990.
pp., Univ. BordeauxI, France,1993.
Pond,S.,andG.L.Pickard,
Introductory
Dynamical
OceanMcCave,I.N., Erosionand deposition
by currentson
ography,2rid ed., 329 pp., Pergamon,New York,
submarine
slopes,
Bull.Inst.Geol.Bassin.Aquitaine,
31, 47-55, 1982.
1983.
Rees, A.I., Some flume experimentswith a fine silt,
Sedimentology,
6, 209-240,1968.
McCave,I.N., Particulatesize spectra,behaviourand
originof nepheloidlayersoverthe Nova ScotJan Richardson,
M.J.,M. Wirebush,
andL.A. Mayer,Exceptionallystrongnear-bottom
flowson thecontinental
Continental
Rise,i. Geophys.
Res.,88, 7647-7666,
1983.
rise of NovaScotia,Science,
213, 887-888,1981.
McCave,I.N., Erosion,transportanddeposition
of f'me Robinson,
S.G., and I.N. McCave,Orbitalforcingof
grainedmarine sediments,in Fine-GrainedSedibottom-current
enhancedpelagicsedimentation
on
ments:Deep SeaProcesses
and Facies,editedby
FeniDrift, NE Atlantic,duringthemid-Pleistocene,
D.A.V. Stowand D.J.W. Piper,Geol.Soc.London
Paleoceanography,
9, 943-972,1994.
Spec.Publ., 15, 35-69, 1984.
McCave,I.N., Sedimentology
and stratigraphy
of box
cores from the HEBBLE site on the Nova Scotian
Continental
Rise,Mar. Geol.,66, 59-89,1985.
McCave,I.N., Stirringsin the abyss,
Nature,331,484,
1988.
McCave,I.N., andS.A.Swift,A physical
modelfor the
rate of deposition
of fine-grained
sediment
in the
deepsea,Geol.Soc.Am. Bull.,87, 541-546,1976.
McCave,I.N., and J.P.M. Syvitski,Principlesand
Russel,W.B., Review of the role of colloidalforces in
the rheologyof suspensions,
J. Rheol.,24, 287-317,
1980.
Sandwell,D.T., and B. Zhang,Globalmesoscale
variabilityfrom the GEOSAT exactrepeat mission:
Correlationwith oceandepth,I. Geophys.
Res.,94,
17,971-17,984,1989.
Schmitz,
W.J.,Abyssal
eddykineticenergyin theNorth
Ariantic,J. Mar. Res.,42, 509-536,1984a.
Schmitz,
W.J.,Abyssaleddykineticenergylevelsin the
610
McCAVE
ET AL: SORTABLE
SILT AND
westernNorth Pacific, J. Phys.Oceanogr.,
14, 198201, 1984b.
Schmitz,W.J., Observationsof the vertical structureof
PALEOCURRENT
SPEED
Hatton and Gardar Drifts, NE Atlantic, J. Geol.
Soc. London, 147, 373-383, 1990.
Warren, B.A., Transpacifichydrographicsectionsat
the eddyfield in the KuroshioExtension.J. GeopLats.43øSand 28øS:The SCORPIO Expedition,II,
hys.Res.,89, 6355-6364,1984.
Deep Water, Deep SeaRes.,20, 9-38, 1973.
Sch6nfeld,
J.,andH.R. Kudrass,
Hochfrequente
Turbiditse- Warren,B.A., Deep circulationof the worldocean,in
dimentation
in der Sulu-see(Phillipinch),
Z. Dtsch.
Evolutionof PhysicalOceanography,
editedbyB.A.
Geol. Ges., 142, 179-197, 1991.
Warren and C. Wunsch,pp. 6-41,MIT Press,CamSelf, R.F.L., A.R.M. Nowell, and P.A. Jmars, Factors
bridge,Mass.,1981.
controllingcriticalshearsfor deposition
anderosion Weatherly,
G.L.,An estimate
ofbottomfrictional
dissipation by Gulf Stream fluctuations,J. Mar. Res.,42,
of individualgrains,Mar. Geol.,86, 181-199,1989.
289-301, 1984.
Shackleton,N.J., Oxygenisotopes,ice volme and sea
Weatherly,G.L., and E.A. Kelley, 'Too cold' bottom
level, Quat. Sci. Rev., 6, 183-190, 1987.
layersat the baseof the ScotianRise,J. Mar. Res.,
Shackleton,N.J., A. Berger, and W.R. Peltier, An
alternative
astronomical
calibration
of the lower
Pleistocenetimescalebasedon ODP Site677, Trans.
R. Soc.EdinburghEarth Sci., 81, 251-261,1990.
Sheridan,M.F., K.H. Wohletz, andJ. Delta, Discrimina-
tion of grain-size subpopulations
in pyrodastic
deposits,Geology,15, 367-370,1987.
Shtma,C.K., R.A. Werner, D.T. Sandwell,B.H. Zhang,
R.S. Nerem, and B.D. Tapley,Variationsof global
mesoscale
eddyenergyobserved
fromGEOSAT, J.
Geophys.
Res.,95, 17,865-17,876,
1990.
Singer,J., J.B.Anderson,M.T. Ledbetter,K.P.N. Jones,
I.N. McCave, and R. Wright, The assessment
of
analyticaltechniques
for the analysis
of frae-grained
40, 985-1012, 1982.
Weatherly,G.L., andE.A. Kelley,Twoviewsof the cold
filament,J. Phys.Oceanogr.,
15, 68-81,1985.
Weatherly,G.L., and M. Wirebush,Near-bottomspeed
andtemperature
observations
ontheBlake-Bahama
outerride,J. Geophys.
Res.,85, 3971-3981,1980.
Weaver,C.E., Clays,MudsandShales,810pp.,Elsevier,
New York, 1989.
Weaver,P.P.E.,and J. Thomson,Calculatingerosionby
deep-seaturbiditycurrentsduringinitiationand
flow, Nature,364, 136-138,1993.
Weaver,P.P.E.,R.G. Rothwell,J. Ebbhag,D. Gunn,and
P.M. Hunter, Correlation,frequencyof eraplacemeritandsourcedirectionsof megaturbidites
onthe
sediments,J. Sediment.Petrol.,58, 534-543,1988.
Madeira AbyssalPlain,Mar. Geol.,109, 1-20,1992.
Southard,J.B.,andL.A. Boguchwal,
Bed configurations
Weltje, G.J.,and P.L. de Boer,Astronomically
induced
in steadyunidirectionalwater flows,2, Synthesis
of
palaeoclimaticoscillationsreflected in Pliocene
flume data,J. Sediment.Petrol.,60, 658-679,1990.
turbiditcdepositson Corfu (Greece):Implications
Stein, R., Rapid grain-sizeanalysesof clay and silt
for the interpretationof higher order cyclicityin
fraction by Sedigraph5000D: Comparisonwith
ancientturbiditcsystems,
Geology,
21, 307-310,1993.
Coulter Counter and Atterbergmethods,J. SediWelsh,E.B., N.G. Hogg, and R.M. Hendry, The relament. Petrol., 55, 590-593, 1985.
tionshipof low-frequencydeep variabilitynear the
Syvitski,
J.P.M. (Ed.), Principles,
MethodsandApplicaHEBBLE site to Gulf Stream fluctuations,Mar.
tion of ParticleSizeAnalysis,368 pp., Cambridge
Geol., 99, 303-317, 1991.
UniversityPress,New York, 1991.
Zlotnicki, V., L-L. Fu, and W. Patzert,SeasonalvariabilThorpe,S.A.,Currentandtemperature
variabilityonthe
ity in global sea level observedwith GEOSAT
continentalslope,Phil. Trans.R. Soc.LondonSera4,
altimetry,J. Geophys.
Res.,94, 17,959-17,969,
1989.
323, 471-517, 1987.
Thorpe, S.A., and M. White, A deep intermediate
nepheloidlayer,DeepSeaRes.,35, 1665-1671,1988.
I.N. McCave,andB. Manighetti,Departmentof Earth
Unsold,G., Der Transportbeginn
rolligenSohlmaterials Sciences,Universityof Cambridge,DowningStreet,
in gleichformigen
turbulentenStromungen:eine Cambridge
CB23EQ, England,U.K.(e-mail:
inccave
kritischeUberpmfimg der Shields-Funktion
und @esc.cam.ac.uk)
ilxreexperimentelle
Erweiterungauf feinstk/Srnige, S.G. Robinson,Departmentof Environmental
and
nicht-bindige
Sedimente,
Doctoraldissertation,
145 Geophysical
Sciences,
Manchester
Metropolitan
Univerpp, Univ. of Kiel, Kiel, Germany,1982.
sity,JohnDaltonBtfilding,
ChesterStreet,Manchester,
vanAndel,T.H., Textureanddispersal
of sediments
in
M1 5GD, England,U.K.
the Panama Basin,J. Geol., 81, 434-457, 1973.
WangH., andI.N. MeCave,Distinguishing
elimarieand
current effects in mid-Pleistocene sediments of
(ReceivedNovember23, 1993;revisedMay 4, 1994;
acceptedNovember16, 1994.)
© Copyright 2026 Paperzz