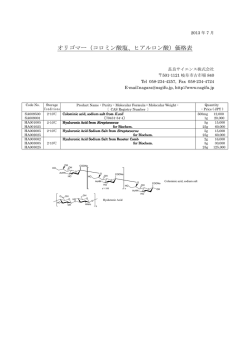
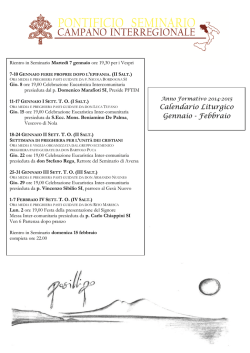
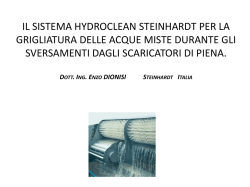
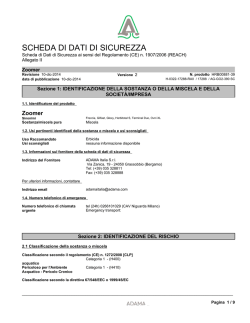
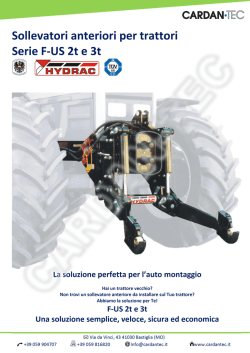
Tectonophysics 666 (2016) 103–120
Contents lists available at ScienceDirect
Tectonophysics
journal homepage: www.elsevier.com/locate/tecto
Relating natural heterogeneities and rheological properties of rocksalt:
New insights from microstructural observations and petrophyisical
parameters on Messinian halites from the Italian Peninsula
Giulio Speranza a,⁎, Alessandro Vona a, Sergio Vinciguerra b,c,d, Claudia Romano a
a
Dipartimento di Scienze, Roma Tre University, Viale Marconi 446, 00146 Roma, Italy
Department of Geology, University of Leicester, University Road, Leicester LE1 7RH, UK
c
British Geological Survey, Environmental Science Centre, Nicker Hill, Keyworth, Nottingham NG12 5GG, UK
d
Department of Earth Sciences, University of Turin, Via Valperga Caluso 35, 10125 Turin, Italy
b
a r t i c l e
i n f o
Article history:
Received 26 November 2014
Received in revised form 13 October 2015
Accepted 22 October 2015
Available online 10 November 2015
Keywords:
Rocksalt facies
Deformation microstructures
Rocksalt petrophysical parameters
Messinian
a b s t r a c t
The importance and economic interest of rocksalt as well as its influence on tectonics and applicative purposes
such as mining, hydrocarbons extraction, and nuclear waste storage are well known. Careful characterization
of physical and chemical properties of rocksalt is fundamental as the rocksalt behavior may influence its potential
use for applicative purposes. Mechanical and rheological properties of rocksalt have been extensively studied in
the past. However, the role of natural heterogeneities within rocksalt and their effect on salt rheology have not
been investigated quantitatively. Here we present a comprehensive salt facies study on Messinian rocksalt
from several Italian sites (Volterra Basin, Tuscany, Caltanissetta Basin, Sicily and Crotone Basin, Calabria). Four
salt facies end members have been identified and analyzed by optical analyses. The main facies-defining
characteristics resulted to be the primary salt crystal abundance, crystal size, roundness and orientation,
as well as the clay inclusion contents. Three out of four facies were placed on an evolutionary path from an
“immature,” with respect to the deformation history, to a “mature,” rocksalt. So we observed, with increasing
rocksalt maturity, a progressive disappearing of primary crystal remnants, increasing crystals elongation and
iso-orientation and decreasing in crystal size. This trend has been confirmed by differential stress calculation
from subgrain size. Through seismic waves velocity measurements and uniaxial compressive runs, specific salt
facies were tested. Results of the investigations demonstrate that the facies parameters have a distinct influence
on the rocksalt petrophysical parameters like P- and S-waves velocity, dynamic and static Young Modulus, elastic
limit, and strain at peak. Finally, this study allowed to suggest the subdivision of Volterra's salt sequence in three
different units that have been subjected to variable deformation degree in response to the different salt
characteristics.
© 2015 Elsevier B.V. All rights reserved.
1. Introduction
The importance and economic interest in rocksalt deposits and
salt bodies are well known and extensively studied (see Hudec and
Jackson, 2007 and references therein). The physical and rheological
properties of rocksalt have a profound influence on the tectonics and
they are considered to be crucial for understanding the mechanical response of geo-sites for applicative purposes such as mining, petroleum,
and nuclear waste storage (Hunsche and Hampel, 1999). However, the
majority of the literature uses the descriptive term “salt” for all rocks
composed mostly of halite, despite the paucity of pure halite sequences
in nature (Hudec and Jackson, 2007, and references therein).
⁎ Corresponding author. Tel.: +39 3349099657 (mob).
E-mail address: [email protected] (G. Speranza).
http://dx.doi.org/10.1016/j.tecto.2015.10.018
0040-1951/© 2015 Elsevier B.V. All rights reserved.
“Pure” rocksalt itself cannot be considered as an ideal isotropic rock
made up of salt crystals with the same characteristics (Pouya, 1991).
In fact, rocksalt is mainly constituted by two types of halite crystals:
primary and secondary. Primary “cloudy” crystals are developed by precipitation from water and/or overgrowth at the bottom of water body
(Lowenstein and Hardie, 1985). They appear white/gray to the naked
eye and opaque when looking with a microscope in transmitted light.
This is due to the countless cubic-shaped and randomly distributed
primary fluid inclusions contained in primary crystals (Speranza et al.,
2013). Growth bands and shapes like chevrons, cubes, and hoppers
are typical primary salt features. Secondary “clear” crystals derive
from primary crystals that are dissolved and deposited or recrystallized
(Lowenstein and Hardie, 1985, and references therein). Secondary crystals appear transparent under the microscope due to the progressive
dissolution of the “cloudy” crystals in favor of secondary salt with
lower fluid inclusions content. However, not all the fluids escape the
104
G. Speranza et al. / Tectonophysics 666 (2016) 103–120
mineral. Secondary fluid inclusions, gas- or water-filled, are always
present at crystal grain boundaries and in healed fractures as the result
of fluid transfer during deformation/recrystallization processes (Peach
and Spiers, 1996; Pennock et al., 2005, 2006; Schléder and Urai, 2005;
Ter Heege et al., 2005a, b; Urai and Spiers, 2007).
It is well known in fact that halite is prone to deformation, even early
after deposition and under weak tectonic stresses (Carter and Hansen,
1983; Carter et al., 1993; Franssen, 1994; Hunsche and Hampel, 1999;
Senseny et al., 1992; Ter Heege et al., 2005a). During deformation/
recrystallization processes, the shape and dimension of rocksalt crystals
can be easily changed and other structural anisotropy features can be induced by deformation in a salt body (Dubey and Gairola, 2000; Dubey
and Gairola, 2008; Lebensohn et al., 2003; Lloyd et al., 1997; Piazolo
et al., 2006). Repeated changes of stress conditions will also affect the
mechanical properties of rocksalt (Fuenkajorn and Phueakphum,
2010). Therefore, not only the salt facies characteristics but also the
deformation history may exert important influence on the rheological
behavior of rocksalt and therefore has to be taken into account.
Previous studies on halite mechanical properties and rheological behavior have been mostly based on synthetic rocksalt or commercial salt
(e.g. Franssen, 1994; Peach and Spiers, 1996; Pennock et al., 2006;
Spiers et al., 1990; Ter Heege et al., 2005a, b), which are usually
devoided of hetereogeneities and impurities. To our knowledge, the
role of natural heterogeneities and their effect on salt rheology have
never been quantitatively investigated. Moreover, non-evaporitic
rocks as clay that can be found dispersed in saltrocks may influence
the overall rheology of a “salt” body.
The objective of this investigation is to fill this substantial gap
of knowledge, by studying the microstructural and mechanical characteristics of a natural rock salt sequence characterized by a marked
salt facies variability and a significant deformation history, such the
Messinian Saline di Volterra Formation, Volterra Basin, Tuscany, Italy
(Fig. 1). Our goals are to recognize and analyze quantitatively the
main microstructural features characterizing Volterra's natural rocksalt
by means of thin section analysis using both transmitted/reflected light
microscope and digital image analysis. Once identified the salt facies
Sampling Sites
N
46˚
Volterra
Basin
44˚
Ad
ria
tic
42˚
Ita
40˚
Tyrrhenian
Sea
ly
Se
a
Z1 and V1
diapirs
Ionian Sea
38˚
Racalmuto
mine
km
36˚
0
8˚
10˚
12˚
2. Geological settings
2.1. The Volterra Basin
The Volterra Basin is located in the western part of Tuscany (Fig. 1).
It is an NW-SE elongated extensional basin opened in response to the
eastward migration of the Apennine thrust-belt. The basin is filled
with a sedimentary succession spanning from late Tortonian to Pliocene
(Testa and Lugli, 2000), which includes an upper Messinian evaporitic
succession consisting of alternating gypsum, conglomerates, sandstone,
claystone, and halite. The salt deposit of the Saline di Volterra Formation
is divided into several levels, with intercalations of clay, silt, laminitic
anhydrite, sandstones, and microconglomerates, for a total thickness
ranging from few meters to nearly 200 m. Halite represents roughly
40% of the total volume of the series, and it is characterized by moderate
bending and minor diapiric movements. Gypsum, gypsarenite, and
microcrystalline gypsum are present in the series along with salt. The
Volterra area was extensively drilled for the exploitation of salt levels
by the Solvay Company. Study samples come from cores of S1113 borehole, which cuts through the rock salt for 43 m between 122 and 165 m
depth. We collected 16 cores (around 30 cm long with a diameter of
11 cm) for a total thickness of 4.2 m (Fig. 2). According to Testa and
Lugli (Testa and Lugli, 2000) and references therein, the Saline di
Volterra Formation had undergone a maximum burial depth of about
800 m during Lower Pliocene, when the heat flow in the basinal area
was of 85 mW/m2. Considering also the conductivity of shale, that
represents the majority of the sediments column overlying the salt
deposit in Lower Pliocene (Testa and Lugli, 2000), a maximum burial
temperature for salt of about 50–60 °C can be estimated. Since the late
Early Pliocene, the emplacement of several magmatic bodies at upper
crustal depth took place around the Volterra Basin area, producing a
heat flow increase up to 110 mW/m2 (Testa and Lugli, 2000). However,
the magmatic bodies' emplacement led to basinal uplift and progressive
decrease of the salt burial depth, ruling out a remarkable temperature
increase compared to the maximum burial temperature.
2.2. The Caltanissetta and Crotone Basin
Petralia
mine
6˚
end members, we characterized the main petrophysical and mechanical
parameters in laboratory by carrying out ultrasonic waves velocity
measurements and uniaxial compression tests. In addition, further
Messinian rocksalt samples from Petralia and Racalmuto salt mines,
Caltanissetta Basin, Sicily, and from Zinga 1 and Vitravo 1 salt diapirs,
Crotone Basin, Calabria, have been selected and studied by thin section
analysis as terms of comparison to the salt facies end members identified from Volterra samples. Furthermore, the Saline di Volterra Formation gives us the possibility to observe and analyze the transition
between the facies end members, so we can suggest an evolutionary
path that relates rocksalt characteristics, degree of deformation, and
its evolution and petrophysical and mechanical parameters. Our study
on natural rocksalt revealed the significant variability of salt facies
that can be found in nature and that different facies show their own
mechanical response, suggesting that when one deals with synthetic
salt, natural conditions need to be taken in account.
14˚
Fig. 1. Sampling sites map.
500
16˚
18˚
20˚
The Crotone Basin (Lugli et al., 2007; Roda, 1964; Zecchin et al.,
2004) is a forearc basin in central Calabria, between the Sila Massif
and the Ionian Sea. Its Neogene evolution is related to the Calabrian
Arc and to the rollback of the Calabrian subduction zone since
Serravallian time (Faccenna et al., 2004; Faccenna et al., 2007; Mattei
et al., 2007; Speranza et al., 2003 and references therein). The
Serravallian-to-Pleistocene sedimentary succession of the basin consists
of three sedimentary cycles made up of conglomerates, sandstones, and
claystone deposits, as well as a Messinian evaporitic interval that
includes gypsum beds, gypsum breccias, claystones, sandstones, conglomerates, and halite. In the Crotone Basin, the halite deposit has
G. Speranza et al. / Tectonophysics 666 (2016) 103–120
variable thickness (up to 200 m) and crops out in the northern part of
the basin, particularly in the Vitravo River area. There, small diapiric
structures cut through the uppermost Messinian and Lower Pliocene
claystone deposits. Samples for this study were collected from the
outcrop of the Zinga 1 and Vitravo 1 diapirs, close to the Zinga village
(Fig. 1).
The Caltanissetta Basin (Decima and Wezel, 1971; Keogh and Butler,
1999; Roveri et al., 2008) is an NE–SW elongated depression located in
south-western Sicily, consisting of a complex array of synclines that
host a Tortonian to Plio-Quaternary sedimentary succession. The folds
form a series of sub-basins that continued to deform as part of the
105
evolving Maghrebian orogenic wedge. The sedimentary fill of the
whole basin includes Tortonian subaerial clastic rocks, shallow marine
sands, patch reefs, hiatuses and deposits related to the Messinian Salinity Crisis (MSC), such as the Lower Evaporites and the Upper Evaporites
(including halite), which are separated by a basin-scale erosional
surface (the Messinian Erosional Surface, MES). Plio-Quaternary chalk
and conglomerates complete the sedimentary filling of the basin. Halite
deposits occur as several independent bodies aligned NE–SW in a
20-km wide belt. These bodies, with an average thickness of 500 m,
are affected by intense shortening. A typical rock salt succession in the
Caltanissetta Basin shows a basal layer of breccia, followed by halite,
Fig. 2. Schematic drawing of the collected S1113 borehole cores (Volterra Basin), showing salt, clay blocks, and thin strata (black lines) and some other salt features and structures easily
recognizable to the naked eye. Depths of the base and top of each core are reported. Green and blue circles specify the source and names of samples used for the petrophysical experiments.
Names and sources for the thin sections are also provided. Finally, pictures of analyzed cores and salt facies end members location (colored bars) are displayed.
106
G. Speranza et al. / Tectonophysics 666 (2016) 103–120
anhydrite, and K–Mg salts with claystone intercalations. In this study,
halite samples are from the active salt mines of Petralia Sottana and
Racalmuto (Fig. 1).
3. Macroscopic description of salt facies
At Volterra, from the base of the salt series (165 m of depth) to
161 m, the salt is light gray (Fig. 2, A–B). Primary “cloudy” crystals,
from less than 1 mm to 1 cm in length, are very abundant. Some typical
primary features, like chevron crystals and growth bands, are easily
recognizable (Speranza et al., 2013). Some very thin (around 2 mm)
clay strata, intercalated with salt, are visible. Between 158 and
155 m (Fig. 2, C), primary crystal abundance decreases in favor of
large (up to 4 cm), secondary “clear” crystals. Particularly, a thin
(around 6/8 cm) salt layer made up only of secondary, rather big
and blocky crystals can be observed at a depth of around 158.6 m.
Thin clay strata are also present together with small (1–4 mm) anhydrite nodules. From a depth of 149 m, clay strata and blocks increase in
thickness and dimension. Around 141 m depth, the salt becomes very
dark, with very few primary crystal remnants and some little clay inclusions (Fig. 2, D). The grain size appears to be smaller with clearly
elongated and inclined crystals. On the whole, the salt facies appears
to be very uniform. Between 140 and 135 m depth, the clay fraction
becomes more abundant than salt, with several large (up to 20 cm) irregular-shaped blocks, variously oriented (even vertically) and deformed (Fig. 2, E). Here the halite is dark gray, made up mainly of
secondary crystals, elongated on a slightly inclined horizontal plane,
with only few remnants of “cloudy” salt. Above 130 m of depth
(Fig. 2, F–G), the clay fraction abundance decreases. Between 130
and 126 m depth, the salt fraction becomes prevalent again, with
slightly lighter colored halite and the predominance of secondary
crystals. Primary features are nevertheless still preserved and evident.
Moreover, here, the rocksalt is clearly banded, with alternating darker
and lighter bands, on a dm scale, inclined by 25–35°. Namely, lighter
bands show greater abundance in primary crystals compared to
darker ones. At the top of the salt series (122 m depth), only a small
amount of salt crystals remains as fractures-filling cement between
very large and fractured clay blocks.
From these macroscopic observations, we could identify four main
salt facies along the Saline di Volterra series (Fig. 2). We assigned to
each facies the following roman numbers and colors:
1) Type I (green): salt with great abundance in primary crystal
remnants, located at the base of the Saline di Volterra Formation
(165 – 161 m of depth);
2) Type II (black): salt made up mainly of secondary crystals with
abundant clay inclusions and some primary crystal remnants,
that constitute the upper part of the salt sequence (132–126 m of
depth);
3) Type III (red): salt made up of secondary crystals, with an appreciably smaller grainsize, found in the middle of the salt series at about
141 m of depth;
4) Type IV (blue): salt made up of rather large and blocky crystals of
secondary origin found at 158 m of depth.
Salt samples from Petralia and Racalmuto mines (Speranza et al.,
2013) and from Z1 and V1 diapirs selected for comparison with Volterra
series, although coming from different locations with different geological settings, appear to fit quite well in the classification scheme defined
above. In particular, salt samples from Racalmuto mine and V1 diapir
are very rich in primary crystal remnants and appear almost undeformed (type I); Petralia mine sample is rather comparable to the type
IV salt being constituted by only secondary, slightly deformed salt
crystals, although much smaller than those pertaining to Volterra series;
finally, Z1 diapir salt is very highly deformed and recrystallized and so
can be easily associated to the type III salt.
4. Analytical and experimental methods
Salt facies were investigated by i) microstructural analysis with
ImageJ software, ii) laboratory ultrasonic waves velocity measurements,
and iii) uniaxial compressive tests.
4.1. Microstructural analysis
Microstructural analyses of the selected samples were performed in
order to recognize and define quantitatively the most important features characterizing the rocksalt facies. Ten thin sections representative
of the four main salt facies defined above were prepared (cf. Table 1).
Each section has a length of 4.8 cm. Thin section name shows the salt
type (I, II, III, or IV) and, for the Volterra Basin samples only, the sample
depth within the Saline di Volterra Formation (cf. Fig. 2).
Preliminary observations on the thin sections were performed using
a plane polarized transmitted light microscope (Nikon optiphot-pol)
equipped with a digital camera. Then the sections were scanned using
an Epson V750 Pro unit equipped with a transparency adapter. The
scanning resolution (interpolated) was 1800 dpi yielding images of
around 3500 by 2000 pixels. Each image was enhanced with a photoediting software in order to increase the contrast and highlight the
grain boundaries.
Afterwards, each scanned image was imported and mapped in the
ImageJ software (http://rsbweb.nih.gov/ij/index.html). For each
section, crystals were manually outlined to produce binary images.
This operation was repeated for primary crystals remnants and clay
inclusions, when present. Binary images were then analyzed with the
ImageJ software, and several numerical parameters for each particle
were extracted, including the crystal area, orientation, and size
(expressed as major and minor axes of the ellipse of equivalent area;
e.g., Higgins, 2006). Particle elongation is quantified as the roundness
parameter (minor axis/ major axis), which corresponds to the inverse
of aspect ratio. Decreasing roundness from unity (equant shape)
indicates increasing particle elongation. To express the distribution of
particle shapes in each sample, we used the average roundness value
and a parameter (shape uniformity, χ), representing the deviation
from this value. Shape uniformity χ is calculated as the coefficient of
determination (R2) of the linear regression of major vs. minor axes
data. High values of χ (up to χ = 1) indicate a uniform distribution of
the crystal shapes. Three-dimensional crystal habits were then obtained
by applying a 2D–3D stereological conversion using the CSDslice
software implemented by Morgan and Jerram (2006). This software
compares the distribution of 2D size measurements to a database of
shape curves, determining through regression calculation a best-fit 3D
crystal habit in terms of short (S), intermediate (I), and long (L) axis.
As a final step, all thin sections plus six additional sections (see
Table S1 in the Supplementary Material) were etched under running
water for few seconds and prepared for further observations. Further
analyses were then performed using a plane polarized reflected light
microscope (Zeiss Stemi 2000C) equipped with a Nikon Coolpix digital
camera. Etching process (Urai et al., 1987) is important as it allows to
observe substructures as subgrains, visible in reflected light only. The
subgrain size analysis, through reflected light microscope observation
and ImageJ software, was carried out in order to obtain differential
stress values.
4.2. Laboratory ultrasonic waves velocity measurements
Nine samples were cut in the shape of cubes (C1–C9) of 5 cm length
from the collected S1113 cores (Saline di Volterra Formation). Five
samples are representative of the type I salt (C3–C7), and they differ
by the presence of horizontal or inclined thin clay layers; three are
from the type II salt (C2, C8, and C9), whereas one sample is from the
type III salt (C1) (cf. Fig. 2). Facies IV samples were not prepared because
the amount of type IV salt was insufficient for ultrasonic waves
G. Speranza et al. / Tectonophysics 666 (2016) 103–120
measurements. P- and S-waves velocity measurements were carried
out along each cubic axis (X, Y, and Z) at the HP-HT Laboratory of Istituto
Nazionale di Geofisica e Vulcanologia, Rome. A high-voltage (900 V)
pulse generator was used to generate elastic waves while P and S piezoelectric transducers with resonance frequency at 1 MHz were used in
order to keep a correct ratio between wavelength and sample size.
From the velocity measurements, the dynamic Young modulus (Ed)
and the Poisson ratio (ν) were calculated (Ciccotti et al., 2004;
Vajdova, 1999; and references therein).
107
temperature was attained by a Zircar FIH fiber insulated tube furnace
and was monitored and controlled using a K-type thermocouple. Very
small vertical temperature gradients (lower than ±1 °C) and symmetrical temperature profiles were measured within the sample during
the experiments using an external K-type thermocouple. Samples
were deformed to about 20% axial strain.
5. Results
5.1. Textural analysis
4.3. Uniaxial compressive experiments
Uniaxial experiments were carried out at both ambient temperature
and 200 °C on prismatic samples cut from the cubes used for the ultrasonic waves velocity measurements.
Uniaxial runs at constant strain rate of 5.5*10−5 s−1, T = 20 °C and
atmospheric pressure were carried out on five samples measuring
5 × 3 × 3 cm: C3 and C7 (type I), C2 (type II), and C1 (type III)
(cf. Fig. 2). As for ultrasonic waves velocity measurements, deformation
experiments were only carried out on type I, II, and III salts and not on
samples from type IV. Tests were carried out at the HP-HT Laboratory
at Istituto Nazionale di Geofisica e Vulcanologia, Rome, using a servocontrolled uniaxial testing machine which allows to test the sample
under a variety of loading conditions up to 250 kN. The hydraulic system
consists of a cylinder with a servo valve control and a free-standing
pump/reservoir. The system is completed by a linear variable displacement transducer (LVDT) extensimeter, developed to measure axial
deformations with a resolution of μm, during the loading.
Stress/strain data were registered during the deformation process
until failure occurrence. From these data, static Young modulus (Es),
peak stress, strain at peak, and elastic limit values were calculated
(Ciccotti et al., 2004, and references therein).
Uniaxial compressive experiments at constant strain rate of
1*10−5 s−1, T = 200 °C and atmospheric pressure were carried out on
three samples measuring 2.5 × 1.5 × 1.5 cm: C6 (type I), C8 (type II),
and C1 (type III) (cf. Fig. 2). Tests were carried out in the EVPLab at
Roma Tre University, Rome, using a GeoComp LoadtracII unit. Displacement is achieved by controlling the position of the bottom platen using
an electronic stepper motor with a displacement speed range from
5*10−6 to 2.5*10− 2 cm s−1 and measured using a linear variable
displacement transducer (LVDT). The press allows loads up to about
40 kN generating stresses on the samples of 20–30 MPa. High
5.1.1. Qualitative observations
Preliminary reflected and transmitted light microscope observations
of the thin sections have been performed in order to recognize the main
features of the facies end members.
Type I samples, V161-I-v, V161-I-h, and Ra1-I, are characterized by a
great abundance of primary crystals, showing as a result dark gray
colors in transmitted light and white/light gray colors in reflected
light. The crystals vary in sizes from less than 1 mm to around 1 cm in
length and have typical primary salt shapes like chevrons and hoppers
(Lowenstein and Hardie, 1985; Speranza et al., 2013) with easily recognizable growth bands (b and d in Fig. 3; d–7 in Fig. 4). A sub-vertical
preferred orientation of the chevron crystals axes is visible. The majority
of the primary crystals are “remnants,” being more or less eroded and
worn. The erosion of a primary salt crystal leads to the formation of a
secondary “clear” salt that appears white in transmitted light and dark
gray in reflected light. Indeed, type I salt crystals are almost always
constituted by a “core” of primary salt surrounded by a rim of secondary
salt (g in Fig. 3). However, primary remnants can be found not only in
the core but also at the edge of a given crystal (b and d in Fig. 3) or in
a off-center position. Areal ratio between primary and secondary salt
within a single crystal is variable and sometimes more than one
remnant can be found inside the same crystal. Two kinds of transitions
between primary and secondary salt could be identified within a given
crystal: the first transition sharp and clear (a-1, b-3, and b-4 in Fig. 3; b-1
in Fig. 4) and the second transition more gradual (a-2 and g in Fig. 3)
(cf. also b in Fig. 4). Both transitions can be found on the same primary
crystal remnant. Type I crystals are not elongated and do not have a
clear iso-orientation, and pure secondary salt crystals are very rare. In
some cases (d and h in Fig. 3), crystals shape, dimension, and orientation
are closely related to those of the contained primary crystal remnant.
However, in other crystals (c and e in Fig. 3), such a relationship is
Table 1
Thin sections analysis data summary. The last column of the table below reports names of the sample used for ultrasonic waves velocity measurements and uniaxial compressive tests.
Slice
Facies
Site
Number of grains
Average crystal area (mm2)
Orientation (°)
Average roundness
Shape uniformity (χ)
V161-I-v
V161-I-h
V132-II
V130-II
V126-II
V141-III
V158-IV
Ra1-I
Zi1-III
Pe3-IV
I
I
II
II
II
III
IV
I
III
IV
Volterra
Volterra
Volterra
Volterra
Volterra
Volterra
Volterra
Racalmuto
Crotone
Petralia
304
224
603
431
284
761
177
169
247
355
1.968
2.883
0.846
1.592
2.587
0.522
4.952
3.617
0.778
1.279
92
80
73
72
115
52
84
93
93
52
0.55
0.59
0.42
0.38
0.40
0.41
0.59
0.63
0.27
0.52
0.82
0.85
0.77
0.71
0.78
0.53
0.9
0.83
0.61
0.68
Slice
Facies
3D particle shape
Salt %
Primary %
Clay %
Depth S1113
Equiv. sample
V161-I-v
V161-I-h
V132-II
V130-II
V126-II
V141-III
V158-IV
Ra1-I
Zi1-III
Pe3-IV
I
I
II
II
II
III
IV
I
III
IV
1:1.6:3
1:1.5:2.5
1:2:3.8
1:2.5:3.8
1:2.9:3.8
1:1.9:4
1:1.2:2
1:1.25:1.7
1:2.9:7
1:1.5:2.8
99.2
100
82.6
95.0
99
98
100
100
81.4
100
18.5
19.3
7.7
8.8
14.8
1.1
2.3
19.3
0
0
0.8
0
17.4
5.0
1.0
2.0
0
0
18.6
0
161
161
132
130
126
141
158
-
C3-C4-C5-C6-C7
C3-C4-C5-C6-C7
C8-C9
C2 (C2b)
C1 (C1b)
108
G. Speranza et al. / Tectonophysics 666 (2016) 103–120
absent. Crystal boundaries appear as thin dark lines (transmitted light,
Fig. 3) or light lines (reflected light, Fig. 4), with the thickness depending on the angle between crystal boundary and thin section plane, and
appear always decorated by a complex network of secondary fluid inclusions (d-6 in Fig. 4). Healed fractures containing arrays of secondary
fluid inclusions have also been observed.
Type III and IV salt samples (V141-III, Zi1-III, V158-IV, Pe3-IV) contain almost only secondary salt crystals with no or very few primary
salt remnants. Moreover, in the type III salt, crystals show a very clear
and pronounced elongation and the grainsize is noticeably smaller compared to the other types crystals (c in Fig. 3). Type II salt may show the
characteristics observed in both type I and III–IV with an intermediate
crystal elongation and primary crystal content. If larger clay inclusions
are present (V132-II and V130-II), salt crystals in their proximity appear
highly elongated and deformed. In a few cases, longer primary crystal
remnants appear fractured (f in Fig. 2), without noticeable displacement
at crystals boundaries.
Thin sections etched with water revealed the presence in all samples
of subgrains (f and g in Fig. 4). It should be noted that subgrain-rich
crystals are more abundant in type II, III, and IV salt compared to type
I. Subgrain size appears larger in types I and IV compared to type II
and III salts.
Solution–precipitation features and fluid-enhanced grain nucleation
and grain boundary migration evidences have been observed (Fig. 3 and
4), particularly in type II, III, and IV salt samples. These samples show
higher amounts of subgrain- and fluid inclusions poor crystals, features
that can be interpreted as due to new, strain-free, recrystallized grains
(Carter and Hansen, 1983; Schléder and Urai, 2005; Senseny et al.,
1992) (b in Fig. 3; a, f, and g in Fig. 4).
5.1.2. Quantitative determinations
Results of the image analysis are reported in Table 1. In particular,
the number of analyzed particles, average particles area, orientation of
the major axis (0° means vertical), particles average roundness
(minor/major axis), and shape uniformity χ, 3D particles shape and
the estimated relative amounts of different mineral components
(Salt%, Primary Salt%, Clay%), are reported.
The number of analyzed particles varies between 169 (Ra1-I) and
761 (V141-III) with an average area ranging between 0.5 (V141-III)
and 4.9 mm2 (V158-IV). Major axis angle averages approximately 90°
(horizontal, V161-I-v, Ra1-I) with a maximum inclination of 35–40°
(V141-III, Pe3-IV); average roundness is comprised between 0.27
(Zi1-III, very elongated crystals) and 0.63 (Ra1-I, much more rounded)
and the shape uniformity χ results higher (around 0.8–0.9, indicating
lower data dispersion) for V161-I-h, V161-I-v, and Ra1-I sections and
lower (around 0.5–0.65) for Zi1-III and V141-III sections. Crystal habits
vary between 1:1, 25:1, 7 (Ra1-I, almost cubic crystals) and 1:2, 9:7
(Zi1-III, elongated prismatic crystals). Finally, the estimation of the
components distribution indicates that type I salt contains about 20%
of primary crystals while this percentage decreases to ca. 14–7% for
the type II, reaching almost 0% in the type III and IV salt. Also the clay
component is variable, reaching 17% in the type II salt (V132-II sample).
From the 3D scatter plot (Fig. 5) relating average crystal area,
average crystal roundness, and shape uniformity χ, it can be observed
Fig. 3. Details from thin sections scanning. Dark gray areas are primary crystals remnants; secondary salt is in white to light gray; dark lines are crystal boundaries and fractures with
secondary fluid inclusions arrays. Further explanations in text. a: V161-I-v; h: V126-II; d, e, g: V161-I-h; f: Ra1-I; c: V141-III.
G. Speranza et al. / Tectonophysics 666 (2016) 103–120
109
Fig. 4. a) Suggested solution–precipitation-related salt crystals. Two primary crystal remnants (dark gray areas) were pushed together (red lines – white arrows) while newly formed clear
salt is deposited and crystals grow in a direction more or less perpendicular to the compression axis. b) Detail from a), showing the effect of a suggested solution–precipitation mechanism
in dissolving (area within dashed line) progressively a primary salt remnant. 1: sharp transition between primary and secondary salt; 2: crystal boundary; 3: primary crystal remnant; 4:
isolated fluid inclusions, perhaps left after the primary salt remnant erosion. c) Crystal boundaries (5) appear bright in reflected light due to the presence of secondary fluid inclusions.
d) Detail from c) showing the complex network (6) of secondary fluid inclusions almost always present at crystal boundaries, suggesting the effectiveness of fluid migration and entrapment in salt. 7: primary salt remnant (within the dashed line) made up of countless primary fluid inclusions organized in growth bands. e) Fluid-assisted grain boundary migration
evidence (within the red frame). f) Detail from e) showing a crystal boundary (9) migrated toward the upper-left corner from a former position outlined by a straight secondary fluid
inclusions array (yellow dashed line). The migrating crystal boundary has worned out part of a large, subgrains and primary fluid inclusions-rich (8) crystal, leaving backward new,
subgrain and fluid inclusions poor salt. Notice that the core of the crystal (within white dashed line) is still primary fluid inclusions rich. g) In more deformed salt, together with
subgrain-rich crystals (12), strain-free, subgrain poor crystals (13) become more abundant. a), b), and g): V126-II section. c), d), e), and f): Ra1-I section. b) to g) are reflected light
photomicrographs.
110
G. Speranza et al. / Tectonophysics 666 (2016) 103–120
that these three parameters are directly proportional. Moreover, it can
be seen that type I samples (V161-I-v, V161-I-h, and Ra1-I) and the
V158-IV (type IV) sample show higher roundness and average crystal
area, as well as a lower shape data dispersion (higher χ). In type II
(V130-II, V126-II, and V132-II) and III (V141-III, Zi1-III) samples, a
decrease in average crystal area coupled with a lower roundness
(i.e. higher crystal elongation) and higher shape variability (lower χ)
occurs. In this case, the Pe3-IV (type IV) sample fall close to type II
samples, showing rather different characteristics with respect to the
V158-IV section.
Rose diagrams for the crystal orientation (Fig. 5) show that, regardless of the elongation, crystals' major axis lies on a horizontal or inclined
direction, with the tilt angle mostly comprised in the 0°–30° range.
Nevertheless, type I samples show a more pronounced tilt angle variability (for instance Ra1-I section) compared to type II and especially
III samples (V141-III and Zi1-III), whose crystals show the highest
degree of iso-orientation.
Furthermore, selecting only type I samples, rich in primary crystals,
and plotting in the same rose diagram, the major axis orientation for
both all crystals and only for the primary ones (Fig. 6), a rather good correlation between the two datasets can be observed. Finally, the average
crystals area vs primary crystal content plot (Fig. 6) suggests that these
two parameters are directly proportional, with the exception of the
V158-IV section.
In addition to the textural analyses presented above, we performed
subgrain size analysis and differential stress calculation on all sections
except for the V161-I-v sections, where subgrains are nearly absent. It
is known (Carter et al., 1993; Schléder and Urai, 2005; Senseny et al.,
1992) that the steady-state subgrain size is inversely proportional to
25
all crystals
major axis
angles
Primary Crystals %
primary
crystals major
axis angles
V161-I-h
20
Ra1-I
V161-I-v
15
V126-II
10
V132-II
V130-II
5
V158-IV
V141-III
Zi1-III
0
0
Pe3-IV
1
2
3
4
5
Other sites samples
Fig. 6. Average crystal area vs primary crystal content scatter plot and major axis orientation for all crystals (green) and only for primary crystal remnants (yellow) from V161-I-v,
V161-I-h and Ra1-I sections (type I salt). A linear fitting for scatter plot data (all samples
except V158-IV) is also provided (black line).
V161-I-v
Ra1-I
V132-II
V161-I-v
V158-IV
V161-I-h
V158-IV
rmity (χ)
Ra1-I
V126-II
V132-II
Shape Unifo
V126-II
Pe3-IV
V130-II
Zi1-III
V141-III
Pe3-IV
V130-II
nd
Ar
ou
tal
ea
lR
ys
(m
ta
Cr
ne
ss
Av
era
ge
Cr
ys
m2
)
Volterra Samples
Other sites samples
Zi1-III
6
Average Crystal area (mm2)
Volterra samples
V141-III
Fig. 5. 3D scatter plot relating average crystal area, average roundness, and shape uniformity χ from thin sections analysis. Rose diagrams for each section are also reported.
G. Speranza et al. / Tectonophysics 666 (2016) 103–120
associated all type III samples, the remaining type II samples, and the
Pe3-IV sample (type IV). The Ra2-IV sample falls at the highest stress
value of 1.99 MPa. A clear separation between the “lower stress”
(V158-IV-h, V158-IV, V122-IV) and “higher stress” (Pe3-IV, Ra2-IV)
type IV samples (named IV-L and IV-H, respectively) can be observed,
so we decided to divide the type IV facies in these two groups.
By considering the average stress value for each facies group and
relative standard deviation (Fig. 7, black line), a progressive stress difference increase from type IV-L to type I and II toward type III and finally
type IV-H samples can be observed. Furthermore, type II and IV-H
samples show higher stress variability compared to type IV-L, III, and I,
the last displaying the lowest standard deviation.
Table 2
Subgrain size analysis data summary.
Slice
Count
Average subgrain
diameter (μm)
Differential
stress (MPa)
Facies
Site
V161-I-h
V135-II
V139-II
V132-II
V130-II
V126-II
V141-III
V122-IV
V158-IV
V158-IV-h
Ra1-I
Cr1-I
Zi1-III
Ra2-IV
Pe3-IV
41
25
89
52
54
73
48
93
58
57
51
101
23
31
32
280
154
163
142
287
249
147
279
372
411
254
300
180
97
180
0.79
1.33
1.27
1.43
0.77
0.88
1.39
0.79
0.62
0.57
0.86
0.75
1.16
1.99
1.16
I
II
II
II
II
II
III
IV
IV
IV
I
I
III
IV
IV
Volterra
Volterra
Volterra
Volterra
Volterra
Volterra
Volterra
Volterra
Volterra
Volterra
Racalmuto
Crotone
Crotone
Racalmuto
Petralia
5.2. Laboratory ultrasonic waves velocity measurements
the stress difference experienced by the crystals following the relation:
D ¼ kσ −m
1
where D is the average subgrain size (μm), σ is the differential stress
(MPa), while k and m are material constants. We used this relation to
calculate the stress difference for our samples, setting k = 214 and
m = 1.15, as best suggested values in (Carter et al., 1993)]. Thus, the
relation (1) becomes
σ ¼ 105 D−0;87
2
The average subgrain diameter (D) varies between 411 μm (V158IV-h) and 97 μm (Ra2-IV), so the calculated (Eq. (2)) differential stress
values resulted between 0.57 MPa (V158-IV-h) and 1.99 MPa (Ra2-IV)
(Table 2).
In Fig. 7, differential stress data as a function of sample type are
plotted. Lower stress values, ranging between 0.57 Mpa (V158-IV-h)
and 0.88 MPa (V126-II) are associated with all type I samples, three
type IV samples and two type II samples. Higher stress values, ranging
between 1.16 MPa (Zi1-III and Pe3-IV) and 1.43 MPa (V132-II), are
Differential Stress
from subgrain size
Volterra samples
Other sites samples
Ra2-IV
(Carter et al., 1993)
Differential Stress (MPa)
1.8
1.6
V132-II
V141-III
1.4
V139-II
Table 3 shows the results of laboratory ultrasonic waves velocity
measurements on the different salt types. Vp (P-waves velocity, average
from X-Y-Z axes), Vs (S-waves velocity, average as for Vp), and the
standard deviation (relative to the three axes values) for these two parameters are reported, along with calculated dynamic Young modulus
(Ed) and the Poisson's ratio (ν) (Ciccotti et al., 2004).
Vp and Vs values for X, Y, and Z axes of each sample are shown
in Fig. 8. It can be observed that Vp and Vs values for X and Y axes
are very similar and homogeneous in all the investigated salt facies
(especially for P-waves), whereas Vp and Vs values for Z axis are more
variable (i. e. show higher standard deviation) and are generally lower
than the Vp and Vs values for X and Y axes, both on average and within
the same sample. Average Vp values vary between 4196 m/s (C7, type
I) and 4521 m/s (C2, type II), with a systematic lower value of about
5% for type I. Average Vs values are comprised between 2425 m/s (C4,
type I) and 3072 m/s (C2, type II) with a lower value of about 9% for
type I. On average, the standard deviation for Vp is about two times
higher for type I samples (C5 through C7) than for type II and III samples
(C1–C2 and C8–C9). The standard deviation for Vs shows similar trends
and it is approximately three times higher for type I samples compared
to values for the other samples types.
In terms of dynamic Young moduli, values mirror, as expected, the
elastic waves velocity (Table 3) behavior, with values higher of about
10% for type II and III samples with respect to type I samples.
Table 3
Ultrasonic waves velocity measurements and Elastic moduli data summary.
2.2
D=kσ-m
k=214
2 m=1.15
111
V135-II
Pe3-IV
1.2
Sample
Facies
Average
Vp (m/s)
Average
Vs (m/s)
St. Dev. P
St. Dev. S
E (GPa)
ν
C3
C4
C7
C5
C6
C2
C8
C9
C1
Average
I
I
I
I
I
II
II
II
III
–
4345
4280
4196
4262
4257
4521
4494
4448
4382
4354
2516
2425
2717
2955
2630
3072
2860
2743
2869
2754
29.7
86.1
289.4
202.8
162.2
122.9
121.7
36.8
68.9
125
117.6
166.7
220.6
214.8
307.1
48.5
37.9
148.4
57.4
147
34.2
32.2
36.4
39.2
35.7
43.8
41.1
38.9
40.1
38
0.198
0.21
0.1
0.025
0.15
0.049
0.12
0.15
0.091
0.12
Zi1-III
1
5.3. Uniaxial compressive experiments
Ra1-I
0.8
V122-IV
Cr1-I
V161-I-h
V126-II
V130-II
V158-IV
0.6
V158-IV-h
Samples
Fig. 7. Calculated differential stress from subgrain size plot (colored dots) and average
values for each facies group along with relative standard deviation (line and bars). Values
are grouped according to the salt facies Further explanations in text.
Table 4 shows the results of uniaxial compressive experiments. At
room temperature, peak stress values range from 28.3 MPa (C3, type
I) and 31.7 MPa (C1b, type III). Static Young modulus (Es) varies
between 2.8 GPa (C1b, type III) and 10.2 GPa (C3, type I) (average
value 5.3 GPa). Strain at peak spans between 2.6% (C3, type I) and
3.9% (C1b, type III), while the approximate values of elastic limit are
between 6.5 Mpa (C3, type I) and 13 Mpa (C1 and C1b, type III).
When temperature of 200 °C is applied, no peak stress values are
112
G. Speranza et al. / Tectonophysics 666 (2016) 103–120
5000
P− and S−waves velocity
P-Waves
Seismic waves velocity (m/s)
4500
4000
Type I
Type III
Type II
3500
S-Waves
3000
2500
X-axis
Y-axis
2000
Vp(x)=4383m/s; Vp(y)=4422m/s; Vp(z)=4256m/s
Vs(x)=2787m/s; Vs(y)=2849m/s; Vs(z)=2585m/s
1500
C2
C8
C9
C1
Vp-I=4268m/s; Vs-I=2648m/s
Vp-II=4488m/s; Vs-II=2892m/s
Vp-III=4382m/s; Vs-III=2869m/s
C3
C4
C7
Z-axis
average
C5
C6
Sample
Fig. 8. P and S wave velocity for X, Y, and Z axis (colored lines) and average velocity value (black line) for each cube. Values for X and Y axes are well comparable while values for Z axis are
more variable. Vp(x), Vp(y), Vp(z): average P-waves velocity for X, Y, and Z axis. The same applies to Vs(x) ecc for S-waves. Vp-I, Vp-II, Vp-III: average P-waves velocity for type I, II, and III
samples. The same applies to Vs-I ecc for S-waves. Average values from facies I samples are lower and show higher variability.
reached, suggesting a transition from brittle to plastic deformation. Es is
comprised between 0.35 GPa (C8, type II) and 0.48 GPa (C6, type III). Es
values at 200 °C are approximately 1/10–1/20 than the values at 20 °C.
We calculated that Es decreases of about 0.015–0.035 GPa/K, a decreasing rate in agreement with that reported in Senseny et al. [1992]. Moreover, at 200 °C, elastic limit approximate values are lower than at 20 °C,
varying from 6 Mpa (C8, type II, and C1, type III samples) and 9 Mpa (C6,
type I).
Fig. 9 shows deformation curves (Fig. 9a) and related peak stress and
static Young modulus values (Fig. 9b) from compressive runs at the
temperature of 20 °C. Deformation curves show the prevalence of
plastic behavior with deformation typical of the ductile regime with
different rates of strain softening once reached the peak stress. In particular, samples C3 and C7 (type I) begin to deform gradually at lower strain
(2.6–2.8%) compared to samples C1–C1b (type III) and C2b (type II)
(3.6–3.9%). Plot of peak stress vs static Young modulus (Fig. 9b) shows
that the two parameters are inversely proportional, without a clear
correlation to the facies type. In this case, the rather different C3
(type I) sample could be due to the effect of the thin, inclined clay
layer cross-cutting the sample that could have played as a preferred
slip surface during deformation.
Table 4
Uniaxial compressive tests data summary for both ambient temperature (above) and 200
°C temperature (below) experiments.
Sample
Facies
Temp.
(°C)
Strain
rate
(s−1)
Peak
stress
(Mpa)
Static E
(GPa)
Strain at
peak (%)
Elastic
limit
(Mpa)
C3
C7
C2b
C1
C1b
Average
C6
C8
C1
Average
I
I
II
III
III
–
I
II
III
–
20
20
20
20
20
–
200
200
200
–
5.5*10−5
5.5*10−5
5.5*10−5
5.5*10−5
5.5*10−5
–
1*10−5
1*10−5
1*10−5
–
28.3
30.9
30.5
30.8
31.7
30.4
–
–
–
-
10.2
4.1
6.5
3.1
2.8
5.3
0.48
0.35
0.36
0.4
2.6
2.8
3.6
3.7
3.9
3.3
–
–
–
–
6.5
10
11.5
13
13
10.8
9
6
6
7
Stress/strain curves from compression runs at 200 °C (Fig. 10) show
again a plastic deformation behavior, but this time, a strain hardening
behavior is observed. An initial pseudo-elastic deformation, up to
about 3–4% axial strain and values of up to 6–8 MPa, is followed by a
long strain hardening phase with the whole strain mirrored from a
stress increase of only about 6 MPa typical of a ductile deformation.
The samples show similar behavior, with higher stress values during
deformation pertaining to type I sample (C6) and slightly lower values
related to type III (C1) and type II (C8) samples, respectively.
6. Discussion
6.1. Microstructural facies definition and characterization
Description, origins, evolution, and relationships between primary
and secondary salt features have been extensively investigated in the
past (Lowenstein and Hardie, 1985, and references therein; Schléder
and Urai, 2005; Schléder and Urai, 2007). Primary salt crystals (chevron,
cubes, hoppers) with primary fluid inclusions-rich growth bands can be
partially eroded even in a syndepositional stage (Lowenstein and
Hardie, 1985) by undersaturated brine arrival in a shallow perennial
or ephemeral lake setting. Results of such a process are primary crystals
sharp truncations and deposition of clear, void-filling, halite cement,
around partially eroded crystals. These processes can operate repeatedly also during the early diagenetic stage (Lowenstein and Hardie, 1985).
Moreover void-rich, porous salt can also be subjected to deformation/
recrystallization processes, with progressive vanishing of primary
crystal remnants, formation of new, clear halite crystals, deformation
of crystal shape, fluid migration (Peach and Spiers, 1996; Pennock
et al., 2006; Ter Heege et al., 2005a, b; Urai and Spiers, 2007). In such
cases, deformation and accomodation-related processes like pressure
solution, dislocation creep, fluid-enhanced grain boundary migration,
microcracking, and so on, are active depending on the surrounding
P-T and stress conditions (Chester, 1988) and finally tend to produce
a more or less deformed, void lacking, totally recrystallized salt
(Schléder and Urai, 2005). Depending on the extent of the processes
that operate on “pristine” salt after deposition, actual rocksalt can
appear in various conditions, from a near-pristine to a completely
G. Speranza et al. / Tectonophysics 666 (2016) 103–120
A
113
B
Deformation Curves (20°C)
35
Peak Stress vs Es
33
Type III
30
C1b
C7
e
C3
20
II
Stress (MPa)
I
p
Ty
25
32
C1
Peak Stress (MPa)
Type
C2b
15
10
5
0
0.01
0.02
0.03
C7
31
C1
C2b
30
29
C3
28
T=20°C
-5 -1
Strain rate: 5,5*10 s
0
C1b
0.04
0.05
27
0.06
2
4
Strain %
6
8
10
12
Static Young Modulus (GPa)
Fig. 9. (a) Uniaxial compressive stress/strain curves and (b) related peak stress vs static Young modulus values for prismatic samples cut from cubes used in seismic waves velocity
measurements, tested at the temperature of 20 °C. Picture of the post-deformation C2b (type II) and C3 (type I) samples are provided. The white arrow on the C2b sample picture indicates
vertical fractures that are characteristic of the gradual samples failure at 20 °C. The black arrow on the C3 sample picture shows the thin clay layer that played as a preferred slip plane
during sample deformation.
the other sites for comparison purposes, Ra1-I sample from the Racalmuto
mine and Vi1-I sample from Crotone Basin showed similar values of the
facies-related characteristics, fitting well into the type I salt.
As previously said, two kinds of primary crystal boundaries were observed, the first sharp, probably related to dissolution in a syndepositional
stage (Schléder and Urai, 2005), and the second gradual (a-2 and g in
Fig. 3) (cf. also b in Fig. 4). We suggest that the gradual blending of a
primary salt remnant in secondary clear salt could be explained by
solution–precipitation creep and fluid-assisted grain boundary
migration mechanisms. In this case, fluid transfer (Pennock et al.,
2006; Ter Heege et al., 2005a, b; Urai et al., 1987) would gradually
remove primary fluid inclusions from primary salt and move the fluids
toward grain boundaries and healed fractures, leaving backward newly
formed, fluid inclusions poor, clear salt (a–b and e–f in Fig. 4). Type I
salt, despite the deformation degree “immaturity” and the pristinesalt-like appearance, shows some evidences of climb-controlled deformation and fluid-assisted grain boundary migration, suggesting that
these deformation mechanisms can be active in rocksalt even at low
stress and deformation degree. The fluids abundance and the
effectiveness of fluids migration (c–d in Fig. 3), that may ease the
deformed/recrystallized state. Moreover, considering impurities, as
clay, and other deposition- or deformation-related structures that
can be found along with and within salt, it is clear that the number of
possible rocksalt facies is very high.
Along the Saline di Volterra Formation, both macro- and microstructural study led to the observation, definition, and characterization of
four salt facies, which can be considered a good estimate of typical
end members that can be found within a salt deposit.
The 43 m thick salt sequence starts at the bottom (Fig. 2) with the
type I salt, rich in primary crystal remnants that have suffered a variable
degree of erosion and dissolution and are in contact with clear salt that
could have been generated both in a syndepositional–diagenetical or
early deformation stage. Crystals made up only of secondary salt are
nearly absent and just few contain subgrains. Thus, on the whole, the
deformation degree is low, as shown also by the higher average crystal
roundness, with high shape uniformity χ, poor crystals iso-orientation
and cubic-like 3D crystals habits (Table 1). Calculated differential stress
values are the lowest in our dataset (Fig. 7). We believe that the type I
salt characteristics are typical of a relatively “immature,” with respect to
the degree of deformation, rocksalt. Among the samples collected from
Deformation Curves (200°C)
20
T=200°C
Strain rate: 1*10-5s-1
18
C6
C1
16
Type I
C8
Stress (MPa)
14
Type II
12
III
pe
Ty
10
8
6
4
2
0
0
0.02
0.04
0.06
0.08
0.1
0.12
0.14
0.16
0.18
0.2
Strain %
Fig. 10. Uniaxial compressive stress/strain curves for prismatic samples tested at the temperature of 200 °C. Picture of the post-deformation appearance of sample C6 is also provided.
114
G. Speranza et al. / Tectonophysics 666 (2016) 103–120
deformation mechanisms activity, are confirmed by the widespread
presence of secondary fluid inclusion networks at grain boundaries
and in healed fractures.
Type II salt, occupying the upper part of the Volterra's salt sequence,
is characterized by a greater deformation and recrystallization degree,
as highlighted by the higher crystal elongation (lower average roundness), lower shape uniformity χ, a clearer crystal iso-orientation, a
much lower abundance in primary crystal remnants, and a lower
average crystal area (Table 1). Much more crystals are subgrain-rich,
and there are several strain-free, fluid inclusion-poor crystals that
could have been possibly formed in response to recovery processes
(grain nucleation and grain boundary migration) (g in Fig. 4). Also
differential stress values are higher, with average value of 1.14 MPa
(Fig. 7). We suggest that in this case, deformation mechanisms as
solution–precipitation creep, climb creep, and fluid-assisted grain
boundary migration were diffusely active in response to the higher
stress suffered by type II salt (Senseny et al., 1992; Ter Heege et al.,
2005a, b, and references therein), that we believe typical of an “intermediate maturity” rocksalt.
The type III salt, located in the middle of the Saline di Volterra Formation, shows the lowest average crystals area, higher crystal elongation (lower average roundness) with a clear crystal iso-orientation,
higher shape variability (lower χ), and almost no primary crystal
remnants (Table 1). Subgrain-rich crystals are abundant, as well as
recrystallized, subgrain-, and fluid inclusion-poor crystals. Differential
stress values are the highest in our dataset (Fig. 7). Therefore, also in
this case, solution–precipitation creep, climb creep, and fluid-assisted
grain boundary migration seem to have been pervasively active in
developing such a “mature,” with respect to deformation degree,
rocksalt facies. Among samples selected for comparison, the Zi1-III
sample fits very well in the facies III type.
The type IV salt is quite different from the others, being represented,
within the Volterra's sequence, by a thin layer made up of large (highest
average area), uniform crystals (shape uniformity χ), slightly deformed
(high average roundness) without a clear crystal iso-orientation and
with almost no primary salt (Table 1). Indeed, the type IV salt layer,
located at 158 m of depth (Fig. 2), lies between two horizons of type I
like salt and has been subjected to similar differential stress values (Fig. 7).
Furthermore, both macroscopically and microscopically, type IV salt
layer appears rather similar to the fracture-filling rocksalt facies sampled within clay blocks from the top of the Saline di Volterra Formation
(122 m, cf. Fig. 2 and Figure S1 in the supplementary material). Thus,
we suggest that the type IV salt layer was developed during a
syndepositional or early diagenetical stage as the filling of a previously
developed void by highly saturated brine circulating within the salt
deposit. Later, this layer has been deformed to a degree similar to that
of the preceding and surrounding type I salt. Among the samples chosen
for comparison, the Pe3-IV salt is rather different, showing much lower
grainsize compared to the V158-IV section, higher differential stress and
the presence of many subgrain-free, newly developed crystals. Thus,
we suggest that in this case, widespread recovery mechanisms have
obliterated the original facies characteristics in response to high
stress/deformation degree. So the Pe3-IV sample could be considered
as a “very mature” salt type. Higher stress/deformation degree and
high “maturity” should be also considered for the Ra2-IV section,
whose subgrain size resulted in the highest differential stress among
our samples (Fig. 7). Thus, as previously illustrated, we decided to
classify type IV salt into a lower and a higher deformation degree end
(IV-L and IV-H, respectively), assigning the Volterra samples (V158-IV,
V158-IV-h, V122-IV) to type IV-L and Petralia (Pe3-IV) and Racalmuto
(Ra2-IV) samples to type IV-H.
6.2. Salt facies evolution and its effect on rocksalt rheological parameters
It is important to stress that the actual salt facies belonging to the
Saline di Volterra Formation originated from a unique “pristine” salt,
deposited in a shallow water basin (Testa and Lugli, 2000) as an aggregate of primary crystals as described in (Lowenstein and Hardie, 1985),
alternating with moderately thick clay layers. The facies illustrated
above are the result of subsequent dissolution/deposition and deformation/recrystallization processes operating during the depositional,
diagenetic, and deformation stages. The investigation of the Volterra
salt facies has allowed us to follow the evolutionary path from the
original salt through the type I, II, and III facies, the last one representing
the most “mature” end, with respect to deformation degree. Within this
framework, the Volterra IV-L type salt, as previously mentioned, represents a peculiar case, while the type IV-H salt (missing in Volterra) can
be considered as the final stage of a deformation-related history, with a
complete salt facies recrystallization and obliteration of original facies
characteristics.
From the salt facies characteristics plot of Fig. 5, we suggests that,
starting from the type I/IV-L through the type II/III toward the type IVH, with increasing deformation degree the average crystal area, average
roundness and shape uniformity χ decrease, as also suggested by 3D
crystal habits. Moreover, deformation tends to establish a higher crystal
iso-orientation, as can be observed in samples of the type II, III, and IV-H
salt (Fig. 5).
We also suggest that when primary crystal remnants are still abundant (type I), like in “immature” salt, crystal textures are partially
controlled by primary crystals characteristics. Particularly (cf. d–h in
Fig. 3), crystal orientation seems to be related to primary crystal remnants orientation (rose diagrams in Fig. 6), mainly of chevron remnants,
and crystal size is always at least slightly larger than primary remnants
size. Later, with increasing clear salt formation in response to deformation and progressive erosion of primary remnants (type II, III, IV-H) (cf.
Fig. 6), crystal textures become controlled mainly by the deformation
mechanisms discussed above.
Differential stress values calculated from subgrain size measurements resulted lower for facies I and IV-L and progressively higher for
facies II, III, and IV-H, confirming that the deformation history played a
major role in the salt facies textural evolution.
Ultrasonic waves velocity measurements and uniaxial compressive
tests allowed us to study how rocksalt petrophysical parameters vary
with facies textural evolution.
Type I salt is characterized, on average, by lower seismic waves
velocities (Fig. 8) and, at ambient temperature, by lower dynamic
Young modulus, strain at peak, and slightly lower elastic limit, while
peak stress is like that of type II and III (Fig. 9 and Table 3). However,
at higher temperature (200 °C), type I salt shows higher stress values
during deformation as well as higher static Young modulus and slightly
higher elastic limit (Fig. 10 and Table 4). We suggest that this behavior
may be related to the effect exerted on the bulk properties of type I salt
by primary crystals, greatly abundant in these samples. Their size,
shape, and orientation, as previously shown, affect rocksalt texture
evolution during the beginning of the deformation history. The higher
fluids abundance, mainly related to primary fluid inclusions with cubic
shape dispersed in the crystal lattice, could be invoked to explain the
observed higher attenuation of seismic waves velocity and related
dynamic Young modulus. Also, lower strain at peak and elastic limit
values at ambient temperature, indicating a higher “softness” of type I
salt, may be due to the higher fluids content of primary crystals.
At high temperature, the type I salt seems slightly “harder” than type
II and III, and we suggest that this could be related to the different
distribution of fluid inclusions in primary and secondary crystals.
Secondary salt (the main component of type II/III salt), containing
mobile secondary fluid inclusions concentrated at grain boundaries
or in healed fractures, can become, with increasing temperature,
slightly more “soft” and prone to deformation compared to primary
salt, whose cubic primary fluid inclusions, less mobile and randomly
dispersed, give some higher strength to primary crystals under tested conditions (Fig. 11). In addition, at higher temperature, all experiments showed strain hardening (Fig. 10). This behavior has not been
G. Speranza et al. / Tectonophysics 666 (2016) 103–120
115
Fig. 11. Macroscopic pre- and post-run appearance of type I salt sample (C6) uniaxially compressed at 200 °C to a final axial strain of 20%. In the post-run picture, primary crystal remnants
(P) seem to be less deformed than secondary ones (S), suggesting that secondary salt is softer and more prone to deformation at tested conditions. Schematic block diagrams showing the
appearance of cubic primary fluid inclusions (PI) within primary crystals and secondary fluid inclusions networks and arrays, fluid- or gas-filled (SI or Sg), found in healed fractures (HL) or
at crystal boundaries, are also provided.
observed by Ter Heege et al. (2005a,b) on wet polycrystalline halite
samples deformed under confined conditions and similar temperatures. We believe that under our experimental conditions, samples
lost their natural content of fluids and dried out, thus enhancing
the strain hardening observed and preventing weakening mechanisms controlling the steady-state flow observed in Ter Heege et al.
(2005a,b).
Inclined thin clay layers, particularly evident in type I salt samples
(e.g. C3 sample) used for seismic waves velocity measurements and
uniaxial compression at ambient temperature (cf. Fig. 8), may have enhanced Vp velocities attenuation along Z axis (Fig. 8), as well as they
have behaved as preferred slip planes during deformation, contributing
to the observed behavior.
With increasing salt “maturity” (type II and III), the seismic waves
velocity and the dynamic Young modulus increase (Fig. 8 and Table 3),
with slightly higher values for facies II compared to facies III. Peak stress
is alike type I salt, whereas strain at peak and elastic limit at ambient
temperature are higher compared to type I salt (Fig. 9 and Table 2). At
T = 200 °C, instead, static Young modulus and elastic limit are lower
than type I salt (Fig. 10 and Table 4), as well as stress values during deformation, with C8 sample (type II) showing the lowest values. As previously discussed for type I salt, we suggest that in this case, the observed
behavior may be due to the characteristics of the secondary salt crystals,
that are the main component of type II/III salt. Less seismic waves velocity attenuation and a “harder” behavior at ambient temperature may be
explained with a lower fluid abundance mainly due to the absence of
116
G. Speranza et al. / Tectonophysics 666 (2016) 103–120
primary fluid inclusions. Grain size, crystal roundness, and isoorientation may also affect the type II/III salt response to deformation.
The smaller crystals characteristic of the more “mature” rocksalt are likely to be stronger during uniaxial deformation at ambient temperature. At
higher temperature, on the contrary, an opposite behavior is observed.
Although, as previously mentioned, all samples show a strain hardening
behavior, type II/III salt, rich in secondary salt crystals and seem to
become softer and more easily deformed compared to type I crystals
(Fig. 10). In this case, mobile secondary fluid inclusions network at
grain boundaries may enhance deformation mechanisms as solution–
precipitation creep and fluid-assisted grain boundary migration.
We have observed that, on the whole, primary and secondary salts
show rather complex deformation behavior. Thus, a detailed analysis
of primary vs secondary crystals rheology is desiderable in order to
get a better understanding of the overall rocksalt rheology.
Fig. 12 shows combinations of the various parameters obtained from
both thin sections analyses and petrophysical experiments at ambient
temperature, useful to link salt facies characteristics evolution
with rocksalt behavior. Notice that the whole parameters dataset is
available only for three or four samples, representative of the type I, II,
and III salt.
We found that both Vp and Ed are inversely proportional to average
roundness (Fig. 12, a) with a clear separation between the type I and II–
III salt. Thus, higher crystal elongation brings about higher seismic
waves velocity attenuation. Es, instead, is directly proportional to the average crystal area, primary crystals abundance, and shape uniformity χ
a
E (GPa)
V130-II
V132-II
dynamic
V141-III
cit
y(
m
/s)
V161-I-v
Ro
elo
un
ve
s
p-
wa
es
sv
dn
c
b
V161-I-v
crystal %
tal angle (d
eg)
V161-I-v
V130-II
m2
)
Primary
ys
Average cr
V130-II
(χ)
V141-III
sta
tic E
(GP
a)
Av
er
a)
Sh
ap
e
(GP
ag
tic E
ec
sta
Un
rys
tal
ifo
ar
rm
ea
ity
(m
V141-III
e
d
V161-I-v
ystal %
rimary cr
ystal %
V161-I-v
V130-II
ar
tal
rys
Lim
it (M
Pa)
ec
stic
ag
%)
Ela
Av
er
tal
rys
ec
ak (
ag
t Pe
Av
er
in a
V141-III
ar
V141-III
Stra
ea
ea
(m
(m
m2
)
m2
)
P
cr
Primary
V130-II
Fig. 12. A series of 3D scatter plots that correlate several parameters obtained from thin sections analysis, laboratory ultrasonic waves velocity measurements, and uniaxial compressive
tests at ambient temperature. The whole dataset is available only for three or four samples that nevertheless are representative of the type I, II, and III salt.
G. Speranza et al. / Tectonophysics 666 (2016) 103–120
response to deformation degree. As it can be observed in the squared
cartoons, an “original” salt, made up of fluid inclusions-rich primary
crystals, is subjected to an initial dissolution/redeposition stage
followed by an early deformation/recrystallization stage, acquiring the
characteristics of the type I salt. Then, through an evolutionary path in
response to increasing stress/deformation, type I may turn first into
type II and later type III, with a progressive disappearing of primary
crystal remnants, increasing crystal elongation, and iso-orientation
and decreasing in crystal size. Later, as the final stage, very high deformation implying widespread recovery processes, new grain nucleation,
and grain boundary migration may lead to more uniform and less
elongated crystals with no primary salt remnants, as showed by the
Petralia-like type IV-H salt.
At any stage of the evolutionary path, in response to dissolution/
redeposition processes exerted by undersaturated brines, a salt facies
can acquire characteristics similar to the Volterra- type IV-L salt, with
rather equigranular, large, and undeformed crystals and no primary salt
(Fig. 12b, c). Also, Es decreases as the angle of major axis increases, that
is, Es is higher when average major axis orientation is more or less perpendicular with respect to the compression direction (type I sample),
while decreases progressively as the angle between major axis and
compression direction decreases (type II–III samples) (Fig. 12, b). Furthermore, both elastic limit and strain at peak (Fig. 12, d, e) appear to
be inversely proportional to the average crystal area and the primary
crystal abundance. So, textural characteristics and fluid inclusions type
and abundance seem to influence rocksalt petrophysical parameters in
a systematic way.
We are aware that care must be taken in reading our data because
of the limited sample dataset. Considering this, we believe that the
correlations envisaged are sufficiently constrained for a general interpretation. Of course, further studies are desirable in order to strengthen
our observation and interpretation of the data.
Finally, in Fig. 13, we summarize our results about salt facies textural
characteristics and related petrophysical parameters evolution in
Facies maturity
117
“Original” salt
(with respect to deformation)
Low
I
Intermediate
II
High
III
Very high
IV
Rec:
Def:
Round:
ShU:
Pry:
LOW
LOW
HIGH
HIGH
HIGH
IV
L
blue-L
“Void filling” blue facies
(Volterra like)
H
Vp:
Ed:
EL:
SP:
Dim:
LOWER
LOWER
LOWER
LOWER
HIGHER
Rec:
Def:
Round:
ShU:
Pry:
+
+
-
Vp:
Ed:
EL:
SP:
Dim:
+
+
+
+
-
II
Rec:
Def:
Round:
ShU:
Pry:
+
+
-
Vp:
Ed:
EL:
SP:
Dim:
=
=
+
=
-
III
n.d.
n.d.
n.d.
n.d.
+
IV
Rec:
Def:
Round:
ShU:
Pry:
+
+
+
+
-
Vp:
Ed:
EL:
SP:
Dim:
IV
I
L
Rec:
Def:
Round:
ShU:
Pry:
=
=
=
=
-
Vp:
Ed:
EL:
SP:
Dim:
n.d.
n.d.
n.d.
n.d.
(+)
Salt facies
evolutionary paths
Dissolution +
redeposition
Deformation +
recrystallization
H
Very high
deformation +
recrystallization
blue-H
“Totally recrystallized” blue facies
(Petralia like)
Fig. 13. Summary diagram of rocksalt facies end members described in this work. In squares are schematic characteristics of each facies, namely, grains and primary crystals remnants
(cf. with the first square that show how should appear an “original,” just deposited, salt). Colored dots refer to the colors and roman numbers assigned to each facies. Black arrows indicate
observed facies transitions (Volterra Basin) while gray arrows indicate supposed/possible transitions. Framed text refers to some facies characteristics and petrophysical parameters (from
experiments at ambient temperature) and how they change from a facies to another; + (plus) sign means an increase of a given parameter with respect to the preceding facies while −
(minus) sign means a decrease in the same way. Reported parameters are: Rec (recrystallization), Def (deformation degree), Round (average roundness), ShU (shape uniformity), Pry
(primary remnants abundance), Vp (P-waves velocity), Ed (dynamic Young Modulus), EL (elastic limit), SP (strain at peak), and Dim (average crystals area). Colored arrows on the
right show that moving downward in the facies transitions both deformation degree and recrystallization increase while moving rightward dissolution/redeposition are active. Notice
the difference between the Volterra-like facies IV-L, made up by void-filling salt with a lower “maturity” with respect to deformation degree, and the Petralia-like facies IV-H, that here
is the most “evolved” facies, originating from recovery mechanisms in response to very high deformation degree.
118
G. Speranza et al. / Tectonophysics 666 (2016) 103–120
remnants within the dissolution area, regardless of the source salt characteristics (Figure S1). Of course, facies IV-L may be subjected to subsequent
deformation, acquiring the characteristics of a more “evolved” salt facies.
Along with the schematic facies evolution, facies-related and
petrophysical parameters evolution (cf. Fig. 12) are reported in framed
text. Type I salt is assumed to be on the less “evolved” extremity of
the evolutionary path, so parameters are defined in terms of high/low
while for the other salt types, the variation (+, −, or =) for each parameter with respect of the previous facies is provided. So it can be seen that
with increasing facies “maturity,” recrystallization degree, P-S wave
velocity, Ed, elastic limit, and strain at peak increase, while average
roundness, shape uniformity χ, primary crystals abundance, Es, and
average crystal size decrease. This is true until the occurrence of widespread recovery processes with new grain formation (type IV-H) that
eventually leads to previous textural characteristics obliteration.
6.3. Salt facies in the Saline di Volterra Formation
In Fig. 14, we show a schematic draw of the type I, II, III, and IV-L salt
arrangement within the Saline di Volterra Formation, together with the
main textural and petrophysical salt type characteristics. A division into
three “deformative units” (A, B, and C) based on the whole parameters
dataset is also proposed. It is clear that, omitting the type IV salt due
to its peculiarity, the salt type arrangement does not follow a stepwise
order from the less deformed type I toward the highly deformed type
III. In fact, as it can be seen, the type I salt is at the base, followed by
the very thin type IV-L salt layer that, as previously said, shows a similar
deformation degree. The rather thin, highly deformed type III salt follows in the middle of the sequence after a clay interval, while the type
II, much thicker, takes up all the upper half of the salt formation, that
ends with type IV-L salt, filling fractures between clay blocks at the
salt sequence top. Suggested deformative units are along this trend. So
the “lower deformation” unit (A), comprising the type I and IV-L salt,
is followed in turn by the “higher deformation” unit (B), comprising
the type III and part of the type II salt (V139-II and V132-II sections).
The higher deformation degree is clearly highlighted by the differential
stress, rapidly shifting to values as much as two times higher than those
of the “lower” unit, as well as by the smaller grain size, lower primary
salt content, and a clear crystal iso-orientation. The B unit shows also
lower static Young modulus as well as higher strain at peak and elastic
limit values compared to the A unit. The following “intermediate deformation” unit (C), comprising the type II V130-II and V126-II samples as
well as the type IV-L fracture-filling salt, is characterized by differential
stress falling again very rapidly to values as low as half than previous, increasing grain size and primary salt abundance as well as again lower
strain at peak and elastic limit values plus higher static Young modulus.
However, average roundness, shape uniformity χ, and average crystal
orientation remain alike those of the preceding unit. We suggest that
this deformation arrangement can be explained considering the Saline
di Volterra Formation as divided in three (or more) salt intervals that
were moved and deformed as individual bodies. So, the “higher deformation” B unit may correspond to a salt interval characterized by higher
mobility, as if it was intruded like a “sill” between the clay intervals of
149–141 m and the salt above 132 m. This hypothesis is supported by
evidences of strong plastic deformation of clay blocks and strata present
along with salt in the 140–132 m interval, with a near-complete
destruction of former clay layer continuity, and later transport of inert
clay blocks within the moving salt (cf. Fig. 2 and Figure S2 in the Supplementary Material). We suggest that the B unit higher mobility could be
explained invoking the high-temperature fluid circulation that affected
the Volterra Basin since late Early Pliocene. Extensional fault systems
characterizing the basin could have channeled warm fluids around the
B unit, triggering its movement (Testa and Lugli, 2000). Within this
hypothesis, the “intermediate deformation” C unit could have been
Volterra Basin S1113 borehole
Textural Data
Primary
salt
%
Facies
IV-L
122
Average
crystals
roundness
Shape
Uniformity
(χ)
0*
Petrophysical Data
Average
crystals
size
mm2
Differential
stress
MPa
Average
crystals
angle
Static
Young Modulus
GPa
Strain
at peak
%
Elastic
Limit
MPa
P-waves
velocity
m/s
Dynamic
Young Modulus
GPa
Deformative
Units
0,79
126
14,8
130
8,8
132
7,7
0,78
0,40
0,71
0,38
C
2,59
0,88
6,5
1,59
0,77
3,6
11,5
4521
43,8
II
0,77
0,42
1,43
141
40
B
1,33
139
III
4471
0,85
0,53
0,41
1,1
1,39
0,52
13
3,8
2,95
4382
40,1
149
IV-L
158
161
I
0,59
0*
0,55
19,3
0,9
0,62
0,82
0,79
4,95*
1,97
4,1
2,8
10
4274
34,2
A
Not analysed cores
165
m
Clay
4259
37,4
Fig. 14. Schematic drawing of the types I, II, III, and IV-L salt arrangement within the Saline di Volterra Formation, together with the main textural and petrophysical salt type characteristics. A
division into three “deformative units” (A, B, and C) based on the whole parameters dataset is also proposed. Type IV-L salt characteristics, because of their origin by dissolution–redeposition
process rather than a deformation-related textural evolution as for the type I–II–III salt, are outlined by dotted lines.
G. Speranza et al. / Tectonophysics 666 (2016) 103–120
coupled to the underlying unit, maintaining somehow a rather high
mobility, as shown again by clay blocks deformation and also by the
presence of saturated brine circulation, highlighted by the salt-filled,
vertically oriented fractures observable within the clay blocks at the
top of the salt sequence. Here, clay fracturing may be induced by the
underlying salt movement with intrusion of the saturated brine in the
newly formed fractures. The “lower deformation” A unit, below the
clay layer at 149–141 m, seems to have had rather less mobility and
seems that it has been uncoupled with B and C, although, as showed
by the microstructural observations, and it has been subjected to some
degree of deformation.
7. Conclusions
Our comprehensive salt facies study including salt cores from the
Saline di Volterra Formation (Volterra Basin, northern Italy) and salt
samples from Petralia and Racalmuto salt mines (Caltanissetta Basin,
Sicily) and Zinga 1–Vitravo 1 salt diapirs (Crotone Basin, southern
Italy) allowed to identify, analyze. and test in laboratory four salt facies
end members believed to be a good estimate of the wide range or
rocksalt facies that can be found in nature. Moreover, we were able to
place the facies on an evolutionary path in response to increasing
deformation degree.
Initially, we identified four salt facies that have been named as type I,
II, III, and IV, analyzing the Saline di Volterra Formation. Facies I shows a
great abundance in primary salt remnants and rather rounded crystals
so it has been considered as the less deformed and recrystallized end
member. Proceeding toward increasing deformation degree, primary
salt remnants are gradually dissolved, new, “clear,” secondary salt is
formed and a progressive increase in crystals elongation and isoorientation as well as a crystal size decrease can be observed. So, type
II and type III have been identified, presenting increasing deformation
degree, with almost no primary salt remnants and smaller, very
elongated crystals with a clear iso-orientation in type III. Differential
stress calculation from subgrain size is along this trend, with lower
values related to the type I and higher values for the type II and III.
The main deformation-related mechanisms as observed by microstructural analysis are solution–precipitation creep, climb creep, and fluidassisted grain boundary migration. The type IV cannot be placed
on this evolutionary path and is likely to derive from the type I due to
an early dissolution/redeposition process, later acquiring a similar
(lower) deformation degree, so it has been named IV-L. Salt samples
from Caltanissetta and Crotone Basin fitted well into type I and III,
confirming the effectiveness of the proposed classification scheme.
Moreover Petralia and Racalmuto samples allowed identifying a high
deformation type IV (IV-H), whose crystals are the result of widespread
recovery mechanisms.
From ultrasonic waves velocity measurements and uniaxial compressive tests on the type I, II, and III salt from Volterra Basin, we obtained petrophysical parameters that we linked to facies characteristics. We
found that crystal average roundness, shape uniformity χ, average crystal size, primary salt abundance, and average crystal orientation may influence the rocksalt petrophysical parameters such as Vp and Vs (P- and
S-waves velocity), Es and Ed (static and dynamic Young modulus), elastic limit and strain at peak in a systematic way. Moreover, the primary
salt rich type I salt showed a “softer” behavior at ambient temperature
compared to type II/III while resulted slightly “harder” at 200 °C. This
could be related to the higher fluids abundance and to the cubic shape
of the primary fluid inclusion characteristic of type I salt, lacking in the
type II/III salt that host, instead, mobile secondary fluid inclusions at
crystal boundaries and in healed fractures.
Finally, the arrangement of type I, II, and III salt within the Saline di
Volterra Formation, with the less deformed type I located at the base
of the salt series followed by the highly deformed type III in the middle
and the type II in the upper part, suggested, together with related textural and petrophysical parameters, a division into three deformative
119
units that behaved differently and indipendently as a result of the
different salt characteristics.
To conclude, we believe that rocksalt type, i.e. textural characteristics, primary vs secondary crystals abundance and fluid inclusions
type and abundance, have to be taken into account when assessing
any study or application regarding rocksalt.
Acknowledgments
We thank Fabrizio Pepe (Palermo University) for the organization
and the assistance during the visit to the Realmonte, Racalmuto, and
Petralia salt mines. We are very grateful to Italkali for the authorization
to visit the salt mines and Solvay company for making salt samples from
the Volterra Basin available. Our thankfulness goes also to Silvio Mollo
(INGV – Rome) and Alessandro Iarocci (INGV – Rome) for their help
with ultrasonic waves velocity measurements and uniaxial compressive
experiments. The constructive and helpful review by Hans de Bresser
was greatly appreciated.
Appendix A. Supplementary data
Supplementary data to this article can be found online at http://dx.
doi.org/10.1016/j.tecto.2015.10.018.
References
Carter, N.L., Hansen, F.D., 1983. Creep of rock salt. Tectonophysics 92, 275–333.
Carter, N.L., Horseman, S.T., Russel, J.E., Handin, J., 1993. Rheology of rock salt. J. Struct.
Geol. 15, 1257–1271.
Chester, F.M., 1988. The brittle-ductile transition in a deformation-mechanism map for halite. Tectonophysics 154, 125–136. http://dx.doi.org/10.1016/0040-1951(88)90230-2.
Ciccotti, M., Almagro, R., Mulargia, F., 2004. Static and dynamic moduli of the seismogenic
layer in Italy. Rock Mech. Rock. Eng. 37 (3), 229–238. http://dx.doi.org/10.1007/
s00603-003-0019-7.
Decima, A., Wezel, F.C., 1971. Osservazioni sulle evaporiti Messiniane della Sicilia centromeridionale. Riv. Mineral. Sicil. 130–134, 172–187.
Dubey, R.K., Gairola, V.K., 2000. Influence of structural anisotropy on the uniaxial
compressive strength of pre-fatigued rocksalt from Himachal Pradesh, India. Int.
J. Rock Mech. Min. Sci. 37, 993–999.
Dubey, R.K., Gairola, V.K., 2008. Influence of structural anisotropy on creep of rocksalt
from Simla Himalaya, India: an experimental approach. J. Struct. Geol. 30 (6),
710–718. http://dx.doi.org/10.1016/j.jsg.2008.01.007.
Faccenna, C., Piromallo, C., Crespo-Blanc, A., Jolivet, L., Rossetti, F., 2004. Lateral slab
deformation and the origin of the western Mediterranean arcs. Tectonics 23,
TC1012. http://dx.doi.org/10.1029/2002TC001488.
Faccenna, C., Funiciello, F., Civetta, L., D'Antonio, M., Moroni, M., Piromallo, C., 2007. Slab
disruption, mantle circulation, and the opening of the Tyrrhenian basins. Geol. Soc.
Am. Spec. Pap. 418, 153–169. http://dx.doi.org/10.1130/2007.2418(08).
Franssen, R.C.M.W., 1994. The rheology of synthetic rocksalt in uniaxial compression.
Tectonophysics 233, 1–40.
Fuenkajorn, K., Phueakphum, D., 2010. Effects of cyclic loading on mechanical properties
of Maha Sarakham salt. Eng. Geol. 112 (1-4), 43–52. http://dx.doi.org/10.1016/j.
enggeo.2010.01.002.
Higgins, M.D., 2006. Quantitative Textural Measurements in Igneous and Metamorphic
Petrology. Cambridge Univeristy Press.
Hudec, M.R., Jackson, M.P.A., 2007. Terra infirma: understanding salt tectonics. Earth Sci.
Rev. 82 (1-2), 1–28. http://dx.doi.org/10.1016/j.earscirev.2007.01.001.
Hunsche, U., Hampel, A., 1999. Rock salt – the mechanical properties of the host rock
material for a radioactive waste repository. Eng. Geol. 52, 271–291.
Keogh, S.M., Butler, R.W., 1999. The Mediterranean water body in the late Messinian:
interpretating the record from marginal basins on Sicily. J. Geol. Soc. Lond. 156,
837–846.
Lebensohn, R.a., Dawson, P.R., Kern, H.M., Wenk, H.-R., 2003. Heterogeneous deformation
and texture development in halite polycrystals: comparison of different modeling
approaches and experimental data. Tectonophysics 370 (1-4), 287–311. http://dx.
doi.org/10.1016/S0040-1951(03)00192-6.
Lloyd, G.E., Farmer, A.B., Mainprice, D., 1997. Misorientation analysis and the formation
and orientation of subgrain and grain boundaries. Tectonophysics 279 (1-4), 55–78.
Lowenstein, T.K., Hardie, L.A., 1985. Criteria for the recognition of salt-pan evaporites.
Sedimentology 32, 627–644.
Lugli, S., Dominici, R., Barone, M., Costa, E., Cavozzi, C., 2007. Messinian halite and residual
facies in the Crotone basin (Calabria, Italy). In: Schreiber, B., Lugli, S., Babel, M. (Eds.),
Evaporites Through Space and Time. Geological Society Special Publications 285,
pp. 168–178 (London).
Mattei, M., Cifelli, F., D'Agostino, N., 2007. The evolution of the Calabrian Arc: evidence
from paleomagnetic and GPS observations. Earth Planet. Sci. Lett. 263, 259–274.
120
G. Speranza et al. / Tectonophysics 666 (2016) 103–120
Morgan, D.J., Jerram, D.A., 2006. On estimating crystal shape for crystal size distribution
analysis. J. Volcanol. Geotherm. Res. 154, 1–7. http://dx.doi.org/10.1016/j.jvolgeores.
2005.09.016.
Peach, C.J., Spiers, C.J., 1996. Influence of crystal plastic deformation on dilatancy and
permeability development in synthetic salt rock. Tectonophysics 256 (1-4), 101–128.
Pennock, G.M., Drury, M.R., Spiers, C.J., 2005. The development of subgrain misorientations with strain in dry synthetic NaCl measured using EBSD. J. Struct. Geol. 27
(12), 2159–2170. http://dx.doi.org/10.1016/j.jsg.2005.06.013.
Pennock, G.M., Drury, M.R., Peach, C.J., Spiers, C.J., 2006. The influence of water on
deformation microstructures and textures in synthetic NaCl measured using EBSD.
J. Struct. Geol. 28 (4), 588–601. http://dx.doi.org/10.1016/j.jsg.2006.01.014.
Piazolo, S., Bestmann, M., Prior, D.J., Spiers, C.J., 2006. Temperature dependent grain
boundary migration in deformed-then-annealed material: observations from
experimentally deformed synthetic rocksalt. Tectonophysics 427 (1-4), 55–71.
http://dx.doi.org/10.1016/j.tecto.2006.06.007.
Pouya, A., 1991. Correlation between mechanical behaviour and petrological properties of
rocksalt. In: Rogiers (Ed.), Rock mechanics as a multidisciplinary science. Balkema,
Rotterdam, pp. 385–392.
Roda, C., 1964. Distribuzione e facies dei sedimenti neogenici nel Bacino Crotonese. Geol.
Romana III, 319–366.
Roveri, M., Lugli, S., Manzi, V., Schreiber, B.C., 2008. The Messinian Sicilian stratigraphy
revisited: new insights for the Messinian salinity crisis. Terra Nova 20, 483–488.
Schléder, Z., Urai, J.L., 2005. Microstructural evolution of deformation-modified primary
halite from the Middle Triassic Röt Formation at Hengelo, The Netherlands. Int.
J. Earth Sci. 94 (5-6), 941–955. http://dx.doi.org/10.1007/s00531-005-0503-2.
Schléder, Z., Urai, J.L., 2007. Deformation and recrystallization mechanisms in mylonitic
shear zones in naturally deformed extrusive Eocene–Oligocene rocksalt from
Eyvanekey plateau and Garmsar hills (central Iran). J. Struct. Geol. 29 (2), 241–255.
http://dx.doi.org/10.1016/j.jsg.2006.08.014.
Senseny, P.E., Hansen, F.D., Russel, J.E., Carter, N.L., Handin, J.W., 1992. Mechanical behaviour of rock salt: phenomenology and micromechanisms. Int. J. Rock Mech. Min. Sci.
Geomech. Abstr. 29 (4), 363–378.
Speranza, F., Maniscalco, R., Grasso, M., 2003. Pattern of orogenic rotations in centraleastern Sicily: implications for the timing of spreading in Tyrrhenian Sea. J. Geol.
Soc. Lond. 106, 183–195.
Speranza, G., Cosentino, D., Tecce, F., Faccenna, C., 2013. Paleoclimate reconstruction
during the Messinian evaporative drawdown of the Mediterranean Basin: Insights
from microthermometry on halite fluid inclusions. Geochem. Geophys. Geosyst. 14,
5054–5077. http://dx.doi.org/10.1002/2013GC004946.
Spiers, C.J., Schutjens, P.M.T.M., Brzesowski, R.H., Peach, C.J., Liezenberg, J.L., Zwart, H.J.,
1990. Experimental determination of constitutive paramteres governing creep of
rocksalt by pressure solution. In: Knipe, R.J., Rutter, E.H. (Eds.), Deformation Mechanisms, Rheology and Tectonics. Geol. Soc. Spec. Pub. 54, pp. 215–227 (London).
Ter Heege, J.H., De Bresser, J.H.P., Spiers, C.J., 2005a. Rheological behaviour of synthetic
rock salt: the interplay between water, dynamic recrystallization and deformation
mechanisms. J. Struct. Geol. 27, 948–963.
Ter Heege, J.H., De Bresser, J.H.P., Spiers, C.J., 2005b. Dynamic recrystallization of wet
synthetic polycrystalline halite: dependence of grain size distribution on flow stress,
temperature and strain. Tectonophysics 396 (1-2), 35–57. http://dx.doi.org/10.1016/
j.tecto.2004.10.002.
Testa, G., Lugli, S., 2000. Gypsum-anhydrite transformations in Messinian evaporites of
central Tuscany (Italy). Sediment. Geol. 130, 249–268.
Urai, J.L., Spiers, C.J., 2007. The effect of grain boundary water on deformation
mechanisms and rheology of rocksalt during long-term deformation. In: Wallner,
M., Lux, K., Minkley, W., Hardy Jr., H. (Eds.), Proceedings of the 6th conference on
the mechanical behavior of salt, Hannover, Germany.
Urai, J.L., Spiers, C.J., Peach, C.J., Franssen, R.C.M.W., Liezenberg, J.L., 1987. Deformation
mechanisms operating in naturally deformed halite rocks as deduced from microstructural investigations. Geol. Mijnb. 66, 165–176.
Vajdova, V., 1999. The effect of rock fabric on P-wave velocity distribution in amphibolites. Phys. Earth Planet. Inter. 114 (1-2), 39–47.
Zecchin, M., Massari, F., Mellere, D., Prosser, G., 2004. Anatomy and evolution of a
Mediterranean-type fault bounded basin: the Lower Pliocene of the northern Crotone
Basin (Southern Italy). Basin Res. 16, 117–143.
© Copyright 2026 Paperzz