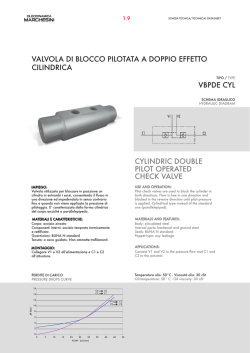
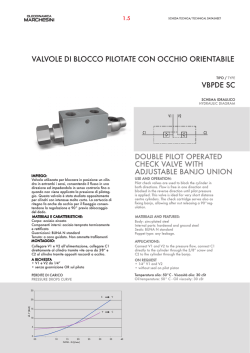
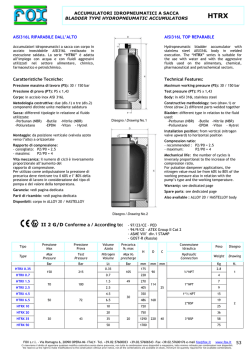
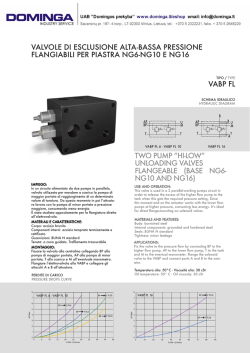
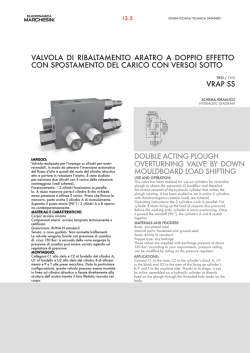
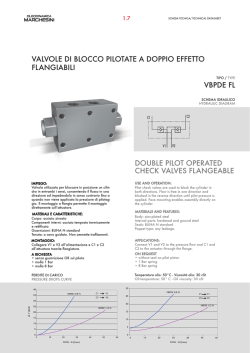
Evaluation
monitoring
of baroreceptor reflex by blood pressure
in unanesthetized cats
GIOVANNI
BERTINIERI,
MARCO
DI RIENZO,
ANITA
CAVALLAZZI,
ALBERT0
U. FERRARI,
ANTONIO
PEDOTTI,
AND GIUSEPPE
MANCIA
Cattedra di Semeiotica Medica and Istituto di Clinica Medica Generale e Terapia Medica, Universitk
di
Milano, Consiglio Nazionale delle Ricerche and Ospedale Maggiore; Centro di Bioingegneria, Fondazione
Pro Juventute e Politecnico di Milano, 20122 Milan, Italy
BERTINIERI,
LAZZI,
ALBERTO
SEPPE MANCIA.
GIOVANNI,
MARCO
DI RIENZO,
ANITA
CAVALU. FERRARI,
ANTONIO
PEDOTTI,
AND GIUEvaluation of baroreceptor reflex by blood pres-
sure monitoring
in unanesthetized
cats. Am. J. Physiol. 254
(Heart Circ. Physiol. 23): H377-H383,
1988.-The
arterial
baroreceptor
control of the sinus node operating in unanesthetized conditions
was evaluated in 10 cats in which blood
pressure was recorded intra-arterially
and scanned by a computer to identify the “spontaneous”
sequences of three or more
consecutive beats in which systolic blood pressure (SBP) progressively rose and pulse interval (PI) progressively lengthened
(type 1 sequences) or SBP progressively
fell and PI progressively shortened (type 2 sequences). Many type 1 and 2 threebeat sequences were found; four-, five-, and six-beat sequences
of either type were progressively less common, and sequences
longer than six beats were almost never identified. The regression coefficient was 30% greater for type 1 than for type 2
sequences. However a prominent
feature of either regression
coefficient was a wide scattering in each cat (average variation
coefficient 50.9 k 5.5%). The regression coefficient values were
related to some extent to the PI but not to the SBP existing at
the beginning of the sequence. Sinoaortic denervation dramatically reduced the number of sequences of either type. These
data validate a method for collecting a large number of observations on the baroreceptor-heart
rate reflex in physiological
conditions. This method may improve understanding
of baroreflex involvement in integrated cardiovascular
regulation.
baroreflexes;
denervation
heart
rate; joint
pattern
analysis;
sinoaortic
CONTROL of the sinus node is commonly
evaluated by maneuvers that increase or reduce arterial
baroreceptor activity via mechanically or pharmacologically induced rises and falls in blood pressure (10, 16, 21,
BARORECEPTOR
24, 26).
In unanesthetized animals blood pressure is characterized by spontaneous increases and decreases (22). This
results in alterations in baroreceptor activity and raises
the possibility that their reflex effects on the heart can
be studied without pharmacological or mechanical interventions. In the present study on unanesthetized cats we
have tested this possibility by computer analysis of the
intra-arterial blood pressure and pulse interval signals.
The results demonstrate that spontaneous blood pressure
changes can be used to study the baroreceptor-heart rate
reflex.
II
0363-6135/88
$1.50 Copyright
METHODS
The study was performed in 10 unanesthetized cats in
which blood pressure was recorded twice via a catheter
implanted in the abdominal aorta. The implantation was
performed aseptically under ether anesthesia 2 days before the first recording session, using the right or left
femoral artery. The proximal end of the catheter was
guided subcutaneously to an exit near the paravertebral
muscles to which it was secured by silk sutures. Once
implanted, the catheter was kept patent by periodical
flushing with heparinized solution (5 U/ml saline). Each
blood pressure recording was obtained with the cat placed
in a Plexiglas box large enough to allow activities, such
as stretching, standing, eating, drinking, self cleaning,
etc., to be attended without restriction. The box was
brought to the laboratory l-2 days before the recording
to make the cat accustomed to the environment and the
people working nearby. During the recording the arterial
catheter emerging from the cat’s back was connected to
a rigid-walled polyethylene tube that reached a transducer (Statham P23 DC) placed outside the cage at the
animal’s heart level. The blood pressure signal was directed to the amplifier of a Grass polygraph and then to
a tape recorder (Racall Store 4), to allow its subsequent
analysis by a computer (see below). The recording system
showed an optimal-response to a square-wave signal (no
overshoot and no damping) up to 15 Hz. Furthermore,
the equipment gave a linear response from 0 to 200
mmHg and showed no drift of the 0 signal. This ensured
the reliability of the recording throughout.
Protocol and arterial baroreceptor denervation. After
implantation of the aortic catheter, blood pressure was
recorded continuously for 2-4 h (mean t SE 3.0 t 0.4).
Subsequently, the cat was anesthetized with ketamine
(50 mg/kg body wt im). The neck was incised under
aseptic conditions to expose the carotid arteries and the
vagi (25). All tissues between the external and the internal carotid arteries were enclosed in a double ligature
and cut to sever baroreceptor fibers originating from the
carotid sinuses. The aortic nerves were divided from the
vagi near their connection with the nodose ganglion and
cut to sever baroreceptor fibers originating from the
aortic arch and the major intrathoracic arteries. The
common carotid arteries were isolated to sever aortic
baroreceptor fibers possibly traveling outside the aortic
0 1988 the American
Physiological
Society
H377
H378
BEAT-TO-BEAT
EVALUATION
nerves (13). The completeness
of the baroreceptor
denervation was verified after surgical intervention
by the
drastic reduction of the bradycardia induced by an intravenous bolus of phenylephrine
hydrochloride
as compared with the response observed before the surgical
intervention
(-26.3 t 7.2 vs. -1.8 t 0.4 beats/min).
The
cat was allowed to recover for 7-10 days after which a
second intra-arterial
blood pressure recording of 2-4 h
(3.0 t 0.5) was performed.
Data analysis. The data stored in the tape recorder
were analyzed by a computer (Digital PDP 11/34), which
sampled on 12 bit the blood pressure tracing at 600 Hz,
i.e., at 1.6-ms intervals.
The system of analysis could
discriminate
minute differences in systolic blood pressure and allowed a maximal error in the estimation
of
the pulse interval change of 3.2 ms. The results were
displayed on a graphic video and examined by an operator who checked and eliminated any grossly distorted
pressor waves and stored on a magnetic disk an artifactfree blood pressure signal. This was reanalyzed by the
computer to obtain all the systolic blood pressure values
OF
THE
BAROREFLEX
occurring throughout the recording period and to derive
from them all pulse intervals as well. The computer was
also programmed
to determine the difference between
each two consecutive
systolic blood pressure or pulse
interval values and to identify the sequences characterized by the fact that 1) systolic blood pressure increased
by at least 1 mmHg during each of three or more blood
pressure waves, and pulse interval showed a concomitant
lengthening of at least 4 ms/beat and 2) systolic blood
pressure fell by at least 1 mmHg during each of three or
more blood pressure waves, and pulse interval showed a
concomitant shortening of at least 4 ms/beat. An example of one sequence as it was identified by the computer
is showed in Fig. 1.
Finally, the computer analyzed the sequences as linear
regressions
between the systolic blood pressure values
and the subsequent pulse intervals.
This phase shift,
equal to one, was selected according to the findings of
previous studies (24, 28). Because the coefficient of determination
(3) of the regression was always sufficiently
high (>0.85), the regression coefficient was taken as the
230
FIG. 1. Example
of the intra-arterial
blood pressure signal as reconstructed
by
the computer
after sampling the original
signal at 600 Hz. The signal refers to a
sequence
during
which
systolic
blood
pressure
and pulse interval
increased
progressively
for several beats. Absolute
pulse interval
values are reported
at bottom. Vertical
axis is in mmHg.
i I I 1 I I i /
I I I I I I I I
1
1
(576
15941612
162516841
740
1
I
i
I
1 792.
)
1. Number of sequencescharacterized by progressive increases in systolic blood pressure (SBP) and pulse
interval (PI) or by progressive reductions in SBP and PI over three consecutive beats
~-_
-____TABLE
+PI/+SBP
Cats
1
2
3
4
5
6
7
8
9
10
Means
MAP,
k SE
mmHg
101.1
103.5
127.5
122.3
134.6
128.0
94.3
101.8
115.5
110.3
113.9t4.3
PI, ms
310
319
392
298
386
441
447
238
440
340
361.0t22.5
Total
474
476
1,091
1,445
955
1,179
197
292
153
1,729
799H76
-PI/-SBP
No./lO,OOO
beats
Total
No./lO,OOO
beats
195
243
494
508
237
520
115
112
77
487
299t58
1,223
608
1,537
1,243
1,013
942
365
254
161
1,619
896k166
502
311
696
437
252
415
212
97
81
456
346261
Data are shown as total number
of sequences that occurred
during intra-arterial
blood pressure recording
performed
in each intact cat and as
number
of sequences every 10,000 beats. Sequences reported
are only those in which beat-to-beat
changes in SBP and PI were ~1 mmHg and
24 ms, respectively,
and coefficient
of determination
of calculated
linear regression
was >0.85 (see METHODS).
Average
mean arterial
pressure
(MAP)
and PI of recording
period are also shown.
BEAT-TO-BEAT
EVALUATION
OF
THE
H379
BAROREFLEX
measure of the gain or sensitivity
of the changes in heart
rate induced by the blood pressure changes, as it is done
for the baroreceptor-heart
rate reflex studied by the
vasoactive drug method. A description of this method of
data analysis has been made in a preliminary
report (3).
The regression coefficients derived from each recording were summed to obtain averages t SE for the group
as a whole. Statistical
comparisons
were made by oneway analysis of variance. The level of statistical
significance was set at P < 0.05.
TABLE 2. Number of sequencescharacterized by
progressive increases in systolic blood pressure (SBP)
and pulse interval (PI), or by progressive reductions in
SBP and PI, over 4, 5, or 6 consecutive beats
RESULTS
-PI/-SBP,
+PI/+SBP,
Sequence
No./lO,OOO
beats
62t22
1lt7
3tl
4 beats
5 beats
6 beats
beats
No./lO,OOO
68k21
14t9
5t3
Data are shown as averages t SE of mean
of Table 1. For other explanations
see Table
data obtained
1.
in each cat
Mean
Sequences:
3 BEATS
r **
4
f SE
BEATS
Intact cats. As shown in Table 1 in each cat there were
many sequences of three beats characterized by progressive increases in pulse interval and systolic blood pressure (+PI/+SBP)
or progressive reductions in pulse interval and systolic blood pressure (-PI/-SBP).
On average, the number of three-beat +PI/+SBP
sequences
was similar to that of the three-beat -PI/-SBP
sequences (299 t 58 vs. 346 t 61/10,000 beats).
A similar number of +PI/+SBP
and -PI/-SBP
sequences was also found when sequences lasting four or
(n=lO)
5 BEATS
6
BEATS
1
1
T
r**i
. ,.....
... ...
. .. ... . ... .. ... . ...
. . .. ..a..
... .
A
m
+Pl/+SBP
m
-PI/-SBP
* pao.05
**p*O.Ol
T
.......
......
.......
......
.......
......
-IlkT
FIG. 2. Top panels
show regression
coefficients
of sequences characterized
by a progressive
increase in sysconc
blood pressure
and pulse interval
(+PI/+SBP)
and by a progressive
reduction
in systolic blood pressure and pulse
interval
(-PI/-SBP).
Sequences of 3-, 4-, 5, and 6-beat length are separately
shown. Data are expressed
as averages
&SE of mean regression
coefficients
obtained
in each cat. Averages
t SE of standard
deviations
around the mean
separately
calculated
in each cat, i.e., variability
of the baroreflex
sensitivity
in each animal, are shown in lower panels.
*p ** Statistical
significance
of difference
between +PI/+SBP
and -PI/-SBP
sequences.
H380
BEAT-TO-BEAT
EVALUATION
more beats were considered (Table 2). However, these
longer sequences occurred progressively
more rarely. On
average, the four-beat sequences amounted to 130, the
five-beat sequences to 24, and the six-beat sequences to
8/10,000 beats. Sequences of seven- and eight-beat duration occurred only occasionally
in some cats, and sequences of > eight beats were never identified in any
animal.
As shown in Fig. 2, top panel, the average regression
coefficients
of the three-, four-, five-, and six-beat seauences were greater for the +PI/+SBP
than for the
A
500
A-
5 BEAT
sequences
6 BEAT
sequences
A
:
Q) 400
5
Y>
ii
CI
c
0
; 300
a
200
1
B
5oo
200
100
-
1
1
120
1
Syetolic
,
140
Blood
I
160
Pro88urs
,
1
THE
BAROREFLEX
-PI/-SBP
sequences. For both types, the regression
coefficients decreased as the length of the sequences
increased. However, in each cat each length showed a
wide scattering of the regression coefficients around the
mean as shown by the high values of the averaged individual standard deviations (Fig. 2, bottom panel). This
scattering is further illustrated by the different slopes of
the five- and six-beat sequencesobserved in one cat (Fig.
3) .
Information on the factors involved in the scattering
of the regression coefficients is reported in Table 3 and
Fig. 4. There was little or no correlation between the
regression coefficients and the systolic blood pressure
observed at the beginning of the sequences. On the other
hand, there was a correlation between these coefficients
and the pulse interval observed at the beginning of the
sequences. This correlation was particularly consistent
for the -PI/-SBP
sequences. Thus the scattering of the
regression coefficient is largely unrelated to base-line
blood pressure but depends to some extent on base-line
heart rate.
Sinoaortic-deneruated cats. Compared with the intact
cats, sinoaortic-denervated cats had a similar mean arterial pressure (+4.0 & 4.8 mmHg, P = NS) and a slightly
reduced pulse interval (-78 t 18 ms, P < 0.01). The
number of the +PI/+SBP
and -PI/-SBP
sequences
was strikingly reduced (Fig. 5). For the three-beat sequences, the reduction was 84.4 t 4.7%, whereas for the
four- and five-beat sequences it was 93.6 t 2.7 and 78.3
t 9.9%, respectively. After sinoaortic denervation sequences longer than five beats were never observed.
The regression coefficients of the few sequences that
remained after sinoaortic denervation were also strikingly less than those observed in the intact condition.
For the +PI/+SBP
sequences the average regression
coefficient after sinoaortic denervation was 6.0 t 1.0 ms/
mmHg, whereas for the -PI/-SBP
sequencesit was 3.5
+ 0.7 ms/mmHg. This represented a reduction of 72 and
56%, respectively, as compared with control.
Baroreceptor influences of a single-beat duration. In the
intact cats the three-, four-, five-, and six-beat sequences
accounted for -26% of all beats. Less than 1% of beats
was organized in sequencesof three or more beats characterized by a “nonbaroreflex” pattern, i.e., -PI/+SBP
or +PI/-SBP
sequences, whereas -25% of beats were
not considered by the computer because there was no
change in SBP and/or PI compared with the preceeding
value. Thus -48% of beats were characterized by SBP
and PI changes of one-cycle duration, which prompted
us to examine how often this resulted from short-term
I’*
0.85
.
1
OF
100
1
1
200
1
(mmHg)
3. Slopes (or regression
coefficients)
of linear regressions
between progressive
increases in systolic blood pressure and pulse interval
(&beat
sequences, A) and between
progressive
reductions
in systolic
blood pressure and pulse interval
(6-beat sequences, B). Data refer to
all 5- or 6-beat sequences identified
in cat 1. Individual
pulse interval
and systolic blood pressure values are shown for some slopes.
FIG.
TABLE 3. Correlation coefficients between regression coefficients of 4-beat + SBP/+PI sequencesor of 4-beat
pressure (+PI/+SBP)
or -PI/-SBP
sequencesand SBP or PI values existing at the beginning of the sequences
Regression
Mean
Initial
Initial
SBP, mmHg
PI, ms
0.34-1-0.07
0.40t0.06
Coefficients
+PI/+SBP
Regression
Range
P c 0.05
0.10-0.62
0.10-0.65
3
6
Mean
Coefficients
Range
0.36t0.05
0.14-0.59
0.66t0.04
0.40-0.87
in each of 10 cats of Table 1. Range of individual
-PI/-SBP
P < 0.05
4
10
Data represent
the averages * SE of correlation
coefficients
obtained
correlation
coefficients
and number
of cats in which these values achieved
statistical
significance
are also shown. In 8 cats in which 4-beat sequences were numerous,
these were calculated
by randomly
selecting
70 4beat
+PI/+SBP
and 70 4-beat -PI/-SBP
sequences per cat. In remaining
2 cats, they were
calculated
by taking all available
4-beat sequences. For other explanations
see Tables 1 and 2.
BEAT-TO-BEAT
4 Beat
14
1
r= 0.17
Sequences
NS
EVALUATION
OF
THE
p co.001
.
l
/t’:=*e.
0’
.
.
.
l
.
.
.
;.
.
t
1,
140
I
r = 0.33
,
160
,
1
180
,
11
200
p<0.01
H381
(n=70)
1 rz0.49
.
20
BAROREFLEX
d
11,
240
260
1
.
l
I I I,
280
300
p*
r = 0.82
I,,
320
340
,
,
360
,
1
380
0.001
FIG. 4. Relationships
between
regression
coefficients of 4-beat +PI/+SBP
sequences (top panels) and
the 4-beat -PI/-SBP
sequences
(bottom pands)and
systolic
blood pressure
or pulse interval
values observed at the beginning
of sequences. Data refer to 70
sequences of either type randomly
selected from cat 5.
Symbols as in Fig. 2.
.
5ik-l
Baseline
SBP
(mmHg)
J,,,,,,,,,,,,,,,
280
300
320
340
Baseline
360
380
PI (msec)
400
420
in blood pressure and pulse interval elicited by pharmacological or mechanical tools (10, 16, 21, 24, 26). Compared with these methods this new approach may 1)
provide a larger number of observations and 2) allow the
baroreflex sensitivity to be evaluated during the interplay
of the multiple factors affecting circulation. This may
allow us to study the modulation of the baroreflex by
behavioral influences such as exercise (4,7,18,20), stress
(6, 27), sleep (2, 5, 28), and possibly by circadian factors
(l2), thereby affording a better understanding of how
this reflex operates in integrated cardiovascular control.
The advantage of evaluating the baroreceptor-heart
rate reflex by a large number of observations is emphasized by another result of our study, i.e., that the regression coefficients of the spontaneously occurring pulse
interval/blood pressure sequences (i.e., the baroreflex
DISCUSSION
sensitivity) showed a wide range of values in each cat.
Our study demonstrates that, in the unanesthetized
This was due in part to the fact that sequences of
cat, computer analysis of the intra-arterial blood pressure different duration showed different sensitivities. Howtracing permits identification of a large number of se- ever, different sensitivities also characterized sequences
quences characterized by linearly related increases or of the same duration. This indicates that the sensitivity
reductions in systolic blood pressure and pulse interval.
of this reflex function is not a stable feature of a given
More than one-fourth of the total number of beats re- individual but is indeed characterized by a pronounced
corded in our intact animals was organized in sequences short-term intraindividual variability. Its evaluation may
of this type. Because of their disappearance after sinoaortherefore be better afforded by collection of a large
tic denervation, these sequences reflect the ability of number of values rather than by one or few measurearterial baroreceptor stimulation or deactivation to re- ments.
Beside validating a new method for studying the barflexly modulate the sinus node. This means that they
oreceptor-heart rate reflex, our data prompt some concan provide information on the baroreceptor-heart rate
siderations as to the way this reflex operates in normal
reflex, complementing the methods based on alterations
baroreceptor influences on the sinus node. This was
investigated by identifying all the events characterized
by 1) a one-beat increase in systolic blood pressure of at
least 1 mmHg followed by a one-beat increase in pulse
interval of at least 4 ms and 2) a one-beat reduction in
systolic blood pressure of at least 1 mmHg followed by a
one-beat reduction in pulse interval of at least 4 ms. As
shown in Fig. 6 in the intact cats the one-beat +PI/
+SBP and -PI/-SBP
changes combined amounted to
55% of the one-cycle events. However, these changes also
amounted to -50% of the one-cycle events after sinoaortic denervation. This 50% rate was identical to that
obtained in the intact animals by randomly coupling to
each other all pulse interval and systolic blood pressure
changes of a single-cycle duration.
H382
BEAT-TO-BEAT
hleans
f SE
EVALUATION
h=lO)
OF
THE
BAROREFLEX
%
60
BEAT
4
sequences
BEAT
1
sequences
0
Intact
m
Sinoaortic
denervation
* p<o.o5
** p 4 0.01
1
z
pti
E
z
2oa
C
BEAT
sequences
f-*1
4
6
1
BEAT
n.-
u
Intact
H
Random
Sinoaortic
sequences
.
coupling
denervation
FIG. 6. Mean
(2 SE) number
of events characterized
by a l-beat
increase or reduction
in systolic blood pressure
of ~1 mmHg followed
by a l-beat
increase or reduction
in pulse interval
of ~4 ms, respectively, before (intact)
and after sinoaortic
denervation.
Data are expressed as percent
of all single beat changes after exclusion
of beats
organized
in sequences of 3 or more beats. Sequences
in which only
SEW or PI changed were also excluded (see text). Number
of +PI/
+SBP and -PI/-SBP
l-beat events resulting
from random
coupling
of all l-beat
changes in systolic
blood pressure
and pulse interval
occurring
in the intact animals
is shown for comparison.
Symbols
as
in Fig. 2.
ditions the baroreceptor-heart rate reflex does not approach threshold or saturation and operates in the linear
portion of its stimulus-response curve. It is possible that
this reflects the intervention of a rapid resetting mechanism (11, 15, 17).
Several studies have demonstrated that the barorecep-PI/‘&BP
-PI/-SBP
+PI/+SBP
*PI/&BP
tor-heart rate reflex is characterized by a short latency
and that the effects of a baroreceptor stimulation can be
FIG. 5. +PI/+SBP
or -PI/-SBP
sequences of 3-, 4-, 5, and 6-beat
seen within one beat (8, 14, 23). In our cats there were
length before (intact)
and after sinoaortic
denervation.
Data are shown
as means & SE of 10 cats. Symbols
as in Fig. 2.
many events characterized by a one-beat increase in
systolic blood pressure followed by a one-beat lengthenconditions. First, the +PI/+SBP
sequences showed a ing in pulse interval, or by a one-beat reduction in
baroreflex sensitivity greater than the -PI/-SBP
se- systolic blood pressure followed by a one-beat shortening
quences. This agrees with the results obtained by the in pulse interval. However, these events were only
vasoactive drug method (21, 24) and indicates that, in slightly less after sinoaortic denervation, and their number was only slightly different from that obtained by
physiological conditions, the sinus node is more effectively modulated by an increase than by a reduction in randomly coupling all blood-pressure and pulse-interval
changes. Thus an overall analysis of the single-beat
the ongoing activity of the arterial baroreceptors.
changes may be unable to discriminate between baroreSecond, the baroreflex sensitivity showed a positive
correlation with the pulse interval at which the pulse flex and nonbaroreflex or casual phenomena.
It should be emphasized that the evaluation of the
interval began, especially when the sequence was of the
baroreflex by analysis of spontaneously occurring PI/
-PI/-SBP
type. This confirms on a physiological setting
that the effectiveness of the baroreceptor-heart rate re- SBP sequencesalso has limitations. First of all, although
flex depends to some extent on the base-line heart rate providing a large number of observations, this method
applies to only one-fourth of all beats, which means that
value (9). This is particularly the case for the baroreceptor-induced acceleration of the sinus node, which is for a prominent fraction of the recording time the baroreflex function still goes undetected. Furthermore, as the
clearly enhanced in presence of a base-line bradycardia
traditional methods (10, 16, 21, 24, 26), this method
and opposed in presence of a base-line tachycardia.
Whether these different base-line values are the cause addresses the baroreceptor influence on the heart and
not that on the main baroreceptor target, i.e., blood
or the effect of the associated differences in baroreflex
pressure (1, 19, 21). In addition, most sequences consist
sensitivity remains an unsolved issue (9).
Third, the baroreflex sensitivity showed little or no of a small number of beats, which may limit the accuracy
relationship with the blood pressure values at which the of the calculated baroreflex sensitivity. On the other
hand, it is interesting that in physiological conditions
sequence began, the reflex being similarly effective
only these relatively short-lived sequences occur; this
throughout the range of blood pressures occurring during
the recording. This indicates that in physiological con- suggests that the longer sequencesproduced by the vas-
BEAT-TO-BEAT
EVALUATION
oactive drug method (10, 21, 24, 26) do not reflect the
pattern of the baroreflex engagement brought about by
spontaneous blood pressure fluctuations.
In conclusion, our study validates a new approach to
the study of the baroreceptor-heart
rate reflex which can
usefully complement other methods currently in use. By
providing a larger amount of information
in physiological
conditions and by avoiding the intervention
of artificially
evoked blood pressure changes, this method may be
particularly
suitable to examine this reflex function during behavior.
We thank Paola Boccaccini
for typing the manuscript
and Riccardo
Sarri for technical
assistance.
This study was supported
in part by grants
from the Consiglio
Nazionale
delle Ricerche,
Finalized
Projects of Degenerative
Medicine
and from Biomedical
Technology.
Received
23 March
1987; accepted
in final
form
29 September
1987.
REFERENCES
1. ABBOUD, F. The sympathetic
system in hypertension.
Hypertension
Dallas 4, Suppl. II: 208225,
1982.
2. BACCELLI,
G., R. ALBERTINI,
G. MANCIA,
AND A. ZANCHETTI.
Interactions
between sino-aortic
reflexes and cardiovascular
effects
of sleep and emotional
behaviour
in the cat. Circ. Res. 38, Suppl.
II: 30-34, 1976.
3. BERTINIERI,
G., M. DI RIENZO, A. CAVALLAZZI,
A. U. FERRARI, A.
PEDOTTI,
AND G. MANCIA.
A new approach
to analysis
of the
arterial
baroreflex.
J. Hypertens.
3, Suppl. 3: S79-S81,
1985.
4. BRISTOW,
J. D., E. B. BROWN,
D. S. C. CUNNINGHAM,
H. G.
HOWSON,
E. STRANGE-PETERSEN,
T. G. PICKERING,
AND P.
SLEIGHT. Effect of bicycling
on the baroreflex
regulation
of pulse
interval.
Circ. Res. 28: 582-592,
1971.
5. CONWAY, J., N. BONN, J. VANN SONES, AND P. SLEIGHT. Involvement of the baroreflexes
in the changes in blood pressure
with
sleep and mental arousal. Hypertension
Dallas 5: 746-748,
1983.
6. DEL Bo, A., G. BACCELLI,
G. CELLINA,
F. FEA, A. FERRARI, AND
A. ZANCHETTI.
Carotid
sinus reflexes
during
postural
changes,
naturally
elicited fighting
behaviour
and phases of sleep in the cat.
Cardiovasc.
Res. 12: 767-769,
1985.
7. DJOJOSUGITO,
A. H., B. FOLKOW,
P. H. KYLSTRA, B. LISANDER,
AND R. S. TUTTLE. Differentiated
interaction
between the hypothalamic
defence reaction
and baroreceptor
reflexes. I. Effects on
heart rate and regional
flow resistance.
Acta Physiol.
Stand. 78:
376-385,
1970.
8. ECKBERG, D. L. Temporal
response patterns
of the human sinus
node to brief carotid baroreceptor
stimuli.
J. Physiol. Lond. 258:
769-782,1976.
9. ECKBERG, D. L. Baroreflex
inhibition
of the human sinus node:
importance
of stimulus
intensity,
duration
and rate of pressure
change. J. Physiol. Lond. 269: 561-577,
1977.
10. GRIBBIN,
B., T. G. PICKERING,
P. SLEIGHT,
AND R. PETO. Effect
of age and high blood pressure
on baroreflex
sensitivity
in man.
Circ. Res. 79: 424-431,
1971.
11. HEESCH,
C. M., M. D. THAMES,
AND F. M. ABBOUD.
Acute
OF
THE
BAROREFLEX
H383
resetting
of carotid sinus baroreceptors.
Dissociation
between discharge and wall strain. Am. J. Physiol. 247 (Heart
Circ. Physiol.
16): H824-H832,
1984.
12. HOSSMANN,
U., C. T. FITZGERALD,
AND C. T. DOLLERY.
Circadian
rhythm
of baroreflex
reactivity
and adrenergic
vascular
response.
Cardiovasc.
Res. 14: 125-129,
1980.
fibers from the
13. ITO, C. S., AND D. H. SCHER. Arterial baroreceptor
aortic region of the dog in the cervical vagus nerve. Circ. Res. 32:
442-446,
1973.
14- KATONA,
P. G., S. W. POITRAS, G. 0. BARNETT, AND B. S. TERRY.
--- Cardiac vagal efferent activity and heart rate period in the carotid
sinus reflex. Am. J. Physiol. 218: 1030-1037,
1970.
15. KORNER,
P. I. Integrative
neural cardiovascular
control.
Physiol.
Rev. 51: 312-367,197l.
16. KORNER, P. I., J. SHAW, M. J. WEST, AND J. R. OLIVER. Central
nervous system control of baroreceptor
reflexes in the rabbit. Circ.
Res. 31: 637-652,
1972.
17
KRIEGER, E. M., M. C. SALGADO, AND L. C. MICHELINI.
Resetting
.
of the baroreceptors.
In: Cardiovascular
Physiology
IV, edited by
A. C. Guyton
and J. E. Hall. Baltimore,
MD: University
Park,
1982, vol. 26, p. 119-146.
(Int. Rev. Physiol.
Ser.)
18. LUDBROOK,
J., I. B. FARIS, J. IANNOS, G. G. JAMIESON,
AND W.
S. RUSSEL. Lack of effect of isometric
handgrip
exercise
in the
responses of the carotid sinus baroreceptor
reflex in man. Clin. Sci.
Mol. Med. 55: 189-194,
1978.
19. LUDBROOK,
J., G. MANCIA,
AND A. ZANCHETTI.
Does the baroreceptor heart rate reflex indicate
the capacity
of the arterial
baroreceptors
to control blood pressure?
Clin. Exp. Pharmacol.
Physiol.
7: 499-503,198O.
20. MANCIA,
G., J. IANNOS, G. G. JAMIESON,
H. H. LAWRENCE,
P. R.
SHARMAN,
AND J. LUDBROOK.
The effect of isometric
handgrip
exercise on the carotid sinus baroreceptor
reflex in man. Clin. Sci.
Mol. Med. 54: 33-37, 1978.
21. MANCIA,
G., AND A. L. MARK. Arterial
baroreflexes
in humans. In:
Handbook
of Physiology.
The Cardiovascular
System. Peripheral
Circulation
and Organ Blood Flow. Bethesda,
MD: Am. Physiol.
Sot., 1983, sect. 2, vol. III, part 2, chapt. 20, p. 755-794.
22. MANCIA,
G., AND A. ZANCHETTI.
Blood pressure
variability.
In:
Handbook
of Hypertension.
Pathophysiology
of Hypertension:
Cardiovascular
Aspects,
edited by A. Zanchetti
and R. C. Tarazi.
Amsterdam:
Elsevier,
1986, vol. 7, p. 125-152.
23. PICKERING,
T. G., AND S. DAVIS. Estimation
of the conduction
time of the baroreceptor-cardiac
reflex in man. Cardiovasc
Res. 7:
713-719,
1973.
24. PICKERING,
T. G., B. GRIBBIN,
AND P. SLEIGHT. Comparison
of
the reflex heart rate response to rising and falling arterial pressure
in man. Cardiovasc.
Res. 6: 777-783,
1972.
25. RAMIREZ,
A., G. BERTINIERI,
L. BELLI, A. CAVALLAZZI,
M. DI
RIENZO,
A. PEDOTTI,
AND G. MANCIA.
Reflex
control
of blood
pressure and heart rate by arterial
baroreceptors
and by cardiopulmonary
receptors
in the unanesthetized
cat. J. Hypertens.
3: 327335,1985.
26. SLEIGHT,
P. Reflex control
of the heart. Am. J. Cardiol. 44: 889894,1979.
27. SLEIGHT, P., P. Fox, R. LOPEZ, AND D. E. BROOKS. The effect of
mental
arithmetic
on blood pressure
variability
and baroreflex
sensitivity
in man. Clin. Sci. Mol. Med. 55: 381s-382s,
1978.
28. SMITH, H. S., P. SLEIGHT, AND G. W. PICKERING.
Reflex regulation of arterial pressure during sleep in man: a quantitative
method
of assessing baroreflex
sensitivity.
Circ. Res. 74: 109-121,
1969.
© Copyright 2026 Paperzz