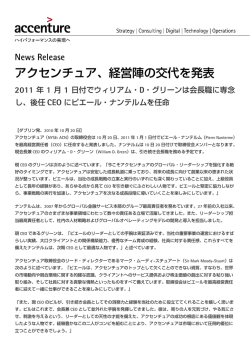
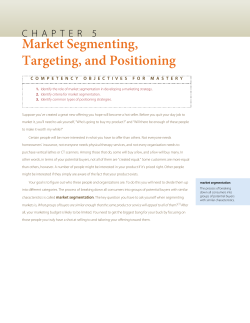
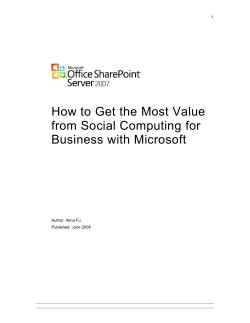
Accenture Customer Insight How To Become A CustomerInfused Company Copyright © 2011 Accenture All Rights Reserved. Accenture, its logo, and High Performance Delivered are trademarks of Accenture. Companies need to act quickly to compete in today’s rapidly changing marketplace. Shopper marketing has changed… Vision of a “customer-infused” company: • More choices, places, data ….but goals of companies and shareholders have not: • Customers will chose a company more often for more of their needs and wants, over the competition… • Greater share of households & customers • Because the company has demonstrated an improved understanding of how to satisfy them… • Greater share of trips & transactions • By infusing a knowledge of these needs and wants, into the day to day marketing, merchandising and operations of the business… • Greater share of needs & requirements • And by managing it in a way that supports the company’s core value proposition while delivering personal relevance to the shopper… • More, bigger and better baskets….over time Copyright © 2011 Accenture All Rights Reserved. • Resulting in a more valuable customer base, and delivering more revenue and profit, to the company’s enterprise 2 Challenge: Linear shopping behavior is gone. Tactics must be customer centric by touch point. Young Hispanic Male Health and Wellness Hustle and Bustle Families New Moms Golden Oldies Many customers Many touchpoints Many tactics Customer Experience Management by functional silos Content Marketing Copyright © 2011 Accenture All Rights Reserved. Promotions Merchandising Pricing Operations Assortment Space Suppliers 3 Concept – Customer Value Customer Value can be defined by one or more measures of recency, frequency and value. Leading companies find the value of each customer, segment them into groups, and determine actions that will drive added value. Share of Requirements ( or % of Categories Shopped, Basket Breadth) Customer Value (e.g. Customers x Transactions x Basket Value) The Opportunity… ILLUSTRATIVE Best Customers - Focus on them to retain them Engaged Customers (Next Best) – Invest in making them best customers Casual Customers (Opportunity) – maintain investment Disengaged Customers – Reduce focus and investment Share of Trips (or Transactions, Basket Count) Copyright © 2011 Accenture All Rights Reserved. 4 Start with the customer WHICH customers are most important? Derive INSIGHTS from your data Be RELEVANT to your customers Find the Value: Segment customers based on value What to Offer: Profile customers, develop strategy based on demand, behaviors and attitudes How to Offer It: Develop tactics across company unleash their value What Customers Buy Customer Value BEST Groceries Clothing Marketing Share of Requirements ( or % of Categories Shopped) Electronics Why Customers Buy ENGAGED/ NEXT BEST Value of Company’s Brand Advertised Price Social Media CASUAL/ OPPORTUNITY Value Brands Promotion seeking Share of Trips (or Transactions) Seasonal visits Copyright © 2011 Accenture All Rights Reserved. Operations How Customers Buy DISENGAGED Find the value Merchandising Mine the value Suppliers Convert the value 5 Day-in-the-life of customer-centric organization ILLUSTRATIVE Macro Tactics Micro Tactics • Focused on a company’s strategic and high-value or “best” customer segments Strategic InStore Placement Valuable customers National Advertising • Addressed to specific customers within those high-value segments Enroll in “new moms club” Responds to in-store promotion Is a Family Promote circular & instore on endcaps With a Baby Not Formula 6 Loyalty points at register 5 4 3 2 1 Oct-04 Jun-04 Apr-04 Aug-04 Oct-03 Feb-04 Dec-03 0 -1 Buys Center Store All customers On a Budget Buys Diapers Tailored assortments, localized circular Remind of promotion with text or call Value created through relevant tactics Macro to Micro Marketing and Merchandizing Activities Copyright © 2011 Accenture All Rights Reserved. 6 Data assets serve as an important foundation to becoming “customer-infused” Does your company know… • • • • • Who your best customers are? Your best customers’ value? How to market to them? How to merchandise to them? How to drive greater loyalty? Are you gathering valuable insights from your transaction data? Which departments do they cross-shop? Customer Receipt What Private Label products do they buy? Do they routinely respond to coupon offers? What percentage of their baskets contain an selected product? Copyright © 2011 Accenture All Rights Reserved. Customer-infused companies need to harness all of its data to provide a 360o view of its customer Data Sources (Examples) “T- Log” • • • • Customer Panel Transactions • Loyalty Cards • Demographics Basket Size • Credit Cards • Market data • Social, Web, Pricing Mobile Promotions What items are in their market basket? Will they respond to an offer? 360o View of Customer Database Do they only buy products on sale? What advertised items did they buy? Allows “Micro-Customer Segmentation” 7 Value proposition: Customer infusion has a material impact on top-line and bottom-line • Greater share of households & customers The value creation resulting from growing consumers, growing trips and growing share of needs is significant. • Greater share of trips & transactions • Greater share of needs & requirements • More, bigger and better baskets….over time Copyright © 2011 Accenture All Rights Reserved. 8 Introducing Accenture Customer Insight Accenture Interactive acquired CadenceQuest and its customer insight software platform in 2010 to build on its suite of digital capabilities, marketing analytics, retail marketing and merchandising solutions and platforms. It contributes to Accenture’s strategy of providing organizations with the predictive analytics capabilities they need to identify and analyze customer data, revealing insights which can drive better business decisions. Accenture Customer Insight is a software solution enabled by a high .performance customer analytical platform that puts descriptive and predictive information about customer behaviors, marketing, merchandising and operational results in the hands of non-technical users. It is uniquely designed to allow users to create “micro-customer segments” in addition to strategic macro-customer segments, using large data volumes of point-of-sale, customer loyalty and behavior data, and plan the needed strategy and tactics to deliver the desired enterprise and customer performance. Accenture Customer Insight allows users to quickly and easily view customer performance through flexible charts and reports; it can support a large number of users from inside and outside of the organization. Copyright © 2011 Accenture All Rights Reserved. 9 How it works – Dynamic “on-the-fly” microsegmentation and targeting 1 Create segment Large Family Stock-Up 2 Profile segment Traits • % of customers • % females / males • % households w/ children • Locations shopped • Products bought • Etc. Analyze customer metrics to create demand-shaping tactics • Basket count - trip frequency and motivation • Basket breadth - share of requirements satisfied • Basket value – sales and margin, brands and products bought together • Response to marketing and promotion, loyalty programs, assortment 4 Copyright © 2011 Accenture All Rights Reserved. 3 Identify additional customers with desired demand and profile traits • Find similar customers who are heavy buyers of cereal based on demand, other customer traits Targeted marketing, 5 merchandising and operations actions for defined segments • Targeted offers, pricing and promotion • Tailored regional and localized assortment and merchandising • Timely service and support operations 6 Large Family Stock-Up Breakfast Cereal Buyers Analyze Impact to determine next steps for segment • Pre-, performance and postperformance results • Customer migration 7 Further refine, split or combine segments with Segment Math: 10 How it works – Compelling analytic insights – easily executed and delivered Dashboards provide “on-the-fly” views of most important customer, marketing, merchandising and operations performance metrics Reports that require deeper queries are created with simple drag and drop interface and sent to queue with status notification • Status notification and email delivery of results (Excel, Flash, .zip) upon query completion • Visualization of report results via Microsoft Excel allowing user to manipulate with familiar tools Copyright © 2011 Accenture All Rights Reserved. Shopping Basket Analysis - Cross Product Category VITAMINS Prompt Selections: Prompt 1: Select Start Date of Performance PeriodYour selection: 6/1/2007 Prompt 2: Select End Date of Performance PeriodYour selection: 6/30/2007 Prompt 3: Select Primary Product GroupYour selection: Category In List (VITAMINS) ####### Prompt 5: Select Report LevelYour selection: Category Prompt 6: Select Geographical AreaYour selection: Prompt not answered Prompt 7: Customer SegmentYour selection: Customer Segment = Customer Migration:470 Prompt 8: Store SegmentYour selection: Store Segment = Prompt not answered Attachment Index Customer Count Units per Basket Primary Product Units per Basket Comparison Product $ Per Basket $ Sales Comparison Product $ Sales Primary Product $ Sales Other Products Total Store $ per Basket Basket Size Index 7,950 2,111 1.3 1.3 $21.38 $11.02 $11.02 $10.36 $21.38 100 INC ONTINENC E 241 6 1.8 1.0 $42.12 $4.14 $12.37 $11.42 $12.34 341 FLOWERS 234 1 2.0 1.0 $20.87 $3.99 $16.88 $0.00 $5.65 369 APOTHEC ARY 232 8 1.3 1.1 $18.09 $3.28 $9.99 $3.85 $18.13 100 STOMAC H REMEDIES 213 109 1.3 1.3 $35.20 $9.51 $13.21 $6.60 $15.32 230 POSTAGE STAMP 209 5 1.8 1.2 $45.32 $9.84 $18.25 $7.06 $14.14 320 C ANDLES 207 6 1.8 1.2 $17.44 $3.41 $9.57 $1.95 $8.01 218 ORAL HYGIENE 197 162 1.5 1.4 $30.08 $5.16 $12.02 $8.28 $12.25 246 PROMOTIONAL 195 75 1.6 1.0 $25.76 $1.00 $13.03 $7.81 $13.58 190 SUNC ARE 192 29 1.4 1.4 $38.12 $11.18 $13.32 $9.34 $16.82 227 PAIN RELIEVERS 181 131 1.4 1.1 $35.17 $6.65 $13.02 $5.47 $12.26 287 SUNGLASSES 181 4 1.3 1.0 $37.57 $10.24 $9.74 $10.87 $21.46 175 DIET/NUTRITION 177 18 1.2 1.3 $14.83 $2.20 $7.24 $3.55 $8.10 183 SHAVING NEEDS 175 51 1.6 1.3 $39.73 $6.91 $14.42 $6.58 $14.62 272 SKIN C ARE 169 138 1.4 1.5 $31.77 $8.97 $12.72 $6.39 $13.32 238 PIC TURE FRAMES & ALB 144 5 1.0 1.2 $29.82 $9.03 $12.13 $8.66 $12.36 241 HOME DIAGNOSTIC S 143 6 1.2 1.0 $35.90 $18.92 $13.66 $2.73 $15.83 227 HOUSEHOLD 135 110 1.5 1.4 $23.16 $2.24 $11.08 $3.68 $8.03 288 DOLLAR DEALS 128 22 1.2 1.7 $30.11 $1.60 $9.15 $8.44 $9.55 315 HAIR C OLOR 125 11 1.0 0.8 $21.54 $4.89 $10.79 $5.86 $7.41 291 TOP OF C HEC KOUT 124 13 1.5 1.2 $27.72 $2.76 $12.21 $4.75 $10.32 269 FOOT C ARE 124 9 1.1 1.0 $30.93 $4.46 $10.91 $5.00 $9.15 338 GROC ERY 118 74 1.6 1.5 $22.64 $2.71 $13.27 $5.02 $7.69 294 HOUSEHOLD PAPER 116 81 1.4 1.3 $23.73 $2.85 $11.13 $4.81 $9.24 257 HAIR C ARE 116 48 1.4 1.1 $24.32 $3.35 $12.02 $4.54 $9.36 260 11 Example – Identify and segment customers See what portion of all customers are “Best” Look at overall performance of customer segment metrics Copyright © 2011 Accenture All Rights Reserved. Use Segment Template to Create “Best Customer” segment with Customer Decile template for two time periods See who they are (demographics) Use Segment Math to determine repeat (in A and B) or migrated (in A, not B) to identify repeat (or migrating) over both periods See what they are buying 12 Example – Plan, execute and measure tactics Look at performance of segments in past promotions. Use insight to determine marketing and merchandising tactics Use Promotion Impact Report to show each segment’s performance for the weekly circular advertisement executed Prompt Selections: Prompt 1: Select Calendar Week Start DateYour selection: Week = 6/3/2007 or 6/10/2007 or 6/17/2007 or 6/24/2007 Prompt 2: Select Advertisement for Promotion ProductsYour selection: Advertisement = 2007-06-17 Prompt 3: Select Geographical AreaYour selection: Prompt not answered Prompt 4: Customer SegmentYour selection: Customer Segment = Customer Migration:470 Prompt 5: Store SegmentYour selection: Store Segment = Prompt not answered Promotion Impact Week Promotion Basket Count $ per Basket $ $ NonPromotion Promoted Products Products per per Basket Basket Units per Basket NonPromotion Promoted Units per Units per Basket Basket % Promoted Only Baskets 6/3/2007 4,420 $11.68 $4.45 $7.23 6.2 4.0 2.2 23.0% 6/10/2007 6,308 $9.32 $3.35 $5.97 4.8 3.1 1.8 17.9% 6/17/2007 6,066 $6.86 $2.48 $4.38 3.1 1.7 1.4 6/24/2007 3,188 $7.16 $2.31 $4.84 3.0 1.6 1.4 Marketing: Link to and export segments directly to campaign management systems Merchandising: Perform assortment optimization for a category in tool, or link to Accenture Assortment & Space Optimizer Use Shopping Basket – Cross Product Report to understand products each segment is buying together Shopping Basket Analysis - Cross Product Category VITAMINS INC ONTINENC E FLOWERS Prompt Selections: Prompt 1: Select Start Date of Performance PeriodYour selection: 6/1/2007 Prompt 2: Select End Date of Performance PeriodYour selection: 6/30/2007 Prompt 3: Select Primary Product GroupYour selection: Category In List (VITAMINS) ####### Prompt 5: Select Report LevelYour selection: Category Prompt 6: Select Geographical AreaYour selection: Prompt not answered Prompt 7: Customer SegmentYour selection: Customer Segment = Customer Migration:470 Prompt 8: Store SegmentYour selection: Store Segment = Prompt not answered Units per Basket Primary Product Units per Basket Comparison Product $ Per Basket $ Sales Comparison Product $ Sales Primary Product $ Sales Other Products Total Store $ per Basket Basket Size Index Attachment Index Customer Count 7,950 2,111 1.3 1.3 $21.38 $11.02 $11.02 $10.36 $21.38 100 241 6 1.8 1.0 $42.12 $4.14 $12.37 $11.42 $12.34 341 234 1 2.0 1.0 $20.87 $3.99 $16.88 $0.00 $5.65 369 APOTHEC ARY 232 8 1.3 1.1 $18.09 $3.28 $9.99 $3.85 $18.13 100 STOMAC H REMEDIES 213 109 1.3 1.3 $35.20 $9.51 $13.21 $6.60 $15.32 230 POSTAGE STAMP 209 5 1.8 1.2 $45.32 $9.84 $18.25 $7.06 $14.14 320 C ANDLES 207 6 1.8 1.2 $17.44 $3.41 $9.57 $1.95 $8.01 218 ORAL HYGIENE 197 162 1.5 1.4 $30.08 $5.16 $12.02 $8.28 $12.25 246 PROMOTIONAL 195 75 1.6 1.0 $25.76 $1.00 $13.03 $7.81 $13.58 190 SUNC ARE 192 29 1.4 1.4 $38.12 $11.18 $13.32 $9.34 $16.82 227 PAIN RELIEVERS 181 131 1.4 1.1 $35.17 $6.65 $13.02 $5.47 $12.26 287 SUNGLASSES 181 4 1.3 1.0 $37.57 $10.24 $9.74 $10.87 $21.46 175 DIET/NUTRITION 177 18 1.2 1.3 $14.83 $2.20 $7.24 $3.55 $8.10 183 SHAVING NEEDS 175 51 1.6 1.3 $39.73 $6.91 $14.42 $6.58 $14.62 272 SKIN C ARE 169 138 1.4 1.5 $31.77 $8.97 $12.72 $6.39 $13.32 238 PIC TURE FRAMES & ALB 144 5 1.0 1.2 $29.82 $9.03 $12.13 $8.66 $12.36 241 27.3% HOME DIAGNOSTIC S 143 6 1.2 1.0 $35.90 $18.92 $13.66 $2.73 $15.83 227 HOUSEHOLD 135 110 1.5 1.4 $23.16 $2.24 $11.08 $3.68 $8.03 288 23.9% DOLLAR DEALS 128 22 1.2 1.7 $30.11 $1.60 $9.15 $8.44 $9.55 315 HAIR C OLOR 125 11 1.0 0.8 $21.54 $4.89 $10.79 $5.86 $7.41 291 Copyright © 2011 Accenture All Rights Reserved. See overall lift as a result of marketing and merchandising tactics TOP OF C HEC KOUT 124 13 1.5 1.2 $27.72 $2.76 $12.21 $4.75 $10.32 269 FOOT C ARE 124 9 1.1 1.0 $30.93 $4.46 $10.91 $5.00 $9.15 338 GROC ERY 118 74 1.6 1.5 $22.64 $2.71 $13.27 $5.02 $7.69 294 HOUSEHOLD PAPER 116 81 1.4 1.3 $23.73 $2.85 $11.13 $4.81 $9.24 257 HAIR C ARE 116 48 1.4 1.1 $24.32 $3.35 $12.02 $4.54 $9.36 260 13 Accenture Customer Insight can help move a company from descriptive to predictive analytics What’s the best that can happen? What will happen next? What if these trends continue? Predictive Analytics (the “so what”…and the “now what”) Future orientated and source of competitive advantage Why is this happening? What actions are needed? Descriptive Analytics (the “what”) Where exactly is the problem? How many, how often, where? What happened? Copyright © 2011 Accenture All Rights Reserved. “Rearview mirror” – provides foundation and insight 14 Accenture Customer Insight Platform & Modules Accenture Customer Insight Analytic Modules Customer • Customer Segmentation • Customer Profiling • Customer Behavior Marketing • • • • Promotions Advertising Campaign Mgmt Loyalty Merchandising • Assortment • Space • Pricing Operations • Inventory • Labor Supplier • Demand Signals • Supply Signals • Portfolio Accenture Customer Insight Platform Segmentation & Analytics Engine Database, CPU & Storage Copyright © 2011 Accenture All Rights Reserved. • • • • • • • Transactions Customers(Segments) Channels (Store, Mobile, Web, Social) Locations (Stores, Banners & Markets) Products (SKUs) Events (Campaigns) Time (Date) • • • • Extract, Transform & Load (ETL) CPU & Data Models Data Cleansing Data Storage 15 Accenture Customer Insight Software Accenture Customer Insight Platform & Analytic Modules 1 Installed Software & Maintenance Licenses 2 Month-to-Month Software Subscription 3 “Cloud” Software as a Service Subscription Copyright © 2011 Accenture All Rights Reserved. 16 Accenture Customer Insight Services What we offer • Segmentation and “Micro-Segmentation” – Identify your best customers – the ones that drive the greatest value to your enterprise. Understand the personas of customer segments. Find the exact groups of customers, channels, locations, or promotions – “micro-segments” – are most appropriate for a given offer or product. • Customer Insight - Understand what promotions, prices, and products groups of customers have responded to in the past and predict which they will want in the future. • Marketing Effectiveness – Determine and measure the best promotions, prices, loyalty programs, marketing offers for your customers • Merchandising Effectiveness – Determine and measure the best product portfolio and assortment range for your customers • Supplier Collaboration –Share your customer, marketing and merchandising insights with your suppliers to improve offers for your customers Copyright © 2011 Accenture All Rights Reserved. 17 Accenture Customer Insight Services How we deliver • Strategy – Strategic segmentation, strategic planning, process optimization, objective definition, key performance indicator (KPI) definition 1 Enable your organization to gain value using Accenture Customer Insight solutions through: • Pilots • Configuration & Set Up • Analytic Insights – Predictive modeling, statistical clustering, ad hoc analyses, recurring analyses, outsourced analytics. • Data Management – Data management, data modeling, data mapping, data cleansing and extract, transform and load (ETL) configuration to ensure the customer data is ready to use Consulting Services • Training 2 Managed Service Solutions Allow Accenture to manage the Accenture Customer Insight solution for you, end-to-end • Installation, Configuration, Hosting and Support – Software installation and configuration, “cloud” hosting, customization, maintenance and support Copyright © 2011 Accenture All Rights Reserved. 18 Getting Started – Pilot Ideas Category Key Questions Addressed Anticipated Benefits Promotional Effectiveness • What are the best promotions that deliver true incremental foot traffic and basket size by customer segment? • What is the impact on overall store sales, repeat purchase behavior, frequency of transaction, new customers, etc. • What is the penetration rates of pricing levels for each customer segment? Targeted promotions that result in higher ROI Assortment Planning • Who are the most valuable customers for a given category? • What store/category specific assortments are likely to appeal to target customer segments? • Which SKU’s contribute the most to category value by customer segment? Increased efficiency of category assortments (lower carrying costs and higher sales); increased loyalty of target customers Category / Brand Growth • Who are the highest potential customers to grow my category? • What SKU’s are most meaningful to them ($, volume, margin, loyalty, etc.) • What is the most effective way to market to them? • What are switching opportunities for private label? Improved sales through identifying targeted customer opportunities Target Segment Growth • What cross-sell opportunities exist around growing target customer segments? • What promotions (direct mail, circular ads, e-coupons, etc.) can be employed to grow target segments? i.e. grow “Best Baby Formula” customers from “Best Diaper” customers Drive segment growth through targeted migration tactics Store to Market Competitive Evaluation • What categories have the best upside growth to take volume from competition? • What customer segments should I retain and how? Improved customer loyalty; new customer growth Copyright © 2011 Accenture All Rights Reserved. 19 Why Accenture? The Accenture Customer Insight team partners with clients to move beyond the vision and quickly develop, drive and sustain growth through customer-infused marketing and merchandising initiatives Industry expertise Implementation focus • Experienced consultants many who are former industry executives • Close co-operation with management and employees • Clear industry focus to drive for the right initiatives in the right areas • Distinct make-it-happen attitude to deliver results • Combination of quick wins as well as longer term value sustaining activities • No re-inventing of the wheel; leveraging existing initiatives Accenture’s Key Differentiators Full-services portfolio in-house Holistic approach • Accenture specialists for growth and innovation initiatives • Accenture functional experts for all functions, worldwide • Transaction support, process and IT services on site, near and off shore • Addressing all stages of growth in the end-to-end process through a cross-functional approach • Focus on change management and active promotion of performance culture • Strategic view of growth from vision and an enabling execution engine Copyright © 2011 Accenture All Rights Reserved. 20 To learn more about Accenture Customer Insight, visit Accenture Interactive: www.accenture.com/accentureinteractive Or contact us at Bob Ghafouri [email protected] Tel: +1.703.947.4483 Copyright © 2011 Accenture All Rights Reserved. 21
© Copyright 2026 Paperzz