OUTLINE
Essays on Finite Sample Inference
and Financial Econometrics
Yong Bao
Department of Economics
University of California, Riverside
1. Finite Sample Moments of Econometric Estimators with Non-IID Observations
2. The Second-Order Bias and Mean Squared Error
of Time Series Estimators*
3. Finite Sample Properties of Maximum Likelihood
Estimator in Spatial Models
4. Bias of Value-At-Risk Model
5. Evaluating Predictive Performance of Value-AtRisk Models in Emerging Markets: A Reality Check*
March 31, 2004
6. A Test for Density Forecast Comparison with Applications to Risk Management
Chapters 1 to 4:
OVERVIEW
Addresses two issues in econometric modeling:
I. INTRODUCTION
i) a model’s in-sample properties of when the sample
size is finite (Chapters 1 to 4)
Motivation: Л†
wn = Л†
w = h (Z) , properties (moments)
of Л†
w or f (Л†
w)?
n is finite (small or moderately large), properties of
Л†
wn / properties of a model f (Л†
wn)
ii) a model’s out-of-sample predictive ability when the
sample size is large (Chapters 5 to 6)
n is infinitely large, predictive ability under proper loss
functions
R
w) = E[h (Z) ] = h (Z) f (Z)dZ
Exact results: e.g., E(Л†
Approximate
• Asymptotic theory (first-order), n < "
• finite sample theory (second-order), n is moderately large
E[h( Z )]
Ві h( Z ) f ( Z )dZ
In general, difficult to
obtain, or difficult to
interpret even if obtainable
E (Tˆ)
(regardless of n)
Exact
Bias = O(n 1 )
MSE = O(n 2 )
Consistent
V (Tˆ) O (n 1 )
Approximate
Asymptotic Theory
(Second-order)
(First-order)
(moderately large n)
(n o f)
Moments (Analytical) of Tˆ hZ Problems with the asymptotic theory:
• Can not distinguish a class of estimators of the
same asymptotic properties
— FGLS in SURE models
— GMM and GEL
• Crucial assumption: n < ". Realistic, esp. for
macro data? No!
— JBES, 1996, GMM
Finite-Sample Properties of Some Alternative GMM Estimators. pp. 262-80
Lars Peter Hansen, John Heaton and Amir Yaron
A Comparison of Alternative Instrumental Variables Estimators of a Dynamic Linear Model. pp. 281-93
Kenneth D. West and David W Wilcox
Small-Sample Properties of GMM-Based Wald Tests. pp. 294-308
Craig Burnside and Martin Eichenbaum
Small-Sample Properties of GMM for Business-Cycle Analysis. pp. 309-27
Lawrence J Chistiano and Wouter J den Haan
GMM Estimation of a Stochastic Volatility Model: A Monte Carlo Study. pp. 328-52
Torben G Andersen and Bent E Sorensen
Small-Sample Bias in GMM Estimation of Covariance Structures. pp. 353-66
Joseph G Altonji and Lewis M Segal
Small-Sample Properties of Estimators of Nonlinear Models of Covariance Structure. pp. 367-73
Todd E Clark
Volume 14, issue 3, 1996
Journal of Business and Economic Statistics
Analytical finite sample theory allows us to
• select the estimator with good finite sample properties from a class of asymptotically equivalent
estimators
• measure the magnitude of the loss of asymptotictheory-based inference in finite samples
• understand the source of the finite sample bias
and thereby design a bias-corrected estimator
• check the accuracy of certain Monte Carlo experiments
Extensive literature on the analytical finite sample
properties of econometric estimators
• Linear Models: Hurwicz (1950), White (1957,
1958, 1959, 1961), Nagar (1959), Shenton and
Johnson (1965), Sawa (1969, 1978), Anderson
and Sawa (1973, 1979), Basmann (1974), Sargan
(1974, 1976), Phillips (1977,1978, 1979, 1987),
Dufour (1984, 1990), Hoque et al. (1988), Rothenberg (1984), Kiviet and Phillips (1993, 1997), Dufour and Kiviet (1996), Lieberman (1994), Tsui
and Ali (1994), Ullah and Srivastava (1994), Ali
(2002), Ullah (2002), among others.
• Nonlinear Models: Amemiya (1980), Cordeiro and
Klein (1994), Rilstone et al.(1996), Linton (1997),
Iglesias and Phillips (2001), Gospodinov (2002),
Anatolyev (2003), Bao and Ullah (2003), Newey
and Smith (2004), among others.
Issues:
• Generally IID
• Generally Gaussian normal
• Generally linear models
• Generally specific estimators (LS or ML) in specific models
Contribution of this thesis: a unified approach for the
second-order bias/MSE of a class of estimators when
• Non-IID (time series, cross section, panel, etc.)
• Nonnormal
• Nonlinear
• Digerent types of estimators (GMM, LS, QML,
and other extremum estimators)
II. SECOND-ORDER BIAS AND MSE
I
Consider a class of n-consistent estimators identified
by the moment condition
Л†
w=Л†
wn = arg {n(w) = 0} ,
where n(w) = n(Z; w) is a known p Г— 1 vectorvalued function of the observable data Z = {Zi}n
i=1 ,
and a parameter vector w of p elements such that
E [n(w)] = 0.
Example 1: LS
y = Xq + 0
ВЅ
Вѕ
Л† OLS = arg n (q) = 0 | n (q) = 1 X 00
q
n
Chapter 1: general results, non-IID and nonnormal
Example 2: (Q)ML
Chapter 2: time series models, normal
Chapter 3: spatial models, normal
Chapter 4: VaR model, nonnormal
P
L (w) = n1 n
i=1 li (w)
;
?
<
n
1X
Yli (w) @
Л†
wML = arg n (w) = 0 | n (w) =
=
n i=1 Yw >
Example 4: GEL
Example 3: GMM
min D4 (Fn, Pn)
gn (w) = E [g (Z, w)] = 0,
gn (В·) is m Г— 1, w is p Г— 1, m D p
Qn (w) = gn (w)0 Wn (w) gn (w)
Л†
wGMM = arg {n (w) = 0 | n (w) = YQn (w) /Yw}
PnMP
s.t. gn (w) = E [g (Z, w) |Pn] =
R
g (Z, w) dPn = 0
g (В·) is m Г— 1, w is p Г— 1, m D p
ВЎ
Вў
Define X = w0, b0 0 and
Ln (X) = D4 (Fn, Pn) + b0gn (w)
Л† GEL = arg {n (X) = 0 | n (X) = YLn (X) /YX}
X
Assumption 1: The s-th order derivatives of n(Л†
w)
2
s
exist in a neighborhood of w and E(||Q n(w)|| ) <
", where ||A|| for a matrix A is the usual norm
ВЈ ВЎ
ВўВ¤
tr AA0 1/2 and tr is the trace operator on a matrix.
Given Assumptions 1-3, Taylor expansion
Ві Вґ
w
0 = n Л†
Ві
Вґ
w 3 w + 12 Q2n (w)
= n (w)+Qn (w) Л†
Assumption 2: For some neighborhood of w, [Qn(Л†
w)]31 =
Op (1) .
+ 16 Q3n (w)
h
hВі
Вґ
Ві
ВЇВЇ
Ві Вґ
ВЇВЇ
ВЇВЇ
ВЇВЇ
Ві
Ві Вґ
i hВі
Вґ
Ві
Вґ
Ві
Л†
w3w Л†
w3w
Л†
w3w Л†
w3w Л†
w3w
+ 16 Q3n ВЇ
w 3 Q3n (w)
ВЇВЇ
ВЇВЇ
ВЇВЇ
ВЇВЇ
w 3 Qs n (w)ВЇВЇ $ ВЇВЇЛ†
w 3 wВЇВЇ Mn
Assumption 3: ВЇВЇQsn Л†
for some neighborhood of w, where E (|Mn|) < C <
" for some positive constant C.
Вґ
hВі
Вґi
Вґ
Ві
Л†
w3w Л†
w3w Л†
w3w
Вґi
Solve for (Л†
w 3 w) from above and use the expansion
for [Q n (w)]31 as follows
[Qn (w)]31 =
h
i31
31
Q +V
= Q 3 QV Q + QV QV Q + В· В· В· ,
where Q = [EQn (w)]31 and V = Qn (w) 3 EQ n (w).
|
{z
O(1)
}
|
ВЎ {z
Вў
OP n31/2
}
Вґi
.
XE H
1
n
O 1 1
1
1
n n
n OP §¨ n 1 / 2 ·¸
В©
В№
1
1
X 'H
X ' y XE n
n
1
Вџ В’\ n E X ' X
n
Вџ
1
1
1
[ E ( X ' X ) ( X ' X ) E ( X ' X )]1
n n n Ÿ \ n E OP §¨ n 1 / 2 ·¸
В©
В№
OP §¨ n 1 ·¸
В©
В№
OP §¨ n 3 / 2 ·¸
В©
В№
= [ E ( X ' X )]1 u {I /
, //
, ///
....}
n
1
OP §¨ n 1 / 2 ·¸ QV { /
В©
В№
= [ E ( X ' X )]1 u {I [ E ( X ' X )]1[( X ' X ) E ( X ' X )]}1
[В’\ n E ]1 =
y
Expansion for [В’\ n T ]1 , an example: OLS
Therefore
Л†
w 3 w = a31/2 + a31 + a33/2 + OP n32 ,
where a3s/2 = OP n3s/2
Qin.
w = E a31/2 + E (a31) + o n31 ,
B Л†
Ві Вґ
Ві
Ві
Вґ
are functions of Hi =
Вґ
Ві
Ві
Вґ
Вґ
The second-order bias and MSE
M (Л†
w) = E(A31) + E(A33/2) + E(A32) + o n32 ,
Ві
Вґ
where the p Г— p matrices
A31 = a31/2a031/2,
A33/2 = a31/2a031 + a31a031/2,
A32 = a31/2a033/2 + a33/2a031/2 + a31a031.
Special case:
- IID observations, Rilstone, Srivastava, Ullah (1996)
Time Series Models
III. MODELS
1. ARX(1)
yt = 4yt31 + x0tq + 0t,
where |4| < 1 and X 0X = O (n) .
y = f (X; w) + 0
E (0t) = 0, E
Ві
Вґ
2
0t = j 2.
THEOREM. In the ARX(1)Ві model
Вґ with |4| < 1, the
31
second-order bias, up to O n
, of the OLS estimator 4
Л† when the errors are nonnormally distributed
is
If nonnormal,
Ві
Вґ
E 03t = j 3 1,
Ві
Вґ
B (Л†
4) =
E 04t = j 4 ( 2 + 3) ,
E
Ві
Вґ
5
0t = j 5 ( 3 + 10 1) ,
Ві
Вґ
Ві
В·
Ві
Вґ31Вё
2
2
j tr (MC) 3 24 1 3 4
3
Вґ
E 06t = j 6 4 + 10 21 + 15 2 + 15 .
ВЇ
D
В·
Вё
Ві
Вґ31
2
0
2
0
2j rD CrD 3 4 1 3 4
rD rD
ВЇ2
D
+ 11 1,
where
11 =
3j 30
©£
ВЎ
ВўВ¤
ВЄ
I ВЇ C 0M C rD + 2 [I ВЇ (MC)] C 0rD
.
ВЇ2
D
U~ BC , N
U~ BC , NN
BiasN
BiasNN
U~ BC , N
U~ BC , NN
BiasN
BiasNN
0.9 0.8815 0.9011 0.9016 0.9017 0.9026 -0.0196 -0.0201
0.3 0.2732 0.2967 0.3017 0.2955 0.3004 -0.0235 -0.0286
0.2 0.1766 0.1963 0.2011 0.1951 0.1999 -0.0197 -0.0246
0.1 0.0803 0.0959 0.1005 0.0949 0.0994 -0.0155 -0.0202
U BC , NN
6
U BC , N
U
Uˆ
n = 50
degrees of freedom of the non-central t
true parameter
OLS estimate
bias-corrected estimate using U , ignoring nonnormality
bias-corrected estimate using U
feasible bias-corrected estimate using Uˆ , ignoring nonnormality
feasible bias-corrected estimate using Uˆ
theoretical bias of Uˆ , ignoring nonnormality
theoretical bias of Uˆ
d.f.
BiasN
BiasNN
d.f.
U
Uˆ
U BC , N
U BC , NN
U~ BC , N
U~ BC , NN
0.9 0.8818 0.9014 0.9020 0.9021 0.9032 -0.0196 -0.0203
0.3 0.2702 0.2937 0.3003 0.2924 0.2988 -0.0235 -0.0301
0.2 0.1735 0.1931 0.1995 0.1919 0.1982 -0.0197 -0.0261
0.1 0.0772 0.0927 0.0988 0.0916 0.0976 -0.0155 -0.0216
U BC , NN
5
U BC , N
U
d.f.
Uˆ
Bias, AR model, n = 50
0.9 0.8869 0.9001 0.9010 0.9005 0.9015 -0.0132 -0.0141
0.3 0.2801 0.2950 0.2989 0.2944 0.2983 -0.0149 -0.0188
0.2 0.1823 0.1948 0.1986 0.1943 0.1980 -0.0125 -0.0163
0.1 0.0847 0.0948 0.0984 0.0943 0.0978 -0.0100 -0.0136
5
BiasNN
BiasN
U~ BC , NN
U~ BC , N
U BC , NN
U BC , N
Uˆ
U
d.f.
n = 80
COROLLARY. In a pure AR(1) model with the autoregressive
|4| < 1, the second-order bias,
Ві coeqcient
Вґ
Л† is 324/n.
up to O n31 , of the OLS estimator 4
COROLLARY. If in the ARX(1) model with |4| <
1, ВіX =Вґ and q 6= 0, the second-order bias, up to
O n31 , of the OLS estimator 4
Л†, is given by B (Л†
4) =
3 (1 + 34) /n.
Ві
Вґ
THEOREM. The second-order bias of 4
Л†, up to O n31 ,
Ві
Вґ
Л† in
and MSE, up to O n32 , of the OLS estimator 4
the pure AR(1) model when the errors are normally
distributed are
1
B (Л†
4) =
Q2b11,
2
(n 3 1)
Вґ
6Q2
2Q3 Ві
2 b
M (Л†
4) =
b
+
1
+
3Q
20
21
(n 3 1)2
(n 3 1)3
3Q4
+
b22,
(n 3 1)4
where Q =
Вµ
tr(C1P)
n31
for r, s = 0, 1, 2.
В¶31
h
Вў ВЎ
Вў
ВЎ
, brs = E y 0Cy r В· y 0C1y s
i
yt
xt
D Ext 1 ut ,
c Uxt 1 vt .
Intuition:
E ( Eˆ E )
V uv
V 1 3U В·
2
ˆ U ) uv2 §¨
Вё O(T )
2 E(U
Vv В© T В№
Vv
2
V uv is negative, and V uv / V v ВЏ [22.3, 13.6]
Even E ( Uˆ U ) | (1 3U ) / T is quite small
for U ВЏ (1, 1) for moderately large T, the
bias of Eˆ is scaled up substantially due to
2
V uv / V v .
Nelson, C.R., Kim, M.J., 1993. Predictable stock
returns: the role of small sample bias. Journal of
Finance 48, 641~661.
Mark, N.C., 1995. Exchange rates and fundamentals:
evidence on long-horizon predictability. American
Economic Review 85, 201~218.
Bekaert, G., Hodrick, R.J., Marshall, D.A., 1997. On
biases in tests of the expectations hypothesis of the
term structure of interest rates. Journal of Financial
Economics 44, 309~348.
2. MA(1)
THEOREM. In the ARX(1)Ві model
Вґ with |4| < 1, the
second-order bias, up to O n31 , of the OLS estiˆ 0)0 is
mator Л†
w = (Л†
4, q
Ві Вґ
B Л†
w
Ві
ВЇ 0C Z
ВЇ 0C Z
ВЇ 31[j 2Z
ВЇD
ВЇ 31e1 + j 2e1tr Z
ВЇD
ВЇ 31
= 3D
+ 11 1,
Ві
Вґ Ві
Вґ
4
0
31
0
ВЇ
+ 2j e1 e1D e1 tr CC C ]
yt = 0t 3 0t31, || < 1.
Вґ
ВЇ 31e1e0 D
ВЇ 31Z
ВЇ 0S.
where 1 1 = 3j 3D
1
THEOREM. In the MA(1)Ві model
Вґ with 00 = 0, the
31
second-order bias, up to O n
, of the conditional
Л† is
QMLE Ві Вґ
Л†
B THEOREM. In the ARX(1) Віmodel
Вґ with |4| < 1, the
31
second-order bias, up to O n
, of j
Л† 2 = (y 3
Л† 0(y 3 4
Л†
Л†y31 3 X q)/n
is
4
Л†y31 3 X q)
Ві
Вґ
Вґ
2Ві
Л† 2 = 3 1 0 + 11 1 + 21 2 + 31 3 + 41 4 + 211 11 .
B j
n
=
tr (N) tr (N1) + tr (N WN1)
3
[tr (N1)]2
n
3
2tr (N)
tr (N1)
o
tr (N2) [tr (N)]2 + tr (N WN)
2 [tr (N1)]3
+ 21 2,
where
1 2 = {tr(N1)tr(N1 ВЇ N) 3tr(N2)tr(N ВЇ N) /2}/ [tr (N1)]3 .
Define
3. ARCH(1)
yt = 0t,
p
0t = zt ht,
ht = k0 + k102t31,
zt ; IID (0, 1) .
) = A02A22 3 A212,
Ві
j
Вґ
Aij = E 02i
t31/ht ,
P
C1 = n
i=1 E
P
C2 = n
i=1 E
P
C3 = n
i=1 E
P
C4 = n
i=1 E
P
C5 = n
i=1 E
P
C6 = n
i=1 E
Гѓ
02t3i
1
3
h2t ht3i
h2t h2t3i
!
Гѓ
02t3i31
02t3i02t3i31
3
h2t ht3i
h2t h2t3i
Гѓ
02t3102t3i
02t31
3
h2t ht3i
h2t h2t3i
Гѓ
02t3102t3i31
02t3102t3i02t3i31
3
h2t ht3i
h2t h2t3i
Гѓ
04 02t3i
04t31
3 t31
2
ht ht3i
h2t h2t3i
Гѓ
04t3102t3i31
04 02 02t3i31
3 t31 t3i
2
ht ht3i
h2t h2t3i
,
!
!
!
,
,
!
,
!
.
,
Ві
Вґ
THEOREM. The second-order bias, up to O n31 ,
of the QMLE for the ARCH(1) model is given by
Ві Вґ
1
B Л†
w =
n)2
Гѓ
B0
B1
!
,
THEOREM. The second-order bias of the Value-atRisk estimated by the method of QML, where the conditional volatility is specified by an ARCH(1) model,
is
h
i
d
VaRn+1|n(k) 3 VaRn+1|n(k) = Bias1 + Bias2,
where
E
B 0 = A222C1 3 A12A22 (C2 + 2C3) + A02A22C4 +
A212 (C4 + C5) 3 A02A12C6,
where Bias 1 = В· В· В· , is due to misspecification of the
conditional distribution, and Bias 2 = В· В· В· , is due to
the parameter estimation error.
B 1 = 3A12A22C1 + A212 (C2 + C4) + A02A22C3 3
2A02A12C4 3 A02A12C5 + A202C6,
Special case: k1 = 0,
k
1
B (Л†
k0) = 3 0 , B (Л†
k1) = 3 ,
n
n
also see Engle et al. (1985).
Berkowitz, J., and J. O’Brien. (2002). “How Accurate Are Value-at-Risk Models at Commercial Banks?”
Journal of Finance 57, 1093-1111.
Bias of the 5% VaR, n = 1000
D 0 1 D 1 , Student t
D1
v
0.1
5
-0.1509 -0.0836 -0.0672
6
-0.1005 -0.0580 -0.0424
10
-0.0495 -0.0237 -0.0258
where |4| < 1 and W is the spatial weights matrix,
assumed to be known a priori.
50
-0.0216 -0.0028 -0.0188
Example 1: crime rates
f
-0.0169
3
5
-0.2105 -0.0768 -0.1337
6
-0.1433 -0.0537 -0.0896
10
-0.0740 -0.0221 -0.0519
50
-0.0379 -0.0026 -0.0353
f
-0.0331
0.5
Bias
Bias1
0.0000
0.0000
Bias2
-0.0169
-0.0331
4. SPATIAL MODEL
y = 4W y + 0,
5
-0.2625 -0.0456 -0.2170
6
-0.1688 -0.0323 -0.1365
10
-0.0957 -0.0136 -0.0821
50
-0.0589 -0.0017 -0.0572
f
-0.0528
0.0000
-0.0528
3
43
4
+0
Example 2: starting salaries for new assistant professors
3
0.9
4
Riverside
0 w12 w13
Riverside
E
F
E
FE
F
0 w23 D C San Diego D
C San Diego D = 4 C w21
Irvine
Irvine
w31 w32 0
4
3
43
4
UCR
0 w12 w13
UCR
E
F
E
FE
F
0 w23 D C UCSD D
C UCSD D = 4 C w21
UCI
UCI
w31 w32 0
+0
Properties of 4
Л†?
U
Uˆ
Uˆ BC
U~BC
J=2
-0.9
-0.8
-0.6
-0.4
-0.2
0
0.2
0.4
0.6
0.8
0.9
-0.882
-0.776
-0.574
-0.382
-0.188
-0.001
0.189
0.382
0.577
0.776
0.881
-0.900
-0.799
-0.598
-0.401
-0.198
-0.001
0.200
0.402
0.602
0.798
0.899
-0.900
-0.799
-0.597
-0.399
-0.197
-0.001
0.199
0.400
0.600
0.798
0.899
J=6
-0.9
-0.8
-0.6
-0.4
-0.2
0
0.2
0.4
0.6
0.8
0.9
-0.810
-0.741
-0.596
-0.434
-0.253
-0.071
0.124
0.322
0.527
0.736
0.853
-0.812
-0.733
-0.568
-0.388
-0.191
0.003
0.205
0.402
0.599
0.790
0.892
-0.804
-0.728
-0.570
-0.394
-0.199
-0.007
0.196
0.397
0.598
0.794
0.897
- Asymptotic theory? no...until Lee (2001a, 2001b)
- Finite sample? Monte Carlo results, Anselin (1980,
1982), Kelejian and Prucha (1999), Das (2000),
Das, Kelejian, and Prucha (2001), Gress (2003).
THEOREM. The QMLE 4
Л† in the
model has
Ві SAR(1)
Вґ
31
,
the second-order bias, up to O n
B (Л†
4) =
4B1B2 3 2B2tr (M1) 3 2B1tr (M2)
+
3
[2B2 3 tr (M2)]2
tr (M1) tr (M2) + 2tr (M1M2)
[2B2 3 tr (M2)]2
B3{4B12 3 4B1tr(M2) + [tr(M1)]2 + 2tr(M12)}
[2B2 3 tr (M2)]3
+ 21 2,
where
1 2 = {[2B2 3 tr (M2)] tr (M1 ВЇ M2) 3 B3tr (M1 ВЇ M1)}
Г· [2B2 3 tr (M2)]3 .
X MSE of MLE
X SAR(1)+X
X Spatial Autoregressive Error Model:
y = Xq + 0,
0 = 4W 0 + u,
Ві
Вґ
u ; IIDN 0, j 2I ,
X SAR(1)+X+Spatial Autoregressive Error
Л† ML and j
X Bias and MSE of q
Л† 2ML
Chapters 5 to 6:
II. VAR FORECAST
I. INTRODUCTION
Out-of-sample predictive ability of a model?
Traditionally, point forecast under MSE loss.
Point forecast is of decreasing relevance for risk management since it does not account take into many
other distribution aspects of what is forecasted!
i) Quantile / Interval Forecast: Value-at-Risk
(3", V aR(k)]
Consider a financial return series {rt}T
t=1, generated
by the probability law Pr(rt $ r|Ft31) Ft(r) conditional on the information set Ft31 (j-field) at time
t31
rt = Вµt + 0t = Вµt + j tzt,
where Вµt = E(rt|Ft31), j 2t = E(02t |Ft31), and {zt} {0t/j t} has the conditional distribution function Gt(z) Pr (zt $ z|Ft31).
The VaR with a given tail probability k M (0, 1), denoted by qt(k), is defined as the conditional quantile
Ft(qt(k)) = k,
which can be estimated by inverting the distribution
function:
ii) Density Forecast
All aspects of what is forecasted
qt (k) = Ft31(k) = Вµt + j tG31
t (k).
VaR forecast: qˆt (k) = Fˆt (k) or qˆt (k) = µ
Л† t+G31 (k) j
Л† t,
1. Parametric Distribution: G(В·) = x (В·) or t6
2. Historical Distribution: EDF
Whether filtered or not
Which distribution
Unfiltered Filtered
Parametric Distribution
Normal*
t(6)*
Historical Distribution
HS
HS*
Monte Carlo Distribution MC
MC*
NP Distribution
NP
NP*
EVT Distributions
GP
GP*
GEV
GEV*
HILL
HILL*
No Distribution
CaViaRS
CaViaRA
3. Monte Carlo Distribution:
Вµ
В¶
1
St = St31 exp [Вµt 3 j 2t ] + j tzt ,
2
rt 100 log (St/St31)
4. Nonparametrically Estimated Distribution: weighted
Nadaraya-Watson (NW) estimator
F (y|xt) =
n
P
i=1
piKh(xi 3 xt)1(Yi $ y)
n
P
i=1
piKh(xi 3 xt)
5. Extreme Value Distributions
(a) Generalized Extreme Value Distribution, based
on sample minima
(b) Generalized Pareto Distribution, based on exceedances over threshold
(c) Hill Estimator, based on ordered statistics
Loss functions:
• Predictive Likelihood for Quantile Forecasts
T
X
Л† P (k) = 1
Q
[k 3 dˆt(k)][yt 3 qˆt(k)],
P t=R+1
dˆt(k) 1 (yt < qˆt(k))
6. Conditional Autoregressive VaR
(a) Symmetric CaViaR (CaViaRS )
qt (k) = a0 + a1qt31 (k) + a2|rt31|,
(b) Asymmetric CaViaR (CaViaRA)
qt (k) = a0 + a1qt31 (k) + a2|rt31|
+ a3|rt31|1(rt31 < 0).
• Predictive Likelihood for Interval Forecasts
T
X
Вµ
Л†
Л†
Л†P (k) = 3 1
C
log pˆt(k)dt(k)[1 3 pˆt(k)][13dt(k)]
P t=R+1
В¶
III. DENSITY FORECAST
Aim: Propose a test for comparing various density
forecast models; hence assess which volatility and/or
distribution are statistically more appropriate to mimic
the time series
Extensive literature on evaluating density forecast models: e.g. Diebold et al. (1998), Diebold et al. (1999),
Clements and Smith (2000), Berkowitz (2001), Hong
(2002), etc.
Criteria: “distances” of these models to the true, unknown model
Compare alternative density forecast models? Why
important?
Minimum Kullback-Leibler Information Criterion (KLIC)
divergence measure to define the distance between the
candidate model and the true model
Recent evidence on volatility clustering, return asymmetry, and tail-fatness in financial time series =i so
many models arising from digerent specification of
volatilities and/or distributions. Which one to use?
It can be tailored for the tails
Problem: each model can be possibly misspecified and
we do not know the DGP
Note: the test is not designed for comparing density
models per se; it can be a test for comparing competing models (in the mean, volatility, etc.) in terms
of density forecast (e.g., Diebold et al., Clements and
Smith, Corradi and Swanson)
Multiple comparison based on the KLIC distance: reality check of White (2000)
E [ln )t (yt) 3 ln t (yt; W)] can be consistently estimated by
DGP:
Yt = Вµt + 0t Вµt + Ztj t,
Вµt = E(Yt|Ft31), j 2t = E(02t |Ft31), Zt 0t/j t
True density: )t(y) )t(y|Ft31)
T
1 X
Iˆ () : , W) =
[ln )t(yt) 3 ln t (yt; W)],
T t=1
Л†T that
where W can be consistently estimated by P
maximizes T1 T
t=1 ln t (yt; )
But we still do not know )t (В·) . Way out?
Density forecast model: t(y; ) t(y|Ft31; )
Define the minimum KLIC distance measure
I () : , W) = E [ln )t (yt) 3 ln t (yt; W)] ,
where W is the pseudo-true value of , the parameter
value that gives the minimum I () : , ) E[ln )t (yt)3
ln t (yt; )] for all M X (e.g., Sawa, 1978; White,
1982)
We utilize a inverse normal transform of the probability integral transform (PIT) of the actual realizations
of the process with respect to the models’s density
Л†T )]
forecast. The equivalence between ln[)t(yt)/t(yt; and the log likelihood ratio of the transformed PITs
enables us to consistently estimate I () : , W) and
hence to compare possibly misspecified models in terms
of their distance to the true model.
Ві
R yt
Л†T
Л† t(y)dy, where Л† t(y) = t y; PIT: ut = 3"
Inverse normal transform of PIT: xt = x31(ut)
Вґ
Remark: Checking IID U[0,1] of {ut} or IID N (0, 1)
of {xt} provides a powerful approach to evaluating
the quality of a density forecast model: Berkowitz,
Diebold et al., Hong, Duan, etc.
A loop? Do not know )t (В·), make use of the transformed PITs, but do not know pt (В·) either?
However, out aim is to compare density forecast models; for this, we utilize the following mapping:
pt (В·) should be able to accommodate heterogeneity,
dependency, and nonnormality, possibly existing in the
transformed PITs due to some misspecification of the
density forecast model
h
i
Л† t(yt) = ln [pt (xt) / (xt)] ,
ln )t(yt)/
where pt (В·) is the density of xt and (В·) is the standard normal density.
Therefore, the distance of a density forecast model to
the unknown true model can be equivalently estimated
by the departure of {xt}T
t=1 from IID N(0,1),
T
Ві
Вґ
1 X
Л†
Лњ
I ) : , T =
[ln pt (xt) 3 ln (xt)]
T t=1
However, measuring departure of the unknown pt (В·)
from IID N(0,1) is more straightforward than measuring departure of the postulated t (В·; ) from something unknown in the sense that we can at least specify
a flexible pt (В·) to include IID N(0,1) as a special case,
but we when we specify t (В·; ) there is no guarantee that the postulated t (В·; ) will accommodate the
complicated )t(В·), which is unknown at all a priori
We follow Berkowitz (2001) by specifying {xt}T
t=1 as
an AR(L) process
xt = 0Xt31 + j# t,
Related works:
but with IID # t admitting the SNP density of Gallant
and Nychka (1987)
ВіP
Вґ
K r # k 2 (# )
t
k=0 k t
p (# t; &# ) = R
,
ВіP
Вґ2
+"
K r uk (u) du
3"
k=0 k
where r0 = 1, &# = (r1, В· В· В· , rK )0 . Setting rk = 0,
k = 1, В· В· В· , K, p (# t) = (# t) .
Hence we estimate I () : , W) by
Ві
Вґ
h
Ві
Вґ
i
Л†T = 1 PT ln p xt; &
Л† T 3 ln (xt)
IВЇ ) : , t=1
T
5
P
7
= T1 T
t=1 ln
h
i
Л† #T
p (xt 3
Л†0T Xt31)/Л†
j T ;&
j
Л†T
Л† T = (
Л† 0#T )0 is the MLE.
where &
Л†0, j
Л†, &
Therefore, we can use the KLIC distance as a loss
function for a given density forecast model!
Testing IID N(0, 1) per se: Jarque and Bera (1980),
Pearson distribution; Hall (1990), SNP; Kiefer and
Salmon (1983), Smith (1989), Gram-Charlier/EdgeworthSargan.
Comparing density forecast models: Corradi and Swanson (2003a, 2003b), Kolmogorov-Smirnov type statistics: mean square error of the CDF and the EDF,
integrated integrated out.
Our KLIC-PIT approach answers the questions raised
in Corradi and Swanson (2003a, 2003b)
6
3 ln (xt)8 ,
1. Applicability of PIT approach: Yes
2. Applicability of the KLIC discrepancy measure over
some specific regions: Yes, next slide
IV. MODEL COMPARISON
Benchmark model: 0; competing models: k = 1, В· В· В· , l
Define the censored PIT
Define the loss digerential: fk,t = L0,t 3 Lk,t
xct =
(
x31 (k) c
xt
if xt D c
if xt < c.
and hence the censored likelihood
В·
Вµ
¶¸1(xtDc)
c3b03b01Xt31
c
c
; &#
p (xt ; &) = 1 3 P
j
В·
Вё
[(xt 3b03b01Xt31)/j ] 1(xt<c)
Г—
.
j
Accordingly, the minimum tail KLIC distance
Ві
Вґ
h
Ві
Вґ
i
Л†T = 1 PT ln pc xt; &
Л† T 3 ln c (xt)
IВЇc ) : , t=1
T
• Pairwise comparison: model k is no better than
the benchmark
H1 : E(fk,t) $ 0
Diebold and Mariano (1995), West (1996)
• Multiple comparison: can any one of the competing models beat the benchmark model?
H2 : max E(fk,t) $ 0
1$k$l
— In practice bootstrap the following statistics
to get the “reality check p-value”
VВЇn = max n1/2[fВЇk,n 3 E(fk,t)],
1$k$l
where E(fk,t) is set to be zero.
— Also see Hansen’s (2001) p-value that depends
on the variance of dВЇk,n.
V. EMPIRICAL FINDINGS
Compare VaR Models:
• Filtered models dominate most unfiltered models
• Most of the unfiltered models are dominated by
the Riskmetrics EWMA model while many of the
filtered models dominate the Riskmetrics EWMA
model
• The filtered EVT models generally produce the
best risk forecasts, especially for the 1% tail
• Among the filtered EVT models, HILL* and GP*
perform the best, especially for the 1% tail for
turmoil economies
• Filtered nonparametric models, HS* and NP*,
perform quite well
• The t(6)* model works better than the Normal*
model for the extreme 1% tail, while Normal* is
better than t(6)* for the 5% tail. However, both
t(6)* and Normal* are inferior to the EVT-based
filtered models at both k = 0.01 and k = 0.05
• Filtered EVT models mostly do better with k =
0.01 than with k = 0.05. Other models (EWMA,
Normal*, HS*, MC*, NP*) tend to perform better with k = 0.05 than with k = 0.01
• The asymmetric CaViaR model does better than
the symmetric one, particularly at k = 0.01
189
190
0.003
0.028
0.003
0.048
0.117
0.015
0.079
0.058
0.079
0.005
0.849
0.103
HS vs HS*
MC vs MC*
NP vs NP*
GEV vs GEV*
GPD vs GPD*
Hill vs Hill*
HS vs HS*
MC vs MC*
NP vs NP*
GEV vs GEV*
GPD vs GPD*
Hill vs Hill*
HS vs HS*
MC vs MC*
NP vs NP*
GEV vs GEV*
GPD vs GPD*
Hill vs Hill*
Qˆ P (0.05)
Qˆ P (0.01)
Cˆ P (0.05)
Cˆ P (0.01)
0.092
0.066
0.094
0.141
-0.046
0.022
0.247
0.225
0.248
0.165
0.165
0.175
0.203
0.184
0.203
0.314
0.001
0.186
HS
MC
NP
GEV
GPD
Hill
HS
MC
NP
GEV
GPD
Hill
HS
MC
NP
GEV
GPD
Hill
HS
MC
NP
GEV
GPD
Hill
Qˆ P (0.05)
Qˆ P (0.01)
Cˆ P (0.05)
Cˆ P (0.01)
0.178
0.046
0.179
0.237
-0.030
0.088
Benchmark
Loss Fn
f1
0.032
0.112
0.033
0.031
0.000
0.000
HS vs HS*
MC vs MC*
NP vs NP*
GEV vs GEV*
GPD vs GPD*
Hill vs Hill*
I
0.000
0.012
0.000
0.004
0.035
0.035
0.084
0.061
0.084
0.123
0.096
0.126
0.184
0.253
0.184
0.084
0.996
0.494
0.000
0.287
0.000
0.004
0.720
0.100
GW
0.008
0.001
0.008
0.000
0.508
0.007
0.003
0.003
0.003
0.028
0.090
0.001
0.017
0.002
0.017
0.002
0.200
0.076
0.000
0.002
0.000
0.000
0.075
0.058
I
0.015
0.000
0.015
0.008
0.149
0.004
0.012
0.019
0.012
0.027
0.042
0.004
0.046
0.031
0.046
0.035
0.510
0.100
0.107
0.019
0.107
0.046
0.073
0.065
Korea
0.000
0.014
0.005
0.001
0.558
0.508
0.002
0.000
0.002
0.006
0.155
0.005
0.110
0.018
0.113
0.054
0.199
0.427
0.002
0.017
0.002
0.000
0.290
0.414
GW
I
0.008
0.004
0.004
0.004
0.015
0.157
0.000
0.000
0.000
0.004
0.029
0.000
0.038
0.008
0.038
0.027
0.513
0.107
0.000
0.008
0.000
0.000
0.789
0.054
Malaysia
0.700
0.777
0.700
0.687
0.700
0.564
0.101
0.075
0.101
0.109
0.563
0.641
0.000
0.830
0.000
0.656
0.000
0.000
0.029
0.010
0.030
0.040
0.000
0.000
GW
0.008
0.017
0.008
0.000
0.064
0.019
0.001
0.001
0.001
0.014
0.026
0.015
0.027
0.059
0.027
0.012
1.000
0.185
0.000
0.120
0.000
0.000
0.756
0.010
White
Indonesia
0.008
0.017
0.008
0.000
0.064
0.019
0.001
0.001
0.001
0.014
0.026
0.015
0.027
0.059
0.027
0.012
0.503
0.185
0.000
0.120
0.000
0.000
0.756
0.010
Hansen
0.326
0.413
0.326
0.433
0.098
0.328
0.328
0.309
0.329
0.239
0.167
0.376
0.139
0.205
0.140
0.199
0.027
0.074
0.277
0.224
0.277
0.323
0.110
0.137
f1
0.006
0.000
0.006
0.000
0.137
0.000
0.000
0.002
0.000
0.003
0.044
0.000
0.003
0.001
0.003
0.000
0.138
0.020
0.000
0.001
0.000
0.000
0.022
0.009
White
Korea
0.006
0.000
0.006
0.000
0.137
0.000
0.000
0.002
0.000
0.003
0.044
0.000
0.003
0.001
0.003
0.000
0.138
0.020
0.000
0.001
0.000
0.000
0.022
0.009
Hansen
0.299
0.295
0.317
0.379
0.092
0.083
0.304
0.439
0.304
0.277
0.159
0.321
0.067
0.110
0.068
0.095
-0.003
0.029
0.168
0.131
0.168
0.252
-0.024
0.062
f1
0.000
0.000
0.000
0.000
0.051
0.059
0.000
0.000
0.000
0.000
0.029
0.000
0.042
0.005
0.037
0.011
0.503
0.130
0.001
0.003
0.001
0.000
0.799
0.068
White
Malaysia
Panel B. Reality Check
0.000
0.000
0.000
0.000
0.051
0.059
0.000
0.000
0.000
0.000
0.029
0.000
0.042
0.005
0.037
0.011
0.503
0.130
0.001
0.003
0.001
0.000
0.799
0.068
Hansen
-0.021
-0.020
-0.021
-0.008
-0.024
-0.028
-0.091
-0.096
-0.091
-0.052
-0.041
-0.046
0.008
0.001
0.008
0.004
0.007
0.012
0.017
0.010
0.017
-0.008
0.050
0.084
f1
I
0.950
0.843
0.946
0.839
0.958
0.889
0.996
0.996
0.996
0.923
0.989
0.954
0.169
0.456
0.169
0.107
0.195
0.157
0.153
0.199
0.149
0.678
0.100
0.035
Taiwan
0.868
0.867
0.868
0.616
0.870
0.888
0.986
0.990
0.986
0.978
0.944
0.954
0.092
0.449
0.086
0.211
0.029
0.000
0.066
0.140
0.066
0.819
0.000
0.000
White
Taiwan
Table 6: Unfiltered vs Filtered VaR Models (Pair-wise Comparison)
GW
0.005
0.284
0.005
0.000
0.000
0.153
Model
Loss Function
Indonesia
Panel A. GW Test
Table 6: Unfiltered vs Filtered VaR Models (Pair-wise Comparison)
0.481
0.513
0.481
0.616
0.480
0.450
0.516
0.515
0.516
0.539
0.530
0.537
0.092
0.449
0.086
0.211
0.029
0.000
0.066
0.140
0.066
0.819
0.000
0.000
Hansen
f1
I
0.054
0.117
0.054
0.097
0.001
0.022
0.208
0.202
0.208
0.280
-0.046
-0.053
0.005
0.032
0.005
0.014
-0.001
-0.007
0.034
0.003
0.034
0.015
0.352
0.086
0.000
0.003
0.000
0.000
0.843
0.928
0.289
0.100
0.279
0.214
0.492
0.652
0.091
0.274
0.090
0.003
0.954
0.961
White
Thailand
0.054
0.012
0.054
0.027
0.387
0.103
0.000
0.027
0.000
0.000
0.946
0.958
0.207
0.069
0.199
0.123
0.506
0.487
0.287
0.318
0.287
0.050
0.751
0.678
0.032
0.014
0.033
0.096
-0.031
-0.033
0.680
0.125
0.680
0.329
0.849
0.849
0.017
0.030
0.017
0.001
0.151
0.285
0.000
0.006
0.006
0.017
0.000
0.000
0.040
0.054
0.041
0.077
0.020
0.006
GW
Thailand
0.034
0.003
0.034
0.015
0.352
0.086
0.000
0.003
0.000
0.000
0.843
0.512
0.289
0.100
0.279
0.214
0.492
0.652
0.091
0.274
0.090
0.003
0.449
0.447
Hansen
191
192
0.386
0.574
0.419
0.575
0.666
0.361
0.468
0.141
0.225
0.203
0.226
0.270
0.109
0.150
0.372
0.700
0.560
0.700
0.742
0.349
0.605
0.254
0.387
0.384
0.387
0.460
0.048
0.225
Loss
0.386
0.371
0.409
0.396
0.373
0.396
0.429
0.391
0.380
0.141
0.135
0.157
0.132
0.137
0.132
0.129
0.154
0.128
Riskmetrics
HS
MC
NP
GEV
GPD
Hill
Riskmetrics
HS
MC
NP
GEV
GPD
Hill
Riskmetrics
HS
MC
NP
GEV
GPD
Hill
Riskmetrics
HS
MC
NP
GEV
GPD
Hill
Benchmark
Riskmetrics
Normal*
t(6)*
HS*
MC*
NP*
GEV*
GPD*
Hill*
Riskmetrics
Normal*
t(6)*
HS*
MC*
NP*
GEV*
GPD*
Hill*
Qˆ P (0.05)
Qˆ P (0.01)
Cˆ P (0.05)
Cˆ P (0.01)
Loss Fn
Qˆ P (0.05)
Qˆ P (0.01)
Loss
Benchmark
Loss Fn
0.488
0.706
0.194
0.799
0.628
0.792
0.941
0.237
0.949
0.634
1.000
0.242
0.359
0.966
0.355
0.146
0.468
0.836
White
Indonesia
0.010
0.000
0.001
0.000
0.000
0.997
0.032
0.643
0.000
0.005
0.000
0.000
0.920
0.003
0.374
0.028
0.042
0.027
0.010
0.942
0.213
0.470
0.000
0.150
0.000
0.000
0.983
0.006
White
0.005
0.000
0.001
0.000
0.000
0.602
0.030
0.323
0.000
0.003
0.000
0.000
0.677
0.003
0.120
0.028
0.042
0.027
0.010
0.596
0.104
0.297
0.000
0.057
0.000
0.000
0.543
0.006
Hansen
0.488
0.522
0.194
0.556
0.461
0.553
0.709
0.237
0.826
0.529
0.993
0.242
0.324
0.910
0.322
0.146
0.468
0.530
Hansen
Indonesia
Korea
0.848
0.004
0.000
0.004
0.001
0.652
0.010
0.999
0.000
0.001
0.000
0.000
0.011
0.009
0.900
0.002
0.000
0.002
0.001
0.425
0.025
0.985
0.000
0.001
0.000
0.000
0.017
0.012
White
0.695
0.004
0.000
0.004
0.001
0.305
0.010
0.531
0.000
0.001
0.000
0.000
0.011
0.009
0.523
0.002
0.000
0.002
0.001
0.130
0.016
0.504
0.000
0.001
0.000
0.000
0.016
0.012
Hansen
0.149
0.387
0.519
0.405
0.486
0.116
0.179
0.302
0.803
0.796
0.803
0.821
0.353
0.606
0.097
0.166
0.218
0.166
0.192
0.096
0.121
0.312
0.498
0.449
0.498
0.600
0.295
0.374
Loss
0.585
0.000
0.000
0.000
0.000
0.970
0.440
0.931
0.000
0.000
0.000
0.000
0.496
0.000
0.686
0.043
0.008
0.042
0.015
0.876
0.314
0.510
0.000
0.001
0.000
0.000
0.972
0.041
White
Malaysia
0.384
0.000
0.000
0.000
0.000
0.763
0.195
0.776
0.000
0.000
0.000
0.000
0.224
0.000
0.423
0.043
0.008
0.042
0.015
0.630
0.127
0.288
0.000
0.001
0.000
0.000
0.712
0.032
Hansen
0.103
0.112
0.105
0.104
0.111
0.104
0.105
0.101
0.098
0.342
0.350
0.359
0.359
0.348
0.359
0.367
0.345
0.333
Loss
Korea
0.432
0.158
0.326
0.355
0.162
0.354
0.300
0.649
0.961
0.457
0.241
0.138
0.128
0.317
0.126
0.090
0.430
0.842
White
0.432
0.158
0.293
0.322
0.162
0.322
0.296
0.424
0.961
0.418
0.241
0.138
0.128
0.293
0.126
0.090
0.363
0.832
Hansen
0.097
0.107
0.101
0.098
0.109
0.098
0.097
0.099
0.092
0.312
0.317
0.326
0.330
0.319
0.330
0.347
0.319
0.313
Loss
0.663
0.275
0.385
0.603
0.260
0.596
0.651
0.500
1.000
0.856
0.789
0.379
0.251
0.696
0.251
0.131
0.534
0.884
White
Malaysia
0.655
0.275
0.352
0.426
0.260
0.423
0.435
0.500
1.000
0.829
0.482
0.315
0.250
0.438
0.250
0.131
0.534
0.705
Hansen
Loss
0.064
0.062
0.059
0.058
0.061
0.058
0.058
0.057
0.058
0.205
0.200
0.203
0.199
0.199
0.199
0.201
0.202
0.220
Loss
0.078
0.018
0.041
0.018
0.030
0.017
0.000
0.165
0.057
0.055
0.057
0.108
0.053
0.016
0.064
0.066
0.061
0.066
0.062
0.064
0.069
0.205
0.217
0.209
0.216
0.193
0.252
0.304
Table 8: Reality Check, Filtered VaR Models
0.185
0.475
0.606
0.475
0.582
0.219
0.419
0.352
0.792
0.745
0.792
0.738
0.609
0.620
0.103
0.243
0.316
0.244
0.305
0.129
0.172
0.342
0.636
0.571
0.636
0.690
0.454
0.470
Loss
Table 7: Reality Check, Unfiltered VaR Models
Taiwan
0.269
0.334
0.696
0.941
0.486
0.938
0.877
0.987
0.620
0.360
0.893
0.456
0.918
0.996
0.919
0.644
0.724
0.094
White
Taiwan
0.018
0.370
0.082
0.370
0.217
0.383
0.919
0.000
0.144
0.169
0.144
0.006
0.225
0.985
0.494
0.487
0.847
0.487
0.893
0.615
0.326
0.373
0.127
0.264
0.127
1.000
0.000
0.000
White
0.269
0.334
0.696
0.941
0.486
0.938
0.877
0.987
0.620
0.360
0.798
0.392
0.872
0.996
0.878
0.424
0.447
0.094
Hansen
0.018
0.080
0.077
0.080
0.123
0.080
0.503
0.000
0.041
0.044
0.041
0.006
0.063
0.560
0.494
0.465
0.847
0.465
0.893
0.537
0.326
0.246
0.052
0.115
0.052
0.707
0.000
0.000
Hansen
0.072
0.072
0.069
0.072
0.070
0.072
0.072
0.085
0.082
0.269
0.275
0.283
0.275
0.271
0.275
0.279
0.280
0.289
Loss
0.066
0.088
0.199
0.088
0.132
0.022
0.041
0.220
0.505
0.475
0.505
0.590
0.129
0.100
0.072
0.077
0.102
0.078
0.086
0.084
0.076
0.269
0.307
0.285
0.307
0.375
0.249
0.256
Loss
0.462
0.458
0.998
0.573
0.759
0.607
0.621
0.023
0.033
0.853
0.578
0.254
0.504
0.831
0.506
0.328
0.321
0.185
White
Thailand
0.329
0.106
0.001
0.106
0.020
0.943
0.625
0.080
0.000
0.000
0.000
0.000
0.589
0.994
0.770
0.674
0.130
0.670
0.309
0.454
0.718
0.366
0.017
0.097
0.016
0.000
1.000
0.573
White
Thailand
0.354
0.398
0.940
0.338
0.711
0.363
0.411
0.023
0.033
0.817
0.503
0.254
0.418
0.782
0.420
0.328
0.321
0.185
Hansen
0.197
0.077
0.001
0.077
0.020
0.783
0.453
0.014
0.000
0.000
0.000
0.000
0.127
0.524
0.754
0.384
0.130
0.381
0.301
0.454
0.677
0.254
0.017
0.088
0.016
0.000
0.632
0.332
Hansen
193
194
Cˆ P (0.05)
0.254
0.314
0.260
0.372
0.477
0.598
Riskmetrics
CaViaRS
CaViaRA
Qˆ P (0.01)
Riskmetrics
CaViaRS
CaViaRA
0.141
0.191
0.167
Riskmetrics
CaViaRS
CaViaRA
Qˆ P (0.05)
Cˆ P (0.01)
Loss
0.386
0.464
0.544
Cˆ P (0.01)
Benchmark
0.254
0.181
0.201
0.184
0.200
0.184
0.146
0.046
0.039
Riskm’s
Normal*
t(6)*
HS*
MC*
NP*
GEV*
GPD*
Hill*
Cˆ P (0.05)
Riskmetrics
CaViaRS
CaViaRA
0.372
0.337
0.526
0.453
0.334
0.452
0.577
0.185
0.430
Riskmetrics
Normal*
t(6)*
HS*
MC*
NP*
GEV*
GPD*
Hill*
Loss Fn
Loss
Benchmark
Loss Fn
0.795
0.172
0.613
0.982
0.051
0.001
0.999
0.030
0.133
0.993
0.011
0.000
White
Indonesia
0.007
0.014
0.004
0.010
0.009
0.010
0.054
0.754
0.992
0.018
0.026
0.000
0.001
0.031
0.001
0.000
0.996
0.001
White
Indonesia
0.640
0.172
0.413
0.491
0.044
0.001
0.546
0.030
0.037
0.513
0.011
0.000
Hansen
0.007
0.014
0.004
0.010
0.009
0.010
0.019
0.101
0.496
0.018
0.013
0.000
0.001
0.015
0.001
0.000
0.540
0.001
Hansen
Korea
0.078
0.017
0.351
0.164
0.030
0.164
0.171
0.553
0.964
0.057
0.000
0.000
0.000
0.001
0.000
0.001
0.001
0.996
White
0.078
0.017
0.085
0.129
0.030
0.129
0.138
0.120
0.563
0.030
0.000
0.000
0.000
0.001
0.000
0.001
0.001
0.540
Hansen
0.149
0.211
0.178
0.089
0.224
0.089
0.107
0.024
0.096
0.302
0.359
0.422
0.499
0.357
0.499
0.544
0.194
0.285
Loss
0.018
0.003
0.005
0.180
0.002
0.180
0.087
0.984
0.151
0.108
0.003
0.001
0.000
0.004
0.000
0.000
0.998
0.155
White
Malaysia
0.016
0.003
0.005
0.054
0.002
0.054
0.032
0.525
0.054
0.034
0.003
0.001
0.000
0.004
0.000
0.000
0.628
0.027
Hansen
Loss
0.185
0.206
0.178
0.352
0.369
0.347
0.103
0.106
0.096
0.342
0.348
0.342
0.635
0.322
0.685
0.540
0.401
0.804
0.194
0.121
0.916
0.574
0.261
0.766
White
Korea
0.635
0.322
0.685
0.540
0.401
0.615
0.194
0.121
0.845
0.574
0.261
0.502
Hansen
Loss
0.149
0.130
0.088
0.302
0.499
0.485
0.097
0.094
0.086
0.312
0.324
0.322
0.113
0.213
0.921
0.995
0.005
0.006
0.103
0.171
0.927
0.713
0.263
0.303
White
Malaysia
0.113
0.213
0.573
0.534
0.005
0.006
0.103
0.171
0.585
0.713
0.263
0.303
Hansen
Table 9: Reality Check, CaViaR Models
0.185
0.214
0.133
0.149
0.193
0.149
0.149
0.120
0.091
0.352
0.456
0.463
0.463
0.436
0.463
0.500
0.443
0.244
Loss
0.078
0.063
0.064
0.165
0.148
0.148
0.064
0.060
0.058
0.205
0.198
0.198
Loss
0.078
0.060
0.047
0.039
0.061
0.039
0.038
0.041
0.028
0.165
0.155
0.167
0.148
0.151
0.148
0.160
0.094
0.062
Loss
Table 8 (Continued): Reality Check, Filtered VaR Models
Taiwan
0.129
0.972
0.520
0.134
0.803
0.743
0.152
0.457
0.897
0.078
0.527
0.968
White
Taiwan
0.064
0.099
0.300
0.578
0.096
0.584
0.632
0.532
0.903
0.006
0.014
0.006
0.018
0.017
0.018
0.012
0.214
0.970
White
0.129
0.610
0.226
0.134
0.615
0.522
0.152
0.457
0.549
0.078
0.112
0.508
Hansen
0.064
0.099
0.148
0.329
0.096
0.349
0.466
0.429
0.747
0.006
0.014
0.006
0.018
0.017
0.018
0.012
0.048
0.539
Hansen
0.066
0.034
0.052
0.220
0.330
0.316
0.072
0.074
0.075
0.269
0.275
0.282
Loss
0.066
0.131
0.067
0.034
0.082
0.034
0.035
0.020
0.018
0.220
0.300
0.337
0.297
0.273
0.297
0.310
0.175
0.153
Loss
0.227
0.927
0.296
0.983
0.014
0.036
0.693
0.373
0.359
0.676
0.376
0.204
White
Thailand
0.250
0.020
0.203
0.741
0.093
0.741
0.724
0.776
0.977
0.121
0.001
0.001
0.001
0.006
0.001
0.004
0.568
0.959
White
Thailand
0.227
0.816
0.296
0.560
0.014
0.036
0.693
0.373
0.359
0.676
0.364
0.204
Hansen
0.195
0.020
0.170
0.228
0.093
0.228
0.228
0.450
0.939
0.043
0.001
0.001
0.001
0.006
0.001
0.004
0.144
0.535
Hansen
Compare Density Forecast Models:
Volatility Specification: j 2t = j 2t (Ft31; v ) , GARCHfamily
Distribution Specification: ft (z) = ft (z|Ft31; d) ,
normal and nonnormal
EWMA: Riskmetrics
;
;
A
Student t
A
A
A
A
A
? GED
A
A
A
A
Symmetric
A
A
A
A
Double Exponential
A
A
A
A
=
A
A
Double Weibull
A
A
A
A
A
A
;
A
A
A
A
A
Skewed t
A
A
A
A
A
?
A
Hansen t
A
A
A
Nonnormal
A
A
A
? Skewed GED
A
A
A
A
Skewed
IHS
A
A
A
A
A
A
A
A
Mixture
A
A
A
A
A
A
A Double Gamma
A
A
A
A
A
A
A
=
A
A
Edgeworth
A
A
A
A
A
A
A
=
GARCH: symmetric
GJR: asymmetric
APARCH: asymmetric
EGARCH: asymmetric
HYGARCH: symmetric and long memory
HYAPARCH: asymmetric and long memory
Historical
CGARCH: symmetric and long memory
Table 10: Reality Check, S&P 500 Data (DIEBOLD)
• The choice of conditional distributions may be
more important than the choice of volatility
• A model that provides superior density forecasts
does not necessary meet the needs of risk managers who care much more about the tails
• Nonnormality and long memory in the second moments exist for both the S&P 500 and Nasdaq return series, but there are clear digerences between
the stochastic processes to generate the two series
• The Hansen t, skewed t, normal and historical
distributions generally appear to be the worst distributions
• In the tails, however, Skewed t systematically dominates other distributions and in every case it fares
better than the Hansen t
Panel A: Whole Distribution
EWMA
GARCH
GJR
APARCH
EGARCH
STGARCH
HYGARCH
HYAPARCH
CGARCH
HS
0.0142
0.889
0.888
0.0093
0.628
0.590
0.0827
0.217
0.217
0.0801
0.248
0.248
0.0767
0.278
0.278
0.0096
0.623
0.587
0.0093
0.628
0.590
0.0807
0.239
0.239
0.0090
0.652
0.612
NM
0.0146
0.805
0.784
0.0166
0.799
0.784
0.0234
0.766
0.760
0.0314
0.705
0.703
0.0251
0.750
0.746
0.0185
0.793
0.784
0.0166
0.799
0.784
0.0307
0.710
0.708
0.0136
0.805
0.783
St t
0.0163
0.791
0.783
0.0163
0.792
0.783
0.0212
0.765
0.764
0.0270
0.702
0.701
0.0221
0.756
0.755
0.0172
0.790
0.783
0.0163
0.792
0.783
0.0328
0.644
0.644
0.0154
0.792
0.783
GED
0.0389
0.595
0.595
0.0435
0.545
0.545
0.0540
0.545
0.545
0.1259
0.168
0.168
0.0584
0.545
0.545
0.0456
0.545
0.545
0.0435
0.545
0.545
0.1247
0.169
0.169
0.0153
0.792
0.783
LP
0.0259
0.694
0.694
0.0218
0.754
0.754
0.0263
0.685
0.685
0.0263
0.688
0.688
0.0283
0.651
0.651
0.0229
0.739
0.739
0.0206
0.768
0.768
0.0260
0.690
0.690
0.0214
0.758
0.758
DW
0.0113
0.817
0.787
0.0075
0.881
0.800
0.0144
0.801
0.783
0.0120
0.824
0.787
0.0127
0.813
0.783
0.0126
0.811
0.784
0.0039
0.971
0.872
0.0301
0.669
0.669
0.0038
0.974
0.881
Sk t
0.0289
0.647
0.647
0.0263
0.652
0.652
0.0186
0.779
0.779
0.0181
0.783
0.783
0.0164
0.785
0.783
0.0237
0.686
0.686
0.0263
0.652
0.652
0.0182
0.782
0.782
0.0300
0.646
0.646
Hn t
0.0393
0.636
0.636
0.1001
0.137
0.137
0.1441
0.094
0.094
0.1368
0.112
0.112
0.1371
0.110
0.110
0.1003
0.136
0.136
0.1516
0.065
0.065
0.1407
0.104
0.104
0.1015
0.135
0.135
SGED
0.0159
0.793
0.783
0.0431
0.545
0.545
0.0535
0.545
0.545
0.0659
0.542
0.542
0.0318
0.650
0.650
0.0468
0.545
0.545
0.0431
0.545
0.545
0.0650
0.543
0.543
0.0150
0.794
0.783
IHS
0.0160
0.791
0.783
0.0160
0.793
0.783
0.0211
0.765
0.764
0.0268
0.706
0.705
0.0218
0.759
0.758
0.0170
0.791
0.783
0.0160
0.793
0.783
0.0263
0.713
0.712
0.0152
0.792
0.783
MX
0.0137
0.792
0.785
0.0169
0.793
0.782
0.0233
0.756
0.755
0.0275
0.702
0.701
0.0118
0.811
0.785
0.0167
0.794
0.782
0.0169
0.793
0.782
0.0289
0.711
0.710
0.0150
0.795
0.783
DG
0.0014
1.000
0.994
0.0053
0.928
0.825
0.0019
0.998
0.941
0.0025
0.992
0.915
0.0037
0.965
0.864
0.0015
0.999
0.980
0.0016
0.998
0.953
0.0074
0.887
0.810
0.0016
0.998
0.960
SGN
0.0148
0.798
0.783
0.0158
0.798
0.783
0.0200
0.781
0.777
0.0240
0.744
0.740
0.0206
0.781
0.776
0.0164
0.797
0.783
0.0158
0.798
0.783
0.0236
0.749
0.745
0.0152
0.796
0.783
195
Table 10: Reality Check, S&P 500 Data (DIEBOLD)
Table 11: Reality Check, S&P 500 Data (SP)
Panel B: 5% Tail
Panel A: Whole Distribution
EWMA
GARCH
GJR
APARCH
EGARCH
STGARCH
HYGARCH
HYAPARCH
CGARCH
EWMA
GARCH
GJR
APARCH
EGARCH
STGARCH
HYGARCH
HYAPARCH
CGARCH
HS
0.3187
0.127
0.127
0.1624
0.236
0.236
0.0219
0.599
0.599
0.0203
0.599
0.599
0.0197
0.599
0.599
0.1651
0.170
0.170
0.1624
0.236
0.236
0.0200
0.599
0.599
0.1615
0.272
0.272
HS
0.0333
0.001
0.001
0.0096
0.298
0.098
0.0118
0.173
0.043
0.0130
0.124
0.034
0.0107
0.225
0.066
0.0054
0.686
0.279
0.0096
0.295
0.102
0.0136
0.111
0.033
0.0115
0.201
0.065
NM
0.0266
0.696
0.696
0.0266
0.680
0.680
0.0271
0.657
0.657
0.0331
0.648
0.648
0.0293
0.645
0.645
0.0286
0.670
0.670
0.0266
0.680
0.680
0.0328
0.649
0.649
0.0229
0.687
0.687
NM
0.0032
0.814
0.474
0.0046
0.580
0.332
0.0075
0.392
0.178
0.0056
0.524
0.268
0.0076
0.392
0.170
0.0084
0.355
0.174
0.0051
0.530
0.298
0.0052
0.551
0.301
0.0022
0.951
0.665
St t
0.0028
0.960
0.924
0.0038
0.919
0.873
0.0069
0.758
0.732
0.0094
0.704
0.689
0.0093
0.701
0.682
0.0040
0.909
0.867
0.0038
0.924
0.881
0.0115
0.609
0.609
0.0026
0.973
0.917
St t
0.0022
0.964
0.764
0.0029
0.897
0.618
0.0043
0.725
0.419
0.0030
0.906
0.662
0.0043
0.722
0.428
0.0063
0.449
0.182
0.0030
0.890
0.590
0.0028
0.918
0.657
0.0014
0.992
0.901
GED
0.1334
0.549
0.549
0.1359
0.545
0.545
0.1357
0.545
0.545
0.2825
0.196
0.196
0.1398
0.544
0.544
0.1359
0.545
0.545
0.1359
0.545
0.545
0.2816
0.197
0.197
0.0081
0.795
0.778
GED
0.0020
0.973
0.812
0.0027
0.909
0.642
0.0043
0.712
0.426
0.0029
0.895
0.658
0.0043
0.712
0.422
0.0059
0.494
0.224
0.0029
0.895
0.588
0.0027
0.916
0.632
0.0012
0.996
0.935
LP
0.0001
1.000
1.000
0.0010
0.998
0.934
0.0014
0.973
0.802
0.0015
0.972
0.796
0.0019
0.970
0.862
0.0007
1.000
0.977
0.0019
0.985
0.842
0.0015
0.970
0.792
0.0014
0.994
0.879
LP
0.0054
0.592
0.286
0.0018
0.978
0.836
0.0021
0.964
0.799
0.0006
0.998
0.961
0.0011
0.997
0.919
0.0052
0.610
0.300
0.0009
0.998
0.957
0.0006
0.998
0.969
0.0011
0.998
0.930
DW
0.0032
0.972
0.946
0.0035
0.958
0.922
0.0038
0.929
0.884
0.0060
0.834
0.799
0.0051
0.852
0.811
0.0036
0.959
0.925
0.0049
0.904
0.856
0.0062
0.807
0.762
0.0035
0.949
0.911
DW
0.0022
0.961
0.758
0.0043
0.753
0.424
0.0049
0.662
0.333
0.0053
0.625
0.304
0.0035
0.823
0.550
0.0059
0.517
0.233
0.0025
0.942
0.683
0.0022
0.969
0.765
0.0020
0.978
0.821
Sk t
0.0089
0.641
0.631
0.0080
0.660
0.644
0.0044
0.867
0.786
0.0044
0.892
0.838
0.0049
0.850
0.798
0.0073
0.686
0.668
0.0080
0.660
0.644
0.0048
0.867
0.807
0.0093
0.628
0.623
Sk t
0.0438
0.001
0.001
0.0581
0.000
0.000
0.0375
0.001
0.001
0.0394
0.001
0.001
0.0360
0.001
0.001
0.0405
0.001
0.001
0.0584
0.000
0.000
0.0396
0.001
0.001
0.0664
0.000
0.000
Hn t
0.0090
0.647
0.638
0.0261
0.599
0.599
0.0365
0.599
0.599
0.0359
0.599
0.599
0.0368
0.599
0.599
0.0260
0.599
0.599
0.0367
0.599
0.599
0.0366
0.599
0.599
0.0267
0.599
0.599
Hn t
0.0386
0.002
0.002
0.0447
0.000
0.000
0.1270
0.000
0.000
0.1303
0.000
0.000
0.1218
0.000
0.000
0.0446
0.000
0.000
0.1340
0.000
0.000
0.1274
0.000
0.000
0.0611
0.000
0.000
SGED
0.0065
0.866
0.846
0.1339
0.545
0.545
0.1320
0.545
0.545
0.1372
0.545
0.545
0.0075
0.739
0.714
0.1341
0.545
0.545
0.1339
0.545
0.545
0.1366
0.545
0.545
0.0071
0.831
0.793
SGED
0.0019
0.968
0.813
0.0025
0.924
0.698
0.0038
0.777
0.499
0.0026
0.920
0.650
0.0040
0.748
0.476
0.0057
0.517
0.236
0.0026
0.908
0.656
0.0024
0.944
0.697
0.0011
0.997
0.943
IHS
0.0018
0.995
0.952
0.0027
0.976
0.927
0.0050
0.851
0.812
0.0071
0.763
0.740
0.0065
0.778
0.748
0.0029
0.970
0.929
0.0027
0.976
0.927
0.0067
0.778
0.749
0.0020
0.993
0.931
IHS
0.0021
0.960
0.776
0.0026
0.934
0.705
0.0037
0.804
0.525
0.0025
0.941
0.711
0.0038
0.788
0.514
0.0060
0.485
0.210
0.0026
0.927
0.679
0.0024
0.949
0.738
0.0012
0.996
0.939
MX
0.0061
0.878
0.842
0.0154
0.728
0.728
0.0169
0.707
0.707
0.0120
0.688
0.687
0.0192
0.642
0.642
0.0161
0.726
0.726
0.0154
0.728
0.728
0.0191
0.697
0.697
0.0123
0.754
0.752
MX
0.0001
1.000
0.979
0.0067
0.428
0.188
0.0043
0.697
0.391
0.0031
0.861
0.612
0.0045
0.675
0.367
0.0130
0.228
0.040
0.0030
0.876
0.545
0.0030
0.881
0.622
0.0045
0.656
0.377
DG
0.0010
1.000
0.993
0.0024
0.966
0.844
0.0006
1.000
0.993
0.0016
0.992
0.930
0.0016
0.983
0.899
0.0010
0.998
0.981
0.0011
0.998
0.974
0.0023
0.957
0.835
0.0011
0.998
0.971
DG
0.0020
0.966
0.814
0.0019
0.977
0.821
0.0040
0.797
0.478
0.0037
0.827
0.532
0.0028
0.909
0.652
0.0047
0.720
0.416
0.0031
0.861
0.590
0.0029
0.893
0.612
0.0026
0.914
0.678
SGN
0.0018
0.989
0.831
0.0010
1.000
0.924
0.0018
0.968
0.816
0.0022
0.951
0.803
0.0026
0.926
0.784
0.0007
1.000
0.959
0.0010
1.000
0.924
0.0020
0.962
0.811
0.0015
0.994
0.862
SGN
0.0008
1.000
0.963
0.0007
0.999
0.951
0.0017
0.960
0.779
0.0008
0.999
0.953
0.0021
0.932
0.711
0.0027
0.868
0.611
0.0041
0.636
0.361
0.0052
0.558
0.303
0.0006
1.000
0.965
196
197
Table 11: Reality Check, S&P 500 Data (SP)
Table 12: Reality Check, Nasdaq Data
Panel B: 5% Tail
Panel A: Whole Distribution
EWMA
GARCH
GJR
APARCH
EGARCH
STGARCH
HYGARCH
HYAPARCH
CGARCH
EWMA
GARCH
GJR
APARCH
EGARCH
STGARCH
HYGARCH
HYAPARCH
CGARCH
HS
0.0162
0.169
0.169
0.0049
0.743
0.513
0.0071
0.541
0.428
0.0062
0.586
0.454
0.0050
0.720
0.502
0.0040
0.840
0.529
0.0047
0.769
0.521
0.0064
0.565
0.444
0.0056
0.649
0.468
HS
0.0055
0.980
0.588
0.0266
0.351
0.041
0.0265
0.342
0.021
0.0245
0.379
0.029
0.0202
0.443
0.026
0.0301
0.308
0.028
0.0234
0.387
0.044
0.0238
0.387
0.033
0.0177
0.511
0.097
NM
0.0181
0.124
0.120
0.0219
0.107
0.107
0.0169
0.151
0.146
0.0135
0.204
0.186
0.0143
0.189
0.175
0.0225
0.101
0.101
0.0231
0.099
0.099
0.0134
0.205
0.187
0.0199
0.119
0.119
NM
0.0066
0.952
0.474
0.0126
0.709
0.205
0.0200
0.473
0.067
0.0190
0.501
0.083
0.0185
0.521
0.100
0.0151
0.613
0.163
0.0131
0.692
0.193
0.0188
0.506
0.090
0.0065
0.961
0.462
St t
0.0038
0.898
0.718
0.0032
0.929
0.728
0.0028
0.956
0.778
0.0021
0.982
0.853
0.0022
0.976
0.838
0.0042
0.869
0.699
0.0035
0.920
0.732
0.0021
0.983
0.855
0.0031
0.946
0.753
St t
0.0064
0.966
0.417
0.0102
0.820
0.232
0.0158
0.594
0.085
0.0147
0.633
0.128
0.0137
0.677
0.145
0.0121
0.729
0.164
0.0101
0.822
0.232
0.0144
0.640
0.141
0.0068
0.955
0.382
GED
0.0046
0.855
0.681
0.0048
0.846
0.677
0.0039
0.890
0.699
0.0032
0.948
0.785
0.0031
0.951
0.764
0.0052
0.815
0.641
0.0056
0.767
0.597
0.0032
0.947
0.778
0.0052
0.793
0.624
GED
0.0118
0.720
0.255
0.0108
0.790
0.213
0.0165
0.568
0.085
0.0157
0.593
0.116
0.0149
0.628
0.141
0.0127
0.705
0.175
0.0109
0.788
0.218
0.0154
0.603
0.123
0.0066
0.959
0.400
LP
0.0039
0.885
0.680
0.0036
0.915
0.676
0.0025
0.968
0.757
0.0029
0.945
0.663
0.0029
0.951
0.656
0.0038
0.905
0.711
0.0034
0.914
0.695
0.0029
0.947
0.669
0.0033
0.925
0.693
LP
0.0121
0.726
0.138
0.0104
0.822
0.195
0.0133
0.679
0.107
0.0093
0.865
0.306
0.0087
0.893
0.262
0.0123
0.720
0.116
0.0073
0.941
0.355
0.0092
0.868
0.310
0.0077
0.928
0.349
DW
0.0041
0.888
0.701
0.0025
0.973
0.805
0.0020
0.982
0.884
0.0010
0.999
0.967
0.0018
0.988
0.903
0.0050
0.811
0.640
0.0039
0.895
0.720
0.0022
0.985
0.878
0.0036
0.928
0.770
DW
0.0149
0.592
0.147
0.0208
0.426
0.049
0.0246
0.334
0.015
0.0185
0.488
0.071
0.0113
0.764
0.196
0.0120
0.722
0.168
0.0098
0.839
0.227
0.0123
0.727
0.164
0.0051
0.988
0.554
Sk t
0.0140
0.217
0.217
0.0211
0.078
0.078
0.0169
0.151
0.151
0.0176
0.134
0.134
0.0174
0.139
0.139
0.0158
0.174
0.174
0.0208
0.083
0.083
0.0176
0.135
0.135
0.0246
0.042
0.042
Sk t
0.0234
0.389
0.032
0.0218
0.423
0.042
0.0154
0.596
0.154
0.0144
0.638
0.185
0.0137
0.661
0.208
0.0172
0.539
0.119
0.0227
0.400
0.036
0.0146
0.633
0.180
0.0240
0.373
0.029
Hn t
0.0183
0.129
0.126
0.0306
0.009
0.009
0.0401
0.000
0.000
0.0381
0.000
0.000
0.0371
0.000
0.000
0.0306
0.009
0.009
0.0396
0.000
0.000
0.0380
0.000
0.000
0.0326
0.005
0.005
Hn t
0.0784
0.047
0.000
0.4247
0.000
0.000
0.2229
0.000
0.000
0.7250
0.000
0.000
0.1234
0.002
0.000
0.0242
0.350
0.018
0.1322
0.000
0.000
0.1209
0.002
0.000
0.0437
0.187
0.000
SGED
0.0059
0.735
0.573
0.0049
0.827
0.648
0.0031
0.949
0.798
0.0034
0.938
0.808
0.0022
0.980
0.858
0.0058
0.742
0.583
0.0051
0.810
0.636
0.0033
0.939
0.816
0.0045
0.858
0.677
SGED
0.0096
0.831
0.341
0.0149
0.661
0.186
0.0118
0.797
0.253
0.0115
0.805
0.264
0.0128
0.704
0.172
0.0123
0.716
0.198
0.0093
0.850
0.271
0.0131
0.696
0.161
0.0059
0.972
0.457
IHS
0.0036
0.906
0.736
0.0036
0.920
0.706
0.0022
0.985
0.821
0.0020
0.989
0.869
0.0019
0.988
0.841
0.0032
0.939
0.738
0.0037
0.917
0.704
0.0023
0.981
0.820
0.0036
0.918
0.701
IHS
0.0107
0.783
0.264
0.0121
0.790
0.230
0.0098
0.865
0.285
0.0096
0.880
0.304
0.0089
0.908
0.324
0.0132
0.744
0.216
0.0127
0.762
0.217
0.0102
0.848
0.270
0.0063
0.969
0.414
MX
0.0045
0.834
0.584
0.0032
0.943
0.748
0.0023
0.972
0.791
0.0018
0.990
0.865
0.0017
0.988
0.873
0.0041
0.887
0.703
0.0036
0.925
0.722
0.0019
0.989
0.834
0.0040
0.901
0.711
MX
0.0033
1.000
0.810
0.0129
0.699
0.174
0.0139
0.654
0.137
0.0132
0.695
0.156
0.0118
0.743
0.191
0.0158
0.588
0.114
0.0084
0.892
0.325
0.0101
0.867
0.286
0.0099
0.828
0.248
DG
0.0021
0.978
0.880
0.0004
1.000
0.992
0.0001
1.000
0.986
0.0003
0.999
0.992
0.0002
1.000
0.955
0.0010
0.996
0.964
0.0015
0.988
0.873
0.0003
1.000
0.871
0.0008
0.997
0.945
DG
0.0036
0.996
0.712
0.0072
0.934
0.476
0.0129
0.715
0.192
0.0102
0.830
0.293
0.0026
1.000
0.824
0.0016
1.000
0.995
0.0021
1.000
0.870
0.0026
1.000
0.837
0.0075
0.916
0.422
SGN
0.0089
0.436
0.344
0.0155
0.137
0.136
0.0106
0.313
0.287
0.0080
0.497
0.373
0.0087
0.463
0.364
0.0135
0.196
0.186
0.0187
0.134
0.134
0.0131
0.212
0.195
0.0030
0.938
0.705
SGN
0.0103
0.821
0.268
0.0200
0.455
0.055
0.0152
0.624
0.157
0.0148
0.642
0.173
0.0067
0.955
0.438
0.0072
0.940
0.419
0.0052
0.978
0.539
0.0071
0.940
0.437
0.0034
0.997
0.781
198
199
Table 12: Reality Check, Nasdaq Data
Panel B: 5% Tail
EWMA
GARCH
GJR
APARCH
EGARCH
STGARCH
HYGARCH
HYAPARCH
CGARCH
HS
0.0111
0.321
0.237
0.0136
0.220
0.160
0.0137
0.212
0.156
0.0148
0.174
0.170
0.0169
0.119
0.116
0.0117
0.298
0.207
0.0120
0.289
0.200
0.0133
0.230
0.177
0.0064
0.678
0.494
NM
0.0060
0.592
0.515
0.0103
0.364
0.303
0.0148
0.237
0.231
0.0148
0.236
0.232
0.0160
0.207
0.201
0.0116
0.330
0.276
0.0108
0.351
0.294
0.0151
0.232
0.229
0.0059
0.629
0.527
St t
0.0008
1.000
1.000
0.0039
0.926
0.734
0.0061
0.760
0.613
0.0054
0.841
0.707
0.0050
0.874
0.729
0.0048
0.863
0.668
0.0041
0.907
0.729
0.0051
0.867
0.725
0.0018
0.994
0.968
GED
0.0026
0.988
0.879
0.0028
0.992
0.926
0.0058
0.783
0.573
0.0062
0.733
0.530
0.0067
0.649
0.478
0.0039
0.953
0.820
0.0029
0.987
0.914
0.0061
0.740
0.540
0.0009
1.000
1.000
LP
0.0034
0.896
0.650
0.0035
0.906
0.641
0.0030
0.967
0.781
0.0033
0.946
0.716
0.0031
0.963
0.752
0.0042
0.860
0.584
0.0029
0.951
0.694
0.0032
0.960
0.748
0.0033
0.911
0.637
DW
0.0037
0.948
0.780
0.0032
0.963
0.802
0.0011
0.998
0.990
0.0007
1.000
0.997
0.0038
0.940
0.714
0.0034
0.958
0.810
0.0028
0.984
0.865
0.0031
0.979
0.824
0.0016
0.997
0.981
Sk t
0.0222
0.028
0.028
0.0214
0.031
0.031
0.0154
0.130
0.098
0.0144
0.161
0.121
0.0121
0.253
0.197
0.0177
0.085
0.084
0.0230
0.026
0.026
0.0155
0.132
0.098
0.0231
0.015
0.015
Hn t
0.0310
0.008
0.008
0.0444
0.000
0.000
0.0423
0.000
0.000
0.0438
0.000
0.000
0.0395
0.000
0.000
0.0211
0.031
0.031
0.0410
0.000
0.000
0.0398
0.000
0.000
0.0227
0.017
0.017
SGED
0.0045
0.883
0.689
0.0006
1.000
1.000
0.0002
1.000
0.999
0.0003
1.000
0.997
0.0014
0.999
0.988
0.0010
1.000
0.993
0.0011
1.000
0.986
0.0005
1.000
0.998
0.0010
1.000
0.964
IHS
0.0054
0.829
0.632
0.0005
1.000
1.000
0.0005
1.000
0.999
0.0007
1.000
0.995
0.0009
1.000
0.986
0.0005
1.000
1.000
0.0007
1.000
1.000
0.0004
1.000
1.000
0.0025
0.984
0.783
MX
0.0035
0.917
0.645
0.0009
1.000
0.994
0.0003
1.000
1.000
0.0006
1.000
0.996
0.0012
1.000
0.996
0.0014
0.998
0.973
0.0013
0.997
0.967
0.0002
1.000
1.000
0.0008
1.000
0.990
DG
0.0017
0.995
0.907
0.0027
0.964
0.748
0.0034
0.939
0.704
0.0025
0.978
0.826
0.0018
0.995
0.954
0.0027
0.973
0.852
0.0022
0.984
0.890
0.0010
1.000
0.992
0.0037
0.852
0.578
SGN
0.0042
0.916
0.732
0.0014
0.998
0.985
0.0001
1.000
1.000
0.0001
1.000
1.000
0.0179
0.046
0.046
0.0235
0.004
0.004
0.0252
0.003
0.003
0.0155
0.094
0.055
0.0241
0.003
0.003
200
© Copyright 2026 Paperzz


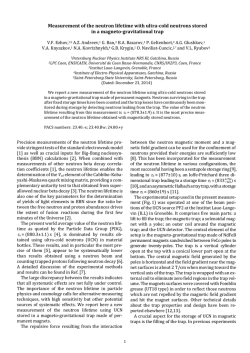


![arXiv:1501.03541v1 [hep-ex] 15 Jan 2015](http://s3.paperzz.com/store/data/003009444_1-fa955a5d4b7805fd4f2a5f6da7ace6a3-250x500.png)

![arXiv:1412.6954v1 [hep-ph] 22 Dec 2014 - High Energy Physics at](http://s3.paperzz.com/store/data/002830661_1-976540dbe0c0c6b1d2a531cda98cd646-250x500.png)