Cedex Analyzer Operator’s Manual
Software Version 2.3.2
For use in quality control/manufacturing processes only.
April 2014
Cedex Analyzer
Addendum 1 to Operator’s Guide, Version 3.0
Software Version 2.3.2 For use in quality control/manufacturing processes only.
April 2014
Section B: System Description
Chapter 6: Securing Access Rights
Information Regarding the
Cedex Analyzer Operator’s Guide
Please read the following information, which updates information given in the Cedex Analyzer
Operator’s Guide
Dear valued user of the Cedex Analyzer
This addendum includes:
c A
dditional information about password format requirements for the Windows 7 Operating System when
changing passwords or creating new users.
c Additional information about saving reports in electronic file format.
c Updated information about the procedure for removal, reinstallation or replacement of the syringe.
If you have any further questions regarding this matter, please do not hesitate to contact Roche Technical
Service at your convenience. To call, write, fax, or email us, visit the Custom Biotech home page,
www.custombiotech.roche.com
Section B: System Description
Chapter 6: Securing Access Rights
Please note that when creating a new user with a corresponding password at the Windows Operating System
level, or changing the password for an already created user, the following rules must be observed:
c Passwords must be at least 12 characters.
cPasswords must not contain the user’s account name or parts of the user’s full name that exceed two
consecutive characters.
c
Passwords must contain characters from three of the following four categories:
c English uppercase characters (A through Z).
c English lowercase characters (a through z).
c Base 10 digits (0 through 9).
c Non-alphabetic characters (for example, !, $, #, %).
To change the password settings and allow for other options, do the following
1
Log on to the Control Unit as the Win-Admin user.
2
Click the Start menu, type “secpol.msc”, without the quotes, in the Search area and press <Enter>. The
Local Security Policy dialog box opens.
3
Using the tree structure on the left-hand side of the Local Security Policy dialog box, navigate to
Security Settings -> Account Policies -> Password Policy.
4
Double-click on the settings in the right-hand pane to change the password policy as desired.
в– 2
Cedex Analyzer Operator’s Guide – Addendum 1 to Operator’s Guide, Version 3.0
Section D: Software
Chapter 6.1.1.: Printing Reports
Section D: Software
Chapter 6.1.1.: Printing Reports
Please note the following when using the Print Report function for printing out reports:
The Preview dialog box of a report provides the option for saving the preview as a .pdf file type, using the “Save”
icon at the top of the Preview dialog box. Choosing this option may result in a PDF report with an incorrect
layout.
To save the report in file format with a correct layout, Roche recommends the following:
1
In the preview window of a report, click the “Save as” icon at the top of the preview page and choose the file
format option “XPS File”.
2
The generated .xps file can be saved, printed out, and viewed on other compatible computers with a
Windows Operating System.
в– Section E: Maintenance and Care
Chapter 5: Syringe Maintenance
Follow the syringe maintenance procedure described on pages 148 – 149 to remove, reinstall or replace the
syringe of the Cedex System. After removal, reinstallation or replacement of the syringe, a calibration check
of the Cedex System must also be performed. Use Cedex Density Reference Standard Beads to check the
calibration and confirm that the FlowFactor is correct. If necessary, adjust the FlowFactor.
To perform the Cedex System calibration check and FlowFactor adjustment, follow the instructions described
in the online Instructions for Use for the Density Reference Standard Beads, available for download via the
Custom Biotech home page:
www.custombiotech.roche.com
Ordering Information
Product
Pack Size
Cat. No.
Density Reference Standard Beads
1Г— 10 ml Batch A
06 422 659 001
Density Reference Standard Beads
1Г— 10 ml Batch B
06 422 667 001
3
For use in quality control/manufacturing processes only.
CEDEX and INNOVATIS are trademarks of Roche.
All other product names and trademarks are
the property of their respective owners.
Published by Roche Diagnostics GmbH
Sandhofer StraГџe 116
68305 Mannheim
Germany
В© 2014 Roche Diagnostics.
All rights reserved.
www.custombiotech.roche.com
07291027001 1 042014
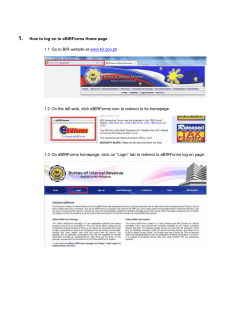
Performing a Single Measurement — (April 2014)
Start the Cedex Analyzer and Software
1
Switch on the Cedex Analyzer.
2
Switch on the monitor and PC.
3
Log in to the Windows Operating System.
4
Start the Cedex Software 2.3 by double clicking on the Cedex Client icon located on the
desktop (the Cedex Server should already be automatically started. It must be first started
before the Cedex Software 2.3 can be started). The Log In dialog box of the Cedex Software
2.3 will open.
5
Enter the username in the User Name field and password in the Password field and press
<Return>. The Cedex Control Center appears after a successful login.
в– 1
Click on the MEASURE button in the Cedex Control Center to open the Measurement
dialog box.
2
In the Measurement dialog box, enter a clearly defined Reactor ID to describe the
sample (e.g. the name of the cell culture or bioreactor name) in the Reactor ID area. You
may either choose a Reactor ID from the drop down list or enter a new Reactor ID.
3
Enter a clearly defined Sample ID in the Sample ID area. Multiple Sample IDs can be listed
under one Reactor ID. The Sample ID can be freely defined.
4
Choose the appropriate dilution factor from the Dilution drop-down list. For undiluted
samples, enter a dilution factor of 1:1. When a dilution of 1:2 is prepared, then 1 part cell
suspension has been added to 1 part dilution medium. A dilution of 1:3 means that 1 part
cell suspension has been added to 2 parts dilution medium. The dilution factor will be
automatically taken into account in the calculation of the results.
5
Select the sample volume of 1000 ВµL in the Volume drop-down menu.
6
Enter comments (if desired) in the Comment box.
7
Select the sample port type in the Sample Port drop-down list:
c
Auto Sampler: for systems with a Multi Sampler.
c
Single:
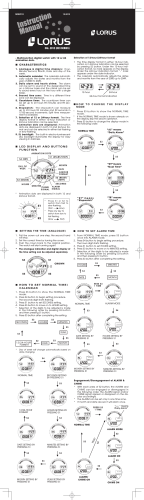
Perform a Hardware Startup and Prime
1
2
3
Click on the HWM button in the Cedex Control Center to open the Hardware Management
dialog box. If the Hardware Management has not been started, the current status field will
have the message “Not started”.
Click on HW Startup if the Hardware Management has not been started. The Hardware
Management will start and the current status field will have the message “HW started and
LM not primed”.
for systems with a single sample port.
8
Enter the cup position for the sample in the Cup Position dialog box if there is a Multi
Sampler.
9
Select the cell type that optimally recognizes your cells from the Cell Type drop-down list:
c
Factory-installed cell type is Std. Size (V5.00)
If a new cell type has been created, it can also be selected from the same Cell Type
drop-down list.
ccc
Ensure that a clean, empty Cedex Sample Cup is correctly positioned on the Multi Sample
Tray in the DefaultCup position (usually sample cup position 1) or on the single sample port
and click on Prime in the Hardware Management dialog box.
в– For use in quality control/manufacturing processes only.
1/2
Cedex Software 2.3.2 Quick Guide
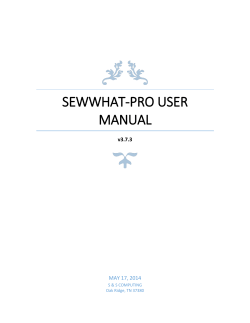
Perform a Measurement
Moving parts of the Multi Sampler may cause hand injuries. The Multi Sampler
needle may cause injuries during operation. Never use the Cedex Analyzer without the
protective cover in place for the Multi Sampler.
Performing a Single Measurement — (April 2014)
10
Select the desired precision level in the Precision drop-down list:
c
Minimum: 10 images are used for the analysis.
1
Open the Hardware Management dialog box (HWM button on the Cedex Control
Center).
c
Normal:
2
Click on LM Shutdown to shut down the Liquid Management system.
3
To log out of the Cedex Control Center, click on Logout under the System menu or on
the LOGOUT button in the Cedex Control Center. The Cedex Software will be ended and
theВ login dialog box will reappear.
4
Alternatively, shut down the Cedex Software by selecting Exit under the System menu or
byВ clicking on to close the Cedex Control Center dialog box.
5
The security query, “Do you really want to exit the Cedex Control Center?“, will appear. Click
on Yes to shut down the program.
6
The sample cup from the last measurement should remain attached to the sample port during
the entire shutdown procedure and should only be removed when a new sample cup has
been attached for the next measurement. In the case of a Multi Sampler, a sample cup
should always be left in the DefaultCup position on the Multi Sample Tray at all times
(see Quick Guide “Working with the Multi Sampler”).
20 images are used for the analysis.
c
Superior:
30 images are used for the analysis.
11
Prepare the sample. The Cedex Analyzer requires a volume of 1000 ВµL +/- 10%. Any greater
variation in sample volume will lead to inaccurate results.
12
Attach the Cedex Sample Cup containing the sample to the sample port, or place it in the
appropriate sample cup position on the Multi Sample Tray. The sample cup is correctly
attached to the single sample port when it is in an upright position directly beneath it and
the capillary tube almost reaches the base of the sample cup.
13
Click on the START MEASUREMENT button to start the measurement.
14
When the measurement is finished, the top section of the Result Data area in the
Measurement dialog box will display the overall results from the measurement.
The bottom section displays, in succession, the results from each image taken.
в– 07267100001 3 042014
в– Published by:
Roche Diagnostics GmbH
Sandhofer Strasse 16
68305 Mannheim
CEDEX is a trademark of Roche.
All other product names and trademarks are the property of their respective owners.
For use in quality control/manufacturing processes only.
2/2
Cedex Software 2.3.2 Quick Guide
Logging Out and/or Shutting Down
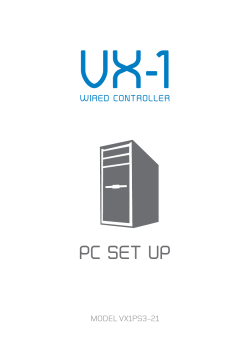
Working with the Multi Sampler — (April 2014)
The Multi Sampler DefaultCup
The position of the Cedex Sample Cup used for Prime, LM Shutdown, calibration and
cleaning routines is called the DefaultCup position. An empty Cedex Sample Cup must be
manually placed in the position set for the DefaultCup before running LM Shutdown, focus
adjustment, Prime and all cleaning routines. This Cedex Sample Cup does not differ from the
usual sample cups. The standard (default) position for the DefaultCup is position 1 of the
Multi Sample Tray.
Using the Multi Sample Tray
To insert the tray, gently push the tray into the notch until the automatic tray rope starts
pulling it in. To eject the tray, gently push on the tray. The tray will be automatically ejected.
The tray can only be ejected when the system is idle. It cannot be ejected if the system is
moving or the needle is down in a cup.
1
Click on the MULTI RUN button on the Cedex Control Center to open the Multi Run
dialog box.
2
Fill 1000 ВµL +/- 10% of the samples to be measured into individual Cedex Sample Cups
(maximum 20) and place them in the Multi Sample Tray according to the desired sequence.
Insert the tray into the Multi Sampler.
3
Click anywhere in the row of the Multi Run preparation area that corresponds to the
location of a cup containing a sample. The row will be converted to editВ mode, and the
sample and process parameters for the measurement can be defined.
4
Enter the sample data and parameter information as described in the section “Carry out a
Measurement” in the Quick Guide “Performing a Single Measurement ”.
5
Repeat steps 3 — 4 for the remaining samples to be measured.
6
Activate the status of each sample row by double clicking in the Status field of the row to
be activated. The row appears pale blue, and further modifications of sample information is
impossible. Return to the Edit status by double clicking on the Status area of the sample
row to allow for further changes, if desired.
7
Alternatively, activate or deactivate all samples simultaneously by double clicking on the
word Status in the column heading at the top of the Multi Run preparation area. Confirm
the safety query with YES to accept the modification.
8
After some or all rows have been activated, click on the START button on the right-hand side
of the Multi Run dialog box to start the analysis of the activated measurements.
в– For use in quality control/manufacturing processes only.
1/2
Cedex Software 2.3.2 Quick Guide
Carrying out a Measurement with the Multi Sampler
Moving parts of the Multi Sampler may cause hand injuries. The Multi Sampler
needle may cause injuries during operation. Never use the Cedex Analyzer without the
protective cover in place for the Multi Sampler.
Modifying Data Entry, Changing Samples
Viewing results via the Multi Run Result List
Information about the operation and process parameters for samples that have not yet been
analyzed can be modified during the run as follows:
At the bottom of the Multi Run dialog box, the Analyzed Measurements field displays the
list of results for measurements previously carried out. Measurements are listed in order of
process time, from the newest measurements at the top of the list to the oldest measurements at
the bottom. All measurements carried out using the Multi Run dialog box will be displayed in
this field unless the Clear Resultlist button has been pressed, which will clear all measurement
results from the list.
1
Double-click on the Status field of the measurement to be modified. The status field will
indicate that the sample is in edit mode.
2
Make desired changes to the measurement.
3
Double-click on the Status field to re-activate the measurement
(status: active or scheduled).
In addition, measurements displayed in this field can be restricted to only the measurements
carried out by the user logged into the system (mine), measurements that have not yet been
printed out (unprinted), and/or measurements carried out on that particular day (today).
в– Other results, such as Average Diameter, can be added for display in the result list via the User
Preferences (see “Adjusting Result Display in the Measurement List and Multi Run dialog boxes”
in the Cedex Operator’s Guide). Double-click on a measurement to view all results. If the
result list has been cleared, previously carried out measurements can still be viewed, printed
out and exported via the Measurement List dialog box (see “Using the Measurement List” in
the Cedex Operator’s Guide).
Adding Measurements to the List while Measurements are Running
07267126001 3 042014
Sample rows in which data has not yet been entered can be filled out at any time while the
Multi Run is running. In addition, sample rows containing finished measurements (status:
done) can be cleared and prepared for a new measurement by double-clicking in the Status
field of the row with the finished measurement. Sample data for a measurement cannot be
modified after that measurement has begun.
Published by:
Roche Diagnostics GmbH
Sandhofer Strasse 16
68305 Mannheim
Germany
CEDEX is a trademark of Roche.
All other product names and trademarks are the property of their respective owners.
For use in quality control/manufacturing processes only.
2/2
Cedex Software 2.3.2 Quick Guide
Working with the Multi Sampler — (April 2014)
Preparing and Maintaining the Analyzer — (April 2014)
Changing the Reagent Kit
Refilling Individual Containers
Proceed as follows to install or change the Reagent Kit:
In order to ensure the optimal functioning of the analyzer, the reagent containers must be
thoroughly cleaned before refilling with fresh reagents. Reagents can be refilled, or in the case
of waste emptied, individually.
1
If the Liquid Management system has been primed, click on the HWM button in the Cedex
Control Center to open the Hardware Management dialog box.
2
Attach a clean Cedex Sample Cup to the sample port or place a sample cup in the
DefaultCup position on the Multi Sample Tray, and click on LM Shutdown in the Hardware
Management dialog box to shut down the Liquid Management.
1
Shut down the liquid management via the Hardware Management dialog box as in step
1 — 2 of “Changing the Reagent Kit”, above.
2
Remove the reagent containers to be refilled, empty them and rinse thoroughly with distilled
water. Empty waste container, if necessary.
3
Add fresh reagents to the appropriate reagent bottles and place them back in their correct
positions on the Reagent Tray.
3
Remove the old Reagent Kit containers from the tray and dispose of the containers if necessary.
4
Place the new Reagent Kit containers in the appropriate positions on the Reagent Tray.
5
Insert the capillaries into the containers via the holes in the lids. Ensure that the capillary tubes
are not bent and almost reach the base of the containers.
4
Insert the capillaries into the containers via the holes in the lids. Ensure that the capillary tubes
are not bent and almost reach the base of the containers.
6
Select the Reagent Kit Status option in the Functions menu of the Cedex Control Center
to open the Reagent Kit Status dialog box.
5
Select the Reagent Kit Status option in the Functions menu of the Cedex Control Center
to open the Reagent Kit Status dialog box.
7
Click on the REPLACE ALL CONTAINERS button in right-hand corner of the Reagent Kit
Status dialog box to confirm the changing of the Reagent Kit. The Reagent Control
display at the bottom right-hand corner of the Cedex Control Center will turn from red to
green and indicate the number of runs left.
6
Confirm the refilling of each reagent container individually by clicking on the respective SET
FULL button (or EMPTY button in the case of waste) in the Reagent Kit Status dialog box.
8
в– Attach a clean Cedex Sample Cup to the sample port or place a sample cup in the
DefaultCup position on the Multi Sample Tray, and perform a Prime via the Hardware
Management dialog box (HWM button on the Cedex Control Center).
в– For use in quality control/manufacturing processes only.
1/2
Cedex Software 2.3.2 Quick Guide
Moving parts of the Multi Sampler may cause hand injuries. The Multi Sampler
needle may cause injuries during operation. Never use the Cedex Analyzer without the
protective cover in place for the Multi Sampler.
Preparing and Maintaining the Analyzer — (April 2014)
Cleaning the System
Interrupting a Measurement
Manual cleaning routines can be carried out in the Cleaning dialog box. To open the Cleaning
dialog box, click on the CLEAN button in the Shortcuts area of the Cedex Control Center or
select Cleaning routines in the Functions menu.
An orange EMERGENCY STOP button is located on the left-hand side of the Measurement
dialog box and can be activated during the measuring procedure to interrupt the analysis
process. If the EMERGENCY STOP is selected, an error message will appear asking, “Do you
want to cancel the process?”.
The following cleaning routines can be run manually:
cClick on YES to stop and abort the process immediately. If YES is selected, the EMERGENCY
c
Fast Clean:
Entire Liquid Management system is rinsed with detergent, and distilled
water for approx. 60 seconds.
c
Standard Clean:
Entire Liquid Management system is rinsed with disinfectant,
detergent, and distilled water for approx. 90 seconds.
cClick
on NO to put the process on hold until another action is chosen. If NO is selected,
the EMERGENCY STOP button will change to read Resume. Click on this button to
resume the measurement process.
c
Intensive Clean:
Entire Liquid Management system is rinsed with disinfectant,
detergent, and distilled water for approx. 20 minutes.
c
Chamber Clean 1:
Flow chamber is rinsed with water at high pressure for approx.
Only use the EMERGENCY STOP button in an emergency. Actual measurement data
may be lost.
10 seconds.
c
Chamber Clean 2:
07267134001 3 042014
Flow chamber is rinsed with water and detergent at high pressure
forВ approx. 30 seconds.
Published by:
Roche Diagnostics GmbH
Sandhofer Strasse 16
68305 Mannheim
Germany
CEDEX is a trademark of Roche.
All other product names and trademarks are the property of their respective owners.
For use in quality control/manufacturing processes only.
2/2
Cedex Software 2.3.2 Quick Guide
STOP button will change to read Unlock Queue. The system must be unlocked by clicking
on this button before more measurements can be run.
Cedex Analyzer Operator’s Guide
Software Version 2.3.2
For use in quality control/manufacturing processes only.
April 2014
Table of Contents
Prologue9
I.
Document Information................................................................................................................................................... 9
1
Revision History..................................................................................................................................................................... 9
2
Edition Notice......................................................................................................................................................................... 9
3Copyright.................................................................................................................................................................................. 9
4Trademarks.............................................................................................................................................................................. 9
II.
Contact Addresses.........................................................................................................................................................10
III.Warranty...............................................................................................................................................................................10
IV.
Intended Use......................................................................................................................................................................10
V.
Software Disclaimer......................................................................................................................................................10
VI.
Software License Agreement...................................................................................................................................11
VII.Preamble..............................................................................................................................................................................14
VIII.Contents of this Operator’s Guide.........................................................................................................................14
IX.
Conventions Used in this Guide..............................................................................................................................15
X.
Warnings and Precautions.........................................................................................................................................16
XI.
Disposal of the Analyzer.............................................................................................................................................18
AOverview
19
1
Description of the Cedex System...........................................................................................................................20
2
The Measurement Procedure...................................................................................................................................21
2.1
The Trypan Blue Exclusion Method..............................................................................................................................21
3
Data Analysis ...................................................................................................................................................................22
4
Technical Specifications of the Analyzer...........................................................................................................23
3
Table of Contents
B
System Description
1
Installing the Cedex System.....................................................................................................................................25
2
Choosing a Suitable Location..................................................................................................................................26
2.1
3
25
Connecting Hardware Components............................................................................................................................26
Connecting or Disconnecting the Device.........................................................................................................28
4Updating to Cedex Software 2.3.2 or Installing the Cedex Software 2.3.2....................................29
4.1Overview ...............................................................................................................................................................................29
4.1.1.
Overview: Updating from Cedex Software 1.x to Cedex Software 2.3.2.........................................................32
4.1.2.
Overview: Updating from Cedex Software 2.1.x or 2.2.x to Cedex Software 2.3.2......................................32
4.1.3.
Overview: Updating from Cedex Software 2.3.x to Cedex Software 2.3.2......................................................33
4.2
Create a Backup of the Cedex Software Version 2.3.x Database.....................................................................34
4.3
Update or Recover Windows Operating System to Windows 7........................................................................35
4.4
Install the Frame Grabber and Multi I/O Drivers....................................................................................................40
4.4.1.
Install the Frame Grabber and Multi I/O Drivers....................................................................................................40
4.4.2.
Check the Driver Installation..........................................................................................................................................43
4.5
Install Cedex Software Version 2.3.2............................................................................................................................44
4.5.1.
Initiate the Software Installation...................................................................................................................................44
4.5.2.
Install a New Database During Software Installation...........................................................................................46
4.5.3.
Update an Existing Database During Software Installation...............................................................................48
4.6
Set the Cedex Server to Autostart................................................................................................................................49
4.7
Start Cedex Software 2.3.2 for the First Time After Installation........................................................................50
5Starting the Cedex System........................................................................................................................................55
6
Securing Access Rights .............................................................................................................................................56
6.1
Access Control at the Windows Operating System Level....................................................................................56
6.2Access Control at the Cedex System Software Level............................................................................................56
4
Cedex Analyzer Operator’s Guide
Table of Contents
COperation
1
1.1
1.2
1.3
1.4
1.5
1.6
1.7
1.8
1.9
1.10
2
2.1
2.2
2.3
2.4
2.5
2.5.1.
2.5.2.
2.6
3
57
Overview of the Cedex Control Center................................................................................................................ 57
Menu Bar............................................................................................................................................................................... 57
System Menu........................................................................................................................................................................ 57
Measurement Menu..........................................................................................................................................................58
Functions Menu...................................................................................................................................................................58
Reports Menu .....................................................................................................................................................................59
Master Data Menu.............................................................................................................................................................59
Setup Menu..........................................................................................................................................................................59
Help Menu.............................................................................................................................................................................60
Shortcuts Area.....................................................................................................................................................................60
Tracking of Status of Events Carried Out by the Analyzer..................................................................................60
Preparing the Analyzer for Measurements.......................................................................................................61
Switching On........................................................................................................................................................................61
Logging In at the Computer Operating System Level...........................................................................................61
Starting the Cedex Software...........................................................................................................................................61
Performing a HW Startup and Prime...........................................................................................................................62
Preparing the Reagent Kit...............................................................................................................................................63
Installing or Changing the Reagent Kit .....................................................................................................................63
Refilling Containers Individually ..................................................................................................................................65
Checking the Analyzer......................................................................................................................................................66
Carrying Out a Single Measurement.................................................................................................................... 67
3.1Opening the Measurement Dialog Box and Specifying the Operating Mode and Sample Data.........68
3.2Defining the Measurement and Analysis (Process) Parameters......................................................................69
3.3Preparing the Sample and Attaching it to the Multi Sample Tray or Sample Port..................................... 70
3.3.1.
Starting the Measurement.............................................................................................................................................. 70
3.3.2.
End of Measurement.........................................................................................................................................................71
3.4
Interrupting a Measurement..........................................................................................................................................72
4
Working with the Multi Sampler.............................................................................................................................73
4.1
The Multi Sampler DefaultCup...................................................................................................................................... 74
4.2
Preparing the Measurement...........................................................................................................................................75
4.2.1.
Using the Multi Sample Tray...........................................................................................................................................75
4.2.2.
Ejecting the Multi Sample Tray......................................................................................................................................75
4.2.3.
Performing a Prime ...........................................................................................................................................................75
4.3
Carrying Out Measurements with the Multi Sampler...........................................................................................75
4.3.1.
The Multi Run Data Entry Dialog Box.........................................................................................................................75
4.3.2.
Preparing for Multiple Measurements in the Multi Run Dialog Box............................................................... 76
4.3.3.
Activating Sample Rows and Starting the Measurement................................................................................... 77
4.3.4.
Adding Measurements to the List While Measurements are Running.......................................................... 78
4.3.5.
Modifying Data Entry, Changing Samples ............................................................................................................... 79
4.3.6.
Non-Linear Measurements in a Sample Series ..................................................................................................... 79
4.3.7.
LOAD DATA FROM XML................................................................................................................................................. 79
4.4
Interrupting a Multi Run................................................................................................................................................... 79
4.5
Disruption of Measurements.......................................................................................................................................... 79
4.6Results....................................................................................................................................................................................80
4.6.1.
The Multi Run Result List................................................................................................................................................80
5
5.1
5.2
5.3
Switching Off the Cedex Analyzer ........................................................................................................................81
Carrying Out an LM Shutdown and HW Shutdown..............................................................................................81
Logging Out..........................................................................................................................................................................82
Shutting Down the Cedex Control Center.................................................................................................................82
5
Table of Contents
DSoftware
1
83
Using the Measurement Results Dialog Box...................................................................................................83
1.1
Result Data Area.................................................................................................................................................................84
1.2
Sample Parameters and Processing Parameters Areas.......................................................................................85
1.3
Image Area............................................................................................................................................................................86
1.3.1.
Viewing Individual Cell Images......................................................................................................................................86
1.3.2.
Viewing a Cell Image Using the Image View Dialog Box ................................................................................... 87
1.3.3.Excluding Images from the Evaluation Process/Including Excluded Images..............................................88
2
2.1
2.2
Using the Measurement List.....................................................................................................................................89
Viewing Existing Analysis Results................................................................................................................................90
Searching for Measurements.........................................................................................................................................90
3Editing Existing Analysis Results/Data Sets....................................................................................................91
3.1
3.2
4
4.1
4.2
4.3
4.3.1.
4.4
4.5
4.6
5
5.1
5.1.1.
5.1.2.
5.1.3.
5.1.4.
5.1.5.
5.1.6.
5.1.7.
5.2
5.2.1.
5.2.2.
5.2.3.
5.2.4.
5.2.5.
5.2.6.
6
The Reprocess Button.......................................................................................................................................................91
Effective Data Sets.............................................................................................................................................................92
Graphical Display of the Analysis Results........................................................................................................93
Enlarging the Histograms................................................................................................................................................93
Aggregate Histogram........................................................................................................................................................94
Cell Diameter Histogram..................................................................................................................................................96
Defining Diameter Intervals in the Diameter Histogram...................................................................................... 97
Object Diameter Histogram............................................................................................................................................ 97
Compactness Histogram..................................................................................................................................................98
Measurement Statistics Histogram..............................................................................................................................99
Cultivation Time Chart................................................................................................................................................100
Creating a CTC View........................................................................................................................................................100
The View Area................................................................................................................................................................... 101
The Series of Measurements Belonging to Selected View Area................................................................... 101
Adding Measurements to a View...............................................................................................................................102
Editing Measurements in a View................................................................................................................................103
Viewing List of Measurements in a Series..............................................................................................................103
Deleting Views and Series............................................................................................................................................ 104
Exporting a View.............................................................................................................................................................. 104
Creating a Cultivation Time Chart............................................................................................................................. 104
The Data Selection Area................................................................................................................................................105
Fitting to the Lowest Common Value....................................................................................................................... 106
Measurement Series Offset......................................................................................................................................... 106
Variable Axis Calibration................................................................................................................................................107
The Exponential Regression Button...........................................................................................................................107
Printing Out a Cultivation Time Chart.......................................................................................................................107
General Functions of the System........................................................................................................................ 108
6.1
Data Management.......................................................................................................................................................... 108
6.1.1.
Printing Reports................................................................................................................................................................ 108
6.1.2.
Export to File...................................................................................................................................................................... 109
6.2
Data Exchange...................................................................................................................................................................110
6.2.1.Export ...................................................................................................................................................................................110
6.2.2.Import....................................................................................................................................................................................112
6.3
Viewing and Evaluating the Audit Trail File.............................................................................................................113
6.4
User Preferences...............................................................................................................................................................114
6.4.1.Adjusting Result Display in the Measurement List and Multi Run Dialog Boxes....................................114
6.4.2.
Specifying Default Measurement Parameters.......................................................................................................115
6.4.3.
Specifying Other Default Parameters........................................................................................................................115
6.4.4.
Specifying the Workarea for the Analysis Data.....................................................................................................116
6.5
Changing Own Password..............................................................................................................................................116
6
Cedex Analyzer Operator’s Guide
Table of Contents
DSoftware
7
continued
Administrator Functions............................................................................................................................................117
7.1
Administration of User Accounts................................................................................................................................117
7.1.1.
Creating User Accounts ................................................................................................................................................117
7.1.2.
Assigning Access Rights...............................................................................................................................................118
7.1.3.
Creating User Groups......................................................................................................................................................119
7.1.4.
Editing and Deleting User Accounts.........................................................................................................................119
7.1.5.
Creating and Editing User Roles.................................................................................................................................120
7.2
Password Management..................................................................................................................................................121
7.2.1.
Specifying Password Characteristics.........................................................................................................................121
7.2.2.
Assigning New Passwords............................................................................................................................................121
7.3
Assigning Work Areas.....................................................................................................................................................122
7.4
The System Options.........................................................................................................................................................123
7.4.1.
Automatically Start the Hardware Management..................................................................................................123
7.4.2.
Modifying the Standard Setting for the Multi Sampler DefaultCup..............................................................123
7.4.3.
Turning Off Automatic Incrementation of Sample Cup Position.....................................................................124
7.4.4.
Error Level Displayed to Users.....................................................................................................................................124
7.4.5.
Liquid Container Configuration...................................................................................................................................124
7.4.6.
Disabling the Reagent Control....................................................................................................................................125
7.4.7.
Default Settings.................................................................................................................................................................125
7.5Adjustment of the Image Analysis Using the Live Operator............................................................................125
7.5.1.
Description of the Cell Type List and Live Operator............................................................................................125
7.5.2.
The Cell Type List Dialog Box.......................................................................................................................................126
7.5.3.
Creating a New Cell Type..............................................................................................................................................127
7.5.4.
Editing an Existing Cell Type.........................................................................................................................................128
7.5.5.
Viewing an Existing Cell Type.......................................................................................................................................128
7.5.6.
Deleting an Existing Cell Type......................................................................................................................................129
7.5.7.
Working with the Live Operator..................................................................................................................................129
7.5.8.
Description of the Individual Operator Parameters............................................................................................ 131
7.6
Archiving Data ..................................................................................................................................................................133
7.6.1.Archive..................................................................................................................................................................................133
7.6.2.Restore..................................................................................................................................................................................135
7.6.3.
Deleting Archived Data................................................................................................................................................. 136
7.6.4.
Reducing the Size of the Database After Archiving Data ................................................................................137
7.7
Backing up the Database............................................................................................................................................. 138
7.7.1.
Basic Backup of the Database................................................................................................................................... 138
7.7.2.
Incremental Backup of the Database...................................................................................................................... 138
7
Table of Contents
E
Maintenance and Care
139
1
Cleaning and Maintenance Checklist.............................................................................................................. 140
2
Scheduling Automatic Cleaning Routines..................................................................................................... 141
3
Daily and Manual Maintenance and Cleaning Routines........................................................................... 142
3.1Checking the Reagent Containers When Manually Refilling ................................................................................142
3.2Cleaning Routines Carried Out by the Liquid Management............................................................................142
3.2.1.
Cleaning Options..............................................................................................................................................................143
3.2.2.
The Hardware Management Dialog Box................................................................................................................. 144
3.2.3.
Carrying Out a Cleaning Routine............................................................................................................................... 144
3.2.4.
Interrupting/Terminating a Cleaning Routine.........................................................................................................145
3.3Live View of the Flow Chamber...................................................................................................................................145
4
Automatic Adjustment.............................................................................................................................................. 146
5Syringe Maintenance................................................................................................................................................. 148
5.1
5.2
5.3
Removing the Syringe.................................................................................................................................................... 148
Assembling and Installing the Syringe.................................................................................................................... 149
Maintenance of the Syringe Guide and Spindle.................................................................................................. 150
6Maintenance of the Flow chamber, Microscope Optic, 8-Way Valve and the remaining
Hardware Components............................................................................................................................................... 151
7
Operational Data.......................................................................................................................................................... 151
8
The System Suitability Test (SST) .......................................................................................................................152
8.1
8.1.1.
8.1.2.
8.1.3.
8.2
8.2.1.
8.2.2.
8.3
8.3.1.
8.3.2.
8.4
Creating SST Checkpoints............................................................................................................................................152
Creating SST Checkpoints with and without Measurements..........................................................................153
Running a Water Blank ................................................................................................................................................ 154
Setting up the SSTFailureReaction in the System Options Menu................................................................. 154
Performing an SST............................................................................................................................................................155
Performing an SST with Measurements..................................................................................................................155
Performing an SST without Measurements........................................................................................................... 156
Tracking Trends in SST Results Over Time............................................................................................................. 156
Tracking Trends in SST Checkpoints with Measurements............................................................................... 156
Tracking SST Checkpoints without Measurements............................................................................................ 158
Locking – Unlocking the System................................................................................................................................ 159
FTroubleshooting
1
Diagnosis of the Cedex Analyzer........................................................................................................................ 161
2
Trace and Logging........................................................................................................................................................ 162
3
The System Audit Trail File...................................................................................................................................... 162
GAppendix
1
8
161
163
System Options and User Preferences............................................................................................................ 163
Cedex Analyzer Operator’s Guide
Document Information
Prologue
I.
Document Information
1
Revision History
Version
Software Version
Revision Date
Changes
1.0
V 2.2
May 2011
First Edition
2.0
V 2.3
August 2013
Complete revision due to Software update.
3.0
V 2.3.2
April 2014
Updated Intended Use
Update of Section B, installation, based on
new SW version 2.3.2
Updated information about Windows
Operating System to Win7 for SW version
2.3.2
2
Edition Notice
The Cedex Analyzer Operator’s Guide is for users of the Cedex Analyzer (running Software Version 2.3.2).
3Copyright
CopyrightВ© 2014, Roche Diagnostics GmbH, all rights reserved.
Information in this document is subject to change without notice. No part of this document may be reproduced
or transmitted in any form or by any means, electronic or mechanical, for any purpose, without the express
written permission of Roche Diagnostics GmbH.
Questions or comments regarding the contents of this Operator’s Guide can be directed to your local Roche
Diagnostics representative.
Every effort has been made to ensure that all the information contained in the Cedex Analyzer Operator’s Guide
is correct at the time of printing.
However, Roche Diagnostics GmbH reserves the right to make any changes necessary without notice as part of
ongoing product development.
4Trademarks
CEDEX and INNOVATIS are trademarks of Roche.
All other product names and trademarks are the property of their respective owners.
Prologue
9
Contact Addresses
II.
Contact Addresses
Manufacturer
Roche Diagnostics GmbH
Sandhofer StraГџe 116
68305 Mannheim
Germany
Distribution
Roche Diagnostics GmbH
Sandhofer StraГџe 116
68305 Mannheim
Germany
Distribution in USA
Roche Diagnostics
9115 Hague Road
Indianapolis, Indiana
USA
III.Warranty
The warranty conditions are specified in the sales contract. Contact your Roche Diagnostics representative for
further information.
Any unauthorized modification of the Cedex Analyzer and/or the Cedex Software will result in invalidity of the
guarantee and service contract.
IV.
Intended Use
The Cedex Analyzer automatically determines the cell concentration and viability of cell suspensions. It must
be used exclusively by laboratory professionals who are trained in laboratory techniques and have studied the
Instructions for Use of this system.
The Cedex Analyzer is for use in quality control/manufacturing processes only.
It was neither developed nor validated by the manufacturer for any kind of in vitro diagnostic application.
V.
Software Disclaimer
Portions of the CEDEX SOFTWARE might include one or more Open Source or Commercial Software programs.
For copyright and other notices and licensing information regarding such Software programs included with
CEDEX SOFTWARE please see the CD/ DVD provided with the product.
10
Cedex Analyzer Operator’s Guide
Software License Agreement
VI.
Software License Agreement
Read the following terms and conditions of this Software License Agreement (“Agreement”) carefully before
installing the Cedex 2 Software, hereinafter referred to as (“Software”). Proceeding with the installation of the
Software will constitute acceptance of the terms and conditions of this Agreement. By accepting the terms and
conditions of this Agreement, the end user (“Licensee”) assumes all responsibility and liability for the selection
of this Software to achieve the intended results, and for its installation and subsequent use. If Licensee is not
willing to be bound by the terms and conditions of this Agreement, the Software package must be promptly
returned to Roche (“Supplier”) with a copy of the receipt against refunding of the purchase price for this
Software.
1. Program License Agreement
Licensee assumes all responsibility and liability for the selection of this Software to achieve the intended results,
and for its installation and subsequent use. The Software is protected by copyright.
2. Grant of Software License
Supplier is entitled to grant to Licensee subject to continuous compliance with all the provisions hereinafter, a
non-exclusive, single use license to use the Software upon the terms and conditions contained in this Agreement.
Licensee may:
a.Use the Software on workstations which have to be owned, leased or otherwise controlled by Licensee,
whether in a network or other configuration.
b.Transfer the Software by assigning the rights under this Agreement to another party, provided that the other
party agrees in writing to accept the terms and conditions of this Agreement. In addition, Licensee must
ensure that the copyright notice is maintained on the Software transferred.
Licensee may not:
a. Use the Software, in whole or in part, except as expressly provided in this Agreement.
b. Use the Software on more than one workstation at a time.
c.Copy, sell, or otherwise transfer the Software or assign its rights under this Agreement, in whole or in part,
to another party, except as expressly provided in this Agreement.
d. Rent, distribute, license or sublicense the Software.
e. Create derivative works based on Software.
f. Modify, adapt, translate, reverse engineer, decompile or disassemble the Software.
Supplier reserves all rights not expressly granted herein, including, but not limited to, the rights to market the
Software either directly, or through affiliates, distributors and/or third parties.
For further information, please contact your local Roche Applied Science support organization. You will find
the contact information on the following webpage:
www.roche-applied-science.com.
3. Limited Warranty
The Software is provided “as is” without warranty of any kind, either expressed or implied, including, but not
limited to the implied warranties of merchantability and fitness for a particular purpose. The entire risk as to
the quality and performance of the Software is with Licensee, should the Software prove to be defective. Licensee
assumes the entire costs of all necessary servicing, repair, or correction. However, Supplier warrants that the
program media on which the Software is furnished is free from defects in materials and workmanship under
normal use for a period of ninety (90) days from the date of delivery as evidenced by a copy of your receipt.
SUPPLIER MAKES NO FURTHER WARRANTIES OR GUARANTEES NOR EXPLICIT NOR IMPLIED
Prologue
11
Software License Agreement
4. Disclaimer of Warranties
AS FAR AS PERMITTED UNDER THE GOVERNING LAW AS SET FORTH UNDER SECTION 11 OF THIS
AGREEMENT THE WARRANTY SET FORTH IN THE PREVIOUS PARAGRAPH, IS IN LIEU OF ALL
OTHER WARRANTIES, EXPRESS OR IMPLIED, ARISING BY LAW, FROM A COURSE OF PERFORMANCE,
A COURSE OF DEALING, TRADE USAGE, OR OTHERWISE. AS FAR AS PERMITTED UNDER THE
GOVERNING LAW AS SET FORTH UNDER SECTION 11 OF THIS AGREEMENT SUPPLIER AND ANY
ENTITY CONTROLLING, CONTROLLED BY OR UNDER COMMON CONTROL WITH SUPPLIER
(“SUPPLIER’S AFFILIATE”) SPECIFICALLY DISCLAIM, WITHOUT LIMITATION, ALL WARRANTIES
OF ANY KIND, WHETHER EXPRESS OR IMPLIED, INCLUDING, WITHOUT LIMITATION, THE
IMPLIED WARRANTIES OF MERCHANTABILITY, FITNESS FOR A PARTICULAR PURPOSE, AND
NON INFRINGEMENT. SUPPLIER AND SUPPLIER’S AFFILIATES MAKE NO REPRESENTATION OR
WARRANTY AS TO THE SOFTWARE OR AS TO THE RESULTS TO BE ATTAINED BY LICENSEE OR ANY
THIRD PARTY FROM THE SOFTWARE. LICENSEE ACKNOWLEDGES THAT IT HAS NOT RELIED UPON
ANY REPRESENTATIONS OR WARRANTIES MADE BY SUPPLIER OR A SUPPLIER’S AFFILIATE EXCEPT
FOR THOSE EXPRESSLY AND SPECIFICALLY SET FORTH IN THIS AGREEMENT.
5. Limitations of Remedies
Supplier’s sole liability and Licensee’s sole remedy shall be:
a.The replacement of the program media not meeting Supplier’s limited warranty and which is returned to
Supplier with a copy of Licensee’s receipt;
b.If Supplier is unable to deliver replacement of program media which is free of defects in material and
workmanship, Licensee may terminate this Agreement by returning the Software and a copy of Licensee’s
receipt to Supplier, and Licensee’s money will be refunded.
IN NO EVENT WILL SUPPLIER OR ANY OF SUPPLIER’S AFFILIATES (OR THEIR RESPECTIVE OFFICERS,
EMPLOYEES, CONSULTANTS, ATTORNEYS OR AGENTS), BE LIABLE FOR ANY SPECIAL, INDIRECT,
INCIDENTAL, OR CONSEQUENTIAL DAMAGES (INCLUDING, BUT NOT LIMITED TO, LOST PROFITS,
LOST DATA OR INFORMATION, LOSS OF USE OF THE SOFTWARE, BUSINESS INTERRUPTION, LOSS
OF BUSINESS REPUTATION OR GOODWILL, OR DOWNTIME COSTS) WHICH THE LICENSEE OR
THIRD PARTIES MAY INCUR OR EXPERIENCE, DIRECTLY OR INDIRECTLY ARISING OUT OF OR
RELATING TO THE SOFTWARE, THIS AGREEMENT, OR THE TERMINATION OF THIS AGREEMENT,
EVEN IF SUPPLIER OR A SUPPLIER’S AFFILIATE HAS BEEN ADVISED OF THE POSSIBILITY OF SUCH
DAMAGES AND NOTWITHSTANDING ANY FAILURE OF ESSENTIAL PURPOSE. THE AGGREGATE
LIABILITY, ON A COMBINED BASIS, OF SUPPLIER AND SUPPLIER’S AFFILIATES (AND THEIR
RESPECTIVE OFFICERS, EMPLOYEES CONSULTANTS, ATTORNEYS, AND AGENTS) FOR DAMAGES
FOR ANY CAUSE WHATSOEVER DIRECTLY OR INDIRECTLY RELATING TO OR ARISING OUT OF
THIS AGREEMENT OR THE SOFTWARE, AND REGARDLESS OF THE FORM OF ACTION, SHALL BE
LIMITED TO, AT SUPPLIER’S OPTION, REPLACEMENT OF THE SOFTWARE OR REFUND OF THE
FEES RECEIVED BY SUPPLIER OR A SUPPLIER’S AFFILIATE FROM LICENSEE WITH RESPECT TO THE
SOFTWARE.
6. General Information
Licensee may not sublicense, assign or transfer the license or the Software, in whole or in part, except as expressly
provided in this Agreement. Any attempt otherwise to sublicense, assign or transfer any of the rights, duties or
obligations hereunder is void.
12
Cedex Analyzer Operator’s Guide
Software License Agreement
7. Intellectual Property Rights
Licensee shall only hold those rights to the Software that are expressly described in Section 2 of this Agreement.
Any other rights with regard to the Software, including without limitation, ownership rights and patent,
copyright, trademark, trade secret and other intellectual property rights, shall remain the sole property
of Supplier. Licensee will not remove from the Software any references to copyrights, trademarks or other
ownership rights, or cover up or alter any such references. Licensee will take all reasonable steps to prevent any
unauthorized use, reproduction, sale, or publication of the Software or the unauthorized provision of access
thereto. Licensee will indemnify and hold harmless Supplier from any losses, damages, claims and expenses
(including, without limitation, reasonable legal expenses) relating to any infringement of the rights of Supplier
caused by Licensee, Licensee’s breach of this Agreement or Licensee’s use of the Software in a manner not
authorized under this Agreement.
8. Duration and Termination
The Agreement is effective until terminated. Licensee may terminate this Agreement at any time by destroying the
Software and documentation relating to the Software in any form. The Agreement will terminate automatically
and without notice from Supplier, if Licensee fails to comply with any term or condition of this Agreement.
Licensee agrees to destroy the Software upon termination of this Agreement by Supplier. On any termination of
this Agreement, all rights of use of the Software held by Licensee shall expire.
9. Import, Export and Use of the Software
Licensee shall be exclusively responsible for ensuring compliance with the relevant legislation relating to its
rights to import, export or use the Software.
10. Miscellaneous
Should any part of this Agreement be declared void or unenforceable by a court of competent jurisdiction, the
remaining terms shall remain in full force and effect.
Failure of Supplier to enforce any of its rights in this Agreement shall not be considered a waiver of its rights,
including but not limited to its rights to respond to subsequent breaches.
By opening and using this Software Licensee acknowledges that he has read this Agreement, understands it,
and agrees to be bound by its terms and conditions. Licensee further agrees that this Agreement is the complete
and exclusive statement of the Agreement between Licensee and Supplier and supersedes any proposal or prior
agreement, oral or written, any other communications between Licensee and Supplier relating to the subject
matter of this Agreement.
The headings of the several Sections of this Agreement are intended for convenience of reference only and are
not intended to be a part of or to affect the meaning or interpretation of this Agreement.
11. Governing Law and Place of Jurisdiction
This Agreement shall be governed by and construed in accordance with the laws of Germany, without giving
effect to any choice of law principles thereof. The parties agree that the United Nations Convention on Contracts
for the International Sale of Goods (1980) is specifically excluded from application to this Agreement.
The parties agree that courts of Mannheim, Germany, shall have exclusive jurisdiction over any dispute arising
out of or in connection with this Agreement.
Prologue
13
Preamble
VII.Preamble
Before setting up operation of the Cedex Analyzer, it is important to read this Operator’s Guide thoroughly and
completely. Non-observance of the instructions contained herein or performing an operation not stated in this
Operator’s Guide could involve safety hazards.
VIII.Contents of this Operator’s Guide
This Operator’s Guide describes the operation of the Cedex Analyzer. It contains the following chapters:
Chapter A Overview presents the specifications of the Cedex Analyzer.
Chapter B System Description contains the installation requirements of the Cedex Analyzer and a description
of the system’s components. This chapter also gives a short overview of the basic functions and operation of
the system.
Chapter C Operation describes the operating procedures for the Cedex Analyzer, including the correct
placement of the reagents and disposables and instructions for carrying out single and multiple measurements
of cell samples.
Chapter D Software provides a detailed description of the Cedex Analyzer Software functions and features.
Chapter E Maintenance and Care describes the maintenance and care procedures that are required for the
Cedex Analyzer.
Chapter F Troubleshooting contains troubleshooting information for the Cedex Analyzer.
Chapter G Appendix contains a detailed list of System Options and User Preferences, and an Index.
14
Cedex Analyzer Operator’s Guide
Conventions Used in this Guide
IX.
Conventions Used in this Guide
Text Conventions
To present information consistently and memorably, the following text conventions are used in this Operator’s
Guide:
Numbered list:
Steps in a procedure that must be performed in the order listed.
Italic type:
Used for operating instructions for the Cedex Software. In addition, important
notes and information notes are shown in italic type.
Blue italic type:
Refers to a different section in this Operator’s Guide, which should be consulted.
Symbols
In this Operator’s Guide, the following symbols are used as visual signals:
Symbol
Heading
Description
WARNING
This symbol is used to indicate that non-compliance with instructions or
procedures could lead to physical injury or even death or could cause
damage to the system.
IMPORTANT NOTE
Information critical to the success of the procedure or use of the product.
INFORMATION NOTE
Additional information about the current topic or procedure.
ccc
Procedure continued on next page.
в– End of procedure.
The following symbols appear on the analyzer:
Symbol
Heading
Description
CE MARK
The CE mark on the Analyzer type plate indicates conformity with
requirements of the directives relevant for this Analyzer.
DANGEROUS
ELECTRICAL VOLTAGE
On the back of the Analyzer near the power box.
Prologue
15
Warnings and Precautions
X.
Warnings and Precautions
Moving parts may cause hand injuries. Never use the Cedex Analyzer without the protective cover on the
Multi Sampler and Syringe Module.
It is important that the following safety instructions and guidelines be observed in order to ensure safe and
reliable operation of the Cedex Analyzer:
c In an emergency, immediately turn the power switch off and unplug the instrument.
c Place the device on a dry and sturdy surface, free of vibrations.
c Avoid transporting the device as much as possible once it has been assembled.
c Prevent the device from getting wet.
c Protect the device from dust and smoke.
c Do not expose the device to direct sunlight.
cEnsure there is sufficient air circulation around the Cedex Analyzer during operation (particularly around
the computer and monitor).
cOperate within a constant temperature range of +10В°C to +40В°C (+50В°F to +100В°F).
cFor best performance, it is recommended to keep the Cedex Analyzer permanently on and only shut down
the Software application on a regular basis.
cThe Cedex Analyzer should only be used with the supplied or specified devices (Cedex Analyzer, Cedex
Software, monitor, computer, Multi Sampler, Reagent Tray).
cDo not install any additional Software on the corresponding computer.
cOnly trained personnel in a controlled laboratory environment should operate the Cedex Analyzer.
cAll services and repairs should be performed only by authorized service technicians.
cAlways ensure that there are sufficient reagents in the reagent containers.
cClean the containers before reusing them.
cAlways observe the safety regulations when handling Trypan Blue, Detergent, Cleaning Solution or acids
and bases.
cWaste contaminated with tissue or cells, for example Cedex Sample Cups, pipette tips, etc., must be disposed
of according to the recommended rules for handling biohazard materials.
cAny leaks in the Liquid Management system must be repaired immediately. Contact your distributor or
authorized service technician.
cAlways ensure that there is a Cedex Sample Cup attached to the single sample port or placed in the
DefaultCup position on the Multi Sample Tray.
cOnly use Cedex Detergent for the cleaning process in the Liquid Management system.
cOnly use Cedex Sample Cups from Roche Diagnostics GmbH for the conveyance of cell samples to the
sample port.
Other sample cups can cause irreparable damage to the Cedex Analyzer!
cAlways wear protective clothing, particularly gloves, when handling samples.
cTo prevent damage to the flow chamber, no particles larger than 80 Ојm should enter the measurement
system.
cParticles (especially microcarriers) larger than 90 Ојm should not gain access into the Analyzer because they
cause irreparable damage and render the device non-functional.
cDirt or dust particles should not gain access into the device.
cEnsure that all equipment required for sample preparation, for example, Cedex Sample Cups, pipette
tips, etc., are stored in a dust-free environment since coarse dust particles can impair the flow chamber’s
functionality.
cCheck that the Cedex Sample Cup is free of contamination before use. Only clean Cedex Sample Cups can
guarantee optimal functioning of the Cedex Analyzer.
cEnsure that the Trypan Blue solution is free of contamination, otherwise filter prior to use. Roche
recommends the use of the Cedex Reagent Kit.
cSecure your measurement data.
16
Cedex Analyzer Operator’s Guide
Warnings and Precautions
Installed anti-virus software should never be set up to scan the complete Cedex2 directory and especially not
the FDB file itself.
If the system has been upgraded from some previous version to Software version 2.3.2, it is possible that some
default settings in the System Options may have slightly different values than those described in this manual.
The settings described in this manual apply to systems on which Software version 2.3.2 has been installed as
the original Software.
The Software and hardware of your Cedex System can differ from the information described here, but this
should not make a difference to the operational functions in general.
The manufacturer is not responsible or liable for any damages resulting from improper use or failure to
comply with the regulations in the Operating Instructions.
FCC Notification
Changes or modifications to this unit not expressly approved by the party responsible for compliance may
void the user’s authority to operate the equipment.
This equipment has been tested and found to comply with the limits for a Class A digital device, pursuant to Part
15 of the FCC Rules. These limits are designed to provide reasonable protection against harmful interference
when the equipment is operated in a commercial environment. This equipment generates, uses, and can radiate
frequency energy and, if not installed and used in accordance with the Instruction Manual, may cause harmful
interference to radio communications. Operating this equipment in a residential area is likely to cause harmful
interference, in which case the user will be required to correct the interference at their own expense.
Electrical Safety
The Cedex Analyzer is designed in accordance with Protection Class I (IEC). The chassis/housing
of the instrument is grounded to protection earth (PE) by means of a cord. For protection against
electrical shock hazards, the instrument must be directly connected to an approved power source
such as a three-wire grounded receptacle for the 110 V or 230 V line. Do not use an ungrounded
receptacle; have a qualified electrician replace the ungrounded receptacle with a properly (PE)
grounded receptacle in accordance with the local electrical code. Do not use an extension. Any
break in the electrical ground path, whether inside or outside the instrument, could be hazardous.
Under no circumstances should the user attempt to modify or deliberately defeat the safety
features of this instrument. If the power cord becomes cracked, frayed, broken, or otherwise
damaged, replace it immediately with the equivalent part from Roche Diagnostics.
Malfunction due to interfering electromagnetic fields
Malfunction of system and incorrect results due to interfering electromagnetic fields
This system is designed and tested to CISPR 11 Class A standard. In a domestic environment it may
cause radio interference, in which case, you may need to take measures to mitigate the interference.
cThe electromagnetic environment should be evaluated prior to operation of the device.
cDo not operate this system in close proximity to sources of strong electromagnetic fields (for
example unshielded intentional RF sources), as they may interfere with proper operations.
Prologue
17
Disposal of the Analyzer
XI.
Disposal of the Analyzer
Disposal Recommendations
All electrical and electronic products should be disposed of separately from the municipal waste system. Proper
disposal of your old appliance prevents potential negative consequences for the environment and human health.
The Analyzer must be treated as biologically contaminated hazardous waste. Decontamination
(i.e., a combination of processes, including cleaning, disinfection and/or sterilization) is required
before reuse, recycling, or disposal.
Dispose of the Analyzer according to local and/or laboratory regulations.
For more information contact your local Roche Support personnel.
Disposal of control unit components
This symbol appears on any component of your control unit (such as the computer, monitor, or
keyboard) that is covered by the European Directive on Waste Electrical and Electronic Equipment
(WEEE).
You must dispose of these items through designated collection facilities appointed by government or
local authorities.
Contact your city office, waste disposal service, or your Roche Service representative for more
information about disposal of your old product.
Constraint:
It is left to the responsible laboratory organization to determine whether control unit components are
contaminated or not. If contaminated, treat them in the same way as the system.
18
Cedex Analyzer Operator’s Guide
AOverview
The Cedex Analyzer automatically determines the cell concentration and viability of cell suspensions. The
analysis is based on the Trypan Blue Exclusion Method whereby cell suspensions are stained and analyzed. The
data obtained allows for the evaluation of the overall state of the cell culture, including the specific growth rate
and doubling time of a cell population, as well as the documentation of the cultivation process.
A
The evaluation of the samples is based on automatically obtained digital images that are analyzed using analysis
Software on a separate computer (Cedex Control Unit). All the necessary steps – from the staining of the samples
to the recording and evaluation of the image data – are automatically performed by the Analyzer. Recognition
and differentiation of cells as either viable or dead is done under standardized conditions, which provides very
precise and objective results.
A variety of parameters, including Viable Concentration, Total Concentration, Viability, Average Compactness
and Average Diameter are analyzed using result data from single images, as well as from all of the selected images
of a sample. Standard deviation (Std. Dev.) of the number of cells from image to image is also calculated. In
addition, the Aggregate Rate, which shows the percentage of the total number of cells that appear in aggregates
(clusters), is determined for both single images and all of the images. The use of a Live Operator makes it
possible to directly observe the effects on the analysis of a sample when the image analysis Software (Operator)
is adjusted.
Graphical representations of the measurement results can be viewed in the Measurement Statistics Histogram,
Diameter Histogram, Compactness Histogram, Aggregate Histogram and Cultivation Time Chart. In
the Measurement Statistics Histogram, individual images can be compared to give a better overview of the
distribution of the cells in the images. The Cell Diameter Histogram shows the diameter distribution of living
cells. The deviation of the shape of living cells from that of an ideal sphere is represented in the Compactness
Histogram. The Aggregate Histogram provides an overview of the amount and size of aggregation found in the
cell culture.
The Cultivation Time Chart displays growth curves and cultivation parameters in a time-dependent manner.
The results of the Cultivation Time Chart can be separately printed out. For further processing of the results in
other programs, data export in formats such as Excel-compatible formats and CSV (Comma Separated Values,
generally applicable) is possible. The Cultivation Time Chart includes calculations for the doubling time [T]
and specific growth rate [Вµ].
The Cedex Software 2.3.2 is operated on WindowsВ® 7. Secure data handling, as well as a carefully designed user
management system, guarantee compatibility with 21 CFR, Part 11. Access security for the Cedex Analyzer has
been stepped up. Access is only allowed for authorized persons. The workstation can be automatically blocked
after a certain number of consecutive entries of a false password via the Systems Options. A warning message
will appear before the last allowed attempt.
Contact your local Roche service representative for more information about setting up the Cedex System to
be compliant with 21 CFR Part 11.
Overview
19
Description of the Cedex System
A
1
Description of the Cedex System
The Cedex System consists of two functional units, the Analyzer (see Figure 1) and the Control Unit (computer
equipped with the Cedex Software 2.3.2).
Preparation and processing of the samples takes place in the Analyzer. The analysis Software is installed on a
computer and controls the Analyzer, as well as the analysis and evaluation of the images obtained.
Syringe Module with 8-way valve
Sample port with Cedex Sample Cup
2.5 ml syringe
ON/OFF switch
Reagent Tray with 5 reagent containers (from left
to right: Trypan Blue, Detergent, Cleaning Solution,
distilled or deionized Water, Waste)
Figure 1: The Cedex Analyzer
The Analyzer consists of two main components, the hardware for image capturing and the Liquid Management
system.
The flow chamber is specially developed to allow for the analysis of a defined volume of cell suspension. The
Liquid Management system is responsible for staining the sample as well as for filling and cleaning the flow
chamber and liquid feed system.
The volumes of sample and dye, as well as specific cleaning solutions required for each cleaning routine, are
precisely controlled via the Syringe Module with the 8-way distribution valve. The individual components of
the Liquid Management system are easily accessible to allow for trouble-free maintenance and control.
20
Cedex Analyzer Operator’s Guide
The Measurement Procedure
The Trypan Blue Exclusion Method
2
The Measurement Procedure
The determination of the number of viable cells (cells/ml) and viability of cell suspensions (the percentage
of viable cells from the total cell sample) is a fully automated, standВardized procedure based on the manual
Trypan Blue Exclusion Method. A defined volume of Trypan Blue is added by the syringe to the Cedex Sample
Cup containing the cell suspension. The cell suspension and dye are optimally mixed between the syringe and
Cedex Sample Cup by controlled pump actions and then incubated for exactly the same amount of time for
each measurement. This minimizes effects on the viability measurements that might be caused by the toxicity
of the Trypan Blue.
A
After the incubation period, the stained cell suspension in the syringe is then transported in small portions
through the capillary tubes and 8-way valve to the flow chamber. A set number of microscopic images of the
cell sample is taken in the flow chamber and transferred to the analysis Software via an integrated interface in
the measurement system.
Once the measurement procedure is completed, the Liquid Management system automatically performs a
cleaning routine. It is only possible to begin a new measurement after the cleaning routine has finished.
2.1
The Trypan Blue Exclusion Method
The Trypan Blue Exclusion Method is based on the principle that viable cells will not take up the dye, while
dead or dying cells have a compromised membrane that allows for the uptake of the dye. Thus, dead cells appear
darkly stained in a microscope.
Trypan Blue has a greater affinity for serum proteins than cellular proteins. If the microscopic image has a
dark background due to high quantities of stained serum proteins, centrifuge the cell sample and resuspend it
in a protein-free medium or physiological saline solution prior to counting.
Overview
21
Data Analysis
A
3
Data Analysis
The analysis Software and its graphical user interface (GUI), known as the Cedex Control Center, enables
the user to work with the Cedex Analyzer. The image analysis Software (Operator) recognizes structures
and identifies particles, thus differentiating cells from cell debris and dirt particles. Live and dead cells are
differentiated according to their degree of Trypan Blue staining.
Image processing is integrated in the Cedex Control Center in such a way that the user or Administrator can
check on its function in the system. The analysis process cannot be altered during data recording in order to
allow for consistent and objective measurement results.
22
Cedex Analyzer Operator’s Guide
Technical Specifications of the Analyzer
4
A
Technical Specifications of the Analyzer
Cedex Analyzer
Method of measurement
Digital image and pattern recognition
Viable/dead cell differentiation
Trypan Blue Exclusion Method
Detectable cell concentration range
5 × 10⁴ – 1 × 10⁷ cells per ml
Detectable cell diameter range
8 µm – 40 µm
Required sample volume
1,000 Вµl
Average measurement period
< 4.0 min
Geometric resolution
2.08 Вµm/pixel
Chamber height
100 Вµm
Material and diameter of the
capillaries
Teflon, 765 Вµm
Operating temperature
+10В°C to + 40В°C
(Optimal image quality is achieved
between 20В°C and 30В°C)
Maximum temperature change
5В°C per hour
Maximum humidity deviation
5% per hour
Operating humidity
20% – 80% relative humidity (non-condensing)
Pollution degree
2 (according to IEC 61010-1)
Dimensions
Height: 660 mm (26.0 inches)
Width: 300 mm (12.0 inches)
Depth: 600 mm (23.6 inches)
Weight without Multi Sampler: 33.0 kg (72.6 lbs)
Energy requirements
100 – 250 VAC, 50 – 60 Hz
Energy consumption
24 VDC 2.0 A
Installation category
II (according to IEC 61010-1)
Overview
23
Technical Specifications of the Analyzer
A
Multi Sampler MS20C (optional)
Number of samples
1 – 20
Average measurement period for 20
samples (20 images per sample)
< 90 min
Dimensions
Height: 250 mm (9.84 inches)
Width: 250 mm (9.84 inches)
Depth: 190 mm (7.48 inches)
Total Weight: 5.2 kg (11 Ibs)
Energy requirements
24 VDC, 9A DC
Energy consumption
max. 30W
Power supply
Input: 100 – 240 VAC,
  47 – 62 Hz
Output: 24 VDC
Hardware Requirements for the Cedex Control Unit
Computer
x86-Architecture, Intel Pentium IV,
Minimum 2 GHz required
3 GHz recommended
Operating system
WindowsВ® 7
RAM
Minimum 2 GB RAM
Hard-disk storage
100 MB free hard-disk storage for installation of application
Minimum 20 GB free hard-disk space for data storage of approx.
1,000 measurements
Recommended: 80 GB
Serial ports
Minimum 2 free ports
(minimum 3 free ports if MS20/AS20 installed)
Frame grabber
Eltec PC-eye 4
CD/DVD burner
Minimum CD burner required
DVD burner recommended if the computer will not be connected to
a server
24
Graphic card
Resolution: 1024 Г— 768 pixel, 24-bit color
Monitor (color monitor or -TFT)
1024 Г— 768 pixel, 24-bit color
Cedex Analyzer Operator’s Guide
Installing the Cedex System
B
System Description
1
Installing the Cedex System
The Cedex System comprises the Cell Analyzer and the Control Unit (PC equipped with the Cedex Software
2.3). The Cell Analyzer and Control Unit are delivered and assembled by a service technician authorized by
Roche Diagnostics GmbH. The service technician assembles the Cell Analyzer and controls the installation,
runs the focus adjustments and ensures that the Cedex System is operational. Finally, the technician will create
a report on the installation and current status of the device.
We recommend choosing your local IT specialist as the system administrator for the general administration of
the Windows operations. This person controls the configurations that regulate system access at the level of the
operating system.
B
Installation of the Cedex System is done as follows:
cThe system administrator should set up net access and/or printer installation, if desired, before the service
technician assembles the Cedex System.
cThe Cedex System is assembled by a service technician authorized by Roche Diagnostics GmbH.
cThe service technician installs the Analyzer and checks the settings in the Software.
cThe service technician checks the Software information, performs a focus adjustment and ensures that the
Cedex System is ready to use. Finally, the technician creates a current status report of the device.
cThe system administrator is responsible for setting up the user accounts for the operating system. The
system administrator is also responsible for ensuring data safety and security of the system.
cThe Administrator for the Cedex Software then sets up Cedex System user accounts and assigns users the
appropriate rights (see “Administration of User Accounts”).
Please be aware that the correct operation of the Analyzer and Software can only be guaranteed if no other
Software has been installed on the computer.
The Software and hardware of your Cedex Analyzer may differ from the information described here, but this
should not make a difference to the operational functions in general.
Roche recommends only installing the software on the Control Unit and Windows Image version provided
by Roche specifically for the Cedex System. Installations on other hardware will not be supported. For more
details, please contact Roche Technical Service.
Roche provides a secured remote service for the Cedex Control Unit that can be activated by Roche Technical
Service. Please contact Roche Technical Service for more information.
The Cedex Control Unit can be integrated into a network domain by activating some properties. This activation
can be done by Roche Technical Service. Please contact Roche Technical Service for more information.
System Description
25
Choosing a Suitable Location
Connecting Hardware Components
2
Choosing a Suitable Location
The Cedex Analyzer is highly sensitive and consists of top-quality electronic and optical components. To
guarantee optimal and reliable performance of the Cedex Analyzer, select the appropriate location in accordance
with the safety regulations described in the Prologue.
B
Avoid further transportation of the Cedex Analyzer after the installation.
Vibrations or shaking must be avoided when operating or transporting the analyzer over short distances.
Focus adjustment must be done after transportation (see “Automatic Adjustment”).
Injury from heavy loads
The Cedex Analyzer weighs 33 kg (72.6 lbs). No attempt should be made by the user to remove or set up the
instrument alone. You may injure your hands, fingers, or back when putting the Analyzer in place.
2.1
Connecting Hardware Components
Follow the instructions below to connect the hardware components (see Figures 2 and 3 below):
1
Connect monitor, keyboard and mouse to their respective ports on the PC.
2
Connect one end of the video cable to the Video port of the measurement system.
3
Connect the other end of the video cable to the Video port of the PC.
4
Connect one end of the first serial cable to the Focus port of the measurement system.
5
Connect the other end of the first serial cable to the Focus port of the PC.
6
Connect one end of the second serial cable to the Syringe port of the measurement system.
7
Connect the other end of the second serial cable to the Syringe port of the PC.
■Check that your connections are correct otherwise an error message will appear: “Error: HWManager Pump
connection failed” or “Error: Device Pump is not connected”.
26
Cedex Analyzer Operator’s Guide
Choosing a Suitable Location
Connecting Hardware Components
B
Figure 2: Cedex Analyzer connections
Figure 3: PC connections
Connect the measurement system, PC and monitor to the main power supply with the supplied cords.
The power supply should not be located in the area around the sample, and should be placed at all times
behind the Cedex Analyzer. Liquids must never come into contact with the power supply.
System Description
27
Connecting or Disconnecting the Device
3
Connecting or Disconnecting the Device
First, connect the device using the power cord to the external power supply. A blue power switch is located on
the front panel of the Cedex System. When the switch is turned to ON it illuminates, indicating that the device
is live. In case of problems, turn the device switch to OFF.
B
In case of emergency, remove the power line from the Cedex System immediately.
ON/OFF switch
Figure 4: The ON/OFF switch for the Cedex Analyzer
28
Cedex Analyzer Operator’s Guide
Updating to Cedex Software 2.3.2 or Installing the Cedex Software 2.3.2
Overview
4
pdating to Cedex Software 2.3.2 or Installing the
U
Cedex Software 2.3.2
Roche strongly recommends that the procedures described in this chapter for installing or updating to Cedex
Software 2.3.2 only be carried out by a trained IT specialist.
The Cedex Software 2.3.2 is installed on the Control Unit delivered with the Cedex System. If the Cedex
Software 2.3.2 is already installed on your Control Unit, and the system has been installed in your lab, please
refer to Section C, Chapter 2, “Preparing the Analyzer for Measurements”, for information about starting up
an installed system.
4.1
B
Overview
The procedure required to update to Cedex Software version 2.3.2 varies depending on the version of the
Cedex Software installed on the Control Unit. The flowchart in Figure 5, located on the next page, provides
an overview of the steps that must be taken, depending on the Software version. Before beginning the update
procedure, please review the flowchart in Figure 5 carefully and refer to the relevant overview sub-chapters for
further information.
The steps described in this chapter must be followed exactly in order to guarantee correct installation of
the Software. Do not turn off the Control Unit (PC) throughout the installation procedure. If there is any
interruption during the installation procedure, a recovery of the entire Operating System will be required.
The recovery DVD is located inside of the Control Unit above the CD drive, and the steps are described in
Section B, Chapter 4.3, “Update or Recover Windows Operating System to Windows 7”.
Please note that Cedex Software version 2.3.2 requires Windows 7 operational software. In order to install
Windows 7, the hard disk must be formatted, which will result in complete data loss. Therefore, all files to be
backed up and saved must be stored in an external location before beginning installation of the Windows 7
image.
System Description
29
Updating to Cedex Software 2.3.2 or Installing the Cedex Software 2.3.2
Overview
Update to SW 2.3.2 from
B
Cedex
SW 1.x
Cedex
SW 2.1.x or v.2.2.x
Cedex
SW 2.3.x
see overview
Section B, Chap. 4.1.1
see overview
Section B, Chap. 4.1.2
see overview
Section B, Chap. 4.1.3
Вђ
Вђ
Вђ
Contact your local
Roche Technical Service
for this update
Update SW, inc. database, to
Cedex SW 2.3.x
(Instructions: Cedex Analyzer
Operator’s Guide; SW version 2.3,
August 2013)
Вђ
Вђ
Create backup of Cedex SW 2.3.x
database (Section B, Chap. 4.2)
Create backup of Cedex SW 2.3.x
database (Section B, Chap. 4.2)
Вђ
Вђ
Update or Recover Windows OS
to Win7 (Section B, Chap. 4.3)
Update or Recover Windows OS
to Win7 (Section B, Chap. 4.3)
Вђ
Вђ
Install the Framegrabber and
Multi I/O drivers
(see Section B, Chap. 4.4)
Install the Framegrabber and
Multi I/O drivers
(see Section B, Chap. 4.4)
Вђ
Вђ
Install Cedex SW 2.3.2
(Section B, Chap. 4.5):
Install Cedex SW 2.3.2
(Section B, Chap. 4.5):
cNew database
(Section B, Chap. 4.5.2),
or
cNew database
(Section B, Chap. 4.5.2),
or
cExisting database
(Section B, Chap. 4.5.3)
cExisting database
(Section B, Chap. 4.5.3)
Figure 5: Flowchart showing steps required for updating to Cedex SW 2.3.2
30
Cedex Analyzer Operator’s Guide
Updating to Cedex Software 2.3.2 or Installing the Cedex Software 2.3.2
Overview
New install SW 2.3.2
Including Win7
SW 2.3.2 only
Update or Recover Windows OS
to Win7 (Section B, Chap. 4.3)
Вђ
Вђ
Install the Framegrabber and
Multi I/O drivers
(see Section B, Chap. 4.4)
Install the Framegrabber and
Multi I/O drivers
(see Section B, Chap. 4.4)
Вђ
Вђ
Install Cedex SW 2.3.2
(Section B, Chap. 4.5):
Install Cedex SW 2.3.2
(Section B, Chap. 4.5):
cNew database
(Section B, Chap. 4.5.2),
or
cNew database
(Section B, Chap. 4.5.2),
or
cExisting database
(Section B, Chap. 4.5.3)
cExisting database
(Section B, Chap. 4.5.3)
B
Figure 6: Flowchart showing steps required for installing Cedex SW 2.3.2
System Description
31
Updating to Cedex Software 2.3.2 or Installing the Cedex Software 2.3.2
Overview
4.1.1.
Overview: Updating from Cedex Software 1.x to Cedex Software 2.3.2
When updating a Cedex System from Software version 1.x to Software version 2.3.2, please contact Roche
Technical Service for support. The procedure for this update is not described in this Operator’s Guide.
Before proceeding with an update to Cedex Software version 2.3.2, ensure that:
B
cYou have administrator access to the Control Unit.
cYou have backed up all the files containing measurement data generated by measurements run on the Cedex
Software 1.x.
Before performing any form of installation or update procedure, the actual (effective) values for the
FlowFactor and ChamberHeight must be saved and stored for future reference. These values may need
to be adjusted in the System Options after the installation or update procedure is complete. The values for
FlowFactor and ChamberHeight are located in the Cedex.ini file, located in the directory C:\Cedex. Contact
your local Roche Technical Service for more information about accessing the Cedex.ini file.
Cedex Software version 2.3.2 uses a database system for storage of measurement results. Measurements
performed with Cedex Software version 1.x are stored in a file folder format and cannot be imported into the
Cedex Software 2.x database. Therefore, it is not possible to access measurements that were run on a Cedex
System with Software version 1.x using Cedex Software version 2.x.
4.1.2.
Overview: Updating from Cedex Software 2.1.x or 2.2.x to Cedex Software 2.3.2
Before starting an update of your current Cedex Software version 2.1.x or 2.2.x to Cedex Software version 2.3.2,
ensure that:
cYou have the complete required software packages, as well as the appropriate hardware, for the installation
or update to Cedex Software 2.3.2. Consult with your local Roche Technical Service in case of questions.
cYou have administrator access to the Control Unit.
cA storage device with enough disk space is available for a backup of the current installation. Check the
size of the folder containing all Cedex Software 2 files, including the database file (usually the directory
C:\Cedex2). The size of the backup will be approximately the size of this folder.
cEnough time is scheduled for a backup of the current installation (approximately one hour for backup to a
fast external hard drive per 10 GB disk space used in the Cedex 2 directory, including the database file).
Databases working with older Cedex Software 2.x must be updated to Cedex Software 2.3.x before they can
be updated to Cedex Software 2.3.2. Therefore, you must update your current 2.x Software version to version
2.3.x and back up the database after the update before beginning with the steps described in the subsequent
chapters.
To update from Cedex Software version 2.1.x through 2.2.x to Cedex Software version 2.3.2, the following steps
must be performed:
cCreate a backup of the database.
cUpdate older Cedex Software version 2.x to Cedex Software 2.3.x, if not already updated.
Please refer to Section B, Chapter 4.3, “Updating Older Cedex Software Version 2.x to Cedex Software 2.3”
in the Cedex Analyzer Operator’s Guide; Software Version 2.3 (August 2013), located on the installation CD
for Cedex Software 2.3.0 in the folder User Additional Features/Manual, for step-by-step instructions for
updating to Cedex Software version 2.3.0.
32
Cedex Analyzer Operator’s Guide
Updating to Cedex Software 2.3.2 or Installing the Cedex Software 2.3.2
Overview
cFollow the instructions provided in Section B of this Operator’s Guide to update from Cedex Software 2.3.x
to Cedex Software 2.3.2. Refer to the overview chart shown in Figure 5 for a description of the steps required.
Before performing any form of installation or update procedure, the actual (effective) values for the
FlowFactor and ChamberHeight must be saved and stored for future reference. These values may need
to be adjusted in the System Options after the installation or update procedure is complete. The value for
FlowFactor is located in the System Options menu under the General tab. The value for the ChamberHeight
is located in the System Options menu under the Hardware tab. See “System Options and User Preferences”
in the Appendix for more information.
Before updating or installing the software on a system with an existing database, ensure that you have
created a backup of the Cedex Software database in a remote, secure storage device that is not part of the
Control Unit. Also, ensure that you fully read and understand the following instructions before proceeding
with the update or installation of the Cedex Software. If an error occurs or if you do something incorrectly,
this could result in data loss and/or could prevent the Cedex Software 2.3.2 from operating.
4.1.3.
B
Overview: Updating from Cedex Software 2.3.x to Cedex Software 2.3.2
Before starting an update of your current Cedex Software 2.3.x installation to Cedex Software version 2.3.2,
ensure that:
cYou have the complete required software packages, as well as the appropriate hardware, for the installation
or update to Cedex Software 2.3.2. Consult with your local Roche Technical Service in case of questions.
cYou have administrator access to the Control Unit.
cA storage device with enough disk space is available for a backup of the current installation. Check the
size of the folder containing all Cedex Software 2 files, including the database file (usually the directory
C:\Cedex2). The size of the backup will be approximately the size of this folder.
cEnough time is scheduled for a backup of the current installation (approximately one hour for backup to a
fast external hard drive per 10 GB disk space used in the Cedex 2 directory, including the database file).
Before performing any form of installation or update procedure, the actual (effective) values for the
FlowFactor and ChamberHeight must be saved and stored for future reference. These values may need
to be adjusted in the System Options after the installation or update procedure is complete. The value for
FlowFactor is located in the System Options menu under the General tab. The value for the ChamberHeight
is located in the System Options menu under the Hardware tab. See “System Options and User Preferences”
in the Appendix for more information.
Before updating or installing the software on a system with an existing database, ensure that you have
created a backup of the Cedex Software database in a remote, secure storage device that is not part of the
Control Unit. Also, ensure that you fully read and understand the following instructions before proceeding
with the update or installation of the Cedex Software. If an error occurs or if you do something incorrectly,
this could result in data loss and/or could prevent the Cedex Software 2.3.2 from operating.
System Description
33
Updating to Cedex Software 2.3.2 or Installing the Cedex Software 2.3.2
Create a Backup of the Cedex Software Version 2.3.x Database
4.2
Create a Backup of the Cedex Software Version 2.3.x Database
Please note that Cedex Software version 2.3.2 requires Windows 7 operational software. In order to install
Windows 7, the hard disc must be formatted, which will result in complete data loss. Therefore, the database
must be backed up and saved in an external location before beginning installation of the Windows 7 image.
B
1
Connect an external USB disk driver to the Cedex Control Unit.
2
Navigate to the folder C:\Cedex2. Right-click on the folder and select Copy to copy the entire
Cedex2 folder.
Figure 7
3
Navigate to the external UBS disk drive, right-click on the drive, and select Paste to add the Cedex2 folder
to the external disk drive.
Figure 8
This step can take several minutes or hours depending on the size of the database.
4
Disconnect the external disk drive and proceed to the next Chapter to update or recover Windows operating
system to Windows 7.
в– 34
Cedex Analyzer Operator’s Guide
Updating to Cedex Software 2.3.2 or Installing the Cedex Software 2.3.2
Update or Recover Windows Operating System to Windows 7
4.3
Update or Recover Windows Operating System to Windows 7
A recovery of the entire Operating System may be required if there is any interruption during the installation
procedure. In addition, the following procedure is used to update a Control Unit to Windows 7 (e.g., a Control
Unit with Windows XP Professional that is suitable for updating to Windows 7).
When updating an existing Control Unit to Windows 7, the Windows 7 Recovery DVD may not be located
inside the Control Unit. In such a case, locate the Windows 7 Recovery DVD and proceed from Step 5.
To recover or update the Operating System to Windows 7 for the Cedex Analyzer Control Unit, do the following:
1
Shut down the Control Unit (PC) and monitor.
2
Unplug and remove all cables from the Control Unit (power supply included).
3
Remove the cover by pressing on the side of the Control Unit and at the same time pulling the Control Unit
to its front and pulling the cover up.
B
Figure 9
4
The Windows 7 Recovery DVD is located on top of the CD drive, as shown below.
Remove the Recovery DVD and replace the cover of the Control Unit.
Figure 10
5
Replace the cover of the Control Unit, plug the cables for the keyboard, mouse and power supply into the
Control Unit and turn it on.
ccc
System Description
35
Updating to Cedex Software 2.3.2 or Installing the Cedex Software 2.3.2
Update or Recover Windows Operating System to Windows 7
6
Insert the Recovery DVD.
B
Figure 11
7
Restart the Control Unit.
8
When the following HP welcome screen appears, press <F9 > on the keyboard.
Figure 12
9
In the following window, select CD-ROM as the Boot Device and press <Enter >.
Figure 13
10
A pre-installation screen appears and then a Windows 7 starting screen appears.
Figure 14
ccc
36
Cedex Analyzer Operator’s Guide
Updating to Cedex Software 2.3.2 or Installing the Cedex Software 2.3.2
Update or Recover Windows Operating System to Windows 7
11 In the following dialog box, press <1> on the keyboard to recover Windows 7 (“OS Recovery CEDEX” ).
B
Figure 15
12 Press Y if all required data are saved on an external medium, including the Cedex 2 database, if required.
Otherwise, press N and go back to Section B, Chapter, 4.2, “Create a Backup of the Cedex Software Version
2.3.x Database”.
Figure 16
13 The following dialog box appears and the recovery starts. The entire recovery procedure takes approximately
10 minutes.
Figure 17
ccc
System Description
37
Updating to Cedex Software 2.3.2 or Installing the Cedex Software 2.3.2
Update or Recover Windows Operating System to Windows 7
14
At the end of the recovery, the following dialog box appears.
Remove the DVD, and then press any key to continue.
B
Figure 18
15 The Control Unit automatically reboots.
Figure 19
16
When the following screen appears, enter the correct date, time, and time zone.
Click OK in the Date and Time dialog box.
Figure 20
ccc
38
Cedex Analyzer Operator’s Guide
Updating to Cedex Software 2.3.2 or Installing the Cedex Software 2.3.2
Update or Recover Windows Operating System to Windows 7
17
Enter the serial number of the instrument and click OK.
B
Figure 21
18
Press CTRL + ALT + DELETE to log in.
Enter the default administrator username and password as follows:
cUsername: Win-Admin
cPassword: Win-Admin
Figure 22
в– The Windows Operating System is now updated to Windows 7, and the drivers can be installed.
System Description
39
Updating to Cedex Software 2.3.2 or Installing the Cedex Software 2.3.2
Install the Frame Grabber and Multi I/O Drivers
B
4.4
Install the Frame Grabber and Multi I/O Drivers
4.4.1.
Install the Frame Grabber and Multi I/O Drivers
The driver for the Frame Grabber connection and Multi I/O(PCI Multiport Serial Controller) driver must
be installed before the Cedex Software 2.3.2 can be installed.
1
Connect the video (Frame Grabber) and the two serial cables to the Cedex Analyzer and the Control Unit,
as shown below .
Figure 23
Figure 24
If there is a Multi Sampler, connect the cable to one of the Perle Serial Ports (shown above).
2
Turn on the Cedex Analyzer by pressing the ON/OFF switch.
3
The Muliti I/O driver (Perle Card) is now automatically installed.
4
Simultaneously press the Windows key and the Pause/Break key.
When the switch is turned to ON, it illuminates, indicating that the device is live.
Continue with Step 4 to install the driver for the Frame Grabber.
Alternatively, go to the Start menu and open the Control Panel -> System and Security -> System
Click on the Device Manager icon.
Figure 25
ccc
40
Cedex Analyzer Operator’s Guide
Updating to Cedex Software 2.3.2 or Installing the Cedex Software 2.3.2
Install the Frame Grabber and Multi I/O Drivers
5
Right-click on “Multimedia Control ”, located under “Other devices”, and select the option
“Update Driver Software…”.
B
Figure 26
6
Click on the option “Browse my computer for driver software”.
Figure 27
7
Click on “Browse…”, and select the folder Framegrabber located on the Control Unit under
C:\drivers\Cedex Standard.
Click OK.
Figure 28
ccc
System Description
41
Updating to Cedex Software 2.3.2 or Installing the Cedex Software 2.3.2
Install the Frame Grabber and Multi I/O Drivers
8
B
Click on Next, then click on “Install this driver software anyway”.
Figure 29
9
Click on Install.
Figure 30
10
The driver for the Frame Grabber card is successfully installed.
Click on Close to exit the dialog box.
Figure 31
в– 42
Cedex Analyzer Operator’s Guide
Updating to Cedex Software 2.3.2 or Installing the Cedex Software 2.3.2
Install the Frame Grabber and Multi I/O Drivers
4.4.2.
1
Check the Driver Installation
Simultaneously press the Windows key and the Pause/Break key.
Alternatively, go to the Start menu and open the Control Panel -> System and Security -> System
Click on the Device Manager icon.
B
Figure 32
2
Check that the drivers are correctly installed by comparing the window to the following image.
Figure 33
в– System Description
43
Updating to Cedex Software 2.3.2 or Installing the Cedex Software 2.3.2
Install Cedex Software Version 2.3.2
B
4.5
Install Cedex Software Version 2.3.2
4.5.1.
Initiate the Software Installation
1
Insert the Cedex Software 2.3.2 installation CD and double-click on the Cedex Setup 2.3.2.exe program.
2
Click on Install.
Figure 34
If a window appears asking for administrator confirmation, click �Yes’ and continue with the installation.
3
Click on Next.
Figure 35
4
Put a checkmark in the box “I accept the terms in the license agreement” and click on Next.
Figure 36
ccc
44
Cedex Analyzer Operator’s Guide
Updating to Cedex Software 2.3.2 or Installing the Cedex Software 2.3.2
Install Cedex Software Version 2.3.2
5
Click on Next to install the Cedex Software 2.3 files into the recommended folder (C:\Cedex2).
B
Figure 37
6
Click on Install to initiate the installation.
Figure 38
■In case of a system on which a new database should be installed, proceed with Section B, Chapter 4.5.2, “Install
a New Database During Software Installation”.
In case of a system on which an existing database should be updated, proceed with Section B, Chapter 4.5.3,
“Update an Existing Database During Software Installation”.
System Description
45
Updating to Cedex Software 2.3.2 or Installing the Cedex Software 2.3.2
Install Cedex Software Version 2.3.2
4.5.2.
1
Install a New Database During Software Installation
If the software is being newly installed and a new database is required, place a checkmark in the “Create
new Database” box.
Click on Next.
B
Figure 39
If an existing database should be used for the installation, place a checkmark in the “Use existing database” box, and proceed with the instructions in Section B, Chapter 4.5.3, “Update an Existing
Database During Software Installation”.
2
During the installation, the following Cedex 2.3 Configuration dialog box appears.
Figure 40
To continue with the installation, enter the following information in this dialog box:
a) Enter the serial number of the Cedex Analyzer (e.g., G037D9047).
b) Enter a description of the system in the Description area (e.g., “my system”).
c) If a Multi Sampler is not installed, uncheck the “use Auto/Multi Sampler AS20/MS20” checkbox.
d) Verify the Cedex System Type in the Cedex System Type area.
Figure 41
3
After completing all steps in the Cedex 2.3 Configuration dialog box, the Next button will become active.
Click on Next to continue the installation.
ccc
46
Cedex Analyzer Operator’s Guide
Updating to Cedex Software 2.3.2 or Installing the Cedex Software 2.3.2
Install Cedex Software Version 2.3.2
4
Click on Finish.
B
Figure 42
5
The Setup Successful dialog box will appear if the installation was completed successfully.
Confirm with Close.
Figure 43
в– System Description
47
Updating to Cedex Software 2.3.2 or Installing the Cedex Software 2.3.2
Install Cedex Software Version 2.3.2
4.5.3.
1
Update an Existing Database During Software Installation
If a database already exists and should be updated during the installation, put a checkmark in the “Use
existing Database” box, and select the path of the needed database.
Click on Next.
B
Figure 44
Note that the database to be used for this procedure must first be updated to Cedex Software v2.3.x and
saved in that format.
If a new database should be installed, place a checkmark in the “Create new database” box, and proceed
with the instructions in Chapter B, Section 4.5.2, “Install a New Database During Software Installation”.
2
Click on Finish.
Figure 45
3
The Setup Successful dialog box will appear if the installation was completed successfully. Confirm
with OK.
Figure 46
в– 48
Cedex Analyzer Operator’s Guide
Updating to Cedex Software 2.3.2 or Installing the Cedex Software 2.3.2
Set the Cedex Server to Autostart
4.6
Set the Cedex Server to Autostart
The Cedex Server must be started before the Cedex Client can be started. If desired, the Cedex Server can be
configured to start automatically when the Control Unit is turned on. If not, continue with the next section.
To configure the Cedex Server to autostart, do the following:
1
B
Open Windows Explorer by left-clicking on the Windows Start button, then right-clicking on All Programs
and selecting Open All Users.
Figure 47
2
Copy the shortcut Cedex Server from the desktop to the Start Menu folder.
Figure 48
3
Open the Properties dialog box for the Cedex Server by right-clicking on the icon and selecting
Properties. Select the Shortcut tab and change the property for Run to Minimized via the
drop-down menu.
Click OK.
Figure 49
в– Continue with Section B, Chapter 4.7 to start the Cedex Software for the first time after update or installation
of the Cedex Software version 2.3.2.
System Description
49
Updating to Cedex Software 2.3.2 or Installing the Cedex Software 2.3.2
Start Cedex Software 2.3.2 for the First Time After Installation
4.7
Start Cedex Software 2.3.2 for the First Time After Installation
Once the installation of the Cedex Software is complete, the Software can be started and final adjustments
made. Do the following:
B
1
Reboot the Control Unit and wait until it is fully booted.
2
After the Control Unit is booted, log into the Windows Operating System with the following username and
password:
c Username: Win-Admin
c Password: Win-Admin
3
The Cedex Server is normally started during the Windows 7 startup, and the window is automatically
minimized.
If the Cedex Server has not automatically started, follow the instructions in Section B, Chapter 4.6 to set
the Cedex Server to autostart. Alternatively, double-click on the Cedex Server shortcut on the desktop
to start the Cedex Server.
Figure 50
4
Double-click on the Cedex Client shortcut located on the desktop.
5
In the Log In dialog box, enter the following:
c User Name: Superuser
cPassword: spass
Figure 51
6
In the Cedex Control Center Event area, verify that the message “Hardware startup completed” appears.
This step can take several minutes.
Figure 52
ccc
50
Cedex Analyzer Operator’s Guide
Updating to Cedex Software 2.3.2 or Installing the Cedex Software 2.3.2
Start Cedex Software 2.3.2 for the First Time After Installation
7
In the following dialog box, click OK to confirm the error message.
B
Figure 53
8
Click OK in the following message list dialog box to confirm the error.
9
In the Cedex Control Center, choose the Reagent Kit Status option from the Functions menu.
Figure 54
Figure 55
ccc
System Description
51
Updating to Cedex Software 2.3.2 or Installing the Cedex Software 2.3.2
Start Cedex Software 2.3.2 for the First Time After Installation
10
In the Reagent Kit Status dialog box, click on Replace All Containers, and then click on Close to exit the
dialog box.
If needed, replace or refill the Reagent Kit containers. See “Preparing the Analyzer for Measurements”.
B
Figure 56
11 Click Yes to exit the dialog box that appears.
Figure 57
12 Close the Cedex Control Center with the
in the top-right corner, and click on Yes to confirm.
Figure 58
13 Close the Cedex Server dialog box with the
14
in the top-right corner.
Double-click on the Cedex Server shortcut on the desktop and verify that the message
“Server is working” appears in the dialog box.
Figure 59
15 Double-click on the Cedex Client shortcut on the desktop, and log in with:
c User Name: Superuser
cPassword: spass
ccc
52
Cedex Analyzer Operator’s Guide
Updating to Cedex Software 2.3.2 or Installing the Cedex Software 2.3.2
Start Cedex Software 2.3.2 for the First Time After Installation
16
The following error message will appear because the Automatic Adjustment must be performed before
measurements can be run (see “Automatic Adjustment”). Click on OK to close the error message.
B
Figure 60
Click OK to acknowledge the second error message and close the dialog box.
Figure 61
17
In the Cedex Control Center Event area, verify that the message “Hardware startup completed” appears.
Figure 62
18
Verify that the system is not running in demo mode (i.e., make sure there is no Demo label visible in the
Cedex Control Center).
19
Each Cedex Analyzer has a few unique specifications related to the particular flow chamber that has
been put in. These numbers must be verified and/or adjusted in the System Options dialog box before
measurements can be run.
Verify and/or make the following changes in the System Options dialog box under either the General
or the Hardware tabs:
a.Verify MultiSamplerPresent (0 = Single Port, 1 = Auto/Multi Sampler) in the Hardware tab.
(this parameter can only be changed by reinstalling the software or with a service software).
b. Enter the appropriate value for the ChamberHeight in the Hardware tab.
c. Enter the appropriate value for the FlowFactor in the General tab.
20 Click on Save and close the System Options dialog box with the
in the top-right corner.
ccc
System Description
53
Updating to Cedex Software 2.3.2 or Installing the Cedex Software 2.3.2
Start Cedex Software 2.3.2 for the First Time After Installation
21 Select Diagnosis in the Setup menu of the Cedex Control Center.
B
Figure 63
22 Click on Start Diagnosis and verify that parameters entered in Step 19 are correct.
Without Multi Sampler:
Figure 64
With Multi Sampler:
Figure 65
23 Close the Diagnosis dialog box.
24 The system is ready to be primed and to carry out an Automatic Adjustment
(see “Preparing the Analyzer for Measurements” and “Automatic Adjustment”).
в– 54
Cedex Analyzer Operator’s Guide
Starting the Cedex System
5
Starting the Cedex System
The hardware components of the Cedex Analyzer must all be switched on before the analysis Software can be
started, otherwise the Software will not be properly initialized.
After the initial installation, switch on the individual devices in the order given below:
1
Switch on the Cedex Analyzer.
2
Switch on the monitor and the PC.
в– System Description
B
55
Securing Access Rights
Access Control at the Windows Operating System Level
B
6
Securing Access Rights
6.1
Access Control at the Windows Operating System Level
We recommend choosing your local IT specialist as the system administrator for the general administration of
the Windows operations. This person should undertake the configuration of the settings that regulate access to
the system at the operating system level. One default user at the operating system level has been factory installed:
cThe Win-Admin user (default password Win-Admin) acts as system administrator for the operating system
and has full access to all elements on the desktop including the ability to add/delete programs.
For security reasons, the Win-Admin user at the Windows Operating System level should protect the access
to the Windows OS with a new password directly after initial installation.
6.2
Access Control at the Cedex System Software Level
To launch the Software, do the following:
1
Check that the Cedex Server Software has already been automatically started (it may appear as a minimized
dialog box in the task bar at the bottom of the computer screen). If it has not automatically started, start the
server by double-clicking on the Cedex Server icon on the desktop.
2
Start the Cedex Software by double-clicking the Cedex Client icon on the desktop (the Cedex Server must
be successfully launched before the Cedex Client can be started). The Log In dialog box of the Cedex
System will open.
3
Enter the username password in the respective fields. By default, the following users are available after
installation:
a. Superuser (password spass)
b. Administrator (password apass)
в– For the Cedex Software, there should generally be at least three levels of users. In addition to normal Cedex System
users, who will only use the Cedex System for carrying out measurements, both a Cedex System Superuser
and an Administrator should be appointed. The Cedex System Superuser assumes the main responsibility of
handling the Cedex System, whereas the Administrator creates and administers user accounts.
For security reasons, both the Administrator and the Superuser should protect their access to the Cedex Software
2.3 with new passwords after initial installation. Follow the instructions below to secure access and define a new
password:
1
Log in as Administrator or Superuser.
2
Click on the System menu in the Cedex Control Center.
3
Click on Change own password. The Change Password dialog box will appear.
4
Enter the old password first. The new password needs to be entered twice.
5
Confirm by pressing OK.
в– After logging in, users can change their own passwords at any time by following the same procedure.
After installation, the user Administrator should set up regular user accounts and provide the necessary rights
before regular users run measurements (see “Administration of User Accounts”).
For security reasons, the Cedex System Administrator is generally only accorded administrative rights and
cannot carry out, reprocess or view measurements.
56
Cedex Analyzer Operator’s Guide
Overview of the Cedex Control Center
Menu Bar
COperation
1
Overview of the Cedex Control Center
The Cedex Control Center is divided into three elements:
c Menu bar
c Shortcuts area
c Event window detailing status of events carried out by the Analyzer
A description of the individual areas is given below:
C
Figure 66: The Cedex Control Center
1.1
Menu Bar
The menu bar at the top of the Cedex Control Center has 7 menu items:
c
System menu
c
Measurements menu
c Functions menu
c
Reports menu
c
Master Data menu
c
Setup menu
c Help menu
1.2
System Menu
The menu items have the following functions:
c Exit: exits the Cedex Control Center.
c Logout: for logging out of the Cedex Control Center.
c Change own password: for changing the password of a user who is logged in.
c
Lock – Unlock System: for automatically or manually locking and unlocking of the system with regard to
running measurements.
Operation
57
Overview of the Cedex Control Center
Measurement Menu
1.3
Measurement Menu
The menu items have the following functions:
c
Measurement List: This provides a list of the measurements that have been run. Measurements can be
sorted or filtered using specific criteria and then viewed (see “Using the Measurement List”).
c Single Measurement: Selecting this menu item will open a new dialog box in which single measurements
can be run (see “Opening the Measurement Dialog Box and Specifying the Operating Mode and Sample Data”).
c Multi Run: Selecting this menu item will open a new dialog box in which multiple measurements can be run
(see “The Multi Run Data Entry Dialog Box”).
c Cultivation Time Chart: This opens a new dialog box in which multiple measurements can be analyzed in
a graph form (see “Cultivation Time Chart”).
C
1.4
Functions Menu
The menu items have the following functions:
c Reagent Kit Status: This dialog box shows the percent of each reagent left. Confirmation of a reagent change
is also executed.
c Operational Data: The operating hours, number of measurements and liquid consumption are tracked.
c Cleaning Routines: Various cleaning routines can be run.
c Syringe Maintenance: Used for preparing the syringe for removal and installation.
c Hardware Management: Prime and shutdown of the Liquid Management, as well as startup and shutdown
of the hardware, are executed.
c Automatic Adjustment: An automatic focus adjustment is run.
c SST: This opens a dialog box in which System Suitability Tests (SST) can be set up and executed. The status
of SSTs are also displayed.
c Scheduling: Automatic Prime, LM Shutdown and cleaning routines can be scheduled.
c E
xport to File: Measurement results can be exported into various formats, including Excel.
c Data Exchange: Data can be imported or exported from the database of one system to the database of
another system.
c Archiving: Data from the database can be archived or restored.
58
Cedex Analyzer Operator’s Guide
Overview of the Cedex Control Center
Reports Menu
1.5
Reports Menu
Reports can be generated using this menu for the following types of information:
c Operational Data
c Measurement Data
c System Configuration Parameters
c Audit Trail
c Report about the Multi Run
c Automatic Adjustment and Alignment Verification
1.6
Master Data Menu
The menu items have the following functions:
c Reagent Container Configuration: This dialog box allows the user to set the minimum and maximum
volumes for the reagents, as well as to set the volumes for the warning and lock levels.
c User Preferences: The user preferences for default parameters such as measurement parameters,
C
measurement lists and Cultivation Time Chart can be individually set.
c Cell Type List: This allows for the creation of customized Cell Types.
1.7
Setup Menu
The menu items have the following functions:
c Audit Trail: Opens a dialog box that tracks all actions of the system.
c System Options: Various system parameters can be changed by the Superuser.
c User and Rights Management: The Administrator can create new users and administer their rights.
c Diagnosis: At the request of Roche Technical Service, a diagnosis of the entire system can be run with the
options listed.
c Trace and Logging: At the request of Roche Technical Service, logs of various functions of the system can be
created.
c Report Templates: Report templates can be created.
Operation
59
Overview of the Cedex Control Center
Help Menu
1.8
Help Menu
The Help menu provides general information about the analysis Software.
1.9
Shortcuts Area
Several buttons that act as shortcuts to certain functions are available in this area, including:
c List: Opens the Measurement List dialog box.
c Measure: Opens the Measurement dialog box for running a single measurement.
C
c Multi Run: Opens the Multi Run dialog box for running multiple measurements.
c CTC: Opens the CTC Views dialog box for setting up Cultivation Time Charts.
c SST: Opens the System Suitability Test List dialog box for setting up and executing SSTs.
c Clean: Opens the Cleaning dialog box.
c HWM: Opens the Hardware Management dialog box.
c Log Out: Logs the user out of the Cedex Control Center.
1.10
Tracking of Status of Events Carried Out by the Analyzer
In the Event window below the Shortcuts area, the status of events that have been carried out by the Analyzer
is tracked. If, for example, a cleaning routine is run, the completion of the routine will be noted in this window.
Previous events can be looked at by using the scroll bar on the right. The window is cleared each time the
Software is shut down.
60
Cedex Analyzer Operator’s Guide
Preparing the Analyzer for Measurements
Switching On
2
Preparing the Analyzer for Measurements
2.1
Switching On
Each element is switched on separately as follows:
1
Switch on the Cedex Analyzer.
2
Switch on the Multi Sampler (if available).
3
Switch on the monitor and the PC.
в– Cedex Analyzer hardware components must be switched on before starting the analysis Software. Otherwise,
the analysis Software may not be correctly initialized.
2.2
Logging In at the Computer Operating System Level
A prompt for a username and password will appear on the computer when everything has been turned on
correctly. The user should log in as Win-Admin, password Win-Admin unless a different Windows operating
system account has been set up.
2.3
C
Starting the Cedex Software
To launch the Software, do the following:
1
Check that the Cedex Server Software has already automatically started (it may appear as a minimized
dialog box in the task bar at the bottom of the computer screen). If not, start the server by double-clicking
on the Cedex Server icon on the desktop.
2
Start the Cedex Software by double-clicking the Cedex Client icon on the desktop (the Cedex Server must
be started before the Cedex Client can be started). The Log In dialog box of the Cedex Analyzer program
will open.
3
Enter the username and password (if a password is required) in the respective fields.
4
If you are logging in for the first time under a new username, you may be forced to change your password.
5
Click on the OK button to log in or press <Return>. The Cedex Control Center appears after a successful
login.
c Factory installed default user is Superuser (password spass).
в– The user may be prompted to create a new password the first time the Cedex Software is started. This serves the
purpose of replacing the temporary password given to the user by the Administrator when the user account was
created. Follow the program instructions or see “Changing Own Password”.
The Administrator, Superuser or regular user has access to the assigned functions once he/she has logged into
the Cedex Control Center. The regular user only has access rights to routine operations depending on the
configurations set by the Administrator. Access rights may vary according to options chosen for each user
account.
Operation
61
Preparing the Analyzer for Measurements
Performing a HW Startup and Prime
2.4
Performing a HW Startup and Prime
Two elements of the Analyzer are usually shut down at the end of the day: the Hardware Management and the
Liquid Management. When the Hardware Management is shut down, several elements of the Analyzer, such
as the Multi Sampler and pump, are not yet initialized. A HW Startup will initialize hardware interfaces and
must be done before a measurement can be performed. If a measurement is attempted before the Hardware
Management has been started, an error message will appear, “Cannot start a new process: Hardware Management
is not started”. The HW Startup may be automatically carried out when the Software is launched if the
Administrator has set this up in the System Options.
C
In the case of the Liquid Management, the capillary tubes and syringe are filled with air or water when the
Analyzer is first installed or any time an LM Shutdown has been performed (see, “Carrying Out an LM Shutdown
and HW Shutdown”). Performing a Prime fills the capillary tubes and 8-way valve with the appropriate reagents.
All measurements are based on the capillary tubes having a precise amount of reagents in them.
Since LM Shutdown should be run at the end of the previous day, a Prime is necessary prior to the first
measurement of the day. If a measurement is attempted before the machine has been primed, an error message
will appear, “Cannot start new process: system is not primed”.
Both the HW Startup and the Prime functions are located in the same dialog box. Follow the instructions
below to perform a HW Startup and Prime:
1
Click on the HWM button in the Cedex Control Center or select Hardware Management under the
Functions menu. The Hardware Management dialog box will open.
2
If the Hardware Management has not been started, the current status field will have the message “HW not
started and LM not primed”.
3
Click on HW Startup if required. The Hardware Management will start and the current status field will have
the message “HW started and LM not primed”.
4
Ensure that a Reagent Kit is installed (see “Preparing the Reagent Kit”) and a clean, empty Cedex Sample Cup
is correctly attached to the sample port or correctly positioned on the Multi Sample Tray, if present
(see “The Multi Sampler DefaultCup”).
5
Click on Prime. The duration of a Prime procedure is displayed in the Estimated total time area. The time
displayed is an estimate based on the time required for the previous Prime. The message “HW started and
LM primed”, appears in the current status field when the Prime has been completed.
6
Click on
to close the dialog box.
в– There should not be a break of more than 2 hours between a Prime and a measurement. If more than 2 hours
have passed since the last measurement, a new Prime must be performed.
62
Cedex Analyzer Operator’s Guide
Preparing the Analyzer for Measurements
Preparing the Reagent Kit
2.5
Preparing the Reagent Kit
To ensure optimal performance, the reagents must be free of impurities such as dust, crystals, biological material
or fluff. The Roche Cedex Reagent Kit guarantees optimal handling with the best possible safety. One Reagent
Kit pack is sufficient for approximately 100 measurements, including the standard cleaning routines.
2.5.1.
Installing or Changing the Reagent Kit
Proceed as follows to install or change the Reagent Kit:
1
Perform an LM Shutdown if the Liquid Management system has been primed (see “Carrying Out an LM
Shutdown and HW Shutdown”).
2
Open the new Reagent Kit and place the Reagent Kit containers in the appropriate positions on the reagent
tray (see Figure 67).
3
Fill the water reagent container with distilled or deionized water.
4
Empty, clean and replace the waste container.
5
Connect the capillaries to the reagent bottles through the holes in the lids. Ensure that the capillary tubes
are not bent and almost reach the bottom of the containers. Use the lids to close the reagent containers to
avoid dirt particles getting into contact with the reagents.
The tubes should not be shortened under any circumstances!
6
Remove the lid of the waste container and ensure that the silicone and capillary tubes only reach about 1 cm
into the container.
7
Select the Reagent Kit Status option in the Functions menu of the Cedex Control Center. The Reagent Kit
Status dialog box will open.
8
Click on the Replace all containers button in the right-hand corner of the Reagent Kit Status dialog box
to confirm the changing of the Reagent Kit (see Figure 68). The Reagent Control display at the bottom righthand corner of the Cedex Control Center will turn from red to green and indicate the number of runs left.
9
Attach a clean Cedex Sample Cup to the sample port (see Figure 69) or place it in the DefaultCup position
on the Multi Sample Tray (see “The Multi Sampler DefaultCup”).
10
Click on Prime in the Hardware Management dialog box.
C
в– Operation
63
Preparing the Analyzer for Measurements
Preparing the Reagent Kit
Waste container
Distilled or deionized Water container
Cedex Cleaning Solution container
Cedex Detergent container
Cedex Trypan Blue Solution container
C
Figure 67: Position of the Reagent Tray with the individual containers
Figure 68: Confirming change of the Reagent Kit
For reliable functioning of the reagent control (correct number of possible measurements, or reporting an
impending overflow of the waste container), it is critical that all of the reagent containers are correctly
filled to the line with the appropriate liquid or, in the case of the waste container, completely emptied (see
“Refilling Containers Individually”). The changing of the reagents must then be confirmed appropriately in
the Software as soon as the Reagent Tray has been put back into the chamber. Failure to do all of the above
will result in a mismatch between the calculated reagents available as shown in the Reagent Control and the
actual reagent amounts in the containers or space available in the waste container.
The reagent control function that monitors reagent and waste levels can be turned off. See “Disabling the
Reagent Control”, for more information.
64
Cedex Analyzer Operator’s Guide
Preparing the Analyzer for Measurements
Preparing the Reagent Kit
2.5.2.
Refilling Containers Individually
In order to ensure optimal functioning of the Analyzer, each Reagent Kit container must be thoroughly cleaned
before refilling. Impurities such as dust and fluff or contamination with microorganisms may thus be avoided.
Reagents can be refilled, or emptied in the case of waste, on an individual basis. Each change can be individually
confirmed by clicking on the respective Set Full button or Empty button, in the case of waste, in the Reagent
Kit Status dialog box (see Figure 68).
If you are using your own reagents, it may be necessary to filter them before use. Roche Diagnostics GmbH
recommends using the Cedex Reagent Kit.
To refill individual containers with reagents, follow the instructions below:
1
Rinse all reagent containers well before refilling. Ensure there are no impurities such as dust or fluff in the
containers.
2
Fill the detergent container to the required level with Cedex Detergent (see label).
O
nly Cedex Detergent or a detergent with identical specifications should be used for the cleaning procedures
in order to prevent damage to the sensitive surface of the Liquid Management components.
3
Fill Cedex Cleaning Solution in the cleaning solution container to the required level
(see label).
4
Fill distilled or deionized water in the water container to the required level (see label).
5
Fill Cedex 0.2% Trypan Blue solution in the Trypan Blue container to the required level (see label). Roche
recommends using 0.2% Trypan Blue solution. If necessary, dilute a more concentrated Trypan Blue solution
with buffer (Phosphate Buffered Saline (PBS), pH 7.4).
6
Place all of the reagent containers, as well as the emptied waste container, in the appropriate positions in the
Reagent Tray (see Figure 67).
7
A Cedex Sample Cup should always be attached to the single sample port (see Figure 69). The Cedex
Sample Cup (4 ml) is correctly attached when it is in an upright position beneath the sample port and the
capillary tube almost reaches the bottom of the Cedex Sample Cup. If there is a Multi Sampler connected to
the Analyzer, a Cedex Sample Cup must be placed in the DefaultCup position on the Multi Sample Tray
(see “The Multi Sampler DefaultCup”).
C
в– Operation
65
Preparing the Analyzer for Measurments
Checking the Analyzer
2.6
Checking the Analyzer
Since measurement results obtained with the Cedex Analyzer depend on correctly filled reagent containers and
the proper performance of the Analyzer, the user should check the Analyzer for possible wear and tear, and also
check whether the reagent containers have the correct volume prior to each set of measurements, as follows:
C
66
1
Check the Syringe Module (2.5 ml syringe and 8-way valve) for wear and tear or contamination. Renew the
syringe if required (see “Syringe Maintenance”).
2
Check the number of runs possible. This is listed in the right-hand corner of the Cedex Control Center
next to a green or red circle. Change the Reagent Kit when required. Observe the reminder to change the
Reagent Kit (see “Installing or Changing the Reagent Kit“).
3
Check whether there is an empty Cedex Sample Cup attached to the sample port or a Cedex Sample Cup
in the DefaultCup position on the Multi Sample Tray in the case of a Multi Sampler (see “Working with the
Multi Sampler“). If there isn’t, attach one.
4
Perform a Hardware Management (HW) Startup if necessary.
5
Perform a Prime if a Reagent Kit is installed and new measurements are to be carried out
(see “Performing a HW Startup and Prime”).
6
Have the cell suspension samples or particle solutions ready for the analysis.
■Cedex Analyzer Operator’s Guide
Carrying Out a Single Measurement
3
Carrying Out a Single Measurement
The following section describes the procedure for carrying out a single measurement. For setting up and
carrying out multiple measurements, see “Working with the Multi Sampler”.
A number of relevant parameters and entries must be specified in the Measurement dialog box prior to carrying
out measurements. They include:
c Choosing the operating mode and specifying sample data.
c Defining the measurement and analysis (process) parameters.
The measurement procedure can only begin when the steps above have been completed.
Perform a HW Startup and Prime prior to the first measurement if the Liquid and Hardware Management
system were previously shut down (see “Performing a HW Startup and Prime”).
Operation
C
67
Carrying Out a Single Measurement
Opening the Measurement Dialog Box and Specifying the Operating Mode and Sample Data
3.1
pening the Measurement Dialog Box and Specifying the Operating
O
Mode and Sample Data
The entry areas for choosing the desired operation and specifying the sample data are located in the Sample
Parameters and Processing parameters areas of the Measurement dialog box. The parameters should be
entered just before measuring in order to ensure a direct relationship between the sample and the data.
Follow the instructions below to specify sample data for a single measurement:
C
1
Open the Measurement dialog box by clicking on the Measure button in the Shortcuts area or by
selecting Single Measurement in the Measurements menu.
2
Enter a clearly defined Reactor ID to describe the sample (e.g., the name of the cell culture) in the Reactor
ID area. You may either choose a Reactor ID from the drop-down list or enter a new Reactor ID. A new entry
can be defined by up to 20 alphaВnumerical symbols.
3
Enter a clearly defined Sample ID in the Sample ID area (e.g., P001). The Sample ID can be freely defined.
If the intended measurement is not the first in a row of measurements (i.e., if it has the same Reactor ID
as a previous measurement), then the Software will automatically enter the consecutive Sample ID into the
Sample ID area (e.g., P001, P002,...). In that case, it is not necessary to enter the Sample ID manually unless
a different Sample ID is desired.
4
If desired, use the Sample Drawing drop-down menu to select the date when the sample was drawn. Note
that the process date and time (i.e., the date and time the sample was measured), is automatically entered.
5
Choose the appropriate dilution factor from the Dilution drop-down list (e.g., 1:1, 1:2, 1:5, … etc.).
When a dilution of 1:2 is prepared, then 1 part cell suspension has been added to 1 part dilution medium.
A dilution of 1:5 means that 1 part cell suspension has been added to 4 parts dilution medium. For undiluted
samples, a dilution factor of 1:1 should be entered. It may be necessary to dilute samples with very high
cell densities ( >1 Г— 10 7 cells/ml) manually prior to measuring. The dilution ratio chosen from the dropdown list only relates to the manual dilution of the sample prior to placing the sample on the system.
Dilutions that are an automatic part of the measurement process in the Analyzer are already taken into
account by the Cedex Analyzer Software. The calculations are carried out automatically and have nothing
to do with the entered dilutions.
6
Select the sample volume of 1000 Вµl in the Volume drop-down menu. Only the 1000 Вµl option is available for
the Cedex Analyzer.
7
The System name, as well as the process date and time of the assignment, will be automatically transferred
to the Processing parameters area in the Measurement dialog box.
8
Entering a comment for a measurement is optional. Enter the remarks in the Comment box on the Sample
Identification parameters area, if desired.
в– 68
Cedex Analyzer Operator’s Guide
Carrying Out a Single Measurement
Defining the Measurement and Analysis (Process) Parameters
3.2
Defining the Measurement and Analysis (Process) Parameters
The measurement and analysis parameters are defined in the Processing Parameters area of the Measurement
dialog box. In principle, all routine measurements can be carried out using the standardized default settings that
are factory set. To change the settings, follow the instructions below:
1
Select the sample port type in the Sample Port drop-down list:
c Auto: this option will only appear on systems with Multi Samplers.
c Single: this option will only appear on systems with a single sample port.
2
Manually enter the cup position for the sample in the Cup Position dialog box if there is a Multi Sampler
(see “Working with the Multi Sampler”).
In the case of single measurements run via the Measurement dialog box on a Cedex Analyzer with
a Multi Sampler attached, the Software will automatically incrementally increase the sample cup
position number with each new measurement. The cup position can also be fixed (see “Turning Off
Automatic Incrementation of Sample Cup Position”).
3
Select the Cell Type that optimally recognizes your cells from the Cell Type drop-down list
(see “Adjustment of the Image Analysis Using the Live Operator”).
The following Cell Type is available by default:
c Std. Cells (V5.00) for normal sized cells with a diameter of about 12 Вµm (e.g., HB58).
If a new Cell Type has been created, it can also be selected from the same Cell Type drop-down list.
See “Adjustment of the Image Analysis Using the Live Operator” for more detailed information about creating
new Cell Types.
4
C
Select the desired precision level in the Precision drop-down list. The precision level determines the volume
to be analyzed. A higher analyzed volume will require a someВwhat longer measurement time but more cells
will be counted, which will lead to a more precise calculation.
c Minimum: approximately 10 images are used for the analysis.
c Normal: approximately 20 images are used for the analysis.
c Superior: approximately 30 images are used for the analysis.
The precision names may appear differently if the system has been upgradedВ from some previous version
to Software version 2.3.2. In the case of a systemВ thatВ has been upgraded to version 2.3.2, the precision
levels may be called Low (corresВponding to Minimum), Medium (corresponding to Normal) and High
(corresponding to Superior). The same volumes are analyzed for the corresponding levels.
5
Prepare the sample and attach the Cedex Sample Cup containing the sample to the sample port or place
it in the appropriate spot on the Multi Sample Tray (see “Preparing the Sample and Attaching it to the Multi
Sample Tray or Sample Port”).
в– Operation
69
Carrying Out a Single Measurement
Preparing the Sample and Attaching it to the Multi Sample Tray or Sample Port
3.3
reparing the Sample and Attaching it to the Multi Sample Tray or
P
Sample Port
Prepare the sample prior to measuring according to the following instructions:
1
Transfer the selected volume of a well-mixed cell suspension to a clean Cedex Sample Cup.
The Cedex Analyzer tolerates volume variations of +/-10%. Any greater variation in sample volume
will lead to inaccurate results, and the Reagent Control monitor will no longer function correctly. The
Cedex Analyzer can determine cell concentrations in the range of 5× 10 4 – 1× 10 7 cells/ml. Any higher
concentration requires a manual dilution. Cells with a diameter range of between 8 µm – 40 µm can be
assessed accurately.
C
2
Remove the present Cedex Sample Cup from the sample port (or Multi Sample Tray).
3
Attach the prepared Cedex Sample Cup containing the cell suspension to the sample port (see Figure 69;
the Cedex Sample Cup is correctly attached to the sample port when it is in an upright position directly
beneath it and the capillary tube almost reaches the base of the Cedex Sample Cup) or place in the
appropriate cup position on the Multi Sample Tray (see Figure 71).
Figure 69: Attaching the Cedex Sample Cup to the sample port
в– 3.3.1.
Starting the Measurement
Ensure that the entire measurement system, including the sample, is ready for a measurement as follows:
1
Ensure that the Cedex Sample Cup is correctly attached to the sample port or placed on the Multi Sample
Tray.
2
Ensure that the reagent containers are sufficiently filled and in their correct positions.
3
Ensure that the waste container is empty.
4
Click on Start Measurement in the middle of the Measurement dialog box to begin the measurement.
в– During the measurement, samples of the cell/Trypan Blue mixture are injected into the flow chamber in
successive steps. After each injection, an image of the sample is taken and sent to the computer for analysis. The
number of images taken depends on the precision level determined for the measurement.
70
Cedex Analyzer Operator’s Guide
Carrying Out a Single Measurement
Preparing the Sample and Attaching it to the Multi Sample Tray or Sample Port
3.3.2.
End of Measurement
A cleaning procedure automatically begins immediately after the last image is captured and the results have
been displayed in the Measurement dialog box. The entire Liquid Management system is rinsed during this
procedure (Ultra Fast Clean). Once this procedure is completed, a green bar appears in the Measurement dialog
box. In addition, the message “Process finished EndEvent (Measurement)” appears in the Event dialog box on the
Cedex Control Center.
In the Measurement dialog box, the top section of the Result Data area displays the overall results of the
measurement. The bottom section displays, in succession, the results from each image taken. When a line is
selected in the list of results of single images, the corresponding image is displayed in the Image area (see “Image
Area”).
C
Figure 70: Cedex Analyzer Measurement dialog box with the final results
The measurement results can be directly printed out via the Print button in the middle of the Measurement
dialog box.
To set up a new measurement, click on the New Measurement button in the middle of the Measurement dialog
box. If the next measurement belongs to the same Reactor ID as previous measurements, then the consecutive
Sample ID will automatically be entered into the Sample ID area by the analysis Software without further
entries being necessary. If a different Sample ID is desired, the new Sample ID can be typed in manually.
Operation
71
Carrying Out a Single Measurement
Interrupting a Measurement
When the final measurement in a set of samples has been completed, or if there is a longer pause before the
next measurement, perform a Standard Clean in the Liquid Management system in addition to the Ultra Fast
Clean procedure that is automatically carried out between measurements (see “Cleaning Options”). If multiple
users have been created for the Cedex Software, log out of the Software once the cleanВing procedure has been
completed to allow the next user access to the Cedex Analyzer.
The Cedex Sample Cup from the last measurement should remain attached to the sample port or left in the
Multi Sample Tray in the DefaultCup position during the complete cleaning procedure. The cup should only be
removed when a new Cedex Sample Cup has been attached for the next measurement.
C
If the Cedex Analyzer is to be shut down after a set of measurements, or at the end of the day, clean the complete
Liquid Management system with an LM Shutdown procedure to maximize the life-span of the Cedex Analyzer
and guarantee optimal performance. The entire Liquid Management system is rinsed with distilled or deionized
water during the LM Shutdown, and the Trypan Blue is then pumped out of the capillary (see “Carrying Out
an LM Shutdown and HW Shutdown”).
3.4
Interrupting a Measurement
An orange EMERGENCY STOP button is located on the left-hand side of the Measurement dialog box and can
be activated during the measuring procedure to interrupt the analysis process. If the EMERGENCY STOP is
selected, an error message will appear asking, “Do you want to cancel the process?”. Click on Yes to stop to stop
and abort the process immediately. Click on No to put the process on hold.
If Yes is selected, the EMERGENCY STOP button will change to read Unlock Queue. The system must be
unlocked by clicking on this button before more measurements can be run. If No is selected, the EMERGENCY
STOP button will change to read Resume. Click on this button to resume the measurement process.
Only use the EMERGENCY STOP button in an emergency. Actual measurement data may be lost.
72
Cedex Analyzer Operator’s Guide
Working with the Multi Sampler
4
Working with the Multi Sampler
Moving parts of the Multi Sampler may cause hand injuries. The Multi Sampler needle may cause
injuries during operation. Never use the Cedex Analyzer without the protective cover in place for the Multi
Sampler.
The Multi Sampler is an accessory device for the Cedex Analyzer (see Figure 71 and Figure 72). The Multi
Sampler can convey up to 20 cell suspension samples in sequence to the Cedex System for analysis. Once the
samples have been loaded in the Multi Sample Tray and the analysis parameters for each sample have been set,
the samples are automatically delivered to the Cedex System and analyzed.
C
Protective Cover
Sampling probe
Cedex Sample Cups
Multi Sample Tray
Figure 71: Multi Sampler
Operation
73
Working with the Multi Sampler
The Multi Sampler DefaultCup
C
Sampling probe
Multi Sample Tray
Figure 72: Cedex Analyzer including Multi Sampler
4.1
The Multi Sampler DefaultCup
The position of the Cedex Sample Cup used for the Prime, LM Shutdown, calibration and cleaning routines is
called the DefaultCup. This sample cup does not differ from the usual Cedex Sample Cups. The standard
(default) position for the DefaultCup is position 1 of the Multi Sample Tray. The 20 numbered positions are
clearly marked directly on the Multi Sample Tray.
An empty Cedex Sample Cup must be manually placed in the position set for the DefaultCup before running
LM Shutdown, focus adjustment, Prime and all cleaning routines.
The position in which the DefaultCup is placed can be changed. See “Modifying the Standard Setting for the Multi
Sampler DefaultCup”. The position of the DefaultCup does not influence measurements. All 20 positions on the
Multi Sample Tray can be used for measurements. However, should a sample be present in the DefaultCup
position during Prime, LM Shutdown, focus adjustment or any cleaning routines, it can no longer be used for
a measurement.
74
Cedex Analyzer Operator’s Guide
Working with the Multi Sampler
Preparing the Measurement
4.2
Preparing the Measurement
4.2.1.
Using the Multi Sample Tray
Fill the appropriate volume of samples into Cedex Sample Cups (maximum 20) and place them on the Multi
Sample Tray according to the desired sequence. Gently insert the tray into the notch until the automatic tray
rope starts pulling it in.
As a safety precaution, leave all of the empty Cedex Sample Cups in the Multi Sample Tray after the
measurements have been completed.
4.2.2.
Ejecting the Multi Sample Tray
To eject the Multi Sample Tray, gently push on the right-hand corner of the tray when the system is idle. The
Multi Sample Tray can be ejected by gently pushing on the tray only when the system is idle. The tray cannot be
ejected if the system is moving or the needle is down in a cup.
If a problem occurs with the system when the needle is down (see, for example, “Disruption of Measurements”),
restart the Hardware Management to render the tray ejectable again (see “Carrying Out an LM Shutdown
and HW Shutdown”). In some cases it may be necessary to restart the Cedex Software and Analyzer.
4.2.3.
C
Performing a Prime
The Prime and HW Startup are performed as usual in the Liquid Management dialog box as described in
“Performing a HW Startup and Prime”. An empty Cedex Sample Cup must be placed in the DefaultCup position
(default position 1) of the Multi Sample Tray when running a Prime.
4.3
Carrying Out Measurements with the Multi Sampler
Before carrying out measurements, ensure that the system is operational as described in “Checking the Analyzer”.
4.3.1.
The Multi Run Data Entry Dialog Box
Click on the Multi Run button in the Shortcuts area of the Cedex Control Center or select Multi Run in the
Measurements menu. The Multi Run dialog box will appear, and entries for sample data and parameters for
the analysis process are entered via this dialog box (see Figure 73).
In addition to the entry columns for ReactorID, SampleID, Cell Type, Dilution and Precision (see “Opening
the Measurement Dialog Box and Specifying the Operating Mode and Sample Data” for more details), there are
also columns for Status and CupNr. The CupNr column shows the sample cup position on the Multi Sample
Tray. The Status column displays the state of the sample before, during and at the end of a measurement.
Operation
75
Working with the Multi Sampler
Carrying Out Measurements with the Multi Sampler
4.3.2.
Preparing for Multiple Measurements in the Multi Run Dialog Box
The Multi Run dialog box automatically displays all 20 possible sample cup positions. To set up and carry out
multiple measurements with the Multi Run do the following:
C
1
Transfer 1000 Вµl of a cell suspension sample into Cedex Sample Cups and place the cups in the desired
locations on the Multi Sample Tray.
2
Click anywhere in the row of the MultiRun Measurements Preparation area that corresponds to the
location of a Cedex Sample Cup containing a sample. The row will be converted to edit mode, and the
sample and process parameters for the measurement can be defined (see “Opening the Measurement
Dialog Box and Specifying the Operating Mode and Sample Data” and Figure 44).
3
Enter the desired sample data and parameters for the sample (see “Defining the Measurement and Analysis
(Process) Parameters”).
4
Enter a comment in the field Comment, if desired.
5
Repeat Steps 2 – 4 for the remaining samples to be measured.
6
The rows in which entries are in the process of being filled out will remain in edit mode. To clear the entire
list of entries and start with a new list, click on the Clear List button on the right-hand side of the Multi
Run dialog box.
в– Measurement of up to 20 samples in a row leads to prolonged incubation (up to 90 minutes) of cells at room
temperature. Tests in our lab using several different cell lines (CHO-K1 and several hybridoma cell lines)
showed no noteworthy influence of the prolonged incubation times on the measurement results. However,
this result may not necessarily apply to all cell lines available on the market. We, therefore, recommend
testing especially sensitive cell lines in advance to determine the number of samples that can be measured in
a row without affecting the cells.
Figure 73: Adding sample information to the Multi Run dialog box
76
Cedex Analyzer Operator’s Guide
Working with the Multi Sampler
Carrying Out Measurements with the Multi Sampler
4.3.3.
Activating Sample Rows and Starting the Measurement
After all sample information has been entered in the Multi Run preparation area, the samples can be activated
and, thus, added to the process queue. To activate samples and start the measurement, do the following:
1
Activate the status of each sample row by double-clicking in the Status field of the row to be activated. The
row appears pale blue, and further modifications of sample information is impossible. Return to the Edit
status by double-clicking on the Status area of the sample row to allow for further changes, if required.
2
Alternatively, all samples can be activated or deactivated simultaneously by double-clicking on the word
Status in the column heading at the top of the Multi Run preparation area. Confirm the safety query with
Yes to accept the modification.
3
After some or all rows have been activated, click on the Start button on the right-hand side of the Multi Run
dialog box to start the analysis of the activated measurements.
в– When measuring begins, the row of the sample being measured will be highlighted in yellow, and the progress
of the measurement will be tracked in the status column. When a measurement is finished, the row will be
highlighted in green and status column will indicate Done. In addition, the estimated time required for the
measurement is shown in the Estimated time remaining field.
Images taken of the sample are displayed in the upper right-hand corner of the Multi Run dialog box during
the measurement. In addition, results for Total Cell Concentration, Viable Cell Concentration and Viability
are displayed in the upper left-hand corner of the Multi Run dialog box during and after a measurement has
finished.
C
Before, during and after measuring, the Status column can display the following inforВmation (see Figure 73
and Figure 116):
Edit:
Indicates that sample data is actively open for editing and is in the process of being edited. Sample
data in edit mode has not yet been added to the process queue, and samples placed in positions
in edit mode will not be analyzed when the Multi Run is started. Rows in edit mode are white.
Active:
Indicates that the sample is ready for analysis, which starts automatically once the Start button is
pressed. Rows in active mode are highlighted light blue.
Scheduled:
All rows marked as active will be added to the process queue and converted to scheduled mode
after pressing the Start button. Rows marked as edit will remain in edit mode.
Prepare:
Indicates that the system is preparing to measure the sample marked with this status. The row is
highlighted in yellow.
Measure:
Indicates that the system is in the middle of carrying out a measurement of the sample marked
with this status. The row is highlighted in yellow.
Cleaning:
Indicates that the system is carrying out the cleaning routine after a completion of a measurement.
The row is highlighted in yellow.
Done:
indicates that measurement and analysis of a sample marked with this status has been completed
successfully. The row is highlighted in green.
Failed:
The measurement of this cup has failed.
Aborted:
The measurement of this cup has been aborted by the user.
No Cup:
There was no cup at this position in the Multi Sampler when it was ready for measurement.
Blocked:
The lift was blocked when the cup should have been measured.
The status of a particular measurement is tracked in the Status column. The Errors and messages dialog box
gives a list of each step completed and any errors that may have occurred.
Operation
77
Working with the Multi Sampler
Carrying Out Measurements with the Multi Sampler
C
Figure 74: Multi Run dialog box during measurement
Only samples that have the status of active or scheduled will be measured. Samples that are in edit mode
have not yet been added to the process queue and will not be measured until they have been activated.
If an automated cleaning has been scheduled via the Scheduler function, the cleaning routine has a lower
priority than scheduled measurements and will be added to the process queue after all activated (status:
active or scheduled) measurements have been carried out (see “Scheduling Automatic Cleaning Routines”
for more information about automating cleaning routines). Note that measurement information placed
in the Multi Run preparation area that have the status of edit are not added to the queue! Therefore, if
a Cedex Sample Cup containing a sample is added to the Multi Sample Tray in the DefaultCup position,
and the row for that sample is left in edit mode, the cup will be used for a cleaning routine should one be
scheduled to be carried out at that time. It is therefore critical to ensure that a Cedex Sample Cup containing
a sample to be measured is never placed in the DefaultCup position on the Multi Sample Tray and left in
edit mode during a Multi Run. Samples placed in the DefaultCup position for measurement should be
immediately set to active or scheduled in order to be added to the process queue and, thus, have precedence
over all scheduled cleaning routines.
4.3.4.
Adding Measurements to the List While Measurements are Running
Sample rows in which data has not yet been entered can be filled out at any time while the Multi Run is running.
In addition, sample rows containing finished measurements (status: done) can be cleared and prepared for a
new measurement by double-clicking in the Status field of the row with the finished measurement. Sample data
for a measurement cannot be modified after that measurement has begun.
78
Cedex Analyzer Operator’s Guide
Working with the Multi Sampler
Interrupting a Multi Run
4.3.5.
Modifying Data Entry, Changing Samples
Information about the operation and process parameters for samples that have not yet been analyzed can be
modified during the run. To modify information of measurements that are in active or schedule mode but have
not yet been started, do the following:
1
Double-click on the Status field of the measurement to be modified. The status field will indicate that the
sample is in edit mode.
2
Make desired changes to the measurement.
3
Double-click on the Status field to re-activate the measurement (status: active or scheduled).
в– Wait until the Multi Sample Tray has stopped moving before changing the samples!
4.3.6.
Non-Linear Measurements in a Sample Series
Measurements of activated samples are always done in a linear fashion following a sequence of 1 – 20. If samples
need to be analyzed individually and not in the usual linear ascending order of 1 – 20, the samples to be analyzed
later should be inactivated and remain in the Edit status for the meantime. When all active samples in the
sample tray are completed, subsequent measurements with the newly activated samples can begin.
4.3.7.
C
LOAD DATA FROM XML
The LOAD DATA FROM XML option is available in the Multi Run dialog box and can be used to upload sample
and processing parameters simultaneously for multiple samples. For more information about this function, see
the document, “Using the Load Data from XML option”, located in the folder User Additional Features\Load
Data from XML on the Cedex Software 2.3.2 CD.
4.4
Interrupting a Multi Run
The Start button will switch to a Stop button after a Multi Run has started. Click on the Stop button to pause or
stop the Multi Run. If a measurement is being carried out when the Stop button is pressed, that measurement
will be completed. All scheduled measurements (status: scheduled) will switch to active mode, and the Stop
button will revert to Start. Click on the Start button again to continue analysis of activated measurements.
4.5
Disruption of Measurements
Error messages may appear if a sample can’t be run. For example:
cIf a Cedex Sample Cup is not available in its position on the Multi Sample Tray during measurements, then
the No Cup message will appear.
cIf the Multi Sample Tray is not inserted or not inserted correctly, then the Tray not inserted message will
appear.
Some errors may block the analysis of the rest of the measurements. The level of error that should stop the
analysis of all samples can be determined using the Error Level drop-down list at the top of the Multi Run
dialog box. The options for the level of error that will stop the analysis are:
cFatal: Only errors involving a system / hardware crash, when functionality is not available, will stop analysis.
c Critical: Data loss or any other error that results in an invalid measurement will stop the analysis.
c Error: Errors that do not result in an invalid measurement will stop the analysis.
c Warning: Warning messages with information for the user will stop the analysis.
c Message: Any message will stop the analysis.
Operation
79
Working with the Multi Sampler
Results
4.6
Results
After a Multi Run has finished, the results for all measurements obtained by the Cedex Analyzer are stored and
displayed as described in “Using the Measurement List”. In addition, some results for the measurements carried
out are displayed in the Analyzed Measurements field at the bottom of the Multi Run dialog box.
4.6.1.
The Multi Run Result List
At the bottom of the Multi Run dialog box, the Analyzed Measurements field displays the list of results for
measurements previously carried out. Measurements are listed in order of process time, from the newest
measurements at the top of the list to the oldest measurements at the bottom. All measurements carried out
using the Multi Run dialog box will be displayed in this field unless the Clear Resultlist button has been pressed.
C
Clicking on the Clear Resultlist button will clear all measurement results from the list. In addition, measurements
displayed in this field can be restricted to only the measurements carried out by the user logged into the system
(mine), measurements that have not yet been printed out (unprinted), and/or measurements carried out on
that particular day (today).
Measurement results can be printed out via the Print Report button located just above the Analyzed
Measurements field (see “Printing Reports” for more information about print report options).
The following information is shown in the result list:
cUser
cWorkarea
c Reactor ID (classifying the cell sample)
c Sample ID (naming the measurement)
c Valid checkbox
c Total cell concentration [Г— 105 cells/ml]
c Viable cell concentration [Г— 105 cells/ml]
c Viability [%]
c Sample Drawing (defined by user, if desired)
c Process Time (date and time sample was measured)
c Comment (if added by the user)
Other results, such as Average Diameter, can be added for display in the result list via the User Preferences (see
“Adjusting Result Display in the Measurement List and Multi Run Dialog Boxes”). Double-click on a measurement
to view all results. If the result list has been cleared, previously carried out measurements can still be viewed,
printed out and exported via the Measurement List dialog box (see “Using the Measurement List”).
80
Cedex Analyzer Operator’s Guide
Switching Off the Cedex Analyzer
Carrying Out an LM Shutdown and HW Shutdown
5
Switching Off the Cedex Analyzer
Switching off the Cedex Analyzer should always be carried out in the following order:
1
Carry out an LM Shutdown.
2
Shut down the analysis Software (optional, see note below regarding the use of the scheduler).
3
Shut down the operating system.
4
Switch off the individual devices at random.
в– If Prime, LM Shutdown or routine cleaning routines have been scheduled via the scheduler, the Software
application must be left on and the HW must be started (see “Scheduling Automatic Cleaning Routines”).
5.1
Carrying Out an LM Shutdown and HW Shutdown
C
All of the capillary tubes in the Liquid Management system are cleaned and rinsed with distilled or deionized
water during an LM Shutdown. In addition, the Trypan Blue is withdrawn from the 8-way valve/syringe and
replaced with air. This is to prevent the capillary tubes and flow chamber from becoming damaged. The HW
Shutdown shuts down several elements of the hardware system including the Multi Sampler (if present) and
pump.
Follow the instructions below to carry out an LM Shutdown:
1
Click on the HWM button in the Shortcuts area of the Cedex Control Center to open the Hardware
Management dialog box. Alternatively, the Hardware Management dialog box can be opened by selecting
Hardware Management in the Functions menu at the top of the Cedex Control Center (see Figure 75).
2
Click on the LM Shutdown button in the lower right-hand corner of the dialog box to shut down the Liquid
Management. The estimated time required for the LM Shutdown is displayed in the “Estimated Total Time”
section of the Hardware Management dialog box.
3
When everything has been shut down, the Current Status field will have the message “HW started and
LM not primed”. If both the Liquid Management and the Hardware Management has been shut down, the
message “HW not started and LM not primed” will appear.
4
Click on
to close the dialog box.
в– Figure 75: Hardware management dialog box
Operation
81
Switching Off the Cedex Analyzer
Logging Out
5.2
Logging Out
To log out of the Cedex Control Center, select Logout under the System menu or click on the Logout button in
the Cedex Control Center. If an LM Shutdown has not yet been carried out, the message, “Do you really want to
log out without performing an LM Shutdown?”, will appear. Either click on Yes to log out immediately or click
on No, perform an LM Shutdown, then log out.
The Software will be ended and the login dialog box will reappear. Logout is possible during a measurement
without influencing it. A message indicates that measurements are in progress.
C
5.3
Shutting Down the Cedex Control Center
Follow the instructions below:
1
Perform an LM Shutdown to shut down the Liquid Management system
(see “Carrying Out an LM Shutdown”).
2
Shut down the Software by selecting Exit under the System menu or by clicking on
to close the dialog
box. The security query, “Do you really want to exit the Cedex Control Center?“, will appear.
3
Click on Yes to shut down the program.
в– Restarting the analysis Software is necessary for the next measurement session.
If at all possible, the Analyzer should never be turned off. If it is necessary to turn it off, the Analyzer needs at
least 2 hours to warm up before it can be used for measurements.
82
Cedex Analyzer Operator’s Guide
Using the Measurement Results Dialog Box
DSoftware
1
Using the Measurement Results Dialog Box
Measurement results are displayed in the Measurement dialog box (see Figure 77). If a single measurement
has been run using the Measurement dialog box, the analysis results obtained from that measurement are
automatically displayed in the same dialog box after the analysis process has been completed. Measurement
results from Multi Runs are displayed in the Multi Run result list until the list has been cleared.
In addition, measurement results can be viewed via the Measurement List dialog box. To access this dialog
box, click on the List button in the Shortcuts area of the Cedex Control Center or select Measurement List
in the Measurements menu. The Measurement List dialog box will open, showing all of the measurements
stored in the database (see Figure 76). See “Using the Measurement List” for more details about working with
the Measurement List.
D
Figure 76: Measurement List dialog box
To see the results of a particular measurement, highlight the row containing the measurement to be viewed by
clicking on the field to the left of the appropriate line, then clicking on the View button in the bottom righthand corner. The Measurement dialog box will open with the results of that particular measurement. The
Measurement dialog box has 4 separate sections (see Figure 77):
c Result Data area
c Sample Parameters area
c Processing Parameters area
c Image area
Some of the obtained data can also be displayed as graphic diagrams by clicking on the Diagrams button (see
“Graphical Display of the Analysis Results” and “Cultivation Time Chart” for more details). It is also possible to
access the Live Operator from this dialog box by clicking on the Live Operator button (see “Adjustment of the
Image Analysis Using the Live Operator”).
Software
83
Using the Measurement Results Dialog Box
Result Data Area
1.1
Result Data Area
The Result Data area in the bottom half of the Measurement dialog box has two separate sections: the section
just below the words “Result Data” displays the overall results for the measurement, while the section further
down displays the results for each image analyzed.
D
Figure 77: The Measurement dialog box with results
The parameters shown in the Result Data area for both the overall results and individual image results include:
c Viable Cell Conc. Value:
Indicates the concentration of viable cells [Г—105 cells/ml].
c Total Cell Conc. Value:
Indicates the total cell concentration [Г—105 cells/ml].
c Viability (%) Value:
Indicates the proportion of viable cells (%) to the total number of cells (viable and dead cells).
c Avg Compactness Value:
Indicates the average variation, in shape, of viable cells from an ideal sphere, with the ideal sphere shape
equaling >1<. Higher values indicate the extent of variation and, therefore, the overall state of the cell
culture (e.g., damage caused by shear force, etc.).
c A
verage Diameter Value:
Indicates the average diameter of viable cells [Вµm].
c Aggregate Rate Value:
Indicates the percentage of all cells (Total Cell Count) present in aggregates (cell clusters).
c Dead Cell Conc. Value:
Indicates the dead cell concentration [Г—105 cells/ml].
c Viable Cell Count Value: Indicates the number of viable cells counted.
c Dead Cell Count Value: Indicates the number of dead cells counted.
c Total Object Count Value:
The default image analysis software (Cell Type: Std. Cells (V5.00)) delivered with the Cedex Analyzer does
not provide any detailed information about objects.
84
Cedex Analyzer Operator’s Guide
Using the Measurement Results Dialog Box
Sample Parameters and Processing Parameters Areas
In addition, the Result Data area for the individual images has an Excluded column next to the image number.
Images that could lead to incorrect measurement results during analysis (e.g., due to impurities or large bubbles),
are automatically recognized as invalid and excluded from evaluation by the analysis Software. If this occurs, the
image will be marked with a check in the checkbox of the Excluded column. Users can also manually exclude
individual images from the calculations or include images that were automatically excluded by the Software by
clicking on the checkbox in this column.
1.2
Sample Parameters and Processing Parameters Areas
The Sample Parameters area of the Measurement dialog box shows the parameters entered by the user before
running the measurement. If any measurements have been reprocessed, the original or reprocessed data can
be selected in the drop-down menu of the Data Set section. If data has been reprocessed at some point, the
Effective checkbox will indicate which data set has been determined to be the effective version (see “The
Reprocess Button”). Comments for the measurement can be added in this area at any time.
The Processing Parameters area lists the process parameters of the measurement, including Cell Type, used
to analyze the images (see “Adjustment of the Image Analysis Using the Live Operator”), the precision selected
and the date and time the process was run. None of the values in this area can be changed. Click on the Show
parameters button below the Cell Type drop-down menu to open a dialog box that shows the actual Live
Operator Parameters values used for that Cell Type (see Figure 78, below).
D
Figure 78: Dialog box displaying the Live Operator parameter settings for the Cell Type used for a measurement
Software
85
Using the Measurement Results Dialog Box
Image Area
1.3
Image Area
1.3.1.
Viewing Individual Cell Images
The Cedex Software enables a close view of a single image or an enlarged display for evaluation.
Individual images can be viewed in the Image area of the Measurement dialog box. The results from the
individual images are listed at the bottom of the Measurement dialog box in the Result Data area. When a
row with the results of a particular image is highlighted in this section, the image connected with those results
is displayed in the Image area at the top right-hand corner of the Measurement dialog box. To see a different
image in this area, click on a different row in the Result Data area.
Only one image is displayed in the Image area in the Measurement dialog box. Alternatively, an overview of all
cell images can be displayed by clicking on the Image List button beneath the Image area, which will display the
Image List dialog box containing thumbnails of all of the images used for the calculation of results (see Figure
79, below).
D
Figure 79: Image List dialog box showing all images used for the analysis
Double-click on an image in the Image List dialog box to open a new dialog box, called the Image View. This
dialog box contains an enlarged version of the selected image, as well as some further options for viewing the
image. Double-clicking on the image displayed in the Image area of the Measurement dialog box will also open
the Image View dialog box.
The image list also displays an image taken of the analyzed area in the flow chamber just before cells are
introduced into the chamber (Prescan Image). This image can be used to check whether large impurities
that might affect the image analysis are present in the analyzed area of the flow chamber.
86
Cedex Analyzer Operator’s Guide
Using the Measurement Results Dialog Box
Image Area
1.3.2.
Viewing a Cell Image Using the Image View Dialog Box
It is possible to see which cells were marked viable and dead cells by the analysis Software via the Image View
dialog box. The user can thus get a sense of how cell shapes and clusters have been evaluated by the Software.
The Cedex Software offers various options for optimizing measurement results by adjusting the Operator used
for the analysis. Thus, the image analysis Operator can be adjusted for abnormal cell culture images or for
specific internal counting strategies. For more information about adjusting the image analysis, see “Adjustment
of the Image Analysis Using the Live Operator”.
The Image View offers the following information and options:
c Viable Cells: number of viable cells.
c Dead Cells: number of dead cells.
c Show Circles checkbox: switches on/off the marking of cells recognized as living or dead. Viable cells
are marked with a uniform green circle and dead cells are marked with a red circle. The circle diameter
corresponds to the cell diameter. Aggregates are marked with a blue circle.
c Zoom: image enlargement.
c Brightness and contrast settings.
cNavigating a dialog box when the image is enlarged (scroll bars appear at the bottom and right edge of the
image when the image is zoomed in).
cScrolling through all of the images for a particular measurement using the arrows
lower right-hand corner.
in the
D
Figure 80: Viewing a cell image using the Image View dialog box
Software
87
Using the Measurement Results Dialog Box
Image Area
Certain areas of the image can be enlarged by following the instructions below:
1
Place the mouse pointer on the top left-hand corner of the area to be enlarged.
2
Hold the left mouse button pressed down and move it to the lower right-hand corner of the area to be
enlarged.
3
Release the mouse button; the selected area will fill the whole dialog box.
в– Return to the original size of the image by following the instructions below:
1
Place the mouse pointer anywhere on the diagram.
2
Hold the left mouse button pressed down and form a box from the bottom right corner to the upper left
corner.
3
Release the mouse button. The chart will then return to its original size.
в– D
Click on Close to shut the dialog box or use the
1.3.3.
button.
Excluding Images from the Evaluation Process/Including Excluded Images
Images can be excluded from analysis by the user. Also, images that have been excluded automatically by the
analysis Software (due to, for example, excessive bubbles or dirt) can be included in the result analysis, if desired.
Exclusion and inclusion of images for a particular measurement are done via the checkbox in the Excluded
column in the Result Data area of the Measurement dialog box.
If there is a check in the Valid checkbox, the image is considered valid, which means that the cell image has
been included in the calculation process. The user can choose to manually exclude the image by clicking on the
checkbox in the Excluded column for the selected image. The image will still be marked as Valid, but will also
be excluded from the calculation of results.
No check in the Valid checkbox means that the cell image is not considered valid and has been automatically
excluded from the calculation process. In that case, a checkmark will automatically appear in the Excluded
column. To include an image that was excluded by the Software, click away the checkmark in the Excluded
column. The image will still be marked as invalid via the lack of checkmark in the Valid checkbox, but will be
included in the calculation of results.
88
Cedex Analyzer Operator’s Guide
Using the Measurement List
2
Using the Measurement List
Data from measurements that have been carried out and stored in the database can be accessed via the
Measurement List dialog box. Open the Measurement List dialog box by either clicking on the List button in
the Shortcuts area of the Cedex Control Center or by selecting Measurement List in the Measurements menu
at the top of the Cedex Control Center. Measurements are stored in the order in which they were carried out,
with the most recent measurement placed at the top of the list.
Two types of information can be displayed in the list of measurements: information about sample and process
parameters and information about some results. If there is no check in the Show measurement results box at
the bottom left-hand corner of the dialog box, sample and process parameters for measurements are displayed
(see Figure 81).
D
Figure 81: Measurement List dialog box displaying the Sample Identification and Process Parameters
To see measurement results, click on the checkbox next to Show measurement results (see Figure 82). By
default, the list displays the results for total cell concentration, viable cell concentration and viability. Other
results, such as Average Diameter or Compactness, can be added for display in the result list of the Measurement
List dialog box via the User Preferences (see “Adjusting Result Display in the Measurement List and Multi Run
Dialog Boxes”).
Figure 82: Measurement List dialog box with the option Show measurement results selected
Software
89
Using the Measurement List
Viewing Existing Analysis Results
A number of actions can be carried out in the Measurements List dialog box including searching for
measurements using a variety of filters, viewing measurement sample and process parameters, viewing
measurement results, printing reports, exporting measurements to a file and reprocessing measurements (see
“The Reprocess Button”).
2.1
Viewing Existing Analysis Results
View existing data sets by double-clicking on the measurement or by highlighting the row containing the desired
measurement and then clicking on the View button in the bottom right-hand corner of the Measurement List
dialog box. This will open a Measurement dialog box containing all of the relevant data results for the selected
measurement (see “Using the Measurement Results Dialog Box”).
2.2
Searching for Measurements
It is possible to search for measurements using a number of different filter criteria including sample drawing
date, process date, Reactor ID, and Sample ID in the Filter By area at the top of the Measurement List dialog
box. To search for measurements based on the sample drawing date or the process date, for example, do the
following:
D
1
Click on the drop-down menu button next to the Sample Drawing Date From or Process Date From sections.
A calendar will appear in which the desired starting date for filtering can be selected.
2
When a date has been selected, a check will appear in the checkbox next to the date to indicate that a filter
is active based on that date.
3
Click on the drop-down menu button next to the date in order to select the desired ending date.
4
Once the dates for filtering the measurements have been selected, click on the Find button in the upper
right-hand corner of the Measurement List dialog box.
5
All of the measurements that match the dates given for sample drawing (using the Sample Drawing Date
From section,) or that were run within the dates specified in the Process Date From section, will be displayed
in the measurement list in the bottom half of the dialog box.
в– It is possible to select measurements with regard to both sample drawing date and process date. If the desired
dates for both the sample drawing dates and process dates are selected, only those measurements that meet all
4 date criteria will be displayed when the Find button is clicked on.
Measurements can also be searched for based on Reactor ID and/or Sample ID by filling in the information in
these sections of the Filter By area. In addition, measurements can be searched for based on user by typing in
the user name in the User section, by work area (using the drop-down menu in the Workarea section), by data
set (in the DataSet area) and by Cell Type (using the drop-down menu in the Cell Type section).
If a measurement has been reprocessed, the original and all reprocessed versions of the measurement will be
listed. The data set version of a particular measurement that has been selected as the Effective data set will
have a check in the checkbox of the DSEffective column. The original data set of a particular measurement
will have a check in the checkbox of the DSOriginal column (see “Effective Data Sets”).
90
Cedex Analyzer Operator’s Guide
Editing Existing Analysis Results/Data Sets
The Reprocess Button
3
Editing Existing Analysis Results/Data Sets
The Cedex Software allows for existing measurement results or data sets to be modified and reprocessed. These
changes are done on existing Software data (image and analysis results) and, therefore, do not require any
adjustments to the Analyzer. Existing measurement results can be edited via the Reprocess button in the lower
right-hand corner of the Measurement List dialog box.
3.1
The Reprocess Button
Reprocessing existing measurement results/data sets (i.e., viewing a set of image data and evaluating them with
new analysis parameters), can be done in the Reprocess mode, which is only accessible to authorized system
users.
The reprocess mode offers the following options:
cEnter, modify or delete a comment.
cCorrect the dilution (see “Defining the Measurement and Analysis (Process) Parameters”).
cChange the Cell Type (see “Adjustment of the Image Analysis Using the Live OpВeraВtor”).
D
To reprocess a measurement, do the following:
1
Open the Measurement List dialog box by clicking on the List button in the Shortcuts area of the Cedex
Control Center or by selecting the Measurement List option in the Measurements menu of the Cedex
Control Center.
2
Highlight the row of the measurement to be reprocessed and click on the Reprocess button in the
lower right-hand corner. A Measurement dialog box will open containing all of the result data for that
measurement.
3
Enter a new name for the data set in the DataSet section of the Sample Parameters area.
4
Make the desired changes to the new data set. Changes can be made with regard to the comment, dilution
factor and Cell Type in the appropriate sections of the Sample Parameters and Processing Parameters
areas.
5
Click on the Reprocess button in the center of the Measurement dialog box to start the reprocessing of
the measurement based on the new parameters.
6
When the reprocessing is finished, a dialog box will open asking whether the new data set should be the
effective data set (see “Effective Data Sets”).
в– A new data set is available once the evaluation has been completed. All changes can be retraced by viewing previously
created data sets, which are shown in the Measurement List dialog box.
The reprocessing procedure creates additional data sets. Original data is not overВwritten.
Reprocessing of previous measurements cannot be performed while the Cedex Analyzer is measuring a cell
sample.
Software
91
Editing Existing Analysis Results/Data Sets
Effective Data Sets
3.2
Effective Data Sets
When measurements are reprocessed, it is possible to label one of the resultant data sets as Effective. The
Effective data set is the version of the measurement (original or reprocessed) that has the correct parameters.
Once a data set has been selected as Effective, it will be labeled as such in the Measurement List dialog box.
It is possible to later change which data set is labeled the Effective data set by doing the following:
1
Select the data set version of the measurement to be labeled Effective in the Measurement List dialog box.
2
Click on the Reprocess button. A Measurement dialog box will open containing the results for that data
set.
3
Click on the box to the left of the word “Effective” in the Measurement dialog box.
A check will appear in the box.
4
Close the Measurement dialog box.
5
Click on Find in the Measurement List dialog box to refresh the list; the newly selected data set will appear
as the Effective data set.
в– D
92
Cedex Analyzer Operator’s Guide
Graphical Display of the Analysis Results
Enlarging the Histograms
4
Graphical Display of the Analysis Results
In addition to displaying the overall analysis values, the Cedex Software can also display graphic diagrams of the
results. These diagrams can be viewed after the analysis is finished by clicking on the Diagrams button in the
Result Data area of the Measurement dialog box. When the Diagrams button has been selected, the Diagram
dialog box will open. Four different histograms are available: Aggregate Histogram, Cell Diameter Histogram,
Compact Histogram, and Measurement Statistics. Click on the respective button to open the desired diagram.
The Object Diameter Histogram function is present, but no data is delivered by the presently available Cell
Type.
All the results represented in the diagrams are based on valid images accepted for evaluation. This means that
individual images may be sorted out due to poor quality (e.g., bubbles, dirt particles, etc.) in the interest of an
accurate measurement result. This is done automatically by the analysis Software or manually by the user (see
“Excluding Images from the Evaluation Process/Including Excluded Images”).
4.1
Enlarging the Histograms
Certain areas of the histograms can be enlarged by following the instructions below:
1
Place the mouse pointer on the top left-hand corner of the area to be enlarged.
2
Hold the left mouse button pressed down and move it to the lower right-hand corner of the area to be
enlarged.
3
Release the mouse button and the selected area will fill the complete dialog box.
в– D
Return to the original size of the histogram by following the instructions below:
1
Place the mouse pointer anywhere on the diagram and right click with the mouse.
2
A small dialog box will open with the options “Unzoom” or “Undo all Zoom/Pan”.
3
If the chart was enlarged more than once, selecting “Unzoom” will reduce the image to the point before the
last enlargement. Selecting “Undo all Zoom/Pan” will return the chart to its original size.
в– In addition, the diagrams can be moved around within the dialog box by placing the mouse pointer anywhere
in the diagram, holding down the middle mouse button and moving the mouse.
Software
93
Graphical Display of the Analysis Results
Aggregate Histogram
4.2
Aggregate Histogram
The Cedex Analyzer offers an evaluation of aggregates in cell cultures. Click on the Aggregate Histogram
button in the Histograms dialog box to open the corresponding Histogram dialog box.
The Aggregate Histogram shows the number of cells in the cell culture found in aggregates, as well as how
many cells each aggregate is composed of. Both the actual cell number and the percentage distribution can be
displayed.
D
Figure 83: The Aggregate Histogram, detailed view (divided into living and dead cells), here: (absolute) number of cells
The Number of Cells [#] identified is displayed on the y-axis and at the top of the bars. The Aggregate Size, in
terms of the number of cells per aggregate, is given on the x-axis. Figure 83 shows, for example, that 148 living
and 40 dead cells of all identified cells were found in aggregates of two cells.
94
Cedex Analyzer Operator’s Guide
Graphical Display of the Analysis Results
Aggregate Histogram
The percentages can be displayed using the percent button.
Figure 84: The Aggregate Histogram, detailed view (divided into living and dead cells), here: percentage distribution of cells
The percentage of cells [%] found in aggregates compared to the total live or dead cell count is displayed on the
y-axis. The aggregate size, in terms of the number of cells per aggregate, is given on the x-axis. Figure 84 shows,
for example, that 3.66% of all living cells and 7.29% of all dead cells are found in aggregates of two cells.
The Total Cell Count (living and dead cells combined) per aggregate is mapped in the histogram using the total
button. Figure 85 shows, for example, that 188 cells of the measurement are found in aggregates of two cells.
D
Figure 85: The Aggregate Histogram, total view (sum of living and dead cells), here: number of cells
Software
95
Graphical Display of the Analysis Results
Cell Diameter Histrogram
The percentage of cells found in aggregates, in relation to the total cell count, can be displayed using the percent
button as is shown in Figure 86.
D
Figure 86: The Aggregate Histogram, total view (sum of living and dead cells), here: percentage of cells
4.3
Cell Diameter Histogram
Clicking on the Cell Diameter Histogram button will bring up the Cell Diameter Histogram. The Cell Diameter
Histogram represents living cells (!) with a definable diameter. This diagram is based on the single diameters
of all cells in the measurement.
Figure 87: Cell Diameter Histogram
96
Cedex Analyzer Operator’s Guide
Graphical Display of the Analysis Results
Object Diameter Histogram
4.3.1.
Defining Diameter Intervals in the Diameter Histogram
The Cell Diameter Histogram has three sliders that can define separate diameter intervals. This allows for
dividing a histogram into a maximum of four parts. The sliders can be activated by clicking on the corresponding
boxes and moving the sliders to the desired positions. One can also define the margins of the intervals by
entering the numerical values on the left-hand side of each slider.
The borders of the first interval are defined by the minimum value and the first numerical value entered. The
next two values define the upper borders of the second and third intervals. The fourth interval is defined by the
upper border of the third interval and the maximum value.
The number of viable cells, their percentage of the total viable cell number and the viable cell concentrations
[Г—105 cells/ml] are listed in a table for each of the individual intervals.The intervals set in the Cell Diameter
Histogram can be saved for future reference.
4.4
Object Diameter Histogram
Clicking on the Object Diameter Histogram button will bring up the Object Diameter Histogram. Analogous
to the representation of the diameter of the living cells, the diameter of all recognized objects such as cells, debris,
air bubbles and viable and dead cell aggregates may be displayed in this histogram depending on whether the
information is provided by the image analysis Software.
The default image analysis Software (Cell Type: Std. Cells (V5.00)) delivered with the Cedex Analyzer does
not provide any detailed information about objects. Therefore, clicking on the Object Diameter Histogram
button will result in a message that there is nothing to display, and nothing will be shown in the diagram.
Software
D
97
Graphical Display of the Analysis Results
Compactness Histogram
4.5
Compactness Histogram
The ratio between the cell circumference and the cell area is based on an ideal sphere (4p), which is equivalent
to the value >1< on the abscissa of the Cell Compactness Histogram. The extent of variation between the
cell shapes and an ideal sphere is reflected in values being greater than 1. The shape of a cell is known as the
Compactness. Click on the Compactness Histogram button to display a diagram that compares viable (!) cell
shapes to that of an ideal sphere.
If a significant number of cells (ordinate) have a high value, this could indicate improper handling of a sample.
The Compact Histogram can be used to check the state of the cell culture (e.g., if the stirring speed is too high
or nutrient composition is incorrect).
D
Figure 88: Compactness Histogram
This diagram is based on the compactness of all viable cells in the measurement. To view results of individual
cell images, see “Result Data Area”.
98
Cedex Analyzer Operator’s Guide
Graphical Display of the Analysis Results
Measurement Statistics Histogram
4.6
Measurement Statistics Histogram
Click on the Measurement Statistics button to display a column diagram showing the total number of viable
cells (green columns) and dead cells (red columns) found in the images analyzed.
Figure 89: Measurement Statistics Histogram
In the bar diagram, the number of living cells is represented in green bars and the number of dead cells in
red bars on top of the green bars. The Combine button, which appears when the Measurement Statistics
Histogram is open, can be used to combine several images to give a better overview of the whole sample.
Conspicuous bars can thus be immediately identified, and the user can then view and assess the relevant images
(see “Image Area”).
D
The results of each individual image can be seen again by clicking on the Single button.
If an image has been automatically excluded by the Software or manually excluded by the user, the corresponding
position in the diagram will be empty.
Software
99
Cultivation Time Chart
Creating a CTC View
5
Cultivation Time Chart
In the Cultivation Time Chart (cultivation progress/result diagram), the growth patterns of cell cultures can be
graphically evaluated. It is also possible to export and print out the data.
The CTC Views dialog box required for creating a Cultivation Time Chart is opened by clicking on the CTC
button in the Shortcuts area of the Cedex Control Center or by selecting the Cultivation Time Chart option
in the Measurements menu. In the CTC Views dialog box, charts can be created, viewed, edited, exported and
deleted.
A collection of data used for the creation of a particular chart is called a View. Each View can have up to 5
separate series of measurements for comparison of data.
5.1
Creating a CTC View
The CTC Views dialog box has two areas (see Figure 90):
D
cThe View area is used for viewing, exporting, creating and deleting charts. The Filter By section located at
the top of this area is used for finding previously created cultivation time charts.
cThe Series belonging to selected view area is used for creating, editing, listing or deleting the various
measurement series belonging to the View highlighted in the View area.
Figure 90: CTC Views dialog box
100
Cedex Analyzer Operator’s Guide
Cultivation Time Chart
Creating a CTC View
5.1.1.
The View Area
This area is used for viewing, exporting, creating or deleting a View. If no filters have been set, all Views that
have been created will be displayed under the View Name column. If filters have been set, only those Views that
match those filters will appear under this column. To see the chart for a particular View, highlight the row of the
desired view and click on the View Chart button. To create a new View, click on the button New. Highlighted
rows of Views can also be exported with the Export button or deleted using the Delete button.
Previously created views can be searched for using various filter criteria in the Filter By section at the top of
the View area. One can filter by name of the View, username of the creator or by the date a View was created
or modified. Enter the desired parameters and click on the Find button. When searching by date, the checkbox
next to the date must first be checked. After checking the box, clicking on the drop-down menu to the right of
the date will open up a calendar in which the desired date can be selected.
When the button New is selected, a dialog box will open asking for a name for the new View. A name must be
given before a View can be created. Give a name for the new View and click on OK. The new View will appear
highlighted in the left-hand section of the View dialog box. It is now possible to select the desired measurements
for this View using the Series belonging to selected view area at the bottom half of the CTC Views dialog box.
5.1.2.
The Series of Measurements Belonging to Selected View Area
This area is used for creating, editing, viewing and deleting measurement series for a particular View. In order
add to or modify specific measurement series for a particular View, that View must be highlighted in the View
area.
Software
D
101
Cultivation Time Chart
Creating a CTC View
5.1.3.
Adding Measurements to a View
Do the following to find and select measurements for a new View or for a View that has already been created:
D
1
Highlight the View to be modified in the View area of the CTC Views dialog box and click on the New
button on the right-hand side of the Series belonging to the selected view area. This will open the
Selection of Data Series dialog box, in which measurements can be selected for the creation of a View
(see Figure 91).
2
Choose the desired System name in case measurements from other systems that have been imported into
the database should be added to the chart (see “Data Exchange”).
3
Choose the Workarea (base directory in which measurement data are stored), the Reactor ID and the
preferred Data Set (original or effective measurement data, see “Effective Data Sets”).
4
Click on the Find button. All of the Sample IDs associated with that particular Reactor ID will appear in
the upper section of the Selection of Data Series dialog box.
5
Click on the empty column to the left of the measurement to be added to the series in order to highlight
that measurement. Multiple measurements can be highlighted either by holding down the <Shift> or
<Ctrl> key.
6
When all of the desired measurements have been selected, click on the Add selected measurements button.
7
Click on Save. The Selection of Data Series dialog box will automatically close. The CTC Views dialog box
will reappear and show the measurements that have been added to the View in the Series belonging to
the selected view area.
8
To add another series to a View, click on the New button again. The Selection of Data Series dialog box
will open. Follow Steps 2 – 7 above to add measurements to the new series.
9
Up to 5 separate series can be added to one View. Once 5 series have been added to a View, the New button
will no longer be available for that View.
в– Figure 91: Selection of Data Series dialog box
102
Cedex Analyzer Operator’s Guide
Cultivation Time Chart
Creating a CTC View
5.1.4.
Editing Measurements in a View
Measurements can be added or removed from a particular View by using the Edit button in the Series belonging
to the selected view area of the CTC Views dialog box. To edit the measurements found in a View, do the
following:
1
Highlight the row of the View to be edited in the View area of the CTC Views dialog box.
2
Highlight the particular series of a View to be edited in the Series belonging to the selected view area.
3
Click on the Edit button. This will open the Selection of Data Series dialog box
(see Figure 91).
4
Add or remove measurements from the series list by highlighting the measurements and clicking on the
Remove button at the bottom of the dialog box.
5
Click on the Save button. The changes will be saved and the dialog box will automatically close.
6
The CTC Views dialog box will become available and other series in the same View or other Views can now
be edited.
в– Measurements can also be excluded from a Cultivation Time Chart without being removed from the series.
All measurements selected for a series that are marked with a (4) in the checkbox of the Use column will be
displayed in the Cultivation Time Chart. Should it not be desirable to display a particular single measurement,
the measurement can be unselected by removing the (4) in the Use column with a mouse click.
5.1.5.
Viewing List of Measurements in a Series
If measurements have been added to a View, a simplified list of the series will appear in the left-hand side of the
Series belonging to the selected view area of the CTC Views dialog box. To see the full list of all measurements
from all series created, click on the List button. This will open the Series List dialog box (see Figure 92). A search
for specific measurements in the list can be done using the Filter By area in the upper right-hand corner of the
Series List dialog box. Searches can be made by Workarea, Reactor ID or date of measurement. Once the filter
parameters have been set, click on the Find button. The measurements that fit the parameters will be displayed
in the Measurements area in the lower left-hand corner. Only series that contain measurements with the correct
parameters will be displayed in the Series area in the upper left-hand corner of the Series List dialog box.
D
Figure 92: Series List dialog box
Software
103
Cultivation Time Chart
Creating a Cultivation Time Chart
5.1.6.
Deleting Views and Series
Entire Views can be deleted by highlighting the View and clicking on the Delete button in the View area of the
CTC Views dialog box. If one series of a particular View should be deleted, highlight the relevant View in the
View area, then highlight the series to be deleted in the Series belonging to the selected view area. Click on the
Delete button in the Series belonging to the selected view area of the CTC Views dialog box.
5.1.7.
Exporting a View
The series of measurements in a view can be exported via the Export button in the CTC Views dialog box.
Select the View to be exported in the View area of the CTC Views dialog box and click on the Export button. An
Export dialog box will open in which the desired settings and parameters can be selected (see “Export to File”).
5.2
Creating a Cultivation Time Chart
Once a View has been created with the desired series of measurements to be used for a chart, the Cultivation
Time Chart can be created. To create a Cultivation Time Chart, do the following:
D
1
Highlight the View to be used for the creation of a Cultivation Time Chart in the CTC Views dialog box.
2
Click on the View Chart button, this will open the Cultivation Time Chart dialog box (see Figure 93).
3
Select the parameters to be displayed in the chart by clicking on the desired parameters in the Data Selection
area in the upper right-hand corner of the dialog box (see “The Data Selection Area”).
4
Select the series to be displayed in the Chart area in the lower right-hand corner of the dialog box.
5
A graph will then be generated showing the selected parameters and series.
в– Only measurements already loaded will be displayed in the Cultivation Time Chart diagram. The Selection
of Data Series dialog box must be brought up again to add additional measurements.
104
Cedex Analyzer Operator’s Guide
Cultivation Time Chart
Creating a Cultivation Time Chart
5.2.1.
The Data Selection Area
Which curves should be displayed in the diagram is determined in the Data Selection area of the Cultivation
Time Chart dialog box. The following values can be selected for display:
c Viable Cell Conc.: viable cell concentration[Г—105 cells/ml]
c Total Cell Conc.: total cell concentration [Г—105 cells/ml]
c Viability [%]: percent viability
c Total Cell Count: total number of all cells counted
c Avg. Compactness: average compactness of living cells [without unit]
c Avg. Diameter: average diameter of living cells [Вµm]
c Std. Dev.: the deviation from image to image of the number of cells found in each image
c Aggregate Rate [%]: percent of cells found in aggregates
c Dead Cell Conc.: dead cell concentration [Г—105 cells/ml]
c Viable Cell Count: the total number of viable cells counted
c Dead Cell Count: the total number of dead cells counted
D
c Total Object: the total number of objects counted
Click on the appropriate checkboxes to select the desired values.
Figure 93: Cultivation Time Chart dialog box
The measurement series, including information about which measurements have been used to create the chart,
are listed in the Data Series area in the bottom left-hand corner of the Cultivation Time Chart dialog box. A
legend indicating the symbol (form and color) used for each parameter is at the top of the graph. The color used
for each series is indicated in the Chart area in the lower right-hand corner of the dialog box.
The x-axis units can be displayed as either days [d] or hours [h]. Click on the Time[d] below the x-axis to switch
to hours. The x-axis calibration will be automatically recalculated.
Software
105
Cultivation Time Chart
Creating a Cultivation Time Chart
If the mouse pointer is placed over a measurement point in the diagram, detailed information, including the
date and time of the measurement as well as the results, will be displayed next to the point. Also, the graphic
representation can be enlarged or scaled down again with the use of the mouse (see “Enlarging the Histograms”).
5.2.2.
Fitting to the Lowest Common Value
The Fit lowest common value button enables automatic shifting of the zero-point of single measurement series
to each other. The following can be selected:
cViable Cell Density
cDead Cell Density
cTotal Cell Density
By means of this function, the zero-point of each series will automatically be shifted on the x-axis, in order to be
able to better compare the measurement series to each other. The lowest common value of all the measurement
series is automatically determined, and the graphs in the diagram are shifted to each other so that the lowest
common value falls on the x-axis at the same point. While doing so, the left-most point of the graph of all the
measurement points is set at value 0.
D
5.2.3.
Measurement Series Offset
In the graph, measurement series are automatically displayed such that all measurement series begin at time
0. The different measurement series can, however, be best compared to each other when the beginning of the
exponential growth phase (log phase) starts at the same time. Therefore, it is possible to shift the curves in the
diagram by changing the offset for each series.
A button in the Offset column of the Data Series area displays the offset set by the user (the button displays 0 [h],
if an offset was not set). Clicking on this button opens the Measurement Offset dialog box. The measurement
series offset can be then manually shifted in this dialog box.
Figure 94: The Measurement Offset dialog box
The offset can be separately entered for each of the five measurement series by clicking the button with the
corresponding number of the measurement series. Large time differences can be entered in days [d], small
ones in hours [h] by clicking on the appropriate buttons [d]/[h]. The offset can be set by selecting the desired
series number (colored boxes) and then moving the slider to the desired offset. Using the slider will cause an
immediate shift of the measurement series in the diagram so that it can be immediately seen where the best
position for a series is in the diagram.
The smallest time unit that can be set is 0.10 hours. The OK button confirms the offset values in the graphics.
106
Cedex Analyzer Operator’s Guide
Cultivation Time Chart
Creating a Cultivation Time Chart
5.2.4.
Variable Axis Calibration
The buttons lin and log are used to determine whether the y-axis should display in a linear (lin) or logarithmic
(log) scale for cell concentration data. The default value is lin.
The x-axis units can be displayed as either days [d] or hours [h]. Click on the Time[d] below the x-axis to switch
to hours. The x-axis calibration and division will be automatically adjusted.
5.2.5.
The Exponential Regression Button
Using the Exponential Regression button in the View section of the CTC Views dialog box, cell culture growth
patterns can be displayed with their Specific Growth Rate [Вµ] and Doubling Time [T]. The corresponding
values appear in the Data Series list (see Figure 95).
D
Figure 95: The Exponential Regression dialog box
Only viable cell concentration will be shown in this graph. The measurement parameters Specific Growth Rate
[Вµ] and Doubling Time [T] of the culture are computed by means of the differential curve.
Click on the
5.2.6.
to close the Exponential Regression dialog box. The CTC Views dialog box will reappear.
Printing Out a Cultivation Time Chart
Cultivation Time Charts can be printed out via the Print button in the Cultivation Time Chart and the
Exponential Regression dialog box. To print out a chart, click on the Print button. A dialog box will open in
which the printer settings can be selected or the chart can be directly printed. Clicking on the Print button will
open a dialog box with a preview of the page to be printed.
Software
107
General Functions of the System
Data Management
6
General Functions of the System
The Cedex Control Center offers users with the appropriate rights access to a set of functions in addition to the
basic functions of analyzing, modifying and reprocessing samples and measurement results. These functions
allow for easy and user-friendly operations with the Cedex Control Center, although some functions are only
available to the Administrator (see “Administrator Functions”).
6.1
Data Management
6.1.1.
Printing Reports
The main Report menu is located directly on the menu bar of the Cedex Control Center; this menu serves as
direct access to the report functionality for all of the different reports. In addition, Print Report buttons are
located in all of the appropriate dialog boxes (e.g., Measurement List, Audit Trail, etc.). Pre-configured report
templates can be selected for printing reports, and new templates can be created.
D
The following information can be printed out:
c Operational data
Allows the user to track a device’s operating hours, number of measurements and liquid consumption.
c Measurement data
Contains information about measurement parameters and calculated results (e.g., sample identification
data, name and parameters of the Cell Type used, calculated measurement result data, etc.). Select the
desired option for the form in which the result data should be printed via the Name drop-down menu in
the Report Template for the measurement report. Options include:
cStandard (standard measurement report without details)
cFull Details (full report including detailed images, results and histograms)
cList (for multiple measurements displayed in a list)
cMeasurement audit trail (measurement report with audit trail entries)
cMultiple long (for multiple measurements printed one after the other)
c System configuration parameters
Provides a list of system parameters as displayed in the System Options.
c A
udit trail
Provides a statement of all user initiated activities and related data.
c Automatic adjustment and alignment verification
Presents results from the automatic adjustment of focus and brightness.
108
Cedex Analyzer Operator’s Guide
General Functions of the System
Data Management
6.1.2.
Export to File
Exporting measurement result data is done via the Export to file area of the Measurement List dialog box or via
the Export to file option in the Functions menu of the Control Center. Four different formats can be chosen
including CSV, XML, Excel-DIF and Flat file. In addition, a sub-set of parameters to be included in the file can
be selected.
To export measurement results, follow the instructions below:
1
Select the Export to file option in the Functions menu of the Cedex Control Center. The Measurement List
dialog box will appear with the Export To File button located at the bottom of the dialog box.
2
Select a single measurement from the list by clicking on the
field to the left of the desired line.
To choose a set of measurements, hold down the <Ctrl> button while selecting the appropriate lines.
Alternatively, the desired measurements can be searched for using different filter criteria (see “Searching for
Measurements”).
3
Click on the Export To File button. The Export dialog box opens:
D
Figure 96: The Export dialog box
4
In the Export dialog box, individual Parameter and String delimiters can be defined (this only applies to
CSV and Flat files).
5
In the Location area, the target path to be used for storage of the export file is entered. The button
on the
right of the entry field opens a dialog box in which the path can be directly selected. The name of the file will
be automatically generated.
6
To specify a sub-set of parameters to be exported, either click the checkboxes beside the preset options (i.e.,
All Parameters, Cell Data and Overall Results) or select the desired parameters from the Columns to Export
area. To choose a set of parameters, keep the <Ctrl> button pressed while making selections. The preset
options are:
c All Parameters: All parameters about the measurement.
c Cell Data: Data for each and every cell detected in the measurement.
c Overall Results: Results such as average cell diameter, %viability, total cell concentration, viable cell
concentration, etc.
7
In the File format area, select the file format by clicking on the appropriate checkboxes. The files will
automatically and unchangeably receive DIF or CSV file name extensions.
The file format Excel-DIF should always be chosen if a file is to be exported into Excel.
8
Click on the Export Selected Data button.
9
A message dialog box will appear to confirm successful export of information. Click on OK. The
measurement data can then be viewed in the file created.
в– Software
109
General Functions of the System
Data Exchange
6.2
Data Exchange
The Data Exchange function allows for the exchange of a complete measurement package, including all data and
images, between different Cedex Software 2.3.2 databases (DBs). The user can export selected measurements
from one Cedex Software 2.3.2 database and import them into another database. This enables the user to view
a measurement performed on one system within the context of the Cedex Software 2.3.2 on a completely
different system and Control Unit.
Measurement data cannot be exported from a DB and then re-imported back into the same DB. The Archive/
Restore function must be used when the intention is to move measurement data to an external storage media
for possible future restoring to the original DB from which it was moved. See “Archiving Data”, for more
information about archiving measurements.
6.2.1.
Export
In order to exchange measurement data between Cedex Systems, the data first needs to be exported from the
system on which it was created to external storage.
To export complete measurement packages, including data and images, proceed as follows:
D
1
Select the Data Exchange option in the Functions menu of the Cedex Control Center, and choose the
option Export.
A Measurement List dialog box appears with an EXPORT TO DB button located at the bottom of the
dialog box:
Figure 97
2
Select a single measurement from the list by clicking on the field to the left of the appropriate line, or choose
a set of measurements by holding down the <Ctrl> button and selecting the appropriate lines. Alternatively,
search for the desired measurements using filter criteria.
3
Click on the EXPORT TO DB button to open the Export dialog box:
Figure 98
ccc
110
Cedex Analyzer Operator’s Guide
General Functions of the System
Data Exchange
4
Enter the path under which the exported measurements should be stored in the Location area. Alternatively,
the button on the right of the entry field opens Windows Explorer in which the path for the exported
measurement package can be directly selected. Select the preferred path for the measurements and click
on OK.
The Export dialog box reappears.
5
Click on the Export button to start the exporting process. A message appears as soon as export has been
successfully completed. Confirm the message by clicking on OK.
6
Click on
7
Three files are generated for each exported measurement package and stored in the selected location:
to close the Export dialog box.
c CX2 file
c SIG file
c Text document
Figure 99
All three files are required for importing the measurement package into a different Cedex System DB.
Ensure that all three files are always stored in the same location to enable importing of measurement
packages in the future.
в– A default entry for the path under which the export file should be stored can be entered in the System Options
under the Setup menu. Open the Data Exchange tab and look for the ExportPath parameter. In the Value
column, enter the default path (see list of User Preferences and System Options in the Appendix).
D
The following message may appear after selecting the measurements to be exported and clicking on the
�Export’ button:
Figure 100
If this message appears, click on �Yes’ to confirm the message and install the certificate. The export will
continue after confirming the installation of the certificate.
Software
111
General Functions of the System
Data Exchange
6.2.2.
Import
Once the measurement package has been exported from one system to external storage, the data can then
be imported to another database. To import the measurement package into a different Cedex Software 2.3.2
database, follow the instructions below:
1
Ensure that these three files generated when the measurement package was exported are placed in the
same folder (see “Export” ):
c CX2 file
c SIG file
c Text document
2
Select the Data Exchange option in the Functions menu on the Cedex Control Center and choose the
option Import.
The Import from external DB dialog box appears, with ADD and REMOVE buttons located on the righthand side of the dialog box:
D
Figure 101
3
Click on the ADD button; an Open archive files(s)… dialog box opens in which measurements to be
imported are selected.
4
Navigate to the folder where the exported measurement files are stored:
Figure 102
Only the CX2 file is shown in the Open archive files(s)… dialog box. The SIG and text file must be in
the same location in order for the measurement package to be successfully imported, but these two files
are not visible in the Open archive files(s)… dialog box.
5
Select the measurements to be imported, and click on Open.
The Import from external DB dialog box reappears showing the measurement selected for importing and
with the IMPORT button activated:
Figure 103
ccc
112
Cedex Analyzer Operator’s Guide
General Functions of the System
Viewing and Evaluating the Audit Trail File
6
To import further measurements located in other folders, click on the ADD button, and select the
measurements via the Open archive files(s)… dialog box, as described in Steps 4 and 5.
7
Once you have selected all measurements to be imported, click on the IMPORT button to start the import
process. A message appears when the import is successfully completed. Click on OK.
8
Click on
to close the Import From External DB dialog box.
в– It is not possible to import more than 200 measurements at one time.
A default entry for the path under which the import file should be stored can be entered in the System Options
under the Setup menu. Open the Data Exchange tab and look for the ImportPath parameter. In the Value
column, enter the default path (refer to list of User Preferences and System Options in the Appendix).
To view imported measurements that come from a different system and, consequently, have a different System
ID, select the appropriate System ID for those measurements in the SystemName drop-down menu in the
Measurement List dialog box.
6.3
Viewing and Evaluating the Audit Trail File
The Cedex Analyzer Software automatically creates an Audit Trail (log) file for each sample and records all
relevant hardware information relating to the sample. The Audit Trail file data can never be overwritten. This
ensures that all recorded, analyzed and modified measurement data is documented (see “The System Audit Trail
File”).
Software
D
113
General Functions of the System
User Preferences
6.4
User Preferences
The User Preferences dialog box is located under the Master Data drop-down file menu in the Cedex Control
Center (see Figure 104).
Figure 104: User Preferences dialog box with the tab Measurement List Default Filter selected
D
A logged-in user with specific access rights to the User Preferences option can set preferences for a number of
elements, including the result parameters to be displayed in the Multi Run result list and Measurement List
dialog box and default measurement parameters for carrying out measurements.
6.4.1.
Adjusting Result Display in the Measurement List and Multi Run Dialog Boxes
The result data to be displayed in the Measurement List dialog box, as well as the result list area of the Multi Run
dialog box, can be adjusted in the User Preferences dialog box. The numbers in the entry ResultsToShowInList
located under the Measurement List Default Filter tab indicate which types of results will be displayed in the
Measurement List. The numbers in the entry DisplayedResultTypes under the General tab indicate which
types of results will be displayed in the result list of the Multi Run dialog box as follows:
c 1: Avg Diameter
c 5: Avg Compactness
c 6: Viable Cell Count
c 7: Dead Cell Count
c 8: Total Object Count
c 9: % Viability
c 10: Viable Cell Conc.
c 11: Dead Cell Conc.
c 12: Total Cell Conc.
c 13: Std. Deviation
c 14: Total Cell Count
c 15: % Aggregate Rate
The default entry for these fields is 12, 10, 9, which corresponds to Total Cell Conc., Viable Cell Conc. and %
Viability, respectively. The order in which the numbers are listed is the order in which the results will appear in
the lists. To add more results to be displayed, enter the number that corresponds to the desired result parameter
in the fields. Numbers must be separated by a comma with no space in between.
114
Cedex Analyzer Operator’s Guide
General Functions of the System
User Preferences
6.4.2.
Specifying Default Measurement Parameters
The logged-in user with specific access rights to the User Preferences option in the Master Data menu, can
determine the preferred default values for certain measurement parameters (Cell Type, dilution, etc.). The
default parameter settings are only valid for this user. Follow the instructions below to change the default values
for certain measurement parameters:
1
Select User Preferences in the Master Data menu of the Cedex Control Center. This will open the User
Preferences dialog box.
2
Select the Measurement tab in the User Preferences dialog box.
3
Manually type in the appropriate default measurement parameters in the Value column. The defaults for the
following parameters can be determined:
cCellType
cDefaultCombinedNumber (for the Measurement Statistics Histogram)
cMeasurementPrecision
cReactorID
cSampleInitialDilution
cSampleVolume
cWorkarea
4
Put a checkmark in the checkbox of the Save Last column if the last value used for a measurement should
be used as the default for the next measurement.
5
Click on Save to confirm.
6
Close the dialog box. The new default parameters will apply to new measurements.
в– 6.4.3.
D
Specifying Other Default Parameters
Other default parameters can be specified for the Measurement List dialog box, the CTC Views dialog box and
the Audit Trail. Select the following tabs to create or alter default parameters:
c M
easurement Default Filter: Create or alter default parameters for filter settings in the Measurement List
dialog box.
c CTC Views Default Filter: Create or alter default parameters for the filter settings in the CTC Views dialog
box.
c A
udit Trail Default Filter: Create or alter default parameters for the filter settings in the Audit Trail dialog
box.
Software
115
General Functions of the System
Changing Own Password
6.4.4.
Specifying the Workarea for the Analysis Data
The analysis results are stored in the workarea that is selected in the Measurement dialog box before a
measurement is run. If analysis results from a specific workarea are to be viewed, the appropriate workarea
needs to be chosen from the drop-down list in the Measurement List dialog box.
The user can only choose a workarea from the list of workareas to which she/he has been assigned. Only the
Administrator has the right to assign workareas (see “Administration of User Accounts”).
6.5
Changing Own Password
Users may change their own passwords. Follow the instructions below:
D
116
1
Click on the System menu on the Cedex Control Center.
2
Click on Change my Password; the Change password area will appear.
3
Enter your present password in the first field.
4
Enter your new password in the second and third fields.
5
Click on OK to confirm the entry, and a message will confirm the entry.
6
Click on OK to shut the dialog box.
■Cedex Analyzer Operator’s Guide
Administrator Functions
Administration of User Accounts
7
Administrator Functions
The following system functions are generally only available to the Administrator and/or Superuser:
c Administration of user accounts
c Password management and assigning workareas
c Adjustment of the image analysis
c Securing data
7.1
Administration of User Accounts
The user usually has limited access rights. All administration rights relating to user accounts(i.e., creating,
deleting, modifying and delegating rights), should remain exclusively with the Administrator.
All administration of user accounts and rights management is done in the User Rights Management area. To
open the User Rights Management area, click on the Setup menu in the Cedex Control Center and select User
and Rights Management.
The User Rights Management dialog box is structured with menus and sub-menus similar to the directories in
Windows Explorer (see Figure 105). The distinction between functions, roles, users and groups, which is mainly
connected to the delegation of rights, is explained in the appropriate sections of this chapter. Password settings
can also be configured in this area.
7.1.1.
Creating User Accounts
D
Before creating new user accounts, the password configurations should be set up (see “Password Management”).
Follow the instructions below to create a user account:
1
Click on the Setup menu in the Cedex Control Center.
2
Click on User and Rights Management; the User Rights Management dialog box will appear.
3
Right click on the All Users folder and click on Create new user. The User account area will appear.
4
Enter the user’s first name and last name in the first and second rows and a username for the account in the
third row.
5
Enter a temporary password for this user account in the fourth field. Click on Save to confirm. If the option,
“must change on first login” is selected, the user will be forced to change the password the first time he or
she logs into the Cedex Control Center.
6
Restart the Cedex Software application.
в– A user is only authorized to carry out measurements after he has been assigned at least one work area.
Software
117
Administrator Functions
Administration of User Accounts
7.1.2.
Assigning Access Rights
The user is normally denied access rights to certain areas, for example administration of user accounts and
sensitive system functions (focus adjustment, creating SST-Checkpoints, etc.). The user, therefore, cannot
access all of the menus on the Cedex Control Center after login.
Access rights can be modified at any time by the Administrator. Rights are generalized in user roles that can
comprise a single access right or a set of access rights. To grant rights, you will need to assign one or more user
roles to a user. The following user roles are available after installation of the Software:
cAdministrator
c Production Staff
c Research Staff
cSuperuser
cSupport
By default, the pre-installed Production Staff, Research Staff and Support roles have no functions assigned to
them. More detailed information about creating functions for each pre-set user role, as well as editing existing
functions and creating new user roles, can be found under “Creating and Editing User roles”.
D
Follow the instructions below to assign rights to a user account:
1
Click on the Setup menu in the Cedex Control Center.
2
Click on User and Rights Management, and the User Rights Management dialog box will appear.
3
In the All Users main menu, open the user account menu that is to be modified.
A User Role sub-menu will appear.
4
Open the All Roles main menu and drag the appropriate user role from the All Roles menu into the All
Users sub-menu. The access rights available for this user role will be added to the account. To deny certain
access rights, the corresponding user role needs to be deleted from the All Users sub-menu. Right click the
user role which is to be deleted and click on Remove the role from the user.
в– Figure 105: User Rights Management dialog box
118
Cedex Analyzer Operator’s Guide
Administrator Functions
Administration of User Accounts
7.1.3.
Creating User Groups
It is possible to generalize one or more user accounts in user groups. Instead of assigning rights to a single user,
a user role or a set of user roles can be assigned to a user group. The whole user group, therefore, receives all
access rights that have been assigned to the user roles.
To create a user group and add user accounts, proceed as follows:
1
In the User Rights Management area, right click on the User Groups main menu and click on Create
new user group.
2
A name for the new group can be entered in the User Group dialog box.
3
Click on OK to add user group to User Groups list.
4
Open the All Users main menu and drag from it the desired user account into the appropriate user group
sub-menu. The user is added to the user group and receives all access rights assigned to this group. A user
can be added to one or more user groups.
в– 7.1.4.
Editing and Deleting User Accounts
The first name, last name and username of a user account can be edited if, for example, an existing user is to be
replaced by a new user with identical access rights. A user account can also be deleted in the editing area.
Proceed as follows to edit a user account:
1
Click on User and Rights Management, and the User Rights Management dialog box will appear.
2
Open the All Users main menu and right click the user account menu to be edited.
3
Click on Edit the user and the User Account dialog box will appear. The name, last name, username,
password and priority can be changed.
4
Click on the Deleted checkbox if the user account is to be deleted.
5
Click on Save to store the changes.
D
в– In order to avoid confusion, the Software will not allow for the creation of a new user with the same user
name as a user name that has been deleted. Measurements that have been run under a user name that has
been deleted are still available for viewing.
Software
119
Administrator Functions
Administration of User Accounts
7.1.5.
Creating and Editing User Roles
Rights are generalized in user roles that comprise a single access right or a set of access rights. In the User Rights
Management area, access rights are called functions. It is necessary to determine the different responsibilities
for the different roles and, therefore, functions they should have access to.
Five standard user roles are pre-installed by the Software. All of the roles are suggested roles that could be used
for setting up specific distribution of access rights:
c Administrator: The Administrator is allowed to use all administrative functions of the system. He is not
allowed to use any operational functions.
c Production Staff: It is intended for members of the Production Staff who are only allowed to use specific
operational functions depending on company policies (i.e., execute measurements, execute an SST, change
consumables).
c Research Staff: Members of the Research Staff who could be allowed to use all operational functions of the
system.
c Superuser: The Superuser is allowed to use all operational functions of the system mainly for maintenance
purposes.
D
c S upport: Support of the Cedex System by Roche Technical Service requires access to all operational functions
similar to the Superuser role.
Access to the System Options should be restricted to the Administrator, Superuser and Support. All options
necessary for a user to modify his workplace according to his needs can be found under User Preferences.
Only selected users should be authorized to edit SST-Checkpoints. See “Creating SST Checkpoints” for
further information.
Follow the instructions below to create a new user role:
1
In the User Rights Management dialog box, right click on the All Roles main menu and then click on
Create new role.
2
A name for the new role can be entered in the Role dialog box.
3
Click on OK to add the new user role to the All Roles list.
в– To add rights to or delete rights from an existing user role, proceed as follows:
1
Open the user role menu that is to be modified in the All Roles main menu. A Role Functions sub-menu
will appear.
2
Open the All Functions main menu and drag from it the desired functions into the Role Functions
sub-menu. These functions will be added to the user role. To delete certain functions from the User Role
sub-menu, right click on the desired function and select Remove the function from the role.
в– 120
Cedex Analyzer Operator’s Guide
Administrator Functions
Password Management
7.2
Password Management
The Cedex Software has been equipped with a detailed password management that is compliant with CFR 21
Part 11 guidelines.
7.2.1.
Specifying Password Characteristics
Password settings can be specified and changed in the User Rights Management dialog box. The following
password settings can be configured:
Composition rules
Min characters /Min digits
Minimum requirements for the number of characters and digits used.
Min length /Max length
Minimum and maximum length of the password.
Attempts to login
Number of times wrong passwords can be entered consecutively before this user
is denied access. Only the Administrator can reverse denial of access by issuing
a new password. The user will be warned before the last allowed attempt.
Password …
never expires
Passwords never lose their validity.
expires in
Number of days after which passwords lose validity.
Warn the user
Number of days before password expiration to warn the user.
Old password can
be reused after
Number of new passwords that must be used before old password can be
reused.
Use blacklist
The so-called BlackList can be used to restrict selection of passwords to only those
that fulfill a specific security standard. This list contains passwords that are not
allowed to be used. The list is empty after installation of the Software by default.
D
The Administrator can enter incorrect passwords without limits with an extended time period after each
retry.
7.2.2.
Assigning New Passwords
Follow the instructions below:
1
Click on User and Rights Management, and the User Rights Management dialog box will appear.
2
Open the All Users main menu and right click on the user account menu that is to be edited.
3
Click on Edit the user and the User Account dialog box will appear.
4
Enter new password in the corresponding line (Password).
5
Click on Save to store the change.
в– Software
121
Administrator Functions
Assigning Work Areas
7.3
Assigning Work Areas
The analysis results from a measurement are organized in work areas. A user needs to be assigned to at least
one work area to be able to run a measurement, otherwise an error message will appear. All measurement data
produced by this user will be saved in the work area selected during execution of measurements. The user can
only work with measurement data from work areas to which he has been assigned. New work areas can be
created and assigned to one or more users via the User Rights Management area.
Follow the instructions below to create and delegate work areas:
1
Click on the Setup menu on the Cedex Control Center.
2
Click on User and Rights Management. The User Rights Management dialog box will appear.
3
In the All Users main menu, open the user account menu that is to be assigned the work area. A User
Workareas sub-menu will become available.
4
Open the All Workareas main menu and drag the desired work area into the User Workareas sub-menu.
This work area will be added to the user account.
в– D
122
To later deny access to a work area, follow the instructions below:
1
Open the User Workareas sub-menu in the user account that is to be modified.
2
Right click on the work area that is to be removed and click on Remove the workarea from the user.
■Cedex Analyzer Operator’s Guide
Administrator Functions
The System Options
7.4
The System Options
The System Options dialog box, in which system parameters are configured, is located in the Setup menu on
the Cedex Control Center. Only those users who have been given access to the System Options function, for
example, the Superuser and Support, can change system parameters.
Setting system parameters includes several changes and modifications, some of which are explained in detail
in the sections below. The parameters are organized based on the application areas that are affected (e.g.,
Measurement, Hardware, Data Exchange).
See “System Options and User Preferences” in the Appendix for a detailed description of all of the System
Options.
The Cedex Software may need to be restarted in order for changes in the Systems Options to take effect.
All elements in the System Options that have not been explicitly described in this Operator’s Guide must not
be changed without prior arrangement with Roche Diagnostics. In all cases, contact must be made with the
local Roche Technical Service before any such changes are made.
Access to the Systems Options should be restricted to only the users who are responsible for maintenance of
the system! Changing default values in the Systems Options dialog box can have an adverse effect on the
system and measurement results.
7.4.1.
Automatically Start the Hardware Management
If the AutomaticallyStartHardware parameter is active (entry “1” in the Value column), the hardware
management will automatically be initialized when the Software is started. To turn off this function, set the
value to “0” in the Value column.
7.4.2.
D
Modifying the Standard Setting for the Multi Sampler DefaultCup
The default setting for the Multi Sampler DefaultCup (Cedex Sample Cup position used for Prime, LM
ShutDown, focus calibration and all cleaning routines) is position 1 on the Multi Sample Tray. The default
position can be changed to any other position. To change the position for the DefaultCup location, do the
following:
1
Open the System Options dialog box and click on the General tab.
2
Look for the parameter DefaultCupPosition. The number entered in the Value column will determine the
position for the DefaultCup on the Multi Sample Tray.
3
Click on Save to confirm the change.
в– The position chosen for the Multi Sampler DefaultCup does not influence measurements. All 20 positions on
the Multi Sample Tray can be used for measurements. Should a sample be present in the DefaultCup position
during Prime, LM ShutDown, calibration or any cleaning routines, it can no longer be used for measurements.
Software
123
Administrator Functions
The System Options
7.4.3.
Turning Off Automatic Incrementation of Sample Cup Position
In the case of single measurements run via the Measurement dialog box on a Cedex Analyzer with a Multi
Sampler attached, the Software will automatically incrementally increase the sample cup position number with
each new measurement. To switch off this feature, do the following:
1
Open the Systems Options dialog box and click on the Measurement tab.
2
Look for the parameter SuggestNextCupPosition.
3
Select 0 from the drop-down menu to turn off the feature.
4
Click on Save to confirm the change.
в– When 0 has been selected, the suggested cup position will always be the same.
7.4.4.
D
Error Level Displayed to Users
Errors in the Software and hardware will be displayed to the user in the form of an error message. The
level of error that will result in the display of an error message depends on the setting of the parameter
ErrorLevelDisplayToUser in the General tab of the Systems Options dialog box. The following levels are
available:
c
c
c
c
Level 1 (Fatal): fatal error, system/hardware crash.
Level 2 (Critical): Error as a result of invalid measurement.
Level 3 (Error): Error, but the result does not cause an invalid measurement.
Level 4 (Warning): Information for user.
If, for example, the ErrorLevelDisplayToUser is set at Level 1, only error messages regarding system or hardware
crashes will be displayed to users. The factory-installed default for the ErrorLevelDisplayToUser is set at Level
3 (Error).
7.4.5.
Liquid Container Configuration
In the Liquid Container Configuration area, the minimum and maximum liquid levels for reagent and waste
containers can be set. To open the Liquid Container Configuration dialog box proceed as follows:
1
Click on the Master Data menu on the Cedex Control Center.
2
Click on Liquid Container Configuration and the dialog box will appear.
в– Maximum and minimum volumes can be defined using this dialog box. When standard sized containers are
used, it is not advisable to change default settings for the Min volume and Max volume.
It is also possible to define a Warn Level and a Lock Level. The standard default for the Warn Level is 6. This
means that a warning message will appear if the amount of reagents left is 6 ml or less. The standard setting for
the Lock Level is 3, which means that the system will be locked (i.e., no further measurements will be possible)
if there are only 3 ml left.
The settings for the Warn Level and Lock Level can be changed. Saving changes will immediately update the
estimation of the number of remaining measurements.
124
Cedex Analyzer Operator’s Guide
Administrator Functions
Adjustment of the Image Analysis Using the Live Operator
7.4.6.
Disabling the Reagent Control
The Reagent Control function keeps track of the amount of reagents used and notifies the user when the levels
are running low. The function can be disabled in the General tab of the System Options dialog box. The
Reagent Control function is enabled when the value for the DisableReagentControl entry is set to “0”. To
disable the function, set the value to “1”.
7.4.7.
Default Settings
In general, Research or Production Staff users should not be assigned access rights to the System Options dialog
box in which default settings that apply to the whole system can be configured. However, some parameters
needed to customize the individual workplace (e.g., definition of the default settings for certain measurement
parameters) can be found under User Preferences (see “User Preferences”).
7.5
Adjustment of the Image Analysis Using the Live Operator
The Cell Type (operator) selected for a measurement takes care of the image evaluation. Roche has put in one
pre-setting:
cStd. Cells (V5.00) for normal-sized cells with a diameter of about 12 Вµm (e.g., HB58).
Individual adjustments of the operator can be helpful or necessary for cell cultures that, for instance, have an
unusual optical appearance or for a counting strategy that deviates from the Cedex Analyzer (e.g., counting
aggregates differently).
D
Adjustment of the operator is referred to as creating a new Cell Type. A new Cell Type can be created or an
already existing Cell Type can be re-adjusted. This can be done with the help of eight parameters that influence
the way in which an image is evaluated.
Each of these parameters directly influences the image processing strategy and, hence, the measurement
results. In the available Software version, an algorithm with the pre-setting mentioned above is available. The
parameters of the factory installed pre-setting are overwritable.
For data safety reasons the parameters of the factory installed pre-setting should not be altered. Since original
settings are overwritable, caution should be advised for all authorized users.
7.5.1.
Description of the Cell Type List and Live Operator
The Live Operator dialog box, in which Cell Types can be created and modified, is accessed in two ways:
cVia the Measurement dialog box in the View mode.
cVia the Cell Type List option in the Master Data menu on the Cedex Control Center.
Software
125
Administrator Functions
Adjustment of the Image Analysis Using the Live Operator
7.5.2.
The Cell Type List Dialog Box
To open the Live Operator dialog box directly from the Measurement dialog box when it is in the View mode,
click on the Live Operator button located in the middle of the Measurement dialog box.
When the Cell Type List option in the Master Data menu is selected, the Cell Type List dialog box will open
(see Figure 106). There are several options in this dialog box including:
c New: Create new Cell Types
c Edit: Modify existing Cell Types
c View: View existing Cell Types
c Delete: Delete existing Cell Types
c Live Operator: Open the Live Operator dialog box
D
Figure 106: Cell Type List dialog box
126
Cedex Analyzer Operator’s Guide
Administrator Functions
Adjustment of the Image Analysis Using the Live Operator
7.5.3.
Creating a New Cell Type
A new Cell Type must be created and saved via the Cell Type dialog box before the Live Operator dialog box
can be opened for modification of that Cell Type.
A new Cell Type can be created by following the instructions below:
1
Open the Cell Type List dialog box. Highlight the existing Cell Type upon which the new Cell Type should be
based.
2
Click on the New button. A message will appear asking if the new Cell Type should be based on the
highlighted Cell Type in the list. Click on Yes. The Cell Type dialog box will open (see Figure 106). The Live
Operator button will be inactive at this time.
3
Fill in the information for:
c The name of the new Cell Type
c Sample preparation procedure (Std. is currently the only option)
c Focus Offset: the offset from the ideal focus point.
The Focus Offset should be set to 0 to ensure best results for cell count and determination of
viability. Please consult local Roche Technical Service before using any other number for the Focus
Offset as selecting another value for this parameter may lead to poor results. Note that the Sedimentation
Duration does not apply to the Cedex Standard Analyzer.
Make sure that the IR Operator is set to CXStdImageOperator.
4
Click on the Save button. The Cell Type dialog box will automatically close. The Cell Type List dialog box
will be active again and include the just-created Cell Type in the list.
5
Highlight the row of the new Cell Type and click on the Edit button. The Cell Type dialog box will reopen
and the Live Operator button will be active.
6
Click on the Live Operator button and the Live Operator dialog box will open (see Figure 108).
7
In the Data Source area, select the Work Area, followed by the Reactor ID, Sample ID and Data Set of
the measurement for which the image analysis should be improved. The parameters for the loaded measurement
are preset.
8
Select an image of the measurement in the Image ID section. This image will be loaded and displayed in the
dialog box in the upper right-hand corner, with the living cells marked with a green circle and the dead cells
marked with a red circle.
9
Make the desired modifications on a single parameter first. As soon as a parameter has been modified,
reprocessing of the data is automatic (see “Description of the Individual Operator Parameters”). The image
display then shows the reprocessed image (see “Working with the Live Operator”).
10
When an optimized adjustment of the Operator parameters has been found, click on Save to confirm the
modification for the new Cell Type.
D
в– When Cancel is clicked on, the Live Operator dialog box will close without saving the changes.
Software
127
Administrator Functions
Adjustment of the Image Analysis Using the Live Operator
7.5.4.
Editing an Existing Cell Type
An existing Cell Type can be modified. However, it is NOT advisable for data safety reasons to modify an
existing Cell Type that has been used for measurements. A new Cell Type based on an existing Cell Type
should be created instead.
Follow the instructions below to modify an existing Cell Type (not advisable!):
1
Select the Cell Type to be edited from the list of Cell Types at the top of the Cell Type List dialog box and
then click on the Edit button. The Cell Type dialog box will open.
2
Modify the following information if desired:
cThe name of the Cell Type
c Sample preparation procedure (Std. is currently the only option)
c Focus Offset
D
3
Make sure that the IR Operator is set to CXStdImageOperator.
4
Click on the Live Operator button in order to modify other parameters within the Live Operator dialog box
for that Cell Type (see “Working with the Live Operator”).
5
In the Data Source area, select the Work Area, followed by the Reactor ID, Sample ID and Data Set of
the measurement for which the image analysis should be improved. The parameters for the loaded measurement
are preset.
6
Select an image of the measurement in the Image ID section. This image will be loaded and displayed in the
dialog box in the upper right-hand corner with the living cells marked with a green circle and the dead cells
marked with a red circle.
7
Make the desired modifications on a single parameter first (see “Description of the Individual Operator
Parameters”). As soon as a parameter has been modified, data reprocessing is automatic. The image display
then shows the reprocessed image.
8
When an optimized adjustment of the Operator parameters has been found, click on Save to confirm the
modifications.
9
Click on Cancel to close the dialog box without saving any changes.
в– 7.5.5.
Viewing an Existing Cell Type
Select the Cell Type to be viewed from the list of Cell Types at the top of the Cell Type List dialog box and then
click on the View button. The Cell Type dialog box will open in which the information for focus point (Focus
Offset) and sedimentation time (Sedimentation Duration) can be viewed. Click on the Live Operator button
in order to view other parameters within the Live Operator dialog box for that Cell Type (see “Description of
the Individual Operator Parameters”).
128
Cedex Analyzer Operator’s Guide
Administrator Functions
Adjustment of the Image Analysis Using the Live Operator
7.5.6.
Deleting an Existing Cell Type
Select the Cell Type to be deleted from the list of Cell Types at the top of the Cell Type List dialog box and then
click on the Delete button. A confirmation box will appear, asking the user if he/she wants to delete the Cell
Type. If confirmed, the Cell Type will be deleted and disappear from the list.
All parameters of the measurements are logged. Deleted Cell Types have no influence on future measurements,
but the parameters of deleted Cell Types used for past measurements will still appear in the printed reports
of those measurements.
D
Figure 107: Cell Type dialog box
7.5.7.
Working with the Live Operator
The Live Operator dialog box can be opened via the Cell Type List dialog box, the Cell Type dialog box and the
Measurement dialog box. If the Live Operator button in a Measurement dialog box containing specific results
is clicked on, the Live Operator will open with the images of that measurement already loaded. If the Live
Operator is opened via the Cell Type or Cell Type List dialog boxes, the first measurement in the Measurement
List will be loaded.
In the Live Operator dialog box, some of the 8 parameters can be displayed on the screen at the same time.
Parameters at first not visible can be scrolled into view using the scroll bar under the Operator Parameter
display. The table below displays the positions and settings of the 8 Operator parameters. See also “Description
of the Individual Operator Parameters” for a detailed description of each parameter.
Software
129
Administrator Functions
Adjustment of the Image Analysis Using the Live Operator
Identifier
Minimum
Maximum
-20
20
0
40
250
110
DeadAppearance
-10
10
0
DeadAggregateMin
250
1500
360
DeadAggregateMax
1500
5000
2250
DeadAggregateApp
-10
10
0
0
20
7
5000
30000
5400
LivingAppearance
DeadSize
BorderWidth
MinPollutionArea
Std. Cells
(V5.00)
Table 1: A list of the Operator parameters
After loading a measurement (Reactor ID and Sample ID) and selecting an image, the selected image is displayed
in the upper right-hand corner of the Live Operator dialog box. Each single cell detected by the Cedex Analyzer
is marked as dead (red circle) or living (green circle).
D
Figure 108: Setting parameters for Cell Type Standard Cells
130
Cedex Analyzer Operator’s Guide
Administrator Functions
Adjustment of the Image Analysis Using the Live Operator
In the Process Data area, the values for new and previous results are displayed for viable cells (the number of
living cells of the current image), dead cells (the number of dead cells of the current image) and %viability.
If an Operator parameter is modified, the newest values will appear under New column when an automatic
reprocessing of the selected image is finished. The values of the previous processing are displayed under
Previous column. Thus, direct comparison to each previous evaluation is possible.
The labeling of the cells can be switched on and off in the upper right-hand corner in order to allow for better
evaluation of the results from changes in parameter settings. If multiple parameter changes should be made at
the same time, remove the checkmark in the Automatic process box by clicking on it. When the checkmark is
removed, the button Process now becomes active. Make all changes, then click on the Process now button for
an analysis based on the new parameter settings.
7.5.8.
Description of the Individual Operator Parameters
LivingAppearance (Living Cells’ Appearance)
Range: [-20, 20], Default: 0, Unit: [absolute measure].
This parameter influences the recognition of living cells. When the value of this parameter is set high, contrastweak objects are also counted as living cells provided they additionally fulfill the size criterion. The lower this
value is set, the more contrast an object must have for it to be counted as a viable cell.
If the value is changed to positive, shadowy and greyish objects are increasingly counted as living cells. Such a
change is sensible if, for example, the optical image shows little contrast due to the structure of the medium or
of the cells in the medium.
D
In standard situations, a change of this parameter can result in the labeling of debris as cells!
DeadSize (Dead Cells’ Size)
Range [40, 250], Default 110, Unit [ВµmВІ].
Defines the minimum cross-sectional area of a particle in ВµmВІ. Increasing this value means that fewer particles
will be recognized as dead cells.
DeadAppearance (Dead Cells’ Appearance)
Range [-10, 10], Default 0, Unit [absolute measure].
This parameter influences the recognition of dead cells. If the value is set high, contrast-weak objects are also
counted as dead cells as long as they additionally fulfill the size criterion. The lower this value is set, the sharper
the contrast an object must have in order to be counted as a dead cell.
DeadAggregateApp (Dead Cells’ Aggregate Appearance)
Range [-10, 10], Default 0, Unit [absolute measure].
Defines the automatic evaluation of a dead cell aggregate (cluster).The cross-sectional area of dead cell
aggregates are automatically partitioned into single cells. Increasing this value means that there are more single
cells determined in the aggregate.
Software
131
Administrator Functions
Adjustment of the Image Analysis Using the Live Operator
DeadAggregateMax (Dead Cells’ Aggregate Maximum)
Range [1500, 5000], Default 2250, Unit [ВµmВІ].
Defines the maximum cross-sectional area of a dead cell aggregate (cluster). The dead cell aggregate area within
this range is automatically partitioned into single cells. Any aggregate larger than the specified maximum area
is not taken into account.
DeadAggregateMin (Dead Cells’ Aggregate Minimum)
Range [250, 1500], Default 360, Unit [ВµmВІ].
Defines the minimum cross-sectional area of a dead cell aggregate (cluster). When this size is reached, it is then
automatically partitioned into single cells.
MinPollutionArea (Minimum Pollution Area)
Range [5000, 30000], Default 5400, Unit [ВµmВІ].
Defines the minimum cross-sectional area of the pollution size (e.g., debris particles, air bubbles, etc). Any
pollution size larger than the specified minimum area results in the entire image being excluded.
D
132
BorderWidth [Вµm]
Range: [0, 20], Default: 7, Unit: [pixels].
The border frame around the image not used for evaluation.
The Borderwidth should not be adjusted in general. Consult with Roche Technical Service before making any
adjustments to this parameter.
The use of the sliders, especially in combination, can lead to unexpected results.
Cedex Analyzer Operator’s Guide
Administrator Functions
Archiving Data
7.6
Archiving Data
The objective of the archive function is to secure measurement for future reference data by exporting it to
external storage media. Measurement data must be secured at regular intervals and thereafter deleted from
the Measurement List in order to ensure enough storage capacity on the Cedex Control Unit. All data from
a single or a set of measurements, or optionally only the images, can be deleted from the database once the
measurement or measurements have been archived.
Archiving should only be carried out by the Administrator and selected users.
Measurement data can later be restored from the archive, but restoring the data is only possible using the Cedex
System database from which the data has been archived.
Measurement data cannot be archived from one Cedex Software 2.3.2 database and restored to a different
Cedex Software 2.3.2 database. The Data Exchange (Import/Export) function must be used when
the intention is to import measurement data into a different database. See “Data Exchange” for more
information about the Data Exchange function.
All data should also be backed up on a regular basis. Archiving does not replace a back-up strategy. Back-ups
of the database should be carried out on a regular basis. See “Backing up the Database” for more information.
7.6.1.
Archive
To archive measurement data, proceed as follows:
1
Open the Functions menu in the Cedex Control Center and select the Archive function found within the
Archiving menu.
A Measurement List dialog box appears with an ARCHIVE button at the bottom of the dialog box:
D
Figure 109
2
Select a single measurement from the list by clicking on the field on the left of the appropriate line, or
choose a set of measurements by holding down the <Ctrl> button and selecting the appropriate lines.
Alternatively, search for desired measurements using filter criteria.
ccc
Software
133
Administrator Functions
Archiving Data
3
After measurements have been selected, click on the ARCHIVE button.
The Archive dialog box opens:
Figure 110
4
Enter the path under which the archive files should be stored in the Location area. Alternatively, the button
on the right of the entry field opens Windows Explorer in which the path can be selected directly.
5
Click on Save. The Archive dialog box reappears.
6
(Optional) If desired, choose one of the following options in the Archive dialog box:
cDelete records: selecting this option results in measurements, including all respective images, being
simultaneously archived to the selected target location and deleted entirely from the local Cedex Software
database.
cDelete only images: selecting this option results in the selected measurements, including all respective
images, being simultaneously archived to the selected target location while images only are deleted from
the local Cedex Software database.
If no checkmark is placed in either box, measurements will be archived and simultaneously retained in the
local Cedex Software database.
D
7
Click on the Archive button to start the archiving process. A message appears as soon as archiving of
information is completed successfully. Click on OK.
8
Click on
9
Three files are generated for each archived measurement package and stored in the selected location:
to close the Archive dialog box.
c CX2 file
c SIG file
c Text document
Figure 111
All three files are required for restoring the measurement package back into the Cedex Software DB.
Ensure that all three files are always stored in the same location to enable restoring of measurement
packages in the future.
в– A default entry for the path under which the archive file should be stored can be entered in the System Options
dialog box under the Setup menu. Open the Data Exchange tab in the Systems Options dialog box and look
for the ArchivePath parameter. In the Value column, enter the default path.
The following message may appear after selecting the measurements to be archived and clicking on the
Archive button:
Figure 112
If this message appears, click on �Yes’ to confirm the message and install the certificate. The archive will
continue after confirming the installation of the certificate.
134
Cedex Analyzer Operator’s Guide
Administrator Functions
Archiving Data
7.6.2.
Restore
To restore measurement data, follow the instructions below:
1
Ensure that all three files generated when the measurement package was archived are placed in the same
folder (see Archive):
c CX2 file
c SIG file
c Text document
2
Select the Archiving option in the Functions menu on the Cedex Control Center and choose the option
Restore.
The Restore dialog box appears, with ADD and REMOVE buttons located on the right-hand side of the
dialog box:
Figure 113
3
Click on the ADD button; an Open archive files(s)… dialog box opens in which measurements to be
imported are selected.
4
Navigate to the folder where the archived measurement files are stored:
D
Figure 114
Only the CX2 file is shown in the Open archive files(s)… dialog box. The SIG and text file must be in
the same location in order for the measurement package to be successfully restored, but these two files
are not visible in the Open archive files(s)… dialog box.
5
Select the measurements to be restored, and click on Open.
The Restore dialog box reappears showing the measurement selected for importing and with the IMPORT
button activated:
Figure 115
6
To restore further measurements located in other folders, click on the ADD button, and select the
measurements via the Open archive files(s)… dialog box, as described in Steps 4 and 5.
ccc
Software
135
Administrator Functions
Archiving Data
7
Once you have selected all measurements to be restored, click on the RESTORE button to start the restore
process. A message dialog appears when the measurements have been successfully restored. Click on OK.
8
Click on
to close the Restore dialog box.
в– 7.6.3.
Deleting Archived Data
Only data that has been archived can be deleted from the Cedex System database. Archived data still located in
the database can be searched for and displayed in the Measurement List dialog box.
D
Figure 116: Measurement List dialog box with archived measurement shown
To delete archived data, do the following:
1
Click on the Archived measurements(s) checkbox in the upper right-hand corner of the Measurement
List dialog box.
2
Click on Find to display archived measurements. Highlight measurements to be deleted by clicking on the
field on the left of the appropriate line. When choosing a set of measurements, hold the <Ctrl> button
down while selecting the appropriate lines.
3
Click the checkbox beside Delete records if all measurement data is to be deleted from the system
database. If the option Delete only images is chosen, all data apart from the images will stay in the system
database.
4
Click on the Delete button to delete selected measurements from the Control Unit database.
в– 136
Cedex Analyzer Operator’s Guide
Administrator Functions
Archiving Data
7.6.4.
Reducing the Size of the Database After Archiving Data
The Archive function does not decrease the size of the database file after archiving measurements, even if the
checkbox to delete the measurements and images has been selected. The space where deleted data was removed
is only assigned to be overwritten by future measurement data. Therefore, the size of the database file will
remain the same until the assigned database space has been filled with new data.
Since a large database may cause the Cedex Software to slow down, the database file size should be reduced
if the size of the file exceeds 10 GB. Reduce the database file size with the use of the “CX2_backup.bat” and
“CX2_restore.bat” batch files located on the Cedex Software 2.3.2 CD under “User Additional Features\
Reducing the Database File Size”. Step-by-step instructions for this procedure, “Reducing Cedex Database
Filesize” are located in the folder “User Additional Features\Reducing the Database File Size” on the Cedex
Software 2.3.2 CD.
D
Software
137
Administrator Functions
Backing up the Database
7.7
Backing up the Database
In addition to the complete measurement data (including the images), the database contains also the entries
for the System Options and User Preferences. A backup system should be implemented to avoid any loss of data
in case of a computer failure and to allow access to measurement results after a long period of time. A backup
creates a copy of the current database on a second medium that then exists in addition to the original database.
Creating a backup copy enables restoration of the database with the copy in case of data loss or corruption of
the original database. This is especially useful for the full restoration of a system (e.g., crash recovery).
7.7.1.
Basic Backup of the Database
The easiest way to back up the Cedex Software 2.3.2 database is to copy the complete database file, Cedex.fdb,
to a different medium (e.g., portable hard drive, network, etc.) at regular intervals. In case of a crash, after the
necessary reinstallation of the Software, the database file can simply be replaced by the backup file.
To create a backup of the Cedex Software 2.3.2 database, do the following:
D
1
Shut down the Cedex Client and Cedex Server.
2
Open a Windows Explorer window.
3
Navigate to the C:\ folder and select the folder Cedex2 (default path C:\Cedex2). Press <Ctrl+C> (Copy)
to copy the complete C:\Cedex2 folder, which contains the database file (Cedex.fdb).
4
Navigate to the external hard drive, network share, etc., where the backup should be stored.
5
Press <Ctrl+V> (Paste) to initiate copying of the Cedex2 folder to the new location.
6
Wait until the copying process has been completed successfully. This may take several hours, depending on
the size of the database.
в– 7.7.2.
Incremental Backup of the Database
Because the basic backup method may be time-consuming and use a lot of memory space, Roche recommends
an incremental backup procedure. An incremental backup is a method whereby multiple backups are kept. The
backups are incremental in the sense that each original piece of backed up information is stored only once, and
successive backups only contain the information that has changed since a previous backup.
An incremental backup can be created with a tool available for the Firebird DBMS - Database Management
System, nbackup, located on the Cedex Software 2.3.2 CD. More information about the nbackup tool is
provided in the file “nbackup_firebird back up” located in the folder “User Additional Features\Backing up
the Database” on the Cedex Software 2.3.2 CD.
138
Cedex Analyzer Operator’s Guide
E
Maintenance and Care
The Analyzer should be regularly serviced to guarantee optimal performance and maximize the life span of the
Cedex Analyzer.
This includes the following maintenance procedures:
c Recurrent manual maintenance and cleaning routines when necessary.
c Cleaning routines with the Liquid Management.
c Cleaning and maintenance of the Syringe Module.
c Maintenance of the capillary tubes.
cMaintenance of the flow chamber, the microscope optic and the 8-way valve. This maintenance routine
must be carried out only by an authorized service technician.
This chapter provides detailed instructions and guidelines for each individual cleaning and maintenance procedure.
E
Maintenance and Care
139
Cleaning and Maintenance Checklist
1
Cleaning and Maintenance Checklist
This checklist shows when each cleaning and maintenance routine should be done.
Carry out these routines on a daily basis:
c LM Shutdown: always after the last measurement and before a Cedex Analyzer shutdown.
If a Prime has been scheduled to be automatically run the next morning, the Hardware Management should
not be shut down as a Prime can only be run when the Hardware Management is active (see “Scheduling
Automatic Cleaning Routines”).
c S tandard Clean: after the final measurement of a set of samples or before a longer pause between measurements.
c Chamber Clean 2: at least twice a day.
Carry out these routines on a weekly basis:
c Intensive Clean
c Change of Trypan Blue solution
The following routines should be done every week for users that refill reagents themselves:
c Empty the reagent containers and the waste container.
c Thoroughly clean the containers.
c Refill the reagent containers (see “Refilling Containers Individually”)
Carry out this routine twice per month.
E
140
c Special Intensive Clean: at least twice a month with 0.1 – 1 N HCl instead of detergent.
Carry out these routines on a regular basis (once a week or after 250 measurements):
c C
lean the casing, Reagent Tray, Multi Sampler housing (if installed) and Reagent Port by wiping down with
70% alcohol and a lint-free cloth.
c R
un a focus adjustment of the Analyzer every month or after any change of position or vibration of the
measurement system.
Cedex Analyzer Operator’s Guide
Scheduling Automatic Cleaning Routines
2
Scheduling Automatic Cleaning Routines
Routine cleaning operations can be scheduled so that they are automatically included in the process queue.
Depending on the settings, the cleaning operations are automatically run at a pre-defined time or after certain
events.
To create a new entry in the schedule, proceed as follows:
1
Select Scheduling from the Functions menu in the Cedex Control Center. The Schedule dialog box will
appear.
2
Click on New to open the Schedule process dialog box.
3
Select the Process that is to be included in the schedule from the drop-down menu at the top of the dialog
box. The available processes include both cleaning routines (e.g., Fast Clean) and Hardware Management
routines (e.g., Prime, LM Shutdown).
4
Select one of the three options with regard to the time schedule for an automatic process:
c Every: The process is automatically run at the selected interval of one or more days. A specific time of the
day for operation can also be set.
c After an event: The process is automatically run after system startup or after a selectable number of
measurements.
c After certain time of inactivity: A certain amount of time of inactivity can be defined after which the
process is run automatically. If the only once box is checked, the scheduled process will only be run
once, even if there is another period of inactivity afterwards.
5
Click on Save to add the entry to the Schedule list. The Schedule process dialog box will automatically
close and the Scheduling dialog box will reappear showing the newly scheduled process in the list.
в– Scheduled processes can also be edited and deleted by highlighting the appropriate row in the Schedule dialog
box and then clicking on the Edit or Delete buttons. Clicking on the Edit button will open the Schedule process
dialog box in which the process can be edited.
When scheduling an LM Shutdown or a Prime, it is important to ensure that the Hardware Management
is not shut down before the scheduled Prime or LM Shutdown is run (e.g., the hardware is shut down in the
evening before a scheduled Prime is to be performed in the morning). Prime and LM Shutdown can only be
executed if the Hardware Management is active.
Maintenance and Care
E
141
Daily and Manual Maintenance and Cleaning Routines
Checking the Reagent Containers When Manually Refilling
3
Daily and Manual Maintenance and Cleaning Routines
The following cleaning and maintenance routines should be carried out on a regular basis or whenever necessary.
3.1
Checking the Reagent Containers When Manually Refilling
Empty reagent containers lead to wrong measurement results and can cause a dry run, thereby damaging the
syringe and the 8-way valve. Regular checks of the liquid level are done via the Reagent Kit Status dialog box,
which is located under the Functions menu.
For safety reasons, the liquid level of the individual reagent containers, as well as the capillary positions,
should also be manually checked before each measurement and, if necessary, replaced or refilled. For detailed
information, see “Refilling Containers Individually”.
Cleaning the reagent containers when manually re-filling
All reagent containers must be thoroughly cleaned at regular intervals and rinsed with distilled or deionized
water. Impurities caused by dust or fluff must absolutely be avoided! The Trypan Blue is especially critical as it
can become contaminated with microorganisms. In the case of such contamination, exact measurements are no
longer possible. If the Trypan Blue solution is contaminated, intense areas may be visible in the image that will
make image analysis difficult or even impossible.
Replacing the reagents after 5 days is recommended. For detailed information, see “Refilling Containers
Individually”.
E
3.2
Cleaning Routines Carried Out by the Liquid Management
The Liquid Management plays a key role in the Cedex Analyzer. It is necessary to Prime the system at the
beginning of the day, and to carry out an LM Shutdown prior to shut down of the system in the evening (see
“Carrying Out an LM Shutdown and HW Shutdown”).
The Liquid Management automatically runs an Ultra Fast Clean routine after every sample measurement.
During the Ultra Fast Clean (approx. 30 seconds), the entire Liquid Management system, including capillary
tubes, flow chamber and sample port, are rinsed out thoroughly.
Manual cleaning routines can be carried out in the Cleaning dialog box. To open the Cleaning dialog box,
click on the Clean button in the Shortcuts area of the Cedex Control Center or select Cleaning routines in the
Functions menu (see Figure 117).
Figure 117: The Cleaning dialog box of the Analyzer
142
Cedex Analyzer Operator’s Guide
Daily and Manual Maintenance and Cleaning Routines
Cleaning Routines Carried Out by the Liquid Management
3.2.1.
Cleaning Options
The following cleaning routines can be run manually:
c Fast Clean
c Standard Clean
c Intensive Clean
c Chamber Clean 1
c Chamber Clean 2
Fast Clean and Standard Clean involve the entire Liquid Management system including capillary tubes, flow
chamber and sample port. Therefore, always ensure that there is a Cedex Sample Cup attached to the sample
port to prevent flooding.
Fast Clean (with detergent, and distilled water for approx. 60 seconds)
The entire Liquid Management system is rinsed with distilled water, then with detergent and finally with
distilled water. Use this routine between measurements to remove dirt particles and air bubbles quickly from
the flow chamber.
Standard Clean (with cleaning solution, detergent, and distilled water for approx. 90 seconds)
The entire Liquid Management system is rinsed with distilled water, cleaning solution, detergent and finally
with distilled water again. This routine removes dirt particles and is used after measuring a set of samples or
before a longer pause.
Intensive Clean (with cleaning solution, detergent, and distilled water for approx. 20 minutes)
The flow chamber is thoroughly rinsed with distilled water, cleaning solution, distilled water, detergent and
finally distilled water. The detergent remains in the flow chamber for a longer period to work on resistant
particles.
The Intensive Clean routine is used on weekly basis to remove heavy and resistant contamination of the flow
chamber, capillaries tubes, syringe and 8-way valve. Even the smallest dirt particle attached to the glass wall
of the flow chamber can negatively influence a measurement. See also “Live View of the Flow Chamber”. If
measurement values within a sample measurement show large variations, this could indicate that the flow
chamber is soiled.
E
Intensive Clean with HCl
A special Intensive Clean is required twice per month for a thorough cleaning. For this cleaning, a solution of
0.1 – 1 N HCl is used instead of detergent.
Follow the instructions below:
1
Remove the Detergent container and replace it with an appropriate container with a 0.1 – 1 N HCl solution,
taking care that the capillary tube reaches far enough into the solution.
2
Start Prime.
3
Start Intensive Clean after Prime has ended.
4
Replace the HCl container with the Detergent container at the end of the Intensive Clean process.
5
Start Prime again.
6
Start Standard Clean after Prime has ended.
в– Maintenance and Care
143
Daily and Manual Maintenance and Cleaning Routines
Cleaning Routines Carried Out by the Liquid Management
The Chamber Clean 1 and Chamber Clean 2 cleaning routines are only required for the flow chamber.
Chamber Clean 1 (with water for approx. 10 seconds)
The flow chamber is rinsed at high pressure with distilled or deionized water being drawn in through the
syringe. Use this routine to remove resistant protein aggregates, fluff particles or other obstructions from the
flow chamber.
Chamber Clean 2 (with water, detergent, and air for approx. 30 seconds)
This routine is more intense than the Chamber Clean 1 procedure. Once the flow chamber is rinsed with water
and detergent, the remaining liquid in the capillary tubes between the syringe and valve head is drawn through
the flow chamber and then pressed back again with compressed air.
Use this routine twice daily to remove resistant protein aggregates, fluff particles or other obstructions from the
flow chamber.
3.2.2.
The Hardware Management Dialog Box
Prime and LM Shutdown can be executed in this dialog box. An LM Shutdown must be carried out after the
last measurement has been run and before shutting down the Cedex Software. The Liquid Management system
is then prepared for an extended pause, such as overnight or on the weekend.
An LM Shutdown is automatically preceded by a Standard Clean routine. The 8-way valve is then rinsed
with distilled or deionized water to prevent crystallization, and compressed air finally presses the Trypan Blue
solution back into its container (see “Carrying Out an LM Shutdown and HW Shutdown”).
E
3.2.3.
Carrying Out a Cleaning Routine
The different cleaning routines always have the same starting procedure. Ensure that there is always a Cedex
Sample Cup attached to the single sample port or placed in the DefaultCup position on the Multi Sample Tray.
Follow the instructions below:
1
Click on the Clean button in the Shortcuts area of the Cedex Control Center or else select Cleaning
Routines in the Functions menu. The Cleaning dialog box will open.
2
Click on the appropriate button (e.g., Fast Clean) to automatically start the cleaning routine.
в– The Cedex Analyzer is blocked during the cleaning routine, and the duration is continuously displayed in the
Estimated Total Time field.
144
Cedex Analyzer Operator’s Guide
Daily and Manual Maintenance and Cleaning Routines
Live View of the Flow Chamber
3.2.4.
Interrupting/Terminating a Cleaning Routine
Use the EMERGENCY STOP button to interrupt the cleaning routine immediately if any leaks are detected in
the Liquid Management system, even in the case of an Ultra Fast Clean being carried out automatically.
The Intensive Clean procedure can be interrupted to shorten the long detergent phase in the flow chamber.
Click on the Cancel button, which is only activated during the long detergent phase, in the Liquid Management
dialog box.
3.3
Live View of the Flow Chamber
The Live View option can be activated by clicking on the appropriate checkbox in the Cleaning dialog box. This
function allows for monitoring of the area in the flow chamber from which images are taken in order to check
the effectiveness of a cleaning routine. In the Previous area, an image of the previous state of the flow chamber
is displayed while the Current area on the right presents a live view of the flow chamber after a cleaning routine
has been carried out. The Live View should be turned off while a measurement or cleaning routine is being
carried out. If it has not been turned off, the Live View will be automatically stopped and the message, “warning:
live view has been stopped automatically”, will appear in the message area of the Cedex Control Center.
E
Maintenance and Care
145
Automatic Adjustment
4
Automatic Adjustment
The automatic adjustment adjusts the focus position to ensure that images of consistent quality are taken
during measurements.
The service technician will carry out a focus adjustment before the initial operation of the Cedex Analyzer.
The focus adjustment is always necessary after the Analyzer has been moved. Additionally, Roche recommends
running a focus adjustment once per month for control purposes. Both the brightness and the focus on the
objects to be examined are optimally set during this focus adjustment. The focus adjustment lasts approximately
20 minutes and is done with the Cedex Calibration Beads included in the contents of delivery.
If at all possible, the Analyzer should never be turned off. If it is necessary to turn it off, the Analyzer needs at
least 2 hours to warm up before an Automatic Adjustment can be carried out.
Proceed as follows to do the focus adjustment:
1
Open the Functions menu in the Cedex Control Center’s menu bar.
2
Click on Automatic adjustment to open the Automatic Adjustment and Alignment Verification dialog
box.
3
Pipet 1 ml of a well-mixed bead solution (Cedex Calibration Beads) into a Cedex Sample Cup.
4
Attach the Cedex Sample Cup to the sample port, or place the Cedex Sample Cup in the DefaultCup position
on the Multi Sample Tray (see “The Multi Sampler DefaultCup”).
5
Click on the Start Automatic Adjustment button. You will be asked to verify that the beads have been
prepared. Click on OK to confirm and start the adjustment process.
в– E
146
Cedex Analyzer Operator’s Guide
Automatic Adjustment
Figure 118: The Automatic Focus Adjustment dialog box after adjustment
The automatic adjustment is automatically carried out in several steps. First, water is pumped into the flow
chamber, after which the Cedex Calibration Beads are injected into the flow chamber.
The complete path of the microscope stage is scanned as it moves to its lowest and then to its highest position.
Based upon the obtained image information, a preliminary focus position is set. The area around the located
focus position is then examined closely and scanned several times to find the optimal focus.
An automatic cleaning of the flow chamber and the capillaries is done at the end of the adjustment. The focus
adjustment’s time-progression is displayed as an estimated value in the form of a blue progression bar.
The focus quality for every stage/focus position is displayed in a diagram. A distinct peak around the middle of
the graph indicates the optimal focus position.
The following criteria can be inspected to evaluate the result of an automatic focus adjustment:
cVerify that the pink line marking the newly set focus lies within close range of the distinct peak.
E
cNew and previous focus position values are both displayed in the message box appearing at the end of the
focus adjustment. Ensure that variations between these values don’t exceed a range of +/-30.
cThe image quality should be checked. A valid image shows clearly outlined beads with a bright cell interior.
If any one or more of these criteria is not met, an authorized service technician must re-adjust the Cedex
Analyzer.
The Automatic Adjustment and Alignment Report can be printed out via the Print Report button.
Maintenance and Care
147
Syringe Maintenance
Removing the Syringe
5
Syringe Maintenance
M
oving parts of the Syringe Module may cause hand injuries. Never run a measurement on the
Cedex Analyzer without the protective cover for the Syringe Module in place. When performing a syringe
maintenance, be aware of the risks from moving parts.
The flow chamber, tubes, syringe and 8-way valve are cleaned during the Intensive Clean routine carried out by
the Liquid Management (see “Cleaning Options”).
However, the syringe is subject to wear and tear and must, therefore, be regularly replaced to maximize the life
span of the 8-way valve and to guarantee optimal performance. The syringe should be replaced approximately
every 6 months under normal use of the Analyzer. More frequent use may require more frequent changing of
the syringe.
To change the syringe, follow the steps specified in the sections below:
5.1
Removing the Syringe
Follow the instructions below:
E
1
Click on Syringe Maintenance in the Functions menu of the Cedex Control Center. The Syringe Maintenance dialog box will open (see Figure 119).
2
Click on the Remove Syringe button. The syringe barrel will be moved to a position to allow easy removal.
3
Remove the protective cover.
4
Hold the syringe barrel by the Luer lock and turn it counter clockwise to remove it from the 8-way valve
(see Figure 120).
5
Once the connection is loosened, keep holding the syringe barrel in an upright position beneath the 8-way
valve to prevent it from jamming with the plunger.
6
Remove the bottom screw that connects the plunger to the Syringe Module with the other hand.
7
Remove the syringe from the Syringe Module.
в– Figure 119: Syringe Maintenance dialog box
148
Cedex Analyzer Operator’s Guide
Syringe Maintenance
Assembling and Installing the Syringe
Luer lock
Syringe barrel
Bottom screw connecting plunger to Syringe Module
Figure 120: Syringe
5.2
Assembling and Installing the Syringe
Rinse a new syringe with 70% alcohol and then with distilled or deionized water before installing it.
E
Follow the instructions below:
1
Gently press the plunger into the syringe barrel.
2
Insert the syringe back onto the Syringe Module.
3
Hold the syringe barrel by the Luer lock and turn it clockwise into the port of the 8-way valve.
4
Secure the plunger to the Syringe Module with the screw at the bottom. Ensure that the syringe barrel and
plunger do not get jammed.
5
If the Syringe Maintenance dialog box has not been opened yet, select Syringe Maintenance in the
Functions menu on the Cedex Control Center.
6
Click on the Install button. The plunger will be correctly positioned and the Syringe Module initialized.
7
Ensure that there are no leaks in the Liquid Management system. This can be done with one of the cleaning
routines in the Cleaning dialog box. Interrupt the cleaning procedure immediately with the EMERGENCY
STOP button if there are any leaks in the Syringe Module.
8
Put the protective cover back on.
в– Never use the Cedex Analyzer without the protective cover on the Multi Sampler and Syringe Module.
Maintenance and Care
149
Syringe Maintenance
Maintenance of the Syringe Guide and Spindle
5.3
Maintenance of the Syringe Guide and Spindle
The syringe guide and spindle are mounted on either side of the Syringe Module inside the casing (see Figure
121). They should be lubricated twice a year (or, when necessary, more often, for example, if you hear noises
coming from the syringe guide) with the lubricant supplied by your local Roche representative to guarantee
optimal performance of the syringe.
Follow the instructions below:
1
Remove the syringe (see “Removing the Syringe”).
2
Switch off the Cedex Analyzer.
3
Lubricate the top part of the syringe guide and spindle.
4
Switch on the Cedex Analyzer.
5
Click on Install in the Syringe Maintenance dialog box.
6
Switch off the Cedex Analyzer.
7
Lubricate the bottom part of the syringe guide and spindle.
8
Switch on the Cedex Analyzer.
9
Click on Remove Syringe in the Syringe Maintenance dialog box.
10
Install the syringe (see “Assembling and Installing the Syringe”).
E
в– Syringe guide
Spindle
Figure 121: Syringe Guide and Spindle
150
Cedex Analyzer Operator’s Guide
Maintenance of the Flow chamber, Microscope Optic, 8-Way Valve and the remaining Hardware Components
6
aintenance of the Flow chamber, Microscope Optic,
M
8-Way Valve and the remaining Hardware Components
To ensure that the Cedex Analyzer functions uninterruptedly, maintenance work is necessary at regular intervals.
An arrangement for a maintenance contract with your local Roche representative is recommended. During
maintenance, worn-out and defective components are replaced and the functioning of the Cedex Analyzer
checked.
Only an authorized service technician is permitted to carry out maintenance when the Cedex Analyzer needs
to be opened!
7
Operational Data
The Cedex System keeps track of some operational data including operating hours, number of measurements
and liquid consumption. Select Operational Data in the Functions menu of the Cedex Control Center to open
the Operational Data dialog box.
The values on the left-hand side of the dialog box can be set to 0 by clicking on the Reset button. This can be
useful for tracking the operational information for short periods of time. The values on the right-hand side
track the overall operating hours, number of measurements and liquid consumption. These values cannot be
reset.
A report of the operational data can be printed out via the Print Report button.
E
Maintenance and Care
151
The System Suitability Test (SST)
Creating SST Checkpoints
8
The System Suitability Test (SST)
To ensure proper operation of the Cedex Analyzer and valid analysis results, it is essential that the system is
in good condition. The majority of the critical parameters are regulated by design or preventive maintenance
activities carried out by local Roche Technical Service. The routine checkups performed by the user of the Cedex
Analyzer mainly focuses on the liquid management process (such as flow chamber, capillaries, etc.).
A feature of the Cedex Software 2.3, the System Suitability Test (SST), is designed to help monitor the state of
the system for quality supervision/assurance purposes. A routine checkup procedure that meets the system
owner’s specific needs can be created using the SST Software feature.
Verification that the Analyzer is in the required condition comprises both manual checks (internal as well as
external scrutiny of the equipment, for example chamber inspection) and various checkup and calibration
measurements. These individual procedures are known as SST checkpoints. When an SST is set up on a Cedex
System, checks and measurements will have to be performed on a regular basis. Passing the checkpoints will
then be mandatory for normal continuation of measurement procedures.
The System Suitability Test consists of different types of SST checkpoints. Each checkpoint needs to be created
and its parameters, including the acceptance criteria, configured by an authorized user (the Superuser or
Administrator). Once created and activated, the checkpoints apply to the whole system.
8.1
E
Creating SST Checkpoints
The System Suitability Test consists of different types of SST checkpoints. There are two main types of
checkpoints: an SST requiring inspection or maintenance activity performed by the user (e.g., syringe change,
chamber inspection) and SST procedures involving measurements with either Cedex Control Beads or Density
Reference Standard Beads. In order to pass a checkpoint involving Control Beads measurements, the average
result of a pre-defined number of one or more measurements needs to be valid according to the checkpoint
criteria. A checkpoint requiring an inspection or maintenance activity demands an active confirmation in the
System Suitability Test dialog box that the activity or inspection has been performed.
Each checkpoint needs to be created and its parameters, including the acceptance criteria, configured by an
authorized user. For this, authorized users need to be assigned the SST edit function. Users who perform SST
procedures only need access to the SST run function. Once created and activated, the checkpoints apply to the
whole system.
On some systems, an inactive list of proposed SST checkpoints may be automatically provided in the System
Suitability Test List dialog box. To activate these checkpoints, click in the box under the Active column for
the checkpoint. A checkmark will appear in the Active column, which indicates that the checkpoint has been
activated.
152
Cedex Analyzer Operator’s Guide
The System Suitability Test (SST)
Creating SST Checkpoints
8.1.1.
Creating SST Checkpoints with and without Measurements
To create a new SST Checkpoint, proceed as follows:
1
Click on SST in the Functions menu to access the System Suitability Test List dialog box, or click directly
on the SST button in the Cedex Control Center.
2
Click on the New button and the System Suitability Test New dialog box will appear. Using this dialog box,
a measurement checkpoint or a manual checkpoint can be created.
3
To create a checkpoint for a manual check or maintenance activity, click on the SST Without Measurement
button. This will open the System Suitability Test New dialog box that allows for the creation of a
checkpoint for a manual check. Enter an SST Name (e.g., Flow Chamber) and an SST Description that
provides sufficient information for any user performing this SST.
4
To create checkpoints for calibration measurements, click on the SST including Measurement button. The
appropriate System Suitability Test New area will appear. A set of parameters needs to be defined. See
Table 2, for a detailed description of the parameters.
5
Click on the Save button to create a new SST checkpoint. The checkpoint will immediately be added to the
System Suitability Test List.
6
Clicking on Close will close the dialog box without creating an SST checkpoint.
в– Parameters for SST including Measurement:
SST Name / SST Description
Enter an SST Name and Description for identification purposes during routine
checkup procedures.
Overall Type
Select the characteristic that is to be inspected during the measurements for this
checkpoint (e.g., Total Cell Count, Total Concentration) from the drop-down list.
Cell Type /Measurement
Precision/ Sample Volume /
Sample Initial Dilution
Define different measurement parameters for different checkpoints to verify
operational reliability in various situations.
Target Value
The Target Value serves as benchmark for the acceptance criteria. It can be
based, for example, on the average result of a set of measurements carried out
with Cedex Control Beads.
Offset
The offset in % determines the acceptance range applicable to the results of SST
measurements carried out for this checkpoint based on the target value entered.
Target Value Check /
Upper Limit / Lower Limit
If the Target Value Check is activated, the user carrying out SST measurements
can enter another target value before running the first SST measurement for this
checkpoint (e.g., when a new container of Control Beads is used). Acceptable
limits for what can be entered by a user for the variable target value are set using
Upper Limit and Lower Limit fields.
E
Note: the Upper Limit and Lower Limit fields are not related to the acceptable
range for results from an SST measurement. The acceptable range for results is
determined by the % entered in the Offset field.
Fixed Target Value
If the target value is not entered by users, the Fixed Target Value must be
activated.
Count For Passing
Count for Passing refers to the number of SST measurements that has to be
carried out for this checkpoint.
Table 2: SST parameters for SST with Measurement
Maintenance and Care
153
The System Suitability Test (SST)
Creating SST Checkpoints
In general, the Target Value is determined before the SST checkpoint is activated. For further information
on the procedure for the determination of a target value, Roche Technical Service provides appropriate
recommendations. It is necessary to re-determine the target value if a new container of Cedex Control Beads
is used.
An SST checkpoint includes a validity period. This can be set in the System Suitability Test List in the Days
Valid column. After this period of time, the SST procedures must be performed. If the SST procedure is not
performed within the validity period, all measurements apart from SST measurements will be prohibited (e.g.,
the system status is changed to MeasurementLock).
8.1.2.
Running a Water Blank
Before an SST including Measurement can be run, a water blank (Water For Injection [WFI]) should be run to
check the condition of the reagents. No more than 20 counts should be recorded for this measurement. This can
be scheduled using the SST including Measurement button (see “Creating SST checkpoints with and without
measurements”). The WFI measurement requires a relative deviation rather than an absolute deviation, which
means that 0 cannot be used as a Target Value as a relative deviation from 0 will always be 0.
Therefore, when setting up a WFI measurement, the Target Value should be set to 10 with a relative deviation
of 100%. This will result in an acceptance range of 0 – 20 objects (see Table 2).
8.1.3.
Setting up the SSTFailureReaction in the System Options Menu
The reaction of the system to an SST failure depends on the configuration in the System Options. The System
Options dialog box can be accessed under the Setup menu on the Cedex Control Center:
E
1
Open the System Options dialog box and click on the General tab.
2
Look for the parameter SSTFailureReaction.
cEntering Restrict in the Value column will lead to prohibition of any further measurements, including SST
measurements, in the event of an SST failure. This will require a manual unlocking of the system in the
Lock – Unlock System area before measurement activity can be resumed (see “Locking – Unlocking the
System”).
cIf Warning is entered, measurement activity can be continued but there will be a warning about SST
failure before a measurement is carried out.
cChoosing the Audit option will simply lead to a log entry in the audit trail file in the case of an SST failure.
There will not be any restrictions or warnings.
3
Click on Save to store the change.
в– Measurements that are run despite the fact that not all SST procedures are up to date or valid will have no
checkmark in the SST Valid box in the Measurement dialog box.
154
Cedex Analyzer Operator’s Guide
The System Suitability Test (SST)
Performing an SST
8.2
Performing an SST
All procedures related to the System Suitability Test can be controlled via the System Suitability Test List. To
access the list, open the Functions menu in the Cedex Control Center and click on SST or directly click on the
SST button in the Cedex Control Center.
The System Suitability Test List provides an overview of all SST checkpoints and their current status. Valid SST
checkpoints are displayed in black while red indicates an invalid checkpoint. SST checkpoints need to be carried
out at regular intervals, the length of these intervals being specified in the Days Valid column. To confirm a
checkpoint, either manual checks have to be done or measurements need to be carried out.
It is recommended to include confirmation of checkpoints in the daily/weekly work routine and not to wait
until the validity period of a checkpoint has expired.
8.2.1.
Performing an SST with Measurements
If the SST to be performed requires a measurement or series of measurements, do the following:
1
Select SST from the Functions menu on the Cedex Control Center. Alternatively, click on the SST button in
the Shortcuts area of the Cedex Control Center. The System Suitability Test List dialog box will appear.
2
Select the SST checkpoint to be confirmed by clicking on the
3
Click on Run SST to start the SST procedure. The System Suitability Test Measurement Run dialog box
will appear. The parameter settings can be viewed but not altered.
4
Whether or not the Target Value can be changed depends on configuration. If the Fixed Target Value option
is not activated, the user will be able to change the target value. However, if the Target Value Check is
activated, the user will have to enter a value within the defined limits (Upper Limit, Lower Limit).
5
Click on Run to start the SST measurement. The Measurement dialog box will appear and the measurement will be carried out automatically.
6
Close the Measurement dialog box.
7
Repeat measurement as often as required for this checkpoint (see note below).
field to the left of the appropriate line.
в– E
The Count For Passing value given in the System Suitability Test Measurement Run dialog box indicates
the number of measurements that have to be carried out for this checkpoint. The average value will be
calculated from all of the measurements required for a particular SST checkpoint.
The average value of all test measurements needs to be within the acceptance range. The acceptance range is
defined by the target value and the offset (in %). In the event of an invalid SST measurement, the system will
immediately be locked. Once in SSTLock, the system needs to be unlocked manually by authorized users before
any further SST or other types of measurements can be carried out.
If the average result of all test measurements for an SST checkpoint is valid, the checkpoint will automatically
be displayed in black.
Maintenance and Care
155
The System Suitability Test (SST)
Tracking Trends in SST Results Over Time
8.2.2.
Performing an SST without Measurements
For SST procedures that don’t require any measurements, clicking on the Run SST button will open the System
Suitability Test Run dialog box. The SST Name and/or Description should provide information regarding the
nature of the manual check or the maintenance step that needs to be taken. Once the System Suitability Test
Run dialog box has been opened, do the following:
1
Perform the required inspection or maintenance routine.
2
Click on the Valid checkbox in the middle of the System Suitability Test Run dialog box if inspection or
maintenance procedure was successful.
3
Add a comment in the Comment box (optional).
4
Click on the Save button to confirm the completion of the SST check and return to the System Suitability
Test List dialog box.
в– If the valid checkbox has been activated, the checkpoint will automatically be displayed in black in the System
Suitability Test List dialog box.
E
Figure 122: System Suitability Test List dialog box
On some systems, an inactive list of proposed SST checkpoints may automatically be provided in the System
Suitability Test List dialog box. Check with the Administrator to see if these SST checkpoints should be
activated.
8.3
Tracking Trends in SST Results Over Time
The results of SST checkpoints can be tracked over time using the SST Trending button. Trends for both
checkpoints with and without measurements can be tracked.
8.3.1.
Tracking Trends in SST Checkpoints with Measurements
To see all of the results over time from a particular SST checkpoint with measurements, do the following:
1
Select the SST checkpoint to be monitored by clicking on the
2
Click on the SST Trending button to open the Trending list for SST with measurement dialog box (see
Figure 123).
field to the left of the appropriate line.
в– 156
Cedex Analyzer Operator’s Guide
The System Suitability Test (SST)
Tracking Trends in SST Results Over Time
All of the measurements for the selected SST checkpoint are listed in this dialog box. The Filter by area in the
bottom left-hand corner can also be used to search for and list specific measurements based on date run and
Reactor ID. The information in the Trending list for SST with measurement dialog box can be exported via the
Export button or printed via the Print button.
The SST checkpoint results are displayed in the result column in the units of the Overall Type selected for that
particularly SST checkpoint. Clicking on the normalized view checkbox will normalize the results to the target
value and display the differences in percent.
To create a chart showing result trends over time, do the following:
1
Click on the use checkbox to mark the measurements that should be included in the calculations for the
trending chart. A
indicates that the measurement will be used. All measurements will be included on the
Trending Chart, but excluded measurements will be circled in red and not used for curve calculations.
2
Click on the Trending Chart button to create a Trending Chart.
в– Figure 123: Trending list for SST with measurement dialog box
Clicking on the Trending Chart button will open a Trending Chart dialog box showing all of the SST measurements
(marked ♦ on the chart) (see Figure 124). If multiple measurements were required for a particular checkpoint,
the average of the measurements is marked by ♦, while the results from the individual measurements for that
checkpoint are marked with an Г—.
E
In addition, the following parameters are included:
c Target value
c Upper limit
c Lower limit
c Invalid checkpoints (s)
c Mean value
c Moving average
c Variation coefficient
The Trending Chart can be enlarged or reduced (see “Enlarging the Histograms”), and can be printed out via the
Trending chart print button.
Maintenance and Care
157
The System Suitability Test (SST)
Tracking Trends in SST Results Over Time
Figure 124: Trending Chart dialog box
There are several additional options in the Trending Chart dialog box. Excluded measurements can be removed from
the chart completely by clicking on the show excluded checkbox to remove the checkbox. For SST checkpoints
with multiple measurements, the individual measurements can be removed from the chart by removing the
checkmark in the box next to single measurements, leaving only the average of the measurements.
E
Clicking on the normalized view checkbox will normalize the results to the target value and display the
differences in percent. Both the mean curve and the moving average curve can be shown or hidden by selecting
or de-selecting the appropriate checkboxes.
8.3.2.
Tracking SST Checkpoints without Measurements
To see results from SST checkpoints without measurements over time, do the following:
1
Select the SST checkpoint to be monitored by clicking on the
highlight the whole line.
2
Click on the SST Trending button to open the Trending list for SST without measurement dialog box
(see Figure 125). All of the measurements for the selected SST checkpoint are listed in this dialog box.
field to the left of the appropriate line to
в– The Trending list for SST without measurement dialog box shows all comments given for each SST check that
was made and indicates whether the checkpoints passed or not. The list can be printed out via the Print button
or exported in either a CSV or Excel-DIF format via the Export button.
Figure 125: Trending list for SST without measurement dialog box
158
Cedex Analyzer Operator’s Guide
The System Suitability Test (SST)
Locking – Unlocking the System
8.4
Locking – Unlocking the System
Measurements that are carried out after the validity period of an SST checkpoint has expired are marked as
invalid in the Audit Trail. In addition, the system may be locked for any further routine measurements except
SST measurements.
The System Status describes the capability of the system for performing certain tasks involving the hardware.
The current state of the system can be viewed in the Change System Status dialog box, which is accessed by
selecting the Lock – Unlock System option in the System menu of the Cedex Control Center (see Figure 126).
The state of the system is set automatically depending on the validity of all SST checkpoints, and the
configuration of the SSTFailureReaction parameter in the System Options. Depending on the configuration,
if an SST checkpoint is out of date, only SST measurements can be carried out. No routine measurements will
be possible (Current State: MeasurementLock). Once all SST checkpoints are up to date and valid again, the
system is fully usable and the Current State is automatically set to SystemOK.
In the event of a failed SST procedure, the system may be locked for any further measurements, including SST
measurements (this is only the case if the SSTFailureReaction parameter in the System Options dialog box is
set on Restrict (see “Setting up the SSTFailureReaction in the System Options menu”). The Current State will be
automatically set to SSTLock.
The system status can be changed manually by authorized users. Manually changing the system status may be
necessary for a variety of reasons. For more details, see the following table:
Manually set
Description of the manually set
As a possible reaction to the
following automatic
System Status to:
System Status:
System Status:
ManualLock
Any action involving hardware is prohibited.
SSTManualUnlock
SST measurements (and any other process SSTLock after failed SST
involving the hardware except routine
procedure.
measurements) are allowed.
MeasurementManualUnlock
System is fully usable but all measurements SSTLock, SSTManualUnlock
are marked as “Invalid because of SST
or MeasurementLock
failure” in the Audit Trail.
Warning
System is fully usable but there will be a
warning before a measurement is run, and
the measurements will be marked “Invalid
because of SST failure” in the Audit Trail.
SystemOK
System is fully usable until system rechecks SSTLock, SSTManualUnlock
validity of SST checkpoints (which is done or MeasurementLock
at an interval of 300 sec.).
SSTLock, SSTManualUnlock
or MeasurementLock
E
Table 3: Manually settable system status
Maintenance and Care
159
The System Suitability Test (SST)
Locking – Unlocking the System
Figure 126: System Status dialog box
E
160
Cedex Analyzer Operator’s Guide
Diagnosis of the Cedex Analyzer
FTroubleshooting
For technical support, the Roche service technician will require at least the following files:
cDiagnosis file (see Section E, Chapter 1)
cCedex Log and Cedex Trace files (see Section F, Chapter 2)
cAudit Trail file (see Section F, Chapter 3)
cThe 3 exported complete measurement file packages generated with the Data Exchange function
(see “Export”) that show the issue.
1
Diagnosis of the Cedex Analyzer
For technical support purposes, the user is able to run a diagnosis of the Cedex Analyzer at the request of
an authorized service technician. The diagnosis of the System provides a file containing information about
the system Software and hardware. It contains a system description, hardware and Software descriptions (i.e.,
product name, version), parameters and settings (i.e., focus position, white/black balance).
To create the diagnosis file, follow the instructions below:
1
Click on the Setup menu on the Cedex Control Center.
2
Click on Diagnosis and the Diagnosis dialog box will appear.
3
The hardware to be included in the diagnosis can be selected by checking the appropriate boxes in the
Hardware to diagnose area or by checking the box beside Diagnose all hardware. The diagnosis of the
system Software is also optional and can be selected by checking the box beside Diagnose system software.
4
Click on Start Diagnosis to run the diagnosis of the Cedex Analyzer.
5
The diagnosis data can be saved by clicking on Save To File and printed by clicking on Print Data.
в– Troubleshooting
F
161
Trace and Logging
2
Trace and Logging
Trace and Logging are only required for support and problem detection purposes. Therefore, it is advisable
to restrict access to Trace and Logging to the support team and users with extended permissions (e.g., the
Superuser).
Trace and Logging functionality should only be activated at the request of an authorized service technician.
In order to avoid an exaggerated use of hard disk space, turn off the Trace and Logging functionalities as soon
as the issue has been located and/or resolved.
To activate or change Trace and Logging parameters, open the Setup menu in the Cedex Control Center.
Clicking on Trace & Logging will open the corresponding dialog box.
The tracing functionality, as well as the logging functionality, can separately be enabled for individual modules
of the Cedex Analyzer.
Tracing is in the Off state by default. The application has two Trace Levels. The first one (tracing level Normal)
is used for minimal tracing required for time critical problems. The second level (tracing level Extended) is
necessary for a more detailed problem description. To set the Trace Level, click on the current status and a dropdown menu will appear from which level can be selected. Logging is in True state by default.
Trace and log records are saved in files which are accessible by using Windows Explorer. The records are found in
the C:\Cedex2 directory under Logs (CedexLogand_YYYY_MM_DD.log and CedexTrace_YYYY_MM_DD.log).
Target files for tracing and logging data can be defined in the System Options dialog box. These files will
automatically be created in the Cedex2 folder. The data will then be stored in the default target files as well
as the newly defined target files. Open the Tracing (Logging) tab and enter the desired target file path for the
TraceOutputPath (LogOutputPath) parameter in the Value column.
3
F
The System Audit Trail File
All user-initiated activities, as well as important actions carried out by the Cedex Software 2.3, are recorded
in the Audit Trail file. The system also logs all errors in the audit trail, including information from the error
message.
For each activity, the User, Measurement ID, Workarea Name, Reactor Identifier and Sample Identifier are given.
The actions are classified by Event Types and a short message provides further explanation.
To support monitoring of user-initiated activities, a search filter is available that also allows for defining the
period of time which is to be searched.
A report can be printed by clicking on Print Report.
162
Cedex Analyzer Operator’s Guide
System Options and User Preferences
GAppendix
1
System Options and User Preferences
The following list provides a description of all of the Systems Options that can be found in the Cedex Software
2.3 via the Systems Options dialog box found under the Setup menu of the Cedex Control Center.
If an option exists in both the System Options dialog box and the User Preferences dialog box, the entries in
the User Preferences dialog box take precedence over the entries found in the System Options. For example, if
the default Cell Type in the System Options dialog box is “CT1”, but user “Joe” selected Cell Type “CT2” as the
default in the User Preferences dialog box when he was logged in, the default Cell Type will be “CT2” when the
user “Joe” is logged in. The defaults set in the System Options dialog box will apply to new users who have not
set their own defaults in the User Preferences dialog box.
If the column SaveLastValue has been selected for a particular parameter (i.e., there is a cross in the column),
any new value entered in the corresponding location will be automatically saved in the System Options or the
User Preferences dialog boxes. For example, user “Joe” has set the default for the Cell Type in the Measurement
section of his User Preferences dialog box to “CT1” and has activated the SaveLastValue option. If “Joe”
changes the Cell Type parameter to “CT2” when running a new measurement, “CT2” will be automatically
saved as the new default in his User Preferences dialog box and will be automatically recommended for the next
measurement. The SaveLastValue function can be activated for all options in the System Options dialog box
and for all options in the User Preferences dialog box for every individual user.
If the system has been upgraded from some previous version to Software version 2.3.2, it is possible that
some default settings in the System Options may have slightly different values than those described in this
manual. The settings described below apply to systems on which Software version 2.3.2 has been installed as
the original Software.
Rows that are shaded blue in the list below indicate options that exist in both the Systems Options dialog box
and the User Preferences dialog box.
G
Appendix
163
System Options und User Preferences
Settings in the “General” tab:
Option
Value
Description
ActualLanguage
English
Language used for the Software
Automatically
StartHardware
CellDistMin
1
2.0833
Save last
value
1 = The Hardware Management is automatically started
after the Cedex Server has been started and the first
login into the Software has been completed.
Minimum cell distance [Вµm] for which cells are
ascertained to be single cells with regard to the
determination of the aggregate rate.
Do not change this parameter without consulting
with Roche Technical Service!
CellDistRatio
1.3
Minimum relationship of the cell distance to the sum
of the radii used for which cells are ascertained to be
single cells with regard to the determination of the
aggregate rate.
Do not change this parameter without consulting
with Roche Technical Service!
CertificateStore
G
My
Name of the certificate storage from which the certificate
for the check of the license and the signature for the
archive is searched.
CleaningPort
0
Cleaning port (will not be used in the current version).
Consumption
HistoryRecord
Count
25
The number of cleanings to be used for the estimation of
the average time the cleaning will take.
CriticalDiskSpace
1
The limit for the free memory space on the non-removable
disk (in gigabyte). The user is warned when executing a
measurement if the space is below this limit.
DataBaseDrive
MapName
C:
The drive on which the database is located (this will, for
example, be used for checking the free disk space, see
“CriticalDiskSpace”).
DBDMOperator
STDDBDM
Operator
Designation of the Dirt and Bubble Detection Operators.
DefaultCupPosition
1
Cup Position for “DefaultCup” used for cleaning and
maintenance routines in the Multi/Auto Sampler.
DisableReagent
Control
0
Disable reagent control (verification of reagent container
levels). “0” means that the reagent control is active.
DisplayedResult
Types
12, 10, 9
Result types to be displayed in MultiRun dialog box.
ErrorLevelDisplay
ToUser
3
Lowest level of error messages to be displayed to the
user (1:only fatal, 2: also critical, 3: also errors, 4: all,
including warning).
FlowFactor
1.0
HistogramBarWidth
2
InnovatisCertificate
Innovatis AG
Test
JpegQuality
95
Flow Factor, adjustable with the use of the Density
Standard Reference Beads.
The width of the histogram bars.
Specification of the certificate to be used for inspection
of the license.
JPEG compression factor.
Do not change this parameter without consulting
with Roche Technical Services!
164
Cedex Analyzer Operator’s Guide
Г—
System Options und User Preferences
Option
MaxCellDensity
Value
10000000
Description
Save last
value
Maximum cell concentration (in cells/ml) per image.
When this limit is exceeded, the user will be requested to
dilute the sample.
This warning will only directly appear as a warning
box if the “ErrorLevelDisplayToUser” is set to “4”.
MaxSedimentation
Delay
2
Maximum acceptable delay (in seconds) between the
end of the sedimentation phase and the beginning of the
main scan in the case of the Cedex HiRes System. The
user is warned if the time interval is exceeded.
Measurement
CriticalTime
90
Maximum acceptable time delay during a critical
measВureВment phase (i.e., between the beginning
of sample preparation to the capturing of the last
image) when the measurement is interrupted with the
Emergency Stop. If this time is exceeded, the results are
not reliable (particularly the viability value) and the user
is warned.
MultiRunClear
ListDateTime
Date/time when the Multi Run list was cleared.
Г—
MultiRunClear
ResultListDateTime
Date/time when the Multi Run overall result list was
cleared.
Г—
OverallTypeFor
Exponential
Regression
ViableCell
Density
(not adjustable) Overall Type for the exponential regression
used for the determination of doubling time and specific
growth rate.
Auto Sampler
Default Sample Port used. Possible values for the Cedex
Standard System: Auto Sampler/Single Port.
SampleTraySize
20
Number of Cedex Sample Cups that the AS20 carousel
or the MS20 Tray can hold.
SchedulerTimer
Period
5
Time interval (in seconds) in which the Scheduler should
check its task list.
SamplePortName
SSTFailureReaction
Restrict
Reaction to a failed checkpoint. Possible values include
Audit: only an entry in the Audit Trail, Warning: an
additional warning before running a measurement,
Restrict: the system is blocked.
SSTTimerPeriod
300
Time interval (in seconds) in which the SST checkpoints
are checked for validity.
SSTTrending
MovingAverage
3
SSTWorkarea
standard
G
Number of results used for the calculation of the
“moving average” for the SST Trending Chart.
Default Workarea where the SST measurements are
stored.
StreamLiveImages
1
Use of “live image“ during cleaning routines in the
Cedex Standard System(1=yes, 0=no).
TrayTypeNumber
0
Sample Tray type used for the Multi Sampler.
Appendix
165
System Options und User Preferences
Settings in the “Measurement” tab:
Option
Save last
value
0
CellDiameter
HistogramDividers
(0) (0) (0)
Divider settings for use in the Cell Diameter Histogram.
Г—
CellType
Std. Cells
(V5.00)
Default Cell Type for measurements.
Г—
Require to confirm the start of a multi run.
CellTypeFocus
Offset
0
Default focus offset for the creation of new Cell Types if
the new Cell Type is not based on a previous Cell Type.
CellType
Sedimentation
Duration
1
Default sedimentation time (in seconds) for the creation
of new Cell Types if the new Cell Type is not based on a
previous Cell Type.
DefaultCombined
Number
1
Number of images that should be added together
for a summary of the measurements results in the
Measurement Statistic Histogram.
Mask image
required
0
Mask image required.
Normal
(or Medium, in
the case of a
system version
update)
Measurement
PrescanRequired
1
ObjectDiameter
HistogramDividers
(0) (0) (0)
Default precision for the measurement:
minimum/normal/superior (or low/medium/high in the
case of a system version update).
Г—
Use of the Prescan in the case of the Cedex HiRes
System (0: don’t run, 1: run).
Divider settings for use in the Object Diameter
Histogram.
Г—
Percentage value of images which must be valid to
ensure the measurement is valid.
Г—
ReactorID
Default ReactorID for measurements.
Г—
SampleID
Default SampleID for measurements.
Г—
Default dilution factor for measurements. (1:2, 1:20, etc.).
Г—
Default sample volume for measurements
(currently not adjustable).
Г—
PercentageOf
ValidImages
SampleInitial
Dilution
SampleVolume
166
Description
AskBeforeMultiRun
Measurement
Precision
G
Value
SuggestNext
CupPosition
75.0
1:1
1000
1
Increase in cup position after every measurement, for
example, when running new measurements in the
Measurement dialog box.
(only with Auto/Multi Samplers). Possible values:
0=don’t increase, 1=automatically increase.
Workarea
standard
Cedex Analyzer Operator’s Guide
Default Workarea for measurements.
Г—
System Options und User Preferences
Settings in the “Measurement List Default Filter” tab:
Option
Value
Description
Save last
value
CellType
Measurement List Default Filter for CellType.
Г—
DataSet
Measurement List Default Filter for DataSet.
Г—
Measurement List Default Filter for DataSet:
Effective/Original/All.
Г—
ProcessDateFrom
Measurement List Default Filter for Process Date From.
Г—
ProcessDateTo
Measurement List Default Filter for Process Date To.
Г—
ReactorID
Measurement List Default Filter for ReactorID.
Г—
Result types to be displayed in measurement list dialog
box.
Г—
SampleDrawing
DateFrom
Measurement List Default Filter for Sample Drawing
Date From.
Г—
SampleDrawing
DateTo
Measurement List Default Filter for Sample Drawing
Date To.
Г—
SampleID
Measurement List Default Filter for SampleID.
Г—
Show result in Measurement List dialog box.
Г—
Measurement List Default Filter for UserID.
Г—
Measurement List Default Filter for Workarea.
Г—
DataSetType
ResultsTo
ShowInList
ShowResults
Effective
12,10,9
0
User
Workarea
standard
Settings in the “Hardware” tab:
Option
ChamberHeight
Value
0.1
Description
Save last
value
Height of the measurement chamber.
Do not change this parameter without consulting
with Roche Technical Service!
ErrorLevelFor
BatchStopping
1
Error level at which a Multi Run will be automatically
interrupted. (1: only fatal, 2: also critical, 3: also error,
4: all, including warning).
Multisampler
Present
1
(not adjustable) Indication of whether an Auto/Multi
Sampler is recognized.
PixelsPermmX
480
(not adjustable) Number of pixels per millimeter in the
x-axis of the images taken.
PixelsPermmY
480
(not adjustable) Number of pixels per millimeter in the
y-axis of the images taken.
Appendix
G
167
System Options und User Preferences
Settings in the “Data Exchange” tab:
Option
Value
Description
ArchiveCertificate
Innovatis AG
Archive Test
Certificate that should be used for the designation and
examination of archives for Archive/Restore.
ArchiveFileMask
{8} – {4} – {5}
– {6}
Archive filename mask (parameters {0} – {9} can be used).
{0}date/time of archive start
Save last
value
{1}date/time of measurement sample drawing time
{2}date/time of measurement process time
(i.e., from the original data set!)
{3}measurement ID
{4}workarea
{5}reactorID
{6}sampleID
{7}userName (i.e., who processed the original data set!)
{8}name of the Cedex System (i.e., the Cedex Serial
Number)
{9}description of the Cedex System
ArchivePath
AuditTrailExport
FileName
CTCExport
FileName
DataExchange
StatusReport
Interval
AuditTrailExport
CTCExport
Default path that should be used for Archive/Restore.
Default file name for the CSV export of Audit Trail
entries.
Default file name for exported CTC files.
3
Interval in seconds in which the progress bar is updated
during Archive/Restore/Export/Import.
ExportCertificate
Innovatis AG
Archive Test
Certificate that should be used for the designation and
examination of archives for Data Exchange (Export/
Import).
ExportDelimiter
;
ExportPath
G
C:\Cedex2\
archivetmp
C:\Cedex2\
archivetmp
ExportString
Delimiter
”
ImportPath
C:\Cedex2\
archivetmp
Default value separator for the CSV/Excel export of
measurements.
Default for the path that should be used for the Data
Exchange export.
Export file string delimiter.
Default for the path that should be used for the Data
Exchange import.
Measurement
ExportFileName
Measurement
Export.txt
Default file name for CSV/Excel export of measurement
results.
SSTTrending
ExportFileName
SSTTrending
Export
Default file name for CSV/Excel export of SST Trending.
Settings in the “Tracing” tab:
Option
DeleteTraces
OlderThan
TraceOutputPath
168
Value
7
Description
Number of days after which the trace files are deleted.
C:\Cedex2\ Logs\ Default file name for the trace file.
CedexTrace.txt
Cedex Analyzer Operator’s Guide
Save last
value
System Options und User Preferences
Settings in the “Logging” tab:
Option
DeleteLogs
OlderThan
LogOutputPath
Value
30
C:\Cedex2\Logs\
CedexLog.log
Description
Save last
value
Number of days after which the log files are deleted.
Default file name for the log file.
Settings in the “Series Default Filter” tab:
Option
Value
DataSet
effective
Description
Save last
value
CTC Series New Default Filter for DataSet.
Г—
Measurement
DateFrom
CTC Series List Default Filter for Measurement Date
From.
Г—
Measurement
DateTo
CTC Series List Default Filter for Measurement Date To.
Г—
ReactorID
CTC Series List Default Filter for ReactorID.
Г—
CTC Series List Default Filter for WorkArea.
Г—
WorkArea
standard
Settings in the “CTC Views Default Filter” tab:
Option
Value
Description
Save last
value
CreateDateFrom
CTC Views Default Filter for Measurement Create Date
From.
Г—
CreateDateTo
CTC Views Default Filter for Measurement Create Date
To.
Г—
ModifyDateFrom
CTC Views Default Filter for Measurement Modify Date
From.
Г—
ModifyDateTo
CTC Views Default Filter for Measurement Modify Date
From.
Г—
UserName
CTC Views Default Filter for User Name.
Г—
ViewName
CTC Views Default Filter for View Name.
Г—
Settings in the “Audit Trail Default Filter” tab:
Option
Value
Description
Save last
value
Name
Audit Trail Default Filter for Name.
Г—
Surname
Audit Trail Default Filter for Surname.
Г—
UserName
Audit Trail Default Filter for User Name.
Г—
Appendix
G
169
System Options und User Preferences
Settings in the “Password Settings” tab:
Option
Value
Description
AttemptsToLogin
0
Maximum number of incorrect logins before the user is
locked out.
ExpiresInDays
30
Period of validity (in days) for passwords.
MaxLength
50
Maximum password length.
MinCharacters
1
Minimum number of letters a password must contain.
MinDigits
0
Minimum number of numbers a password must contain.
MinLength
1
Minimum password length.
NeverExpires
1
Indication of whether passwords can become invalid
(see also “ExpiresInDays”).
Possible values: 0: passwords become invalid after
“ExpiresInDays“ number of days, 1: passwords never
become invalid.
OldPassword
ReusedAfter
0
Number of previously used passwords that cannot be
re-used as new passwords.
UseBlacklist
1
Use of Blacklist (passwords generally not allowed)
Possible values: 0: don’t use, 1: use.
WarningDays
Before
3
Number of days in advance a user will be warned at
login that a password is about to become invalid.
Save last
value
Settings in the “Reports” tab:
Option
Value
Description
ReportResultPath
C:\Cedex2\
reporttmp
Report result .xml path.
Report
TemplatePath
C:\Cedex2\
reporttmp
The path to report templates (files extension *.lst).
Save last
value
Г—
Settings in the “Focus Finder” tab:
G
170
Option
Value
Description
FocusFinder
CoarseStepZ
10
(not adjustable) Increment for the rough scan during the
focus adjustment.
FocusFinder
FineSamplesZ
20
(not adjustable) Number of measurement points for the
fine scan during the focus adjustment.
FocusFinder
FineStepZ
2
(not adjustable) Increment for the fine scan during the
focus adjustment.
FocusFinderMaxZ
7000
(not adjustable) Maximum focus position increments for
the focus adjustment.
FocusFinderMinZ
2000
(not adjustable) Minimum focus position increments for
the focus adjustment.
SaveAutomatic
AlignmentImages
1
Cedex Analyzer Operator’s Guide
Determines whether the images should be stored with
the automatic adjustment in the database
(0: don’t save, 1: save).
Save last
value
System Options und User Preferences
Settings in the “Report Settings” tab:
Option
Value
Description
Audit Trail Report
Template
standard
The name of the report template for report type
“Audit Trail”.
Automatic Alignment Adjustment
Report Template
standard
The name of the report template for report type
“Automatic Alignment Adjustment”.
CTCData Report
Template
standard
The name of the report template for report type
CTCData”.
Diagnosis Report
Template
standard
The name of the report template for report type
“Diagnosis”.
Multiple
Measurement
Report Template
list
The report template for multiple measurements.
Operational Data
Report Template
standard
The name of the report template for report type
“Operational Data”.
ReportLanguage
English
Single
Measurement
Report Template
standard
The default report template for single measurements.
SST Data Report
Template
standard
The name of the report template for report type
“SST Data”.
SST Trending Chart
Report Template
standard
The name of the report template for report type
“SST Trending Chart”.
SST Trending Data
Report Template
manual
checkpoint list
The name of the report template for report type
“SST Trending Data”.
SST Trending
Measurement Data
Report Template
measurement
checkpoint list
The name of the report template for report type
“SST Trending Measurement Data”.
standard
The name of the report template for report type
“System Configuration”.
System
Configuration
Report Template
Save last
value
Report Template Default Language.
G
Appendix
171
System Options und User Preferences
Settings in the “External XML” tab:
Option
Value
AppendTimestamp
ToExternalXMLFile
name
0
Append timestamp to external XML file name
(0-False/1-True).
AppendUsername
ToExternalXMLFile
name
0
Append user name to external XML file name
(0-False/1-True).
ExternalApplication
C:\Cedex2\
ExternalXML
DummyApp.exe
ExternalApplication
Callback
0
ExternalXML
ExportPath
C:\Export
ExternalXML
FileName
CEDEX-XML
Example.xml
ExternalXML
ImportPath
C:\Import
ExternalXML
ReportLanguage
Name
English
ExternalXML
ReportTemplate
Name
list
Magic
Magic
G
172
Description
Cedex Analyzer Operator’s Guide
The application providing external XML for Measurement
input/output.
Call external application after external measurement
processing (0-False/1-True).
External XML output directory.
External XML file name.
External XML input directory.
External XML report’s language ID.
External XML report’s template name.
The application connection authentication string.
Save last
value
Index
Index
A
C
Access Rights................................. 56, 118, 120, 125
Adjustment of the Image Analysis.....................125
Administrator.............................................................120
Administrator Functions........................................117
Aggregate Histogram............................................... 94
Aggregate Rate.........................................................105
Aggregate Rate Value............................................... 84
Analysis Parameters.................................................. 69
Analysis Results............................................83, 90, 93
Analyzer...........................................................19, 20, 23
Anti-Virus Software................................................... 17
Archive Path...............................................................134
Archiving....................................................................... 58
Archiving Data..........................................................133
Audit Trail.......................................108, 113, 115, 162
Automatic Adjustment................................... 58, 146
Automatic Adjustment and Alignment............108
Automatically Start Hardware.............................123
Average Compactness Value................................. 84
Average Diameter Value.......................................... 84
Control Unit.................................................................. 20
Count For Passing....................................................153
Creating a Cultivation Time Chart......................104
CSV Format.................................................................158
CTC View.....................................................................100
B
Border Width..............................................................132
C
Capillary Tubes...........................62, 63, 81, 142, 143
Cedex Calibration Beads.......................................146
Cedex Cleaning Solution..................................64, 65
Cedex Control Center............................................... 22
Cedex Detergent....................................16, 20, 64, 65
Cedex Reagent Kit..................................................... 63
Cedex Sample Cups.................................................. 16
Cedex Trypan Blue..................................................... 20
Cedex Trypan Blue Solution............................64, 65
Cell Concentration.............................................. 23, 70
Cell Diameter............................................................... 23
Cell Diameter Histogram......................................... 96
Cell Type....................................................... 69, 84, 125
Cell Type, Creating...................................................127
Cell Type, Deleting...................................................129
Cell Type, Editing......................................................128
Cell Type List..............................................................126
Cell Type Parameters, Show................................... 85
Cell Type, Viewing....................................................128
Chamber Clean 1......................................................144
Chamber Clean 2......................................................144
Changing the Reagent Kit...................................... 63
Cleaning Options......................................................143
Cleaning Routines...................................................... 58
Cleaning Solution....................................................... 20
Clear List Button......................................................... 76
Compactness Histogram......................................... 98
Control Beads............................................................152
D
Data Analysis............................................................... 22
Database Backup.....................................................138
Database Size............................................................137
Data Exchange...................................................58, 110
Data Management...................................................108
Data Selection Area................................................105
Data Series.................................................................102
Data Sets....................................................................... 91
Dead Aggregate App..............................................131
Dead Aggregate Max.............................................132
Dead Aggregate Min..............................................132
Dead Appearance....................................................131
Dead Cell Conc. Value.............................................. 84
Dead Cell Count Value............................................. 84
Dead Size....................................................................131
Default Cup........................................................... 74, 78
Default Cup, Modifying Position.........................123
Default Cup Position................................................. 75
Default Measurement Parameters.....................115
Default Settings........................................................125
Density Reference Standard Beads..................152
Dilution Factor............................................................. 68
Distilled or Deionized Water.................................. 64
Doubling Time...........................................................107
DSEffective Column.................................................. 90
DSOriginal Column.................................................... 90
E
Effective Data Sets..................................................... 92
Emergency Stop Button........................72, 145, 149
Enlarging the Histograms........................................ 93
Error Level............................................................79, 124
Event Window........................................................57, 60
Excel-DIF.....................................................................109
Excel-DIF Format......................................................158
Excluding Images....................................................... 88
Exponential Regression.........................................107
ExportPath...................................................................111
Export to File...................................................... 58, 109
Appendix
G
173
Index
Index
F
L
Fast Clean....................................................................143
Fitting to the Lowest Common Value................106
Fixed Target Value....................................................153
Flow Chamber......................16, 20, 86, 87, 142, 145
Focus Position............................................................147
Functions Menu.......................................................... 58
Lin..................................................................................107
Liquid Container Configuration..........................124
Liquid Management.................20, 62, 72, 142, 144
Live Operator............................................ 19, 125, 129
Live Operator Parameters....................85, 130, 131
Living Appearance...................................................131
LM Shutdown.......................................................62, 81
Locking the System.................................................159
Lock Level...................................................................124
Log.................................................................................107
Logging................................................................ 59, 162
Logging In..................................................................... 61
Logging Out............................................................57, 82
Logout............................................................................. 57
Log Out.......................................................................... 82
Log Output Path........................................................162
Luer Lock.....................................................................149
G
Graphical Display....................................................... 93
GUI.................................................................................. 22
H
Hardware Management................... 58, 62, 81, 123
Help Menu.................................................................... 60
HWM............................................................................... 60
HW Shutdown............................................................. 81
HW Startup................................................................... 62
I
Image Analysis Software..................................22, 84
Images............................................................................ 77
Images Excluded........................................................ 85
Images Included......................................................... 85
Images Invalid......................................................85, 88
Image, Valid................................................................147
Image View................................................................... 86
Import...........................................................................112
Import Path.................................................................113
Including Excluded Images.................................... 88
Intensive Clean..........................................................143
Intensive Clean with HCl.......................................143
Interrupting a Measurement.................................. 72
Interrupting a Multi Run.......................................... 79
Invalid Measurement..............................................159
Invalid SST Checkpoint..........................................155
G
174
Cedex Analyzer Operator’s Guide
M
Maintenance Checklist..........................................140
Manual Lock..............................................................159
Master Data Menu.................................................... 59
Measurement Data...............................108, 110, 113
Measurement Lock..................................................159
Measurement Manual Unlock............................159
Measurement Menu................................................. 58
Measurement Offset...............................................106
Measurement Parameters.....................................108
Measurement Procedure......................................... 21
Measurement Series Offset..................................106
Measurement Statistics Histogram..................... 99
Menu Bar...................................................................... 57
Microcarrier Beads.................................................... 16
Min Pollution Area...................................................132
Muli Run, Aborted..................................................... 77
Muli Run, Active......................................................... 77
Muli Run, Blocked...................................................... 77
Muli Run, Cleaning.................................................... 77
Muli Run, Done........................................................... 77
Muli Run, Edit.............................................................. 77
Muli Run, Failed.......................................................... 77
Muli Run, Measure.................................................... 77
Muli Run, No Cup...................................................... 77
Muli Run, Prepare...................................................... 77
Muli Run, Scheduled................................................. 77
Multi Run Data Entry Dialog Box......................... 75
Multi Run, Modifying Data Entry.......................... 79
Multi Sample Tray................................................ 73, 74
Index
Index
O
S
Object Diameter Histogram............................. 93, 97
Operating Mode...................................................67, 68
Operating System Administrator.......................... 56
Operational Data.....................................58, 108, 151
Operator..................................................................19, 22
Overall Type................................................................153
SST Offset...................................................................153
SST Run.......................................................................152
Standard Clean.........................................................143
Starting Software........................................................ 61
Std. Cells (V5.00).............................................. 69, 130
Std. Dev........................................................................105
Superuser....................................................................120
Support........................................................................120
Switching On the System........................................ 61
Syringe Barrel............................................................149
Syringe Maintenance................................................ 58
Syringe Module.........................................................149
System Configuration Parameters.....................108
System Menu............................................................... 57
System OK...................................................................159
System Options................................................. 59, 163
System Parameters........................................ 108, 123
System Status............................................................159
System Suitability Test............................................152
System Warning........................................................159
P
Password....................................................................... 56
Password, Operating System................................. 56
Precision Level............................................................. 69
Precision, Minimum................................................... 69
Precision, Normal....................................................... 69
Precision, Superior..................................................... 69
Prime............................................................................... 62
Print................................................................................. 71
Printing Reports........................................................108
Print Report.................................................................. 80
Processing Parameters...............................68, 69, 83
Production Staff.............................................. 118, 120
Prologned Incubation............................................... 76
R
Reagent Containers................................................... 20
Reagent Control........................................................125
Reagent Kit Status..............................................58, 63
Refilling Reagents...................................................... 65
Reports Menu.............................................................. 59
Reprocess Measurements...................................... 91
Research Staff...........................................................120
Result Data Area.................................................71, 84
Result Diagram.........................................................100
S
Sample ID...................................................................... 68
Sample Port........................................................... 20, 70
Sample Volume.................................................... 23, 70
Save Last Column....................................................115
Scheduling.......................................................... 58, 141
Securing Data............................................................117
Setup Menu.................................................................. 59
Shortcuts Area............................................................ 60
Shutting Down............................................................ 82
Single Sample Port.................................................... 65
Specific Growth Rate..............................................107
Sphere............................................................................ 84
Spindle.........................................................................150
SST..........................................................................58, 152
SST Edit........................................................................152
SST Failure Reaction...............................................154
SST Lock......................................................................159
SST Manual Unlock.................................................159
T
Target Value................................................................153
Target Value Check..................................................153
Total Cell Conc. Value............................................... 84
Total Object Count Value......................................... 84
Trace...................................................................... 59, 162
Trace Output Path....................................................162
Trypan Blue Exclusion Method.............................. 21
U
Ultra Fast Clean..................................................72, 142
Unlocking the System.............................................159
Unlock Queue.............................................................. 72
User Groups...............................................................119
User Preferences............................................ 114, 163
User Role.....................................................................118
User Workareas.........................................................122
V
Validity Period............................................................154
Viability (%) Value...................................................... 84
Viable Cell Conc. Value............................................ 84
Viable Cell Count Value............................................ 84
View Mode..................................................................125
Appendix
G
175
Index
Index
W
Warn Level..................................................................124
Waste.......................................................................20, 64
Waste Level................................................................... 64
Water............................................................................... 20
Work Areas.................................................................122
Zahlen
8-Way Valve......................................................148, 151
21 CFR, Part 11............................................................ 19
G
For use in quality control/manufacturing processes only.
176
Cedex Analyzer Operator’s Guide
Published by Roche Diagnostics GmbH
Sandhofer StraГџe 116
68305 Mannheim
Germany
В© 2014 Roche Diagnostics.
All rights reserved.
custombiotech.roche.com
07266090001 3 042014
© Copyright 2026 Paperzz