Optic Disc Detection Using Ant Colony Optimization
Marcy A. Dias and Fernando C. Monteiro
Polytechnic Institute of Bragança, Bragança, Portugal
Abstract. The retinal fundus images are used in the treatment and diagnosis of several eye diseases, such as diabetic
retinopathy and glaucoma. This paper proposes a new method to detect the optic disc (OD) automatically, due to the fact
that the knowledge of the OD location is essential to the automatic analysis of retinal images. Ant Colony Optimization
(ACO) is an optimization algorithm inspired by the foraging behaviour of some ant species that has been applied in image
processing for edge detection. Recently, the ACO was used in fundus images to detect edges, and therefore, to segment the OD
and other anatomical retinal structures. We present an algorithm for the detection of OD in the retina which takes advantage
of the Gabor wavelet transform, entropy and ACO algorithm. Forty images of the retina from DRIVE database were used to
evaluate the performance of our method.
Keywords: Ant Colony Optimization, Gabor Wavelet Transform, Entropy, Optic Disc Detection and Retinal Images
PACS: 87.57.N-
INTRODUCTION
The segmentation of the OD, in addition of being important in several pre-processing algorithms developed for
the automatic extraction of anatomical structures and to detect damage to the retina, is also an indicator of different
eye diseases, such as glaucoma which is one of the most common causes of blindness [1]. These images must be
accurately segmented to extract sensitive objects in the retina like the blood vessels tree, the OD, the macula and the
region between the OD and the macula.
The OD is the brightest area within a retinal image and is the entrance and exit point for retinal blood vessels and,
also, the point from where the retinal fibers flow. Furthermore, in retinal images the OD detection is a concern to locate
all kinds of anatomical features in the retina.
Several OD detection methods make use of anatomical structures among the OD, macula and retinal blood vessels
[2]. These methods are based on the assumption that all major retinal blood vessels radiate from the OD, which make
they more reliable under the presence of retinal lesions or/and imaging artefacts. Even though, the extraction of either
retinal blood vessels or the macula is often a nontrivial task by itself.
The ACO is an optimization algorithm inspired by the foraging behaviour of some ant species that has been applied
in image processing for edge detection [3]. For ants the brightest areas within the image correspond to food supply
zones, so they mark these areas as important zones which become a good indicator to the optic disc location.
Our method starts with the blood vessels segmentation followed by the entropy п¬Ѓltering and then it was applied the
ant colony optimization for the detection of the OD. These approaches are then joint to obtain a set of candidates for
the OD location.
MATERIALS AND METHODS
The algorithm was tested in forty images from DRIVE database (seven of which present pathology), compressed in
JPEG format of size 565x584 pixels, eight bits per colour channel, obtained through a diabetic retinopathy screening
program. These images area were acquired using a Canon CR5 nonmydriatic 3CCD camera at 45в—¦ п¬Ѓeld of view.
Blood Vessels Segmentation
The most important step in many different applications of image processing is to detect the blood vessels in the
retina. In our work, we decided to choose the method presented in [4] due to the fact that they achieved an high
performance in blood vessels segmentation (≈ 96%). In this method each image pixel is represented by a feature
Numerical Analysis and Applied Mathematics ICNAAM 2012
AIP Conf. Proc. 1479, 798-801 (2012); doi: 10.1063/1.4756258
В© 2012 American Institute of Physics 978-0-7354-1091-6/$30.00
798
vector including measurements at different scales taken from the two-dimensional (2D) Gabor wavelet transform. The
resulting feature space is used to classify each image pixel as either a vessel or nonvessel pixel. This is done using a
Bayesian classifier which is described as Gaussian mixtures, yielding a fast classification, while being able to model
complex decision surfaces [4].
The 2D Gabor wavelet is defined as:
П€G (x) = exp ( jk0 x) exp в€’0.5 |Ax|2 ,
where k0 is a vector that defines the frequency of the complex exponential and A = diag √1ε , 1 is a 2 x 2 diagonal
matrix that defines the anisotropy of the filter, i.e., its elongation in any desired direction. This wavelet is computed for
spanning from 0 up to 170 degrees at steps of 10 degrees. The maximum value of the wavelet transform over all angles
for various scales are then taken as pixel features [4]. In our approach, the elongation parameter was set to Оµ = 4 and
k0 = 3 (see Fig. 1(b)).
Entropy
The entropy is typically used to detect the exudates in retinal images. In our method, we used entropy to detect
optic disc due to the fact that it is easily distinguished from the rest of the retina through its smooth texture [5]. To
discover which regions of the image are smooth or textured, for each point x we obtained a probability mass function
PIx : {0, 1, ..., 255} в†’ [0..1] for the intensities Ix of the pixels in a local region around x and then we compute the
entropy:
255
H (Ix ) = − ∑ PIx (i) · log PIx (i) ,
i=0
This entropy measure is higher when the region around a pixel is complex and low when it is smooth. After applying
the entropy п¬Ѓlter we implemented an adaptive threshold to separate the complex regions from the smoother ones (see
Fig. 1(c)) [5].
Ant Colony Optimization
Recently, the ACO was used in fundus images to detect edges, and therefore, to segment the OD and other
anatomical retinal structures [3, 6].
This method uses a number of ants on the image driven by the local variation of the image intensity values. This
variation establishes a pheromone matrix that represents the edge information at each image pixel location. The process
starts with an initialization stage, and then runs for N iterations to construct the pheromone matrix by iteratively
performing both the construction and the update processes.
The algorithm contains two crucial issues that have to be considered in the ACO process: the establishment of the
probabilistic transition matrix p(n) and the pheromone matrix П„ (n) update. For the п¬Ѓrst one, we used a probabilistic
action rule determined by [7]:
(nв€’1) О±
pn(l,m),(i, j)
=
П„i, j
(О·i, j )ОІ
(nв€’1) О±
∑(i, j)∈Ω(l,m) τi, j
(О·i, j )ОІ
, i f (i, j) в€€ О©(l,m)
(1)
which indicates the probability that at the n-th construction step of ACO, the k-th ant moves from the node (l, m)
(nв€’1)
to the node (i, j). In Equation (1), П„i, j
is the pheromone information value of the arc linking the two nodes under
consideration, О©(l,m) is the set of feasible components like edges (l, m) , (i, j) where (i, j) is a nod not yet visited by the
ant k, α and β are,respectively, constants that represent the influence of the pheromone and the heuristic information
and О·i, j represents the heuristic information for going from node (l, m) to the node (i, j), п¬Ѓxed to be the same for each
construction step.
This parameter was found by the local statistics at the pixel position (i, j) as:
О·i, j =
1
Vc (Ii, j )
Z
799
(a)
(b)
(c)
(d)
(e)
(f)
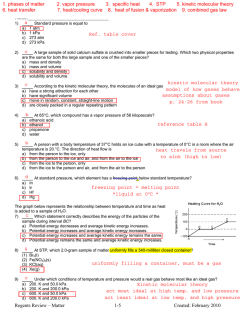
FIGURE 1. Proposed method applied to one of the fundus image. (a) original gray-level image (b) blood vessel segmentation (c)
entropy п¬Ѓlter (d) ACO result within original image (e) п¬Ѓnal OD-center candidates (f) detection of OD
where Z = ∑i=1:M1 ∑ j=1:M2 Vc (Ii, j ) is a normalization factor, Ii, j is the intensity value of the pixel at the position (i, j)
of the image I, and Vc (Ii, j ) is the function of a local group of pixels c (called the clique).
In order to establish the optimal function, four different approaches are considered as in [6]. The highest performance
was obtained with the expression in Equation (2) where the parameter λ define the function shape.
f (x) =
ПЂ x sin( ПЂО»x )
,
О»
0,
0≤x≤λ
otherwise
(2)
As far as the pheromone matrix is considered it needs to be updated twice during the ACO process. The п¬Ѓrst update
occurs after the movement of each ant within each construction step. This update is performed using Equation (3):
(nв€’1)
П„i, j
(nв€’1)
=
(1 в€’ ПЃ ) В· П„i, j
(nв€’1)
П„i, j ,
(k)
+ ПЃ В· О”i, j ,
if (i, j) is visited by the current k-th ant
otherwise
(k)
(3)
(k)
where ПЃ is the evaporation rate, О”i, j is determined by the heuristic matrix, which is О”i, j = О·i, j . The second update
occurs after the movement of all K ants within each construction step and the matrix is updated according to:
П„ (n) = (1 в€’ П• ) В· П„ (nв€’1) + П• В· П„ 0 ,
where ϕ ∈ (0, 1] is the pheromone decay coefficient.
Another parameter that had to be established was the permissible range of ants movement О©(l,m) . In this paper,
в€љ
M1 xM2 ,
we used the 8-connectivity proposed by [6]. The parameter values of the ACO algorithm were: K =
П„initialв€’value = 0.0001, О± = 1, ОІ = 0.1, О» = 10, ПЃ = 0.1, Lsteps = 40, П• = 0.05 and Nconstructionв€’steps = 3 (see Fig. 1(d)).
Figure 1(e) is the overlapping of the ACO image with the two images above.
RESULTS AND DISCUSSION
The proposed method achieved a success rate of 100% over the DRIVE database. The estimated centre is considered
correct if it was positioned within 60 pixels of the manually identified centre, as proposed in [2, 8, 9]. Figure 2 shows
the best and the worst four results for the OD detection. The average distance reached between the estimated OD centre
and the manually identified centre was 29.9 pixels, the minimum distance was 9.9 and the maximum was 49.2 pixels.
800
FIGURE 2. OD detection examples (black mark represents the estimated OD centre). The п¬Ѓrst row shows the best four results.
The second row shows the worst four results.
CONCLUSIONS
In this paper, a simple and computationally efficient algorithm for automatic OD detection was presented. The
proposed method takes advantage of the powerful techniques such as the Gabor wavelet transform, entropy and ACO
algorithm. The performance of this method was evaluated using the forty images from DRIVE database. Good results
have been achieved and the method did not fail in any image.
REFERENCES
1. J. Xu, P. Chew, IEEE Transactions in Biomedical Engineering 54, 473–482 (2007).
2. A. Youssif, A. Ghalwash, A. Ghoneim, IEEE Transactions on Medical Imaging 27, 11–18 (2008).
3. C. Pereira, L. Gonçalves, M. Ferreira, “Detection of the Optic Disc in Retinal Images by Means of Ant Colony Optimization
Algorithm,” in The 2011 International Conference on Image Processing, Computer Vision, and Pattern Recognition, Las Vegas,
United States of America, 2011, vol. 1.
4. J. Soares, J. Leandro, R. Cesar, H. Jenilek, M. Cree, IEEE Transactions on Medical Imaging 25, 1214–1222 (2006).
5. L. Kovacs, R. Qureshi, B. Nagy, B. Harangi A. Hajdu, “Graph Based Detection of Optic Disc and Fovea in Retinal Images,” in
4th International Workshop on Soft Computing Applications, Arad, Romania, 2010, vol. 10, pp. 143–148.
6. J. Tian, W. Yu, S. Xie, “An Ant Colony Optimization Algorithm for Image Edge Detection,” in Proceedings of IEEE Congress
on Evolutionary Computation, 2008, pp. 751–756.
7. M. Dorigo, M. Birattari, T. Stutzle, IEEE Computational Intelligence Magazine 1, 28–39 (2006).
8. M. Forachia, E. Grisan, A. Ruggeri, IEEE Transactions on Medical Imaging 23, 1189–1195 (2004).
9. A. Hoover, V. Kouznetsova, M. Goldbaum, IEEE Transactions on Medical Imaging 19, 203–210 (2000).
801
© Copyright 2026 Paperzz