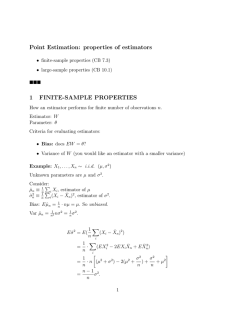
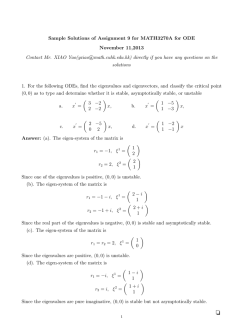
2014 Technical Notes [email protected] January 21, 2015 1 Statistical Inference Writeup [email protected] January 19, 2015 This is a personal writeup of Statistical Inference ”Casella and Berger, 2nd ed.). The purpose of this note is to keep a log of my impressions during the reading process, so I cannot guarantee the correctness of contents. :-) Contents 1 Probability Theory 4 2 Transformations and Expectations 2.1 Transformations of random variables . . . . . . . . . . . . . . . . . . . . . . . . . . 4 4 2.1.1 Monotonic functions . . . . . . . . . . . . . . . . . . . . . . . . . . . . . . . . 5 2.1.2 Piecewise monotonic functions . . . . . . . . . . . . . . . . . . . . . . . . . . 5 2.1.3 Probablity integral transformation . . . . . . . . . . . . . . . . . . . . . . . . 5 2.2 Expected Values . . . . . . . . . . . . . . . . . . . . . . . . . . . . . . . . . . . . . . . 5 2.3 Moments and Moment Generating Functions . . . . . . . . . . . . . . . . . . . . . . 6 3 Common Families of Distribution 3.1 Discrete Distributions 6 . . . . . . . . . . . . . . . . . . . . . . . . . . . . . . . . . . . 3.2 Continuous Distributions 6 . . . . . . . . . . . . . . . . . . . . . . . . . . . . . . . . . 7 3.3 Exponential Families of Distribution . . . . . . . . . . . . . . . . . . . . . . . . . . . 3.4 Scaling and Location Families . . . . . . . . . . . . . . . . . . . . . . . . . . . . . . . 9 9 3.5 Inequalities and Identities . . . . . . . . . . . . . . . . . . . . . . . . . . . . . . . . . 10 4 Multiple Random Variables 10 4.1 Joint and Marginal Distributions . . . . . . . . . . . . . . . . . . . . . . . . . . . . . 10 4.2 Conditional Distributions and Independence . . . . . . . . . . . . . . . . . . . . . . 10 4.3 Bivariate Transformations . . . . . . . . . . . . . . . . . . . . . . . . . . . . . . . . . 11 4.4 Hierarchical Models and Mixture Distributions . . . . . . . . . . . . . . . . . . . . 11 4.5 Covariance and Correlation . . . . . . . . . . . . . . . . . . . . . . . . . . . . . . . . 12 4.6 Multivariate Distributions . . . . . . . . . . . . . . . . . . . . . . . . . . . . . . . . . 12 4.7 Inequalities and Identities. . . . . . . . . . . . . . . . . . . . . . . . . . . . . . . . . 12 1 5 Properties of a Random Sample 13 5.1 Basic Concepts of Random Samples . . . . . . . . . . . . . . . . . . . . . . . . . . . 5.2 Sums of Random Variables from a Random Sample . . . . . . . . . . . . . . . . . . 13 13 5.2.1 Basic Statistics . . . . . . . . . . . . . . . . . . . . . . . . . . . . . 5.2.2 Bessel’s Correction . . . . . . . . . . . . . . . . . . . . . . . . . . 5.2.3 Sampling Distributions of Sample Mean and Sample Variance 5.2.4 Using mgfs to Find Sampling Distributions . . . . . . . . . . . . 5.3 Sampling From the Normal Distribution . . . . . . . . . . . . . . . . . . . . . . 14 14 14 15 15 5.3.1 Student’s t-distribution . . . . . . . . . . . . . . . . . . . . . . . . . . . . . . . 15 5.3.2 Fisher’s F -distribution . . . . . . . . . . . . . . . . . . . . . . . . . . . . . . . 5.4 Order Statistics . . . . . . . . . . . . . . . . . . . . . . . . . . . . . . . . . . . . . . . 5.5 Convergence Concepts . . . . . . . . . . . . . . . . . . . . . . . . . . . . . . . . . . . 15 16 16 5.5.1 5.5.2 5.5.3 5.5.4 Definitions . . . . . . . Law of Large Numbers Central Limit Theorem Delta Method . . . . . . . . . . . . . . . . . . . . . . . . . . . . . . . . . . . . . . . . . . . . . . . . . . . . . . . . . . . . . . . . . . . . . . . . . . . . . . . . . . . . . . . . . . . . . . . . . . . . . . . . . . . . . . . . . . . . . . . . . . . . . . . . . . . . . . . . . . . . . . . . . . . . . . . . . . . . . . . 16 16 17 17 6.1 The Sufficiency Principle . . . . . . 6.1.1 Sufficient Statistic . . . . . . 6.1.2 Factorization Theorem . . . 6.1.3 Minimal Sufficient Statistics 6.1.4 Ancillary Statistics . . . . . 6.1.5 Complete Statistics . . . . . . . . . . . . . . . . . . . . . . . . . . . . . . . . . . . . . . . . . . . . . . . . . . . . . . . . . . . . . . . . . . . . . . . . . . . . . . . . . . . . . . . . . . . . . . . . . . . . . . . . . . . . . . . . . . . . . . . . . . . . . . . . . . . . . . . . . . . . . . . . . . . . . . . . . . . . . . . . . . . . . . . . . . . . . 18 18 18 18 19 19 6.2 The Likelihood Principle . . . . . . . . . . . . . . . . . . . . . . . . . . . . . . . . . . 19 6 Principles of Data Reduction 18 7 Point Estimation 20 7.1 Methods of Finding Estimators . . . . . . . . . . . 7.1.1 Method of Moments for Finding Estimator 7.1.2 Maximum Likelihood Estimation . . . . . . 7.1.3 Bayes Estimators . . . . . . . . . . . . . . . 7.1.4 The EM Algorithm . . . . . . . . . . . . . . . . . . . . . . . . . . . . . . . . . . . . . . . . . . . . . . . . . . . . . . . . . . . . . . . . . . . . . . . . . . . . . . . . . . . . . . . . . . . . . . . . . . . . . . . . . . . . . . 20 20 21 21 21 7.2 Methods of Evaluating Estimators 7.2.1 Mean Squared Error . . . . 7.2.2 Best Unbiased Estimator . . 7.2.3 General Loss Functions . . 8 Hypothesis Testing 8.1 Terminology . . . . . . . . . . 8.2 Methods of Finding Tests . . . 8.2.1 Likelihood Ratio Tests 8.2.2 Bayesian Tests . . . . . . . . . . . . . . . . . . . . . . . . . . . . . . . . . . . . . . . . . . . . . . . . . . . . . . . . . . . . . . . . . . . . . . . . . . . . . . . . . . . . . . . . . . . . . . . . . . . . . . . . . . . . . . . . . . . . . . . . . . . . . . . . . 22 22 23 24 . . . . . . . . . . . . . . . . . . . . . . . . . . . . . . . . . . . . . . . . . . . . . . . . . . . . . . . . . . . . . . . . . . . . . . . . . . . . . . . . . . . . . . . . . . . . . . . . . . . . . . . . . . . . . . . . 25 26 26 26 27 2 8.2.3 Union-Intersection and Intersection-Union Tests . . . . . . . . . . . . . . . 27 8.3 Evaluating Tests . . . . . . . . . . . . . . . . . . . . . . . . . . . . . . . . . . . . . . . 8.3.1 Types of Errors and Power Function . . . . . . . . . . . . . . . . . . . . . . . 27 27 8.3.2 Most Powerful Tests: Uniformly Most Powerful Tests . . . . . . . . . . . . . 29 8.3.3 Size of UIT and IUT . . . . . . . . . . . . . . . . . . . . . . . . . . . . . . . . . 31 8.3.4 p-Values . . . . . . . . . . . . . . . . . . . . . . . . . . . . . . . . . . . . . . . . 31 8.3.5 Loss Function Optimality . . . . . . . . . . . . . . . . . . . . . . . . . . . . . 32 9 Interval Estimation 32 9.1 Introduction . . . . . . . . . . . . . . . . . . . . . . . . . . . . . . . . . . . . . . . . . 32 9.1.1 Coverage Probability Example: Uniform Scale Distribution . . . . . . . . . 9.2 Methods of Finding Interval Estimators . . . . . . . . . . . . . . . . . . . . . . . . . 33 33 9.2.1 Equivalence of Hypothesis Test and Interval Estimations: Inverting a Test Statistic . . . . . . . . . . . . . . . . . . . . . . . . . . . . . . . . . . . . . . . . 33 9.2.2 Using Pivotal Quantities . . . . . . . . . . . . . . . . . . . . . . . . . . . . . . 35 9.2.3 Pivoting CDFs Using Probability Integral Transformation . . . . . . . . . . 35 9.2.4 Bayesian Inference . . . . . . . . . . . . . . . . . . . . . . . . . . . . . . . . . 36 9.3 Methods of Evaluating Interval Estimators . . . . . . . . . . . . . . . . . . . . . . . 36 9.3.1 Size and Coverage Probability . . . . . . . . . . . . . . . . . . . . . . . . . . . 36 9.3.2 Test-Related Optimality . . . . . . . . . . . . . . . . . . . . . . . . . . . . . . 37 9.3.3 Bayesian Optimality . . . . . . . . . . . . . . . . . . . . . . . . . . . . . . . . 37 9.3.4 Loss Function Optimality . . . . . . . . . . . . . . . . . . . . . . . . . . . . . 38 10 Asymptotic Evaluations 38 10.1 Point Estimation . . . . . . . . . . . . . . . . . . . . . . . . . . . . . . . . . . . . . . . 10.1.1 Criteria . . . . . . . . . . . . . . . . . . . . . . . . . . . . . . . . . . . . . . . . 38 38 10.1.2 Comparing Consistent Estimators . . . . . . . . . . . . . . . . . . . . . . . . 39 10.1.3 Asymptotic Behavior of Bootstrapping . . . . . . . . . . . . . . . . . . . . . . 10.2 Robustness . . . . . . . . . . . . . . . . . . . . . . . . . . . . . . . . . . . . . . . . . . 39 40 10.2.1 Robustness of Mean and Median . . . . . . . . . . . . . . . . . . . . . . . . . 40 10.2.2 M-estimators . . . . . . . . . . . . . . . . . . . . . . . . . . . . . . . . . . . . . 40 10.3 Hypothesis Testing . . . . . . . . . . . . . . . . . . . . . . . . . . . . . . . . . . . . . 41 10.3.1 Asymptotic Distribution of LRT . . . . . . . . . . . . . . . . . . . . . . . . . . 41 10.3.2 Wald’s Test and Score Test . . . . . . . . . . . . . . . . . . . . . . . . . . . . . 41 10.4 Interval Estimation . . . . . . . . . . . . . . . . . . . . . . . . . . . . . . . . . . . . . 42 11 Analysis of Variance and Regression 42 11.1 One-way ANOVA . . . . . . . . . . . . . . . . . . . . . . . . . . . . . . . . . . . . . . . 11.1.1 Different ANOVA Hypothesis . . . . . . . . . . . . . . . . . . . . . . . . . . . 42 42 11.1.2 Inference Regarding Linear Combination of Means . . . . . . . . . . . . . . 11.1.3 The ANOVA F Test . . . . . . . . . . . . . . . . . . . . . . . . . . . . . . . . . . 42 43 11.1.4 Simultaneous Estimation of Contrasts . . . . . . . . . . . . . . . . . . . . . . 44 3 11.1.5 Partitioning Sum of Squares . . . . . . . . . . . . . . . . . . . . . . . . . . . . 44 11.2 Simple Linear Regression . . . . . . . . . . . . . . . . . . . . . . . . . . . . . . . . . 11.2.1 General Model . . . . . . . . . . . . . . . . . . . . . . . . . . . . . . . . . . . . 45 45 11.2.2 Least Square Solution . . . . . . . . . . . . . . . . . . . . . . . . . . . . . . . 45 11.2.3 Best Linear Unbiased Estimators: BLUE . . . . . . . . . . . . . . . . . . . . . 46 11.2.4 Normal Assumptions . . . . . . . . . . . . . . . . . . . . . . . . . . . . . . . . 47 12 Regression Models 12.1 Errors in Variables ”EIV) Models . . . . . . . . . . . . . . . . . . . . . . . . . . . . . 50 50 12.1.1 Functional And Structural Relationship . . . . . . . . . . . . . . . . . . . . . 50 12.1.2 Mathematical Solution: Orthogonal Least Squares . . . . . . . . . . . . . . 50 12.1.3 Maximum Likelihood Estimation . . . . . . . . . . . . . . . . . . . . . . . . . 50 12.1.4 Confidence Sets . . . . . . . . . . . . . . . . . . . . . . . . . . . . . . . . . . . 12.2 Logistic Regression And GLM . . . . . . . . . . . . . . . . . . . . . . . . . . . . . . . 51 51 12.2.1 Generalized Linear Model . . . . . . . . . . . . . . . . . . . . . . . . . . . . . 51 12.2.2 Logistic Regression . . . . . . . . . . . . . . . . . . . . . . . . . . . . . . . . . 12.3 Robust Regression . . . . . . . . . . . . . . . . . . . . . . . . . . . . . . . . . . . . . . 51 52 12.3.1 Huber Loss . . . . . . . . . . . . . . . . . . . . . . . . . . . . . . . . . . . . . 52 1 Probability Theory We will not discuss elementary set theory and probability theory. • Kolmogorov’s axiom set defines a probability function for a given σ-algebra. • Bonferroni’s inequality is useful for having a gut estimation of lower bound for events that are hard or impossible to calculate probabilities for. It is equivalent to Boole’s inequality. – Is a generalization of: P (A ∩ B) ≥ P (A) + P (B) − 1 * Proof: P (A ∪ B) = P (A) + P (B) − P (A ∩ B). Rearranging, we get P (A ∩ B) = P (A) + P (B) − P (A ∪ B) ≥ P (A) + P (B) − 1. • Random variables: function mapping from sample space to real numbers. 2 Transformations and Expectations 2.1 Transformations of random variables This section covers functions of random variables and how to derive their cdf from the cdf of the original RV. Say we have a random variable X with a pdf fX or a cdf FX . What is the distribution of Y = g (X)? 4 2.1.1 Monotonic functions We can only do this for monotonic functions, or at least piecewise monotonic functions. So what do we do when function Y = g (X) is monotonic? • If monotonically increasing, FY (y) = P (Y ≤ y) = P (g (x) ≤ y) = P x ≤ g −1 (y) = FX g −1 (y) • If decreasing FY (y) = P (Y ≤ y) = P (g (x) ≤ y) = P x ≥ g −1 (y) = 1 − FX g −1 (y) What do you do when you have pdf, not cdf of the original RV? You don’t have to go through the above way; you can differentiate above using chain rule – the below formula takes care of both increasing and decreasing functions. fY (y) = fX g −1 d −1 (y) g (y) dy In fact, this is used far more often than the cdf case. 2.1.2 Piecewise monotonic functions You can also do this when g() is piecewise monotonic. it means, you should be able to partition χ, the domain of the original RV, into contiguous sets so the function is monotonic in each partition. For example, if f (X) = X 2 , we should split the real line into (−∞, 0] and (0, ∞). Let us partition χinto multiple subsets A1 , A2 , · · · and let g1−1 , g2−1 , · · · be the inverse of g() in each of the intervals. Then we state without proof fY (y) = X fX d gi−1 (y) gi−1 (y) dy which basically sums up the previous formula for each interval. 2.1.3 Probablity integral transformation If X has a cdf FX , and we say Y = FX (X), then Y is uniformly distributed on (0, 1). This can be understood intuitively: let FX (x) = y. Then P (Y ≤ y) = P (X ≤ x) = FX (x) = y. This of course assumes monotonicity on FX ’s part, which is not always true, but this can be treated technically. 2.2 Expected Values This section discusses the definition of expected values and their properties. The linearity of expectation arises from integration which is how EVs are defined: E (A + B) = EA + EB 5 regardless if A and B are independent or not. When you want to make transformation of a random variable and take its expected value, you can calculate EVs directly from definition. Otherwise, you can transform the pdf using the above strategy and go from there. 2.3 Moments and Moment Generating Functions Definitions: • The nth moment of X, µn is defined by E (X n ). ′ • The nth central moment of X, µn is defined by E ((X − µ) ). n • A moment generating function of X is defined as MX (t) = EetX = ´ x etx fX (x) dx. • Variance VarX is defined as the second central moment. Of couse, we have the following equality as well: VarX = EX 2 − (EX) 2 A moment generating function can be used to generate moments: we have dn MX (0) = EX n dtn Moment generating functions can be used to identify distributions; if two distributions have same mgf and all moments exist, they are the same distribution. We discuss some theorems regarding convergence of mgfs to another known mgf to prove the convergence of the distribution. It looks like it has more of a theoretical importance, rather than practical. 3 Common Families of Distribution 3.1 Discrete Distributions Discrete Uniform Distribution The simplest of sorts. • P (X = x|N ) = • EX = N +1 2 , 1 N, x ∈ 1, 2, 3, · · · , N VarX = (N +1)(N −1) 12 Hypergeometric Distribution Say we have a population of size N , of which M has a desired property. We take a sample of size K ”typically K ≪ M ). What is the probablity that x of those have this property? • pmf is derived from counting principles, EV and Var from a similar manner to binomial distribution: rewrite the sum as a sum of hypergeometric pmf for a smaller parameter set which equals 1. N −M N • P (X = x|N, M, K) = M / K x K−x 6 • EX = KM N , VarX = KM N Binomial Distribution • P (X = x|N, p) = N x (N −M )(N −K) N (N −1) px (1 − p) N −x • EX = np, VarX = np (1 − p) Poisson Distribution • P (X = x|λ) = e−λ λx x! • EX = VarX = λ • When a binomial distribution’s p is very small, the distribution can reasonably approximated by a Poisson distribution with λ = np. ”Proof uses mgfs) Negative Binomial Distribution If we want to know the number of Bernoulli trials required to get r successes? Put another way, we are interested in the number of failures before rth success. • P (Y = y) = (−1) y −r y y pr (1 − p) = r+y−1 y pr (1 − p) y • EY = r 1−p p ”a simple proof: you can find expected number of failures before each success andsum them, because linearity. Woohoo!) • VarY = r(1−p) p2 = µ + 1r µ2 • Negative binomial family includes Poisson as a limiting case ”Poisson is also related with Binomial, so this seems natural) but doesn’t seem to have a large practical significance. Geometric Distribution A special case of negative binomial distribution with r = 1. • P (X = x) = p (1 − p) • EX = p1 , VarX = x−1 1−p p2 • Memoryless property: history so far has no influence on what will happen from now on. So: P (X > s|X > t) = P (X > s − t) 3.2 Continuous Distributions Uniform Gamma A highly generic & versatile family of distributions. • A primer on gamma function Γ: ´∞ – Γ (α) = 0 tα−1 e−t dt which also has a closed form when α ∈ N. – Also, the gamma function serves as a generalization of factorial, because Γ (α + 1) = αΓ (α) if α > 0. ”This makes Gamma function easy to evaluate when we know its values between 0 and 1) 7 – We have Γ (α) = (α − 1)! for integers. • The full gamma family has two parameters, α”shape parameter, defines peakedness) β the scale parameter ”determines spreadness). • The pdf is set as f (x|α, β) = 1 xα−1 e−x/β Γ (α) β α • EX = αβ, VarX = αβ 3 • Being a generic distribution, it is related to many other distributions. Specifically, many distributions are special cases of Gamma. – P (X ≤ x) = P (Y ≥ α) where Y ∼ Poisson (x/β) – When α = p/2 ”p is an integer) and β = 2, it becomes a chi-squared pdf with p degrees of freedom. – When we set α = 1, it becomes the exponential distribution pdf with scale parameter β. ”The exponential distribution is a continuous cousin of the geometric distribution.) – It is also related to the Weibull distribution which is useful for analyzing failure time data and modeling hazard functions. • Applications: mostly relted with lifetime testing, etc. Normal without doubt, the most important distribution. • pdf f X = x|µ, σ 2 = 2 1 √ e−(x−µ) / σ 2π 2σ 2 • Proving the pdf integrates to 1 is kind of clunky. • EX = µ, VarX = σ 2 . • 68% - 95% - 99% rule. • Thanks to CLT, normal distribution pops up everywhere. One example would be using normal to approximate binomials. If p is not extreme and n is large, normal gives a good approximation. – Continuity correction: Say Y ∼ Binomial (n, p) and X ∼ n (np, n (1 − p) p), we can say P (a ≤ Y ≤ b) ≈ P (a ≤ X ≤ b). However, P a − 21 ≤ X ≤ b + 12 is a much better approximation, which is clear from a graphical representation. Beta One of rare distributions which have a domain of [0, 1]. Can be used to model proportions. • Given that B (α, β) = ´1 0 xα−1 (1 − x) β−1 f (X = x|α, β) = 8 dx , 1 β−1 xa−1 (1 − x) B (α, β) • Since the Beta function is related to Gamma function B (α, β) = lated to Gamma function as well. Γ(α)Γ(β) Γ(α+β) , it is re- • It can have varying shapes depending on the parameters; unimodal, monotonic, ushaped, uniform, etc. • EX = α α+β , VarX = αβ (α+β)2 (α+β+1) Cauchy A symmetric, bell-shaped curve with undefined expected value. Therefore, it is mostly used as an extreme case against which we test conjectures. However, it pops up in unexpected circumstances. For example, the ratio of two normal variables follows the Cauchy distribution. 1 f (x|θ) = π 1 + (x − θ) 2 Lognormal log of which is the normal distribution. Looks like Gamma function. • f x|µ, σ 2 = • EX = e 2 2 √ 1 e−(lg x−µ) / 2σ 2πσx µ+ σ 2 /2 2 µ+σ 2 , VarX = e − e2µ+σ 2 Double Exponential formed by reflecting the exponential distribution around its mean. 3.3 Exponential Families of Distribution A family of pdfs or pmfs is an exponential family if it can be expressed as: f (x|θ) = h (x) c (θ) exp X wi (θ) ti (x) i ! Many common families are exponential; normal, gamma, beta, binomial, Poisson, etc. Such form has some algebraic advantages: there are equalities which provide a shortcut for calculating the first two moments ”EV and Var) with differentiation instead of summation/integration! Will not discuss the actual formulas because they are kind of messy. The section also discusses natural parameter set of a exponential family: in the above definition, Also, the definition of full and curved exponential families are introduced; not sure about practical significance. 3.4 Scaling and Location Families If f (x) is a pdf, then the following function is a pdf as well. g (x|µ, σ) = 1 f σ x−µ σ where µ is the location parameter, σ is the scaling parameter. Expected value will get translated accordingly, and variance will grow by σ 2 . 9 3.5 Inequalities and Identities Chebychev Inequality if g (x) is a nonnegative function, P (g (x) ≥ r) ≤ Eg (X) r which looks kind of arbitrary ”the units do not match) but is useful sometimes. It sometimes provides useful boundaries. 2 which is the number of standard deviations squared For example, let g (x) = x−µ σ ”square is there to make g nonnegative). Letting r = 22 yields P x−µ σ 2 ≥4 ! 2 ≤ 1 1 (x − µ) E = 4 σ2 4 which is a lower bound of elements 2 standard deviations! This did not make any assumption on the distribution of X. Stein’s Lemma with X ∼ n θ, σ 2 and g that is differentiable and satisfies E |g ′ (X)| < ∞, E [g (X) (X − θ)] = σ 2 Eg ′ (X). Seems obscure, but useful for calculating higher order moments. Also, wikipedia notes that it is useful in MPT. 4 Multiple Random Variables 4.1 Joint and Marginal Distributions Mostly trivial stuff. We extend the notion of pmf/pdfs by adding more variables, which give us joint pdf/pmfs. Marginal distributions ”distribution of a subset of variables without referencing the other variables) are introduced. Intuitively, they are compressed versions of joint pdf/pmfs by integrating them along a subset of parameters. 4.2 Conditional Distributions and Independence Intuitively, conditional distributions are sliced versions of joint pdf/pmfs. Some of the random variables are observed; what are the distribution of the remaining variables given the observation? The derivation of conditional pmf is straightforward for discrete RVs, it is the ratio of joint pmf and marginal pmf. This relationship, somewhat surprisingly, holds true for continuous RVs as well. Two variables X and Y are said to be independent when f (x, y) = fX (x) fY (y). Actually, the converse is true as well; if the joint pdf can be decomposed into a product of two functions, one on x and one on y, they are independent. Consequences of independence: 10 • E (g (X) h (Y )) = Eg (X) Eh (Y ) • Covariance is 0 • You can get the mgf of their sum by multiplying individual mgfs. This can be used to derive the formula for adding two normal variables. 4.3 Bivariate Transformations This section mainly discusses strategies of taking transformations ”sum, product, division) of two random variables. This is analogous to section 2.1 where we discussed transformations of a single variable. Problem: You have a random vector (X, Y ) and want to know about U = f (X, Y ). Strategy: We have a recipe for transforming a bivariate vector into another. So we transform (X, Y ) into (U, V ) and take the marginal pdf to get the distribution of U . V is chosen so it will be easy to back out X and Y from U and V ; which is essential in the below recipe. Recipe: Basically, similar to transformation recipe in 2.1. However, the derivative of the inverse function is replaced by the Jacobian of the transformation; which is defined as the determinant of the matrix of partial derivatives. J= ∂x ∂y ∂x ∂y − ∂u ∂v ∂v ∂u Given this, we have fU,V (u, v) = fX,Y (h1 (u, v) , h2 (u, v)) |J| where g1 (x, y) = u, h1 (u, v) = x, g2 (x, y) = y, h2 (u, v) = y. Similar to formula in 2.1, this assumes the transformation is 1-to-1, and thus the inverse exists. When this assumption breaks, we can use the same trick as in 2.1 by breaking the domain into sets where in each set the transformation is 1:1. fU,V (u, v) = k X i=1 which is the formula in 4.3.6. 4.4 fX,Y (h1i (u, v) , h2i (u, v) |Ji |) Hierarchical Models and Mixture Distributions Hierarchical models arise when we model a distribution where a parameter has its own distribution. This is sometimes useful in gaining a deeper undestanding of how things work. As an example, say an insect lays a large number of eggs following Poisson, and individual egg’s survival is a Bernoulli trial. Then, the expected number of surviving insect is X|Y ∼ binomial (Y, p) and Y ∼ Poisson (λ) . 11 This section also introduces a trivial, but useful equality: EX = E (E (X|Y )) This is very intuitive if you think about it, but realizing this makes calculations very easy sometimes. A noncentral chi-squared distribution is given as an example. A formula for variance in hierarchical model is given: VarX = E (Var (X|Y )) + Var (E (X|Y )) 4.5 Covariance and Correlation This section introduces covariances and correlations. Important stuff, but it only gives rather a basic treatment. Definitions and identities: • Cov (X, Y ) = E [(X − µX ) (Y − µY )] = EXY − µX µY • ρXY = Cov(X,Y ) σX σY • Var (aX + bY ) = a2 VarX + b2 VarY + 2abCov (X, Y ) This section also introduces bivariate normal distributions. 4.6 Multivariate Distributions A strategy for transforming a vector of random variable is introduced. Since the Jacobian is well defined for larger matrices, the recipe is more or less the same with the bivariate case. 4.7 Inequalities and Identities. Analogous to chapter 2, we have a section devoted to inequalities and identities. Apparently, all of these inequalities have many forms, being applied in different contexts. Many of these have popped up in CvxOpt course as well. ”Looks like most primitive forms come from field of mathematical analysis.) Holder’s Inequality Let p, q be real positive numbers s.t. have p 1/p |EXY | ≤ E |XY | ≤ (E |X| ) 1 p + 1 q = 1 and X, Y are RV. Then we q 1/q (E |Y | ) Cauchy-Schwarz Inequality A special case of Holder’s inequality when p = q = 2. Then, |EXY | ≤ E |XY | ≤ q E |X| E |Y | 2 2 In vector terms, it means x · y ≤ |x| |y|. This is intuitive, as taking inner product gives chance of things canceling out each other, just like triangular inequality. 12 Also notable is that this can be used to prove the range of the correlation; just take |E (X − µX ) (Y − µY )| and apply CS inequality. Squaring each side gives 2 2 2 (Cov (X, Y )) ≤ σX σY Minkowski’s Inequality This feels like an additive version of Holder’s Inequality. p 1/p [E |X + Y | ] p 1/p ≤ [E |X| ] p 1/p + [E |Y | ] Jensen’s Inequality on convex function. Given a convex function g, Eg (X) ≥ g (EX) 5 Properties of a Random Sample This chapter deals with several things: • Definition of random sample • Distribution of functions of random sample ”statistics) and how they converge as we increase sample size • And of course, the LLN and the CLT. • Generating random samples. 5.1 Basic Concepts of Random Samples A random sample X1 , · · · , Xn is a set of independent and identically distributed ”iid) RVs. This means we are sampling with replacement from an infinite population. This assumption doesn’t always hold, but is a good approximation in a lot of cases. 5.2 Sums of Random Variables from a Random Sample Sums of random variables can be calculated, of course, using the transformation strategies from Chapter 4. However, since each random variable is iid, the calculation can be simplified greatly. Also, a definition: Given a vector-or-scalar valued statistic Y = T (X1 , X2, · · · ), the distribution of Y is called the sampling distribution of Y . 13 5.2.1 Basic Statistics Two most basic statistics are introduced. ¯ is defined as Sample mean X X ¯= 1 X Xi n i Sample variance S 2 is defined as S2 = 1 X ¯ Xi − X n−1 i The formula for sample variance raises some questions; why n − 1, not n? This was chosen so that ES 2 = σ 2 . If we were to use n, S 2 would be a biased towards 0. 5.2.2 Bessel’s Correction Using n − 1 instead of n as the denominator in sample variance is called Bessel’s Correction. The legitimacy of this can be proven by taking ES 2 and seeing it equals to σ 2 , but the wikipedia page offers some explanation. By taking sample mean, we are minimizing the squared error of the samples. So unless the sample mean is equal to population mean, sample variance must be smaller than variance measured using the population mean. Put more intuitively, the sample mean skews towards whatever sample observed, so the variance will be smaller than real. Another subtle, but astounding point mentioned is that by Jensen’s inequality, S is a biased estimator of standard deviation – it underestimates! Since square root is a concave function, according to Jensen’s inequality we have √ √ √ E S 2 ≤ ES 2 = σ 2 = σ Also, it is noted that there is no general formula for an unbiased estimate of the standard deviation! 5.2.3 Sampling Distributions of Sample Mean and Sample Variance ¯ = µ: the expected value of sample mean is the population mean. LLN will state that • EX it will converge to the population mean almost surely as the sample size grows. ¯= • VarX σ2 n : this follows from that the random variables are independent. Var 1X Xi n = X VarX σ2 1 1 Var = X = i n2 n n So, the variance decreases linearly with the sample size. 14 • ES 2 = σ 2 . This can be shown algebraically. 5.2.4 Using mgfs to Find Sampling Distributions We can plug the statistic’s definition into mgf, and simplify, praying the mgf would be a recog nizable form. For example, this is how we show the mean of iid normal variables Xi ∼ n µ, σ 2 2 follows n µ, σn . 5.3 Sampling From the Normal Distribution More notable facts when we sample from the normal distribution. ¯ and S 2 are independent random variables. • X ¯ has a n µ, σ 2 /n distribution ”proven by mgfs as noted above) • X • (n − 1) S 2 /σ 2 has a chi-squared distribution with n − 1 degrees of freedom. 5.3.1 Student’s t-distribution If Xi ∼ n µ, σ 2 , we know that ¯ −µ X √ ∼ n (0, 1) σ/ n However, in most cases µ and σ are unknown parameters. This makes it hard to make inferences about one of them. We can approximate σ by S: this gives us another distribution, however it makes it easier to make inferences about µ. So, the statistic ¯ −µ X √ S/ n is known to follow Student’s t-distribution with n − 1 degrees of freedom. The concrete distri¯ and S , and their respective distribution could be found using the independence between X butions ”normal and chi-squared). 5.3.2 Fisher’s F -distribution Now we are comparing variances between two samples. One way to look at this is the variance ratio. There are two variance ratios; one sample, one population. Of course, we don’t know about population variance ratios. However, the ratio between the two ratios ”I smell recursion) 2 2 SX /SY2 S 2 /σX = X 2 2 2 2 σX /σY SY /σY is known to follow F -distribution. The distribution is found by noting that in the second representation above, both the numerator and the denomiator follows chi-squared distributions. 15 5.4 Order Statistics Order statistics of a random sample are the sorted sample values. This seems obscure, but indeed is useful where point estimation depends on the minimum/maximum value observed. The pmf/pdf of those can be derived from noticing that: • Say we want to find P X(j) ≤ xi ”X(j) is thejth smallest number). • Each random variable is now a Bernoulli trial, with FX (xi ) probability of being ≤ xi . • So the cumulative functions can be derived from binomial distribution of each variable ”for discrete) or something similar ”continous). fX(j) (x) = 5.5 n! j−1 n−j fX (x) [FX (x)] [1 − FX (x)] (j − 1)! (n − j)! Convergence Concepts The main section of the chapter. Deals with how sampling distributions of some statistics change when we send the sample size to infinity. 5.5.1 Definitions Say we have a series of random variables {Xi }: Xn being the statistic value when we have n variables. We study the behavior of limn→∞ Xn . There are three types of convergences: Convergence in Probability when for any ǫ > 0, lim P (|Xn − X| ≥ ǫ) = 0 n→∞ Almost Sure Convergence when P lim |Xn − X| ≥ ǫ = 0 n→∞ which is a much stronger guarantee and implies convergence in probability. Convergence in Distribution when their mgfs converge and they have the same distribution. This is equivalent to convergence in probability when the target distribution is a constant. 5.5.2 Law of Large Numbers Given a random sample {Xi } where each RV has finite mean, the sample mean converges almost surely to µ, the population mean. There is a weak variant of LLN, which states it converges in probability. 16 5.5.3 Central Limit Theorem The magical theorem! When we have a sequence of iid RVs {Xi } with EXi = µ and VarXi = σ 2 > 0 then lim n→∞ ¯n − µ X √ ∼ n (0, 1) σ/ n which also means ¯ n ∼ n µ, σ 2 lim X n→∞ Another useful, and intuitive theorem is mentioned: Slutsky’s Theorem if Yn converges to a constant a in probability, and Xn converges to X in distribution, • Xn Yn = aX in distribution • Xn + Yn = a + X in distribution Slutsky’s theorem is used in proving that normal approximation with estimated variance goes to standard normal as well. We know lim n→∞ ¯n − µ X √ ∼ n (0, 1) σ/ n and we can prove lim n→∞ σ =1 S in probability. Multiplying those yields lim n→∞ ¯n − µ X √ ∼ n (0, 1) S/ n Marvelous! 5.5.4 Delta Method Delta method is a generalized version of CLT. Multiple versions of it are discussed, however here I will only state the most obvious univariate case. σ2 lim Yn ∼ n µ, n→∞ n 2 g ′ (µ) σ 2 =⇒ lim g (Yn ) ∼ n g (µ) , n→∞ n ! When Yn converges to µ with normal distribution when we increase n with virtual certainty, a function of Yn converges to a normal distribution. In the limiting case, both are virtually a constant, so this doesn’t surprise me much. 17 6 Principles of Data Reduction This chapter seems to be highly theoretic. Without much background, it is hard to say why this material is needed. However, it looks like this chapter is closely related with the next chapter point estimation. That makes sense, because estimating point parameters are essentially data reduction. 6.1 The Sufficiency Principle 6.1.1 Sufficient Statistic Colloquially, a sufficient statistic captures all information regarding a parameter θ in a sample x; there are no remaining information to be obtained by consulting the actual sample. Formally, a statistic T (X) is a sufficient statistic if the conditional distribution Pθ (X|T (X)) does not depend on θ. The practical upshot of this is that this justifies only reporting means and standard deviations of a given sample; if we assume the population is normal, they are sufficient statistics which contain all the information we can infer about the population. However, remember that these are model dependent; the population might be coming from a different family with different parameters – those might not be entirely captured by the statistic. 6.1.2 Factorization Theorem The definition could be directly used to verify if a given statistic is sufficient or not, but practically the following theorem makes it easier to identify sufficient statistics. If the joint pdf f (x|θ) could be factored as a product of two parts: f (x|θ) = g (T (x) |θ) · h (x) where h (x) does not depend on θ, then T (X) is a sufficient statistic. This makes intuitive sense; if T is sufficient, the probabity of us seeing x is related with only two things: a function of the statistic ”given θ) and a function unrelated to θ. If there were a part with another input involved, we wouldn’t be able to make inferences about θ with only T . 6.1.3 Minimal Sufficient Statistics There are lots of sufficient statistics, some more compact than the other. So what is a minimal sufficient statistic? A sufficient statistic T (X) is minimal when for any other sufficient statistic T ′ (X), T (X) is a function of T ′ (X). In other words, take any sufficient statistic, and we can use it to derive a minimal sufficient statistic. For example, the sample mean x ¯ is a sufficient statistic for population mean µ. On the other hand, the sample itself is a sufficient statistic but not minimal – you can derive x ¯ from the sample, but not vice versa. 18 6.1.4 Ancillary Statistics Ancillary statistic contains no information about θ. Paradoxically, an ancillary statistic, when used in conjunction with other statistics, does contain valuable information about θ. The following is a good example; let X have the following discrete distribution Pθ (X = θ) = Pθ (X = θ + 1) = Pθ (X = θ + 2) = 1 3 Now, say we observe a sample and take the range of the sample R = X(N ) − X(1) . It is obvious that the range itself has no information regarding θ. However, say we know the mid-range statistic as well; M = X(1) + X(N ) /2. The mid-range itself can be used to guess θ, but if you combine it with the range, suddely you can nail the exact θ if R = 2. Of course, in the above case, the statistic M was not sufficient. What happens when we have a minimal sufficient statistic? The intuition says they should be independent. However, it could not be the case. In fact, the pair X(1) , X(N ) is minimal sufficient and R is closely related to them! So they are not independent at all. 6.1.5 Complete Statistics For many important situations, however, the minimal sufficient statistic is indeed independent of ancillary variables. The notion of complete statistic is introduced, but the definition is very far from intuitive. It goes like this: let T (X) ∼ f (t|θ). If ∀θEθ g (T ) = 0 =⇒ ∀θPθ (g (T ) = 0), T (X) is called a complete statistic. Colloquially, T (X) has to be uncorrelated with all unbiased estimators of 0. So WTF does this mean at all? It looks like we will get more context in the next chapter. The most intuitive explanation I could get was from here. It goes like Intuitively, if a nontrivial function of T has mean value not dependent on θ, that mean value is not informative about θ and we could get rid of it to obtain a sufficient statistic simpler . Hopefully reading chapter 7 will give me more background and intuition so I can revisit this. 6.2 The Likelihood Principle The likelihood function is defined to be L (θ|x) = f (x|θ) We can use likelihood functions to compare the plausibility of various parameter values. Say if we don’t know the parameter and observed x. If for two parameters θ1 and θ2 , if we have L (θ1 |x) > L (θ2 |x), we can say θ1 is more plausible than θ2 . Note we used plausible rather than probable . The likelihood principle is an important principle used in later chapters on inferences: if x and y are two sample points such that L (θ|x) is proportional to L (θ|y), that is, there is a constant 19 C (x, y) such that L (θ|x) = C (x, y) L (θ|y), then the conclusions drawn from x and y should be identical. 7 Point Estimation This chapter deals with estimating parameters of a population by looking at random samples. The first section discusses strategies for finding estimators; the second section deals with ways to evaluate the estimators. 7.1 Methods of Finding Estimators 7.1.1 Method of Moments for Finding Estimator Basically, you can equate expected values of arbitrary functions of the random sample with realized value to estimate parameters. Method of moments use the first k sample moments to achieve this. Suppose we have Xi ∼ n θ, σ 2 . The first moment would be θ, the second ”uncentered) moment would be θ2 + σ 2 . So we have a system of equations " 1 n ¯ X P Xi2 # = " θ θ2 + σ2 # On the left hand side there are concrete values from the random sample; so solving this is trivial. Also note solving the above for σ gives σ ˜2 = X 1X 2 ¯2 = 1 ¯ 2 Xi − X Xi − X n n which does not have Bessel’s correction. This is an example where the method of moments come short; it is a highly general method where you can fall back on, but in general it produces relatively inferior estimators1 . Interesting Example: Estimating Both Parameters Say we have Xi ∼ binomial (k, p) where both k and p are unknown. This might be an unusual setting, but here’s an application: if we are modeling crime rates – you don’t know the actual number of crimes committed k and the reporting rate p. In this setting, it is hard to come up with any intuitive formulas. So we could use the method of moments as a baseline. Equating the first two moments, we get: " # # " ¯ X kp = 1 2 kp (1 − p) + k 2 p2 n Xi Solving this gives us an approximation for k: 1 However, this is still a maximum-likelihood estimate. 20 k˜ = which is a feat in itself! ¯ − (1/n) X ¯2 X P ¯ Xi − X 2 7.1.2 Maximum Likelihood Estimation MLE is, by far, the most popular technique for deriving estimators. There are multiple ways to find MLEs. Classic calculus differentiation is one, exploiting model properties is two, using computer software and maximizing it numerically is three. Couple things worth noting: using log-likelihood sometimes makes calculations much easier, so it’s a good idea to try taking logs. Another thing is that MLE can be unstable - if inputs change slightly, the MLE can change dramatically. ”I wonder if there’s any popular regularization scheme for MLEs. Maybe you can still use ridge style regularization mixed with cross validation.) There’s a very useful property of maximum likelihood estimators called the invariance prop ˆ ˆ erty of maximum likelihood estimators, which says that if θ is a MLE for θ, then r θ is a MLE for r (θ). This is very useful to have to say the least. 7.1.3 Bayes Estimators The Bayesian approach to statistics is fundamentally different from the classical frequentist approach, because they treat parameters to have distribution themselves. In this approach, we have a prior distribution of θ which is our belief before seeing the random sample. After we see some samples from the population, our belief is updated to the posterior distribtion following this formula: π (θ|x) = ´ f (x|θ) π (θ) f (x|θ) π (θ) dθ which is just the Bayes formula. Conjugate Families In general, for any sampling distribution, there is a natural family of prior distributions, called the conjugate family. For example, binomial family’s conjugate family is the beta family. Let’s say if we have a binomial (n, p) distribution where only p is unknown. If our prior distribution of p is beta (α, β), then after observing a sample y our posterior distribution updates as: beta (y + α, n − y + β). So classy and elegant! However it is debatable that a conjugate family always should be used. Also, normals are their own conjugates. 7.1.4 The EM Algorithm The EM algorithm is useful when the likelihood function cannot be directly maximized; due to missing observations or latent variables which are not observed. The setup goes like this; 21 given a parameter set θ, there are two random variables x and y of which only y is observed. The marginal distribution for y, g (y|θ), is unknown, however we do know f (y, x|θ). Since x is not observed ”or incomplete), it is hard to estimate θ from given y. The EM algorithm solves it by an iterative approach. We start with a guess of the parameter θ (0) , and the following two steps are repeated: • Expectation step: Given the latest guess for the parameter θ(i) , and the observed y, find the expected x. • Maximization step: Given the x and y, find the parameter θ(i+1) that is most plausible for this pair of observations. It can be proven that the likelihood from successive iterations of parameters are nondecreasing, and will eventually converge. EM Algorithm, Formally The above two steps are just colloquial descriptions; the actual expected x is not directly calculated. In the expectation step, the following function is created: Q θ|θ(t) = EX|Y,θ [log L (θ; X, Y)] Let’s see what this function is trying to do; since we have a guess for the parameter θ(t) , we now can plug this into the joint pdf and find the distribution of the pair (x, y). For each concrete pair of observations, we can calculate the log-likelihood of θ using this observation. Q is simply a weighted average of these likelihoods. Q is a function of θ, and answers this question: Let’s say (x, y) ∼ f x, y|θ(t) . Now what is the EV of log likelihood for a given θ? Now the second step puts this function through argmax operator. 7.2 Methods of Evaluating Estimators This section is much more involved than the previous section, and discusses multiple strategies of evaluating estimators – also discusses some strategies to improve existing estimators. 7.2.1 Mean Squared Error A simple, intuitive way of measuring the quality of the estimator is taking the MSE: Eθ (W − θ) 2 note this is a function of the parameter θ. Also, MSE has a very intuitive decomposition: Eθ (W − θ) = Varθ W + (Eθ W − θ) 2 22 2 The first term is the variance of the parameter, while the second term is the square of the bias. Variance represents the precision of the estimator; if variance is high, even if the estimator works in average, it cannot be trusted. If the bias is high, it will point in a wrong direction. So this tradeoff is a topic that is discussed throughout this chapter. P ¯ 2 / (n − 1) is an unbiased estimaXi − X Quantifying Bassel’s Correction We know S 2 = n tor of σ 2 , thus the bias is 0. However, we also know n−1 S 2 is the maximum likelihood estimator. Which of these are better in terms of MSE? Carrying out the calculations tells you the MLE will give you smaller MSE; so by accepting some bias, we could reduce the variance and the overall MSE. Which estimator we should ultimately use is still debatable. No Universal Winner Since MSE are functions of parameters, it often is the case the MSE of two estimators are incomparable, because one can outperform another on a certain parameter set, but can underperform on another parameter set. In the text, this is shown with an example of estimating p from binomial (n, p) where n is known. Two approaches are showcased; one is P just using the MLE Xi /n, another is taking a Bayesian estimate from a constant prior. If you plot the MSE against different values of p, MSE from the MLE is a quadractic curve; but the MSE from the Bayesian estimate is a horizontal line. Therefore, one doesn’t dominate the other – plotting for different n will reveal the Bayesian approach gets better as we increase n. 7.2.2 Best Unbiased Estimator One way of solving the bias-variance tradeoff problem is to ignore some choices! We can restrict ourselves to unbiased estimators and try to minimize variance. In this setting, the best estimator is called a uniform minimum variance unbiased estimator ”UMVUE). Finding UMVUE is a hard problem; it would be hard to prove that the given estimator is the global minimum. Finding Lower Bounds The Cramer-Rao Theorem sometimes helps; it is an application of the Cauchy-Schwartz inequality which provides a lower bound for the variance of an unbiased estimator. So if this limit is reached, we can say for sure we have a UMVUE. This is indeed attainable for some distributions - such as Poisson. The big honking problem of CR theorem is that the bound is not always sharp – sometimes the bound is not attainable. Since CR is an application of CS inequality, we can state the condition under which the equality will hold. This can either give us hints about the shape of the UMVUE, or let us prove it is unreachable. Sufficiency and Completeness for UMVUE Somewhat surprising and arbitrary - but sufficient or complete statitics can be used to improve unbiased estimators, by conditioning the 23 estimator on the sufficient statistic! The Rao-Blackwell theorem specifies that if W is any unbiased estimator of an arbitrary function of θ, τ (θ), the following function is a uniformly better unbiased estimator: φ (T ) = E (W |T ) This was a WTF moment for me. However, note that Varθ W = Varθ [E (W |T )] + E [Var (W |T )] ≥ Varθ [E (W |T )] for any T – you can condition on any statistic, even totally irrelevant, and it can never actually hurt. Then why the requirement for sufficiency? If not, the estimator will become a function of θ so it isn’t exactly an estimator. Can we go further than that? Can we create a UMVUE from sufficient statistics? We analyze the properties of a best estimator to find out. Suppose we have an estimator W satisfying Eθ W = τ (θ). Also say we have an unbiased estimator of 0, U . Then the following estimator φa = W + aU is still an unbiased estimator of τ (θ). What is the variance of this? Varθ φa = Varθ (W + aU ) = Varθ W + a2 Varθ U + 2aCovθ (W, U ) Now, we can always concoct a U such that Covθ (W, U ) < 0 so Varθ φa < Varθ W . Note that U is essentially a random noise for estimation - yet it can give us an improvement. This doesn’t make sense at all. Theorem 7.3.20 actually brings order, by stating that W is the UMVUE iff it is uncorrelated with all unbiased estimators of 0. Wait, that definition sounds familiar. Recall the definition of complete statistics? Now we have to guess they are somewhat related. They indeed are, by Theorem 7.3.23. This states: Let T be a complete sufficient statistic for a parameter θ, and let φ (T ) be any estimator based only on T , then φ (T ) is the unique best unbiased estimator of its expected value. 7.2.3 General Loss Functions MSE is a special case of loss function, so we can generalize on that. Absolute error loss and squared loss are the most common functions, but you can come up with different styles, of course. Evaluating an estimator on a given loss function L (θ, a) is done by a risk function: R (θ, δ) = Eθ L (θ, δ (X)) 24 which is still a function of the parameter. Also note when we use squared loss function, R becomes MSE. Stein’s Loss Function For scale parameters such as σ 2 , the values are bounded below at 0. Therefore, a symmetric loss function such as MSE can be penalizing overestimation because the penalty can grow infinitely only in one direction. An interesting class of loss function, which tries to overcome this problem, is introduced: a a L σ 2 , a = 2 − 1 − log 2 σ σ which goes to infinity as a goes to either 0 or infinity. Say we want to estimate σ 2 using an estimator δb = bS 2 for a constant b. Then R σ 2 , δb = E bS 2 bS 2 − 1 − log 2 2 σ σ which is minimized at b = 1. Bayes Risk = b − log b − 1 − E log S2 σ2 Instead of using the risk function as a parameter of θ, we can take a prior distri- bution on θ and getting the expected value. This takes us to the Bayes risk: ˆ R (θ, δ) π (θ) dθ Θ Finding the estimator δ which minimizes the Bayes risk seems daunting but is tractable. Note: ˆ L (θ, δ (x)) f (x|θ) dx π (θ) dθ Θ χ ˆ ˆ = L (θ, δ (x)) π (θ|x) dθ m (x) dx R (θ, δ) π (θ) dθ = Θ ˆ ˆ χ Θ The quantity in square brackets, which is the expected loss given an observation, is called the posterior expected loss. It is a function of x, not θ. So we can minimize the posterior expected loss for each x and minimize Bayes risk. A general recipe for doing this is not available, but the book contains some examples of doing this. 8 Hypothesis Testing This chapter deals with ways of testing hypotheses, which are statements about the population parameter. 25 8.1 Terminology In all testing, we use two hypothesis; the null hypothesis H0 and the alternative hypothesis H1 , one of which we will accept and the other we will reject. We can always formulate the hypothesis as two sets: H0 is θ ∈ Θ0 and H1 is θ ∈ ΘC 0 . We decide which hypothesis to accept on the basis of a random sample. The subset of the sample space which will make us reject H0 is called the rejection region. Typically, a hypothesis test is performed by calculating a test statistic and rejecting/accepting H0 if the statistic falls into a specific set. 8.2 Methods of Finding Tests We discuss three methods of constructing tests. 8.2.1 Likelihood Ratio Tests Likelihood Ratio Tests are very widely applicable, and are also optimal in some cases. We can prove t-test is a special case of LRT. The LRT calculates the ratio between the maximum likelihood, and the maximum likelihood given the null hypothesis. The test statistic λ is defined as: λ (x) = supΘ L(θ|x) 0 supΘ L(θ|x) = supΘ L(θ|x) 0 ˆ L θ|x (θˆ is MLE of θ) When do we reject H0 ? We want to reject the null hypothesis when the alternative hypothesis is much more plausible; so the smaller λ is, the more likely we will reject H0 . Therefore, the rejection region is {x|λ (x) ≤ c} where 0 ≤ c ≤ 1. Also note that λ based on a sufficient statistic of θ is equivalent to regular λ. Example: Normal LRT for testing θ = θ0 , known variance Setup: we are drawing sample from n (θ, 1) population. H0 : θ = θ0 and H1 : θ 6= θ0 . Since the MLE is x ¯, the LRT statistic is: λ (x) = h i f (x|θ0 ) 2 = ”some simplification) = exp −n (¯ x − θ0 ) /2 f (x|¯ x) Say we reject H0 when λ ≤ c; we can rewrite this condition as |¯ x − θ0 | ≥ p −2 (log c) /n Therefore, we are simply testing the difference between the sample mean and the asserted mean with a positive number. 26 Example: Normal LRT for testing µ < µ0 , unknown variance Setup: we are drawing from n µ, σ 2 where both parameters are unknown. H0 : µ ≤ µ0 and H1 : µ > µ0 . The unrelated parameter σ 2 is called a nuisance parameter. It can be shown ”from exercise 8.37) that the test relying on this statistic is equivalent to Student’s t test. 8.2.2 Bayesian Tests Bayesian tests will obtain posterior distribution from the prior distribution and the sample, using the Bayesian estimation technique discussed in Chapter 7. And we use the posterior distribution to run the test. We might choose to reject H0 only if P θ ∈ ΘC 0 |X is greater than some large number, say 0.99. 8.2.3 Union-Intersection and Intersection-Union Tests Ways of structuring the rejection region when the null hypothesis is not simple. For example, the null hypothesis ΘC 0 is best expressed by an intersection or union of multiple sets. If we have tests for each individual sets that constitute the union/intersection, how can we test the entire hypothesis? • When the null hypothesis is an intersection of sets, any test failing will result in the rejection of the null hypothesis. • When the null hypothesis is a union of sets, any test passing will let us reject the null hypothesis; null hypothesis is rejected only when all of the tests fail. 8.3 Evaluating Tests How do we assess the goodness of tests? 8.3.1 Types of Errors and Power Function Since the null hypothesis could be true or not, and we can either accept or reject it, there are four possibilities in a hypothesis test, which can be summarized in the below table: Decision Truth Accept H0 Reject H0 H0 Correct Type I Error H1 Type II Error Correct To reiterate: • Type I Error incorrectly rejects H0 when H0 is true. Since we usually want to prove the alternative hypothesis, this is a false positive error, when we assert H1 when it is not. Often this is the error people want to avoid more. 27 • Type II Error incorrectly accepts H0 when H1 is true. This is a false negative error; the alternative hypothesis is falsely declared negative. The probabilities of these two errors happening are characterized by a power function. A power function takes θ as an input, and calculates the probability that X will be in the rejection region: β (θ) = Pθ (X ∈ R) What is an ideal power function? We want β (θ) to be 0 when θ ∈ Θ0 , and 1 when θ ∈ ΘC 0. We can plot β with regards to all possible values of θ, and compare the different tests. Example: Normal Power Function Setup: drawing from n θ, σ 2 , where σ 2 is known. H0 : θ ≤ θ0 , H1 : θ > θ0 . Say we have a test that rejects H0 when ¯ − θ0 X √ >c σ/ n The power function of this test is ¯ X − θ0 √ >c β (θ) = Pθ σ/ n ¯ θ−θ X −θ √ > c+ √0 = Pθ σ/ n σ/ n θ − θ0 =P Z >c+ √ σ/ n where Z is a standard normal random variable. As we increase θ from −∞ to ∞, this probability will go from 0 to 1. Changing c will change when we reject H0 and affect the error probabilities. 1.0 0.6 0.4 0.6 0.4 0.2 0.2 0.0 −1.0 n=10 n=20 n=100 θ0 0.8 β(θ) β(θ) 0.8 1.0 c=0.1 c=0.5 c=1.0 θ0 −0.5 0.0 0.5 1.0 θ 1.5 2.0 2.5 0.0 −1.0 3.0 ”a) −0.5 0.0 0.5 1.0 θ 1.5 2.0 2.5 3.0 ”b) The figure ”a) gives an example of different c – since H0 is true when θ is left of θ0 , the type I error probability is depicted by the distance between the x-axis and the power function curve. On the right of θ0 , the type II error probability is depicted by the distance between y = 1 and 28 the curve. We can see that increasing c trades off the maximum type I error and the maximum type II error: if we have a higher c, we have a more strict criteria for rejecting H0 . This results in lower false positive, but in higher false negative. Consequences of the Power Function Figure ”b) above shows the power function for different ns. We see as we increase n, the power function approaches the ideal step function. Typically, the power function will depend on the sample size n. If n can be chosen by the experimenter, considering the power function will be useful to determine the sample size before the experiment is performed. Size and Level of Tests For a fixed sample size, it is usually impossible to make both types of error probability arbitrarily small. As most people care more about Type I errors ”since alternative hypothesis are what we want to prove), we classify tests by the maximum possible type I error across all possible parameters in Θ0 : supθ∈Θ0 β (θ) • We want these numbers to be low, since β (θ) is ideally 0 for Θ0 . Lower size/level means more powerful tests! • Note as we do not have a prior distribution of parameters, we use the maximum error probability rather than the expected error probability. • When this bound α is tight ”supθ∈Θ0 β (θ) = α), the test is called a test of size α. When this bound is not tight ”supθ∈Θ0 β (θ) ≤ α), the test is called a test of level α. – So levels are upper bounds of test powers; every test is a level 1 test but that is not informative. Unbiased Tests A test with power function β (θ) is unbiased if sup β (θ) ≤ inf β (θ) θ∈ΘC 0 θ∈Θ0 Colloquially, if when the alternative hypothesis is true, it should be more likely to reject the null hypothesis than when the null hypothesis is true. 8.3.2 Most Powerful Tests: Uniformly Most Powerful Tests Depending on the problem, there might be multiple level α tests. What should we use among them? Since we have only controlled for Type I errors so far, it is a good idea to look at Type II errors this time. The Uniformly Most Powerful test is the most powerful test across all θ ∈ ΘC 0: its power function β should be larger than any other test’s power function, for any θ ∈ ΘC 0. 29 Neymann-Pearson Lemma UMP has a very strong argument; we can easily imagine situations where the UMP does not exist. However, in some cases, they do. When you are only considering two hypothesis H0 : θ = θ1 and H1 : θ = θ2 , accepting H0 when and only when f (x|θ1 ) < kf (x|θ0 ) for some k ≥ 0 is a UMP level α test, where α = Pθ0 (X ∈ R). Colloquially, if your test is formed like above, it is a UMP for its own class ”level α). Extending Neyman-Pearson Lemma To A One-Sided Test In case of a one-sided hypothesis ”for example, θ > θ0 ), we can extend the above lemma to find a UMP. First, we need to define the following concept: a pdf has a MLR ”monotone likelihood ratio) property if: whenever θ2 > θ1 , the likelihood ratio f (t|θ2 ) /f (t|θ1 ) is a monotone function of t. ”This holds for all the regular exponential families g (t|θ) = h (t) c (θ) ew(θ)t when w (θ)is a nondecreasing function.) Now, we state the following theorem: Karlin-Rubin Theorem With H0 : θ ≤ θ0 and H1 : θ > θ0 . Suppose that T is a sufficient statistic of θ and its distribution has a nondecreasing MLR. Then, for any t0 , rejecting H0 iff T > t0 is a UMP level α test, where α = Pθ0 (T > t0 ). In laymen’s terms: when the conditions are met, a hypothesis about a parameter above or below the threshold can be translated into a sufficient statistic above or below a threshold. So this is actually very intuitive, maybe even trivial, stuff. When UMP Cannot Be Found In case of two-sided hypothesis, the above theorem is not applicable. For example; drawing from n θ, σ 2 , σ 2 known. Say H0 : θ = θ0 and H1 : θ 6= θ0 . We look at two alternative values of θ, θ1 < θ0 < θ2 . We are able to show that different tests are optimal for θ1 and θ2 , while having the same level. Details: ¯ < θ0 − σzα /√n ⇐⇒ Z < −zα − • Test 1 rejects H0 when X ¯ > θ0 + σzα /√n ⇐⇒ Z > zα + • Test 2 rejects H0 when X √ √ n(θ−θ0 ) σ n(θ0 −θ) σ Note they are pathological devices, only controlling for Type I error for the sake of the proof; √ 2 ¯ − θ · n is going to ¯ both tests have spectacular Type II errors. Anyways, as X ∼ n θ, σn , X σ be a standard normal variable. Therefore you can imagine both tests having level α. However, we can easily see the power for Test 1 would be higher for θ1 < θ0 than Test 2, and vice versa for θ2 > θ0 . So there are no UMPs for level α. 30 Unbiased UMPs Note the above tests are pathetically biased. What we should do is rejecting H0 when √ ¯ − θ0 > σzα/2 / n X Obviously. The below figure shows the power function of the three tests: 1.0 0.8 0.6 0.4 biased 1 biased 2 best unbiased 0.2 0.0 θ0 Note that the best unbiased estimator has a lower probabilty of rejecting H0 for some range of θ0 , but it is clear it is better than both tests in general. 8.3.3 Size of UIT and IUT The size/level analysis of UIT and IUT are different. UITs are universally less powerful than LRTs, but they might be easier to reason about. 8.3.4 p-Values The definition of p-value is very unintuitive, actually. In the definition, a p-value p (X) is a test statistic. Small values of p (X) give evidence that H1 is true. A p-value is valid if, for every θ ∈ Θ0 and every 0 ≤ α ≤ 1, Pθ (p (X) ≤ α) ≤ α So WTF does this mean? p (X) ≤ α can be interpreted as the condition p-value having a value of α, or something more extreme . The probability of this happening given a θ in the null hypothesis should roughly be α. So this sort of resonates with the colloquial definition of p-value. Also note that a test that rejects H0 when p (X) ≤ α is a level α test from the above definition. Defining Valid p-Values I guess this is the more intuitive definition: let W (X) be a test statistic such that large values of W give evidence that H1 is true. Then let 31 p (x) = sup Pθ (W (X) ≥ W (x)) θ∈Θ0 so this is the colloquial definition. We can prove that p (x) is a valid p-value according to the above definition. Another method for defining p-values is discussed as well that depends on sufficient statistics. If S (X) is a sufficient statistic of θ when the null hypothesis is true, we have: p (x) = P (W (X) ≥ W (x) |S = S (x)) is a valid p-value. This makes sense as well; if we have a sufficient statistic we need no stinking inference about θ.... Calculating p-Values Calculating the supremum probability isn’t always easy; but it can be derived from the properties of the distribution. Our usual normal tests are good examples. In these cases, the test statistic follows Student’s t distribution, enabling us to nail the supremum. 8.3.5 Loss Function Optimality Since there are just two actions in a hypothesis test ”we either accept H0 or H1 ), a loss function is defined simply by: L (θ, a0 ) = 0 C θ ∈ Θ0 II θ∈ L (θ, a1 ) = ΘC 0 C 0 I θ ∈ Θ0 θ ∈ ΘC 0 where ai is the action of accepting Hi . CI and CII are the costs of type I and type II errors, respectively, and they can be a function of θ as well. 9 Interval Estimation 9.1 Introduction Interval estimation techniques give us confidence intervals of parameters; for example, we can assert µ ∈ [L (x) , U (x)] where L (x) and U (x) are functions of the random sample that predicts the parameter. What do we gain from going to interval estimations from point estimations? The probability of a point estimation being correct is 0, if the parameter is continuous. However, once we have an interval estimation, we can have nonzero probability of our prediction being correct. Here are some definitions: • A coverage probability of [L (X) , U (X)] is a function of θ, that represents the probability that the interval covers the true parameter. 32 Pθ (θ ∈ [L (X) , U (X)]) Note that the interval estimates are functions of X, thus are random variables themselves. • A confidence coefficient is the infimum of coverage probability across all possible inf P (θ ∈ [L (X) , U (X)]) θ I want to emphasize the consequences of this definition: don’t think interval estimation in terms of conditional probability! A coverage probability is not related to the conditional prob¯ seemed like a very obvious way for ability. Personally conditional probability of θ given X interval estimation, but it requires a prior distribution of θ and is strictly not a frequentist approach. The coverage probability is more like a likelihood function. It’s just ConverageProb (θ) = ˆ f (x, θ) dx C where f is the pdf and C = {x|L (x) ≤ θ ≤ U (x)}. This also changes how we interpret the results of an estimation process: the claim that 95% confidence interval of θ is [1, 10] does not mean P (θ ∈ [1, 10]) = 0.95, but P (x|θ) ≥ 0.95 for all θ ∈ [1, 10]. 9.1.1 Coverage Probability Example: Uniform Scale Distribution In many cases, the coverage probability is constant across different parameters. However, it may not be so in certain cases. The following example demonstrates this. Say we draw Xi ∼ uniform (0, θ). The sufficient statistic for θ is Y = max Xi . Now, what are our estimates for θ? We examine two candidates: • Scale intervals:[aY, bY ] where 1 ≤ a < b • Location intervals: [Y + c, Y + d] where 0 ≤ c < d Now let’s send that θ to infinitely. Location interval will have a coverage probability of 0, since the size of the interval stays constant regardless of θ. However, the scale interval manages to have a positive coverage probability because the interval’s size roughly grows with θ. ”These are more intuitive descriptions; formally they are proven by integrating pdfs of Y /θ. Also see the later section on pivotal quantities.) 9.2 Methods of Finding Interval Estimators 9.2.1 Equivalence of Hypothesis Test and Interval Estimations: Inverting a Test Statistic Hypothesis tests and interval estimations are obviously, very closely related. They both take a random sample to make an inference about the population parameter. To draw a poor analogy: both processes throw darts to a board. Hypothesis testing tell you the target position to 33 shoot for, then you throw the dart, and we will know if we landed within a certain range from the target. Interval estimation lets you throw the dart first; and gives us target positions you might have shot for. Here’s a general recipe for converting a hypothesis test into an interval estimation; just go over all the possible values of θ, use a test of size α for H0 : θ = θ0 where θ0 is a possible value. If this test passes, θ0 falls within the confidence interval. So: C (T (x)) = {θ : P (T (x) |θ) ≥ α} Of course, in real life, this is not done by enumerating all possible values but analytically. Normal Test Example Let Xi ∼ n µ, σ 2 . Consider testing H0 : µ = µ0 and H1 : µ 6= µ0 . Hypothesis test draws a region on the dart, called the acceptance region A (µ0 ), upon which we will accept H0 . Let’s use a test √ with acceptance region x : |¯ x − µ0 | ≤ zα/2 σ/ n . This test has a size of α. Now, let’s throw the dart and get a concrete x ¯. Now, we wiggle µ0 so its acceptance region will still contain x ¯. It’s easy to see the acceptance region will contain x ¯ when σ σ x ¯ − zα/2 √ ≤ µ0 ≤ x ¯ + zα/2 √ n n Yay, this is a range of parameters. Now what is the confidence coefficient? From the definition of the test, we know P (x ∈ R (µ0 ) |µ = µ0 ) = α ⇐⇒ P (x ∈ A (µ0 ) |µ = µ0 ) = 1 − α So it’s 1 − α! Formal Definition (Theorem 9.2.2) For each θ0 ∈ Θ, let A (θ0 ) be the acceptance region of a level α test of H0 : θ = θ0 . For each x ∈ X , define a set C (x) in the parameter space by C (x) = {θ0 : x ∈ A (θ0 )} Then the random set C (x) is a 1 − α confidence set. The converse holds true as well; if C is a 1 − α confidence set then A (θ0 ) = {x : θ0 ∈ C (x)} is a valid acceptance region for a level α test. 34 Shapes of Confidence Interval Also, note the above definition do not include the form of H1 . In general, one-based H1 produces one-sided C (x) and two-sided H1 produces two-sided C (x). The biased property of the inverted test also carries over to the confidence set, as can be expected. What do we do if we want C (x) = (−∞, U (x)] i.e. only upper-bounded? If a test uses H1 : µ < µ0 , its acceptance region will look like {x : x ¯ < µ0 − t} where t is a function of various things ”sample size, nuisance parameters, etc..). i.e. the acceptance region is left-bounded if looked from µ0 . Now, once we have x ¯, we can move µ0 infinitely to the left, but cannot move µ0 too far to the right. So the confidence interval is one-sided only with a upper bound. 9.2.2 Using Pivotal Quantities A pivotal quantity is a random variable whose distribution does not depend on the parameter. √ ¯ 2 2 For example, if Xi ∼ n µ, σ with σ known, X − µ / (σ/ n) is normally distributed and is a pivotal quantity. Then, we can trivially construct a confidence interval for µ. First note that P ¯ −µ X √ ≤ a = P (−a ≤ Z ≤ a) = α −a ≤ σ/ n Where a is chosen to make the last equality hold. So what µ will make this inequality hold? It’s easy to see the following will do it. σ σ µ:x ¯ − a√ ≤ µ ≤ x ¯ + a√ n n = σ σ µ:x ¯ − z1−α √ ≤ µ ≤ x ¯ + z1−α/2 √ n n Note that we choose a = z1−α/2 which splits the probability equally here. It’s a matter of choice, but for symmetric distributions such as normal, it seems natural. For asymmetric distributions such as chi-squared, a different approach will be better ”we will revisit this). In General If Q (x, θ) is a pivotal quantity, we can a and b so that Q (x, θ) will fall in that interval with a probability of α ”we can plug in concrete numbers, because we know Q’s distribution). Then, we have: C (x) = {θ0 : a ≤ Q (x, θ0 ) ≤ b} Now, we unravel Q’s definition and leave only the desired parameter in the middle, moving everything to the left and right sides. Then we have a confidence interval. 9.2.3 Pivoting CDFs Using Probability Integral Transformation The previous strategies can sometimes result in non-interval confidence sets, as shown in example 9.2.11. This strategy, when applicable, will always result in an interval. Say T (x) is 35 a sufficient statistic for θ with cdf FT (t|θ). Recall, from probability integral transform, that FT (T |θ) ∼ uniform (0, 1). So this is a pivotal quantity! For the confidence set to be an interval, we need to have FT (t|θ) to be monotone in θ. If it is monotonically increasing, we set θL (t) and θU (t) to be solution of the following system: FT (t|θL (t)) = α1 FT (t|θU (t)) = 1 − α2 where α1 + α2 = α. ”We usually set α1 = α2 = α/2 unless additional information. We will discuss about this in section 9.3) Note the above equations do not have to be solved analytically – we can solve them numerically as well. 9.2.4 Bayesian Inference As noted in the beginning of the chapter, the frequentist approach does not allow to say the parameter belongs to the confidence set with a probability of α: parameter is a fixed value and it will belong to the set with a probability of 1 or 0. The Bayesian setup precisely allows us to do that. The Bayesian equivalent of a confidence set is called a credible set, to avoid the confusion between the two approaches. The equivalent of a coverage probability is called a credible probability. In many cases, each approach looks poor if examined using the criteria from a different approach. The textbook shows some examples where the credible set has a limiting converage probability of 0, and the confidence set having a limiting credibility of 0. 9.3 Methods of Evaluating Interval Estimators We can have multiple ways of coming up with interval estimation, with the same confidence coefficient. Some is bound to be better than the others. But how do we evaluate them? 9.3.1 Size and Coverage Probability When two interval estimations have the same confidence coefficient, it is obvious to prefer a smaller interval. When we estimate the population mean of a normal distribution, we can pick any α1 , α2 ≥ 0 where α = α1 + α2 such that P (zα1 ≤ Z ≤ zα2 ) = 1 − α Obviously there are multiple choices for those. Intuition tells us that splitting probabilities evenly for the left and right hand side of the sample mean is the way to go, and it indeed is. It is justified by the following theorem: Theorem 9.3.2 Let f (x) be a unimodal pdf. We consider a class of intervals [a, b] where ´b f (x) dx = 1 − α. If f (a0 ) = f (b0 ) > 0, and x∗ ∈ [a0 , b0 ] where x∗ is the mode of f , then a 36 [a0 , b0 ] is the shortest interval which satisfies the 1 − α probability constraint. The textbook discusses a caveat for this ”See example 9.3.4) 9.3.2 Test-Related Optimality Optimality criteria for tests carry over to their related interval estimations. For example, we have some guarantee for interval estimations which are inversions of UMP tests. However, note that UMP controls type-II errors; therefore the guarantee we have for the interval estimation also looks different. UMP-inverted estimations give us optimal probability of false coverage. Colloquially, it is a function of θ and θ′ and measures the probability of θ′ being covered when θ is the truth. Note the probability of false coverage has to take different forms according to the form of the original test. Say the the interval estimation is one-sided only with upper bound. We only define the probability of false coverage for θ < θ′ , obviously – θ′ less than or equal to θ are correct. Intuition Behind False Coverage Probability We do offer some intuition about the linkage between the false coverage probability and the size of the interval; if an interval contains less false parameters, it’s more likely to be short; there are some loose links discussed in the book ”see theorem 9.3.9) which says the expected length of the interval for a given parameter value is equivalent to an integral over false positive probability. Uniformly Most Accurate (UMA) Intervals A conversion of a UMP test yields a UMA confidence set, which has the smallest probability of false coverage. Also note that UMP tests are mostly one-sided – Karlin-Rubin works only for one sided intervals. So most UMA intervals are one sided. Inverting Unbiased Tests The biasedness of tests carry over to interval estimation. In case UMP does not exist, we can invert the unbiased test to get an unbiased interval. 9.3.3 Bayesian Optimality When we have a posterior distribution, we can order all intervals of probability of 1 − α by their size. A corollary to Theorem 9.3.2 mentioned above gives us that when the posterior distribution is unimodal, {θ : π (θ|x) ≥ k} is the shortest credible interval for a credible probability of 1 − α = a region is called the highest posterior density ”HPD) region. 37 ´ π(θ|x)≥k π (θ|x) dx. Such 9.3.4 Loss Function Optimality So far we have set the minimum coverage probability we want, and then find the best tests among them. We can do something in the middle by using a generalized loss function such as L (θ, C) = b · Length (C) − IC (θ) where IC (θ) = 1 if θ ∈ C, 0 otherwise. By varying b, we can very the relative importance of the length and coverage probability. However, the use of decision theory in interval estimation problems is not widespread; it is hard to solve in many cases, and this can sometimes lead to unexpected types of sets. 10 Asymptotic Evaluations This chapter looks at asymptotic behaviors of several topics ”point estimation, hypothesis testing, and interval estimation). That is, we send sample size to infinity and see what happens. The detailed treatment of the topic seems to be the most theoretical part of the book; I just skimmed over the chapter and will try to summarize only the big ideas here. 10.1 Point Estimation 10.1.1 Criteria A point estimator’s asymptotic behavior is characterized by two properties; • Consistency means the estimator converges to the correct value as the sample size becomes infinite. lim Pθ (|Wn − θ| < ǫ) = 1 n→∞ • Efficiency looks at the variance of the estimator as the sample size becomes infinite. If the variance reaches the lower bound defined by the Cramer-Rao, the estimator is called asymptotically efficient. Concretely, an asymptotically efficient estimator Wn for a parameter τ (θ) if √ n [Wn − τ (θ)] → n [0, v (θ)] and v (θ) achieves the Cramer-Rao Lower Bound. It is notable that MLEs are in general best estimators: they are consistent estimators, and asymptotically efficient at the same time. ”Some regularity conditions are required, but it is explicitly said to hold in most common situations and you don’t really want to care about it.) 38 10.1.2 Comparing Consistent Estimators MLE is everyone’s favorite estimator. However, other estimators may have other desirable properties ”robustness, ease of calculation, etc) so we need to be able to see what we are giving up in terms of efficiency. Comparing different asymptotically consistent estimators is done by looking at their variances, through the idea of asymptotic relative efficiency ”ARE). If two estimators Wn and Vn satisfy √ n [Wn − τ (θ)] √ n [Vn − τ (θ)] Then, the ARE is defined by 2 → n 0, σW → n 0, σV2 ARE (Vn , Wn ) = 2 σW σV2 ARE is going to be a function of the parameters – so we will be able to see where it peaks, where is it larger/smaller than 1, etc. 10.1.3 Asymptotic Behavior of Bootstrapping Bootstraps are good ways to estimate variances of arbitrary estimators. For any estimator ˆ θˆ (x) = θ, Var θˆ = ∗ nn 1 X ˆ∗ ¯ˆ∗ 2 θ −θ n n − 1 i=1 i Of course, we cannot sample all nn possible samples. So we can always do a partial bootstrap by taking B random resamples. The book shows some examples where bootstrap yields a better variance estimate than the Delta method ”which exploits that when estimates are asymptotically efficient, they will reach Cramer-Rao bound – so naturally it will underestimate.). Parametric and Nonparametric Bootstrap The usual type of bootstrapping, which draws data ”with replacement) to generate random samples is called a nonparametric bootstrap. On the contrary, parametric bootstrapping asˆ and generate random samples sumes a distribution. Say Xi ∼ f (x|θ). We take MLE estimate θ, from there. X1∗ , X2∗ , · · · , Xn∗ ∼ f x|θˆ It is same as the usual nonparametric bootstrap from there. 39 Consistency and Efficiency The textbook does not cover a lot of material about the evaluation of bootstrapping. In general, it is an effective and reasonable way. 10.2 Robustness 1. It should have a reasonably good efficiency at the assumed model. 2. It should be robust in the sense that small deviations from the model assumptions should impair the performance only slightly. 3. Somewhat larger deviations from the model should not cause a catastrophe. 10.2.1 Robustness of Mean and Median The mean reaches the Cramer-Rao bound, so it is an efficient estimator. Also, if there is a small variation from the normal distribution assumption, it will fare pretty well. We can try to see this by a δ-contamination model. There, the distribution is the assumed model with a probability of 1−δ, some other distribution with δ. Note when the two distributions are similar, mean’s variance is still small. However, if the other distribution is Cauchy, for example, the variance will go to infinity. That brings us to the notion of breakdown value. A breakdown value b is the maximal portion of the sample which can go to infinity before the statistic goes infinity, or meaningless . Of course, the mean’s breakdown value is 0, where the median has 0.5. How can we compare the mean and the median? We can prove median is asymptotically normal, and use ARE to compare those in different types of distributions. Some examples in the book show it will fare better than the mean in double exponential distribution, but not in normal or logistic. So it fares better with thicker tails, as we expect. 10.2.2 M-estimators M-estimators is a generalized form of estimator. Most estimators minimize some type of criteria - for example, squared error gives the mean, absolute error gives the median, and the negative log likelihood will give you MLE. M-estimators are a class of estimators which minimize n X i=1 ρ (xi − a) Huber’s Loss Huber’s loss is a Frankenstein-style loss function created by patching squared and absolute loss together. 40 ρ (x) = 1 x2 2 k |x| − 1 k 2 2 if |x| ≤ k otherwise Works like quadratic around zero, and linear away. It’s differentiable, and continuous. k is a tunable parameter. Increasing k would be like decreasing the robustness to outliers. The minimizer to this loss function is called the Huber estimator and it is asymptotically normal with mean θ. If you do an ARE comparison with mean and median; • Huber is close to mean in normal, and better than mean at logistic or double exponential. • Huber is worse than median in double exponential, much better than it in normal or logistic. 10.3 Hypothesis Testing 10.3.1 Asymptotic Distribution of LRT When H0 : θ = θ0 and H1 : θ 6= θ0 . Suppose Xi ∼ f (x|θ). Then under H0 , as n → ∞, −2 log λ (X) → χ21 in distribution Regardless of the original distribution! Kicks ass. A more general version, which do not specify H0 and H1 explicitly, states that the quantity −2 log λ (X) will still converge to chi- squared distribution with its df equal to the difference between the number of free parameters in Θ0 and the number of free parameters in Θ1 . How do we define the number of free parameters? Most often, Θ can be represented as a subset of Rq and Θ0 can be represented as a subset of Rp . Then q − p = v is the df for the test statistic. 10.3.2 Wald’s Test and Score Test Two more types of tests are discussed. Wald Test When we have an estimator Wn for a parameter θ, which will asymtotically normal, we can use this as a basis for testing θ = θ0 . In general, a Wald test is a test based on a statistic of the form Zn = Wn − θ0 Sn Sn is standard error for Wn . ”Last time I’ve seen this was in logistic regression; they did Wald Test on regression coefficients to derive p-values of coefficient being nonzero.) 41 Score Test 10.4 Interval Estimation 11 Analysis of Variance and Regression 11.1 One-way ANOVA ANOVA is a method of comparing means of several populations, often assumed to be normally distributed. Normally, the data are assumed to be follow the model Yij = θi + ǫij where θi are unknown means and ǫij are error random variables. The classic oneway ANOVA assumptions are as follows: 1. Eǫij = 0, Varǫij = σi2 < ∞, and all errors are uncorrelated. 2. ǫij are independent, normally distributed 3. σi2 = σ 2 for all i ”also known as homoscedascity) 11.1.1 Different ANOVA Hypothesis The classic one-way ANOVA null hypothesis states H0 : θ 1 = θ 2 = θ 3 = · · · = θ k which is kind of uninformative, and doesn’t give us much information. The text starts with a more useful type of hypothesis, using contrasts. A contrast is a linear combination of variables /parameters where the weights sum up to 0. We now run the test with different hypothesis, the null being H0 : k X ai θi = 0 i=1 Now, by choosing the weights carefully, we can ask other types of interesting questions. a = (1, −1, 0, 0, · · · , 0) will ask if θ1 = θ2 . a = 1, − 21 , − 12 , 0, 0, · · · , 0 will ask if θ1 = (θ2 + θ3 ) /2, etc. 11.1.2 Inference Regarding Linear Combination of Means The means of each sample Y¯i are normal: ni 1 X Yij ∼ n θi , σ 2 /ni Y¯i = ni j=1 42 The linear combination of normal variables are once again, normal, with the following parameters: k X i=1 ai Y¯i ∼ n k X ai θi , σ 2 i=1 k X a2 i i=1 ni ! Since we don’t know the variance, we can replace this as the sample variance. Si2 is the regular sample variance from the ith sample. Then, the pooled estimator is given by Sp2 = k k ni 1 XX 1 X 2 (ni − 1) Si2 = (yij − y¯i· ) N − k i=1 N − k i=1 j=1 The estimator Sp2 has an interesting interpretation: it is the mean square within treatment groups. This makes sense, since σ 2 only affects the variance within a group in our model. Then, replacing the variance with Sp2 , we get the following which has usual Student’s t-distribution with N − k degrees of freedom. Pk ¯ Pk a i θi i=1 ai Yi − i=1 q P ∼ tN −k k 2 Sp i=1 a2i /ni Now, we can do the usual t-test. In cases where we are only checking the equivalence of two means, this is equivalent to the two-sample t test is that here information from other groups are factored in estimating Sp2 . 11.1.3 The ANOVA F Test How do we test the classic hypothesis? We can think of it as an intersection of multiple hypothesis: θ ∈ {θ : θ1 = θ2 = · · · = θk } ⇐⇒ θ ∈ Θa for all contrast a ⇐⇒ θ ∈ ∩a∈A Θa We can reject this intersection if the test fails for any a. We can test an individual hypothesis with H0a by the following statistic: Pk P i=1 ai Y¯i − ki=1 ai θi q P Ta = k Sp2 i=1 a2i /n where we will reject it if Ta > k for some k. Now, all tests will pass if and only if sup Ta ≤ k a∈A Where A = {a : P a = 0}. How can we find this supremum? Lemma 11.2.7 gives us the exact form of a and the value of the supremum. However, the important thing is that: 43 sup Ta2 = a∈A Pk i=1 ni 2 Y¯i − Y¯ − θi − θ¯ Sp2 ∼ (k − 1) Fk−1,N −k the statistic of which is called the F -statistic, and it gives us the F-test. Now, we can reject H0 when 2 ¯ / (k − 1) ¯ n Y − Y i i=1 i Pk Sp2 > Fk−1,N −k,α What is the rationale behind looking at F statistic? The denominator is the estimated variance within groups. The numerator is the mean square between treatment groups, weighted 2 by the size of the group. Y¯i − Y¯ is the squared error between the group mean and the grand mean. ni weights them by the size of the group. Dividing by k − 1 is getting the average error per group. Now, the ratio between these two quantities should be higher when inter-group variance is high relative to the intra-group variance. 11.1.4 Simultaneous Estimation of Contrasts A couple of strategies for making inferences about multiple equalities are discussed; the Bonferroni procedure and the Scheffe’s procedure. The Bonferroni procedure allows you to make inferences about m pairs of means being equal. You have to set m in advance, and adjust the level of the test so the intersection tests will be of desired power. Scheffe’s procedure is more notable, which allows you to construct confidence intervals on any arbitrary contrasts after the procedure is done. It is noted as a legitimate use of data snooping. However, at the cost of power of inference, the intervals are usually wider. It goes like: p If M = (k − 1) Fk−1,N −k,α , then the probability is 1 − α that v v u u k k k k 2 u X u X X X a a2i i t 2 ¯ ¯ a i Y i − M Sp ai Yi + M tSp2 ai θi ≤ ≤ n n i=1 i=1 i=1 i i=1 i i=1 k X 11.1.5 Partitioning Sum of Squares ANOVA provides a useful way of thinking about the way in which different treatments affect a measured variable. We can allocate variation of the measured variable to different sources, because: ni k X X i=1 j=1 2 (yij − y¯) = k X i=1 2 ni (¯ yi· − y¯) + ni k X X i=1 j=1 (yij − y¯i· ) 2 2 which can easily be proved because (yij − y¯) = ((yij − y¯i ) + (¯ yi − y¯)) and when you evalu2 ate the square, cross terms are zero. The sums of squares are also chi-square distributed, after scaling. 44 11.2 Simple Linear Regression Simple linear regression is discussed in three different contexts - as a minimizer to the leastsquares without any statistical assumptions, as a best linear unbiased estimators under some variance assumptions, as an inference mechanism under distribution assumptions. Not surprisingly, we will be able to draw more powerful conclusions when we assume more. 11.2.1 General Model In all three different contexts, the actual line stays the same. Say (xi , yi ) are pairs of examples, where xi are the predictor variables, yi being response variables. Then x ¯ and y¯ are means of xi and yi , respectively, and Sxx = n X i=1 Syy = n X i=1 Sxy = n X i=1 (xi − x ¯) (yi − y¯) 2 2 (xi − x ¯) (yi − y¯) And then we will fit the following line y = bx + a with: b= Sxy Sxx a = y¯ − b¯ x Note the slope can be interpreted as Cov (X, Y ) /VarX. 11.2.2 Least Square Solution Least square provides a way to fit a line to the given data. No statistical inferences can be drawn here. Let’s say we want to minimize the residual sum of squares RSS = n X i=1 (yi − (c + dxi )) 2 Now c can be determined easily - rewrite the summand as 2 (yi − (c + dxi )) = ((y − dxi ) − c) 2 and the minimizer of this is just the average of y − dxi which is y¯ − d¯ x. d can be determined from differentiating the quadratic formula and setting it to 0. Also note that changing the direction of the regression ”using y to predict x) will give you a different regression line: this is obvious since b becomes Syy /Sxy . 45 11.2.3 Best Linear Unbiased Estimators: BLUE Let’s add some contexts: we now think of the values yi as observed values of uncorrelated random variables Yi . xi are known, fixed values chosen by the experimenter. We assume the following model: EYi = α + βxi where VarYi = σ 2 , which is a common variance across variables. Or equivalently, set Eǫi = 0, Varǫi = σ 2 and have Yi = α + βxi + ǫi Now, let us estimate α and β as a linear combination of Yi s n X di Yi i=1 Furthermore, we only look at unbiased estimators. With an unbiased estimator of slope β must satisfy E n X di Yi = β i=1 We can transform LHS as E n X i=1 di Yi = n X di EYi = n X di (α + βxi ) = α i=1 i=1 i=1 n X di ! +β For this to be β, we need the following conditions to hold true: n X di = 0 and i=1 n X n X i=1 di xi ! di x i = 1 i=1 So the minimum variance estimator which satisfies the above conditions is called the best linear unbiased estimator ”BLUE). The di s which satisfy this could be find using a similar strategy for maximizing Ta in section 11.1.3 above. After the dust settles, we have: di = (xi − x ¯) Sxx which seems to have an interesting interpretation. Higher Sxx make the coefficients smaller, and xi deviating more from x ¯ makes coefficients larger. What is the variance of β now? Varb = σ 2 n X i=1 46 d2i = σ2 Sxx 11.2.4 Normal Assumptions Now, we can assume normality for the variables which let us make further claims regarding the estimators. The text discusses two ways of doing this, which are practically equivalent. The more common one is the conditional normal model, which states Yi ∼ n α + βxi , σ 2 which is a special case of the model discussed above. Even less general is the bivarite normal model, which assumes the pair (Xi , Yi ) follows a bivariate normal distribution. However, in general we don’t care about the distribution of Xi , but only the conditional distribution of Yi . So bivariate normal assumptions are not used often. Also, note both models satisfy the assumptions we have made in the above section. Maximum Likelihood Under this distribution assumption, we can try to find the MLE of β. We expect to find the same formula - and we actually do. The log likelihood function is maximized at the same choice of β and α. What about the MLE of σ 2 ? It is given by n 2 1 X ˆ i σ ˆ = yi − α ˆ − βx n i=1 2 which is the variance of the error ”RSS) - makes sense because RSS are effectively ǫi with Varǫi = σ 2 ! However, note that σ ˆ 2 is not an unbiased estimator of σ 2 . Distributions of Estimators Under Normality Assumption ˆ and S 2 are The sampling distributions of the maximum likelihood estimates α ˆ , β, with n σ2 X 2 α ˆ ∼ n α, x nSxx i=1 i ! σ2 ˆ β ∼ n β, Sxx −σ 2 x ¯ Cov α ˆ , βˆ = Sxx Furthermore, α ˆ , βˆ and S 2 are independent and (n − 2) S 2 ∼ χ2n−2 σ2 When σ 2 is unknown, we can still make inferences about them using S 2 since we get Student’s t-distribution using: 47 α ˆ−α p Pn ∼ tn−2 S ( i=1 x2i ) / (nSxx ) and βˆ − β √ ∼ tn−2 S/ Sxx Significance of the Slope The t-test for significance of β will reject H0 : β = 0 when βˆ − 0 > tn−2,α/2 √ S/ Sxx This is equivalent to the following, since t-distribution squared is distributed following the F -distribution. βˆ2 > F1,n−2,α S 2 /Sxx The LHS quantity, the F -statistic, can be interpreted as follows: 2 Sxy /Sxx Regression sum of squares βˆ2 = = 2 S /Sxx RSS/ (n − 2) Residual sum of squares/df which is nicely summarized in an ANOVA table. Partitioning Sum of Squares As an another similarity to ANOVA, we can express the total sum of squares in the data set by a sum of regression sum of squares and the residual sum of squares: n X i=1 2 (yi − y) = n X i=1 2 (ˆ yi − y) + n X i=1 (yi − yˆi ) 2 When we split the sum of squares, we can take the ratio between the regression sum of squares and the total sum of squares as the coefficient of determination, called r2 : Pn 2 2 Sxy (ˆ yi − y) r2 = Pni=1 = 2 Sxx Syy ˆi ) i=1 (yi − y The last portion of this inequality is not very obvious... look at Exercise 11.34 for more intuition. 48 Prediction at Specified x0 We are able to discuss the distribution of the response variable at a specified position x0 . Call ˆ 0 which is an this Y0 . Under our assumptions, E (Y |x0 ) = α + βx0 which is estimated by α ˆ + βx unbiased estimator. What is the variance of this estimator? ˆ 0 = Varˆ Var α ˆ + βx α + Varβˆ x20 + 2x0 Cov α ˆ , βˆ n σ 2 X 2 σ 2 x20 2σ 2 x0 x ¯ xi + − nSxx i=1 Sxx Sxx ! 2 (x0 − x) 1 + = σ2 n Sxx = Now we have a normal distribution for Y0 . For inference, the following quantity follows a Student’s t-distribution: ˆ − (α + βx0 ) α ˆ + βx q0 ∼ tn−2 2 S n1 + (x0S−x) xx which can be used to make confidence interval for EY0 = α + βx0 . Prediction Interval ˆ 0 , which is our estimate The previous estimation and inference was done on the estimator α ˆ +βx for the mean of Y0 . Now, can we make intervals for Y0 itself? Obviously, the interval is going to be larger - we should add variance from the distribution of Y0 as well. Here’s the definition: a 100 (1 − α) % prediction interval for an unobserved random variable Y based on the observed data X is a random interval [L (X) , U (X)] such that Pθ (L (X) ≤ Y ≤ U (X)) ≥ 1 − α for all θ. The variance of Y0 is given by summing up the variance of the mean estimator and the common variance σ 2 . Simulataneous Estimation and Confidence Bands We can create confidence bands around the fitted line, which gives us confidence intervals for the mean of Y at that x. This is similar to getting confidence bands in ANOVA, and the same two processes apply: Bonferroni and Scheffe. Without further details, we state the Scheffe band: Under the conditional normal regression model, the probability is at least 1 − α that ˆ − Mα S α ˆ + βx where Mα = s p 2F2,n−2,α . 2 1 (x − x) ˆ + Mα S < α + βx < α ˆ + βx + n Sxx 49 s 1 (x − x) + n Sxx 2 12 Regression Models The last chapter! Yay! Can’t believe I made it so far. ”Well, yeah, I skipped over a good amount of material...) Anyways, this chapter covers a number of different models for regression. 12.1 Errors in Variables (EIV) Models In EIV models, contrary to the traditional regression methods, the xs, as well as ys, are realized values of a random variable whose mean we cannot observe: EXi = ξi . The means of the two families of variables are linked by a linear relationship. If EYi = ηi , ηi = α + βξi In this model, there is really no distinction between the predictor variable and the response variable. 12.1.1 Functional And Structural Relationship There are two different types of EIV models. The more obvious one is the linear functional relationship model, where ξi s are fixed, unknown parameters. Adding more parameterization 2 gives us the linear structural relationship model, where ξi ∼ iid n ξ, σξ . In practice, they share a lot of properties and the functional model is used more often. 12.1.2 Mathematical Solution: Orthogonal Least Squares OLS regression measures the vertical distance between each point and the line, since we trust xs to be correct. In EIV, there is no reason to do that and we switch to orthogonal regression. Here, the deviation is the distance between the point and the regression line. The line segment spanning this distance is orthogonal to the regression line, thus the name. The formula for this in case of a simple regression is given in the book. Orthogonal least squares line always lies between the two OLS regression lines - y on x and x on y. 12.1.3 Maximum Likelihood Estimation The MLE of the functional linear model is discussed. The obvious likelihood function, however, does not have a finite maximum. ”Setting derivatives to zero results in a saddle point.) To avoid this problem, we change the model where we do not know the variances of the two errors ”one in x and one in y), but their ratio λ. σδ2 = λσǫ2 Note since VarX = σδ2 , this includes the regular regression model when λ = 0 =⇒ VarX = 0. The maximization can be done analytically. This MLE, when λ = 1, will be the result of the 50 orthogonal least squares. When we send λ → 0, it will become the regular OLS results. Cool right? Case for the structural model is discussed, but I’m going to just skip over it. 12.1.4 Confidence Sets Omitted. 12.2 Logistic Regression And GLM 12.2.1 Generalized Linear Model A GLM consists of three components: the random component ”response variables), the systematic component ”a function h (x) of predictor variables, linear in the parameter), and the link function g (µ). Then the model states g (EYi ) = h (x) Important points: the response variables are supposed to come from a specified exponential family. 12.2.2 Logistic Regression In logistic regression, Yi ∼ Bernoulli (πi ), g is the logit function. Let us limit h to have the form α + βxi for easier discussion. Then we have log πi 1 − πi = α + βxi Note that log (π/ (1 − π)) is the natural parameter of the Bernoulli family, since the pmf can be represented as y π (1 − π) 1−y π = (1 − π) exp y log 1−π when the natural parameter is used as the link function, as in this case, it is called the canonical link. We can rewrite the link equation which gives us better intution about how the probability and the linear combination is related. πi = eα+βxi 1 + eα+βxi Estimating logistic regression is done by MLE, as we don’t have a clear equivalent of least squares. This will be done numerically. 51 12.3 Robust Regression Remind the relationship between mean ”minimizes L2 mean) and the median ”minimizes L1 mean). There is a median-equivalent for least squares; which is called LAD ”least absolute deviation) regression. It minimizes n X i=1 |yi − (a + bxi )| This is L1 regression. ”Solvable by LP.) As can be expected, it is quite more robust against outliers. However, the asymptotic normality analysis gives as the ARE of least squares and LAD is 4f (0) ”f is the standard normal pdf) which gives us about 64%. So we give up a good 2 bit of efficiency against least squares. 12.3.1 Huber Loss Analogeous to M-estimator, we can find regression functions that minimizes the Huber loss. The analysis of this is complicated and is omitted from the book as well. However, it hits a good middle ground between the two extreme regression techniques. The book demonstrates this over three datasets; where the errors are generated from normal, logistic, and double exponential distributions. Then, the AREs are calculated between least squares, LAD and M-estimator. The result is very good. Here I replicate the table: Error Normal Logistic Double Exponential vs. least squares 0.98 1.03 1.07 vs. LAD 1.39 1.27 1.14 Almost as good as least squares in normal, completely kick arse in other cases. Very impressive!! Also, note LAD is worse off than least squares in everything. What a piece of crap. Anyways, I sort of understand why professor Boyd said Huber loss will improve things greatly! 52 Linear Algebra Lecture Notes [email protected] January 19, 2015 This lecture note summarizes my takeaways from taking Gilbert Strang’s Linear Algebra course online. 1 Solving Linear Systems 1.1 Interpreting Linear Systems Say we have the following linear system: 2 4 1 0 3 5 14 1 x1 7 x2 = 35 14 1 x3 There are two complementing ways to interpret this. 1.1.1 The Row-wise Interpretation In the classical row-wise picture, each equation becomes a hyperplane ”or a line) in a hyperspace ”or space). For example, 2x1 + 4x2 + x3 = 14. The solution is where the three hyperplanes meet. 1.1.2 The Column-wise Interpretation In the column-wise picture, we think in terms of column vectors. We want to represent the right hand side as a linear combination of column vectors of A. 1.2 Elimination Elimination is a series of row operations that will change your given matrix into a upper-triangular matrix. The allowed operations are as of follows. • Adding a multiple of a row to another row • Changing the order of rows Elimination, combined with back substitution, is how software packages solve systems of linear equations. 1 1.2.1 Row Operations and Column Operations Say you are multiplying a 1 × 3 row vector with a 3 × 3 matrix. What is the result? It is a linear combination of rows of the matrix. h 1 3 i a 2 d g b c e f = 1 × [a, b, c] + 3 × [d, e, f ] + 2 × [g, h, i] h i Similarly, multiplying a matrix with a column vector on its right side gives us a liner combination of columns of the matrix. We conclude that multiplying on the left will give us row operations; multiplying on the right gives us column operations. 1.2.2 Representing Elimination With A Series of Matrices Since elimination is a purely row-wise operation, we can represent it with a series of multiplication operations on the left of the matrix. The matrices that are multiplied to do the elimination are called the elementary matrices or the permutation matrices, depending on what they are trying to do. Now, the elimination process of a 3 × 3 matrix A can be represented as: E23 E12 A = U Now, keep an eye on E23 E12 : if you multiply these together, it will be a single matrix that will do the entire elimination by itself! 1.2.3 Side: Multiple Interpretations of Matrix Multiplications Say we are multiplying two matices A × B = C. Multiple ways to interpret this operation: • Dot product approach: Cij = P Aik Bkj ”all indices are row first) • Column-wise approach: C i = A × B i . Columns of C are linear combinations of columns in A. • Row-wise approach: Ci = Ai × B. Rows of C are linear combinations of rows in B. • Column multiplied by rows: Note that a column vector multiplied by a row vector is a full matrix. Now, we can think of C as a sum of products between ith column of A and ith row of B! • Blockwise: If we split up A and B into multiple blocks where the sizes would match, we can do regular multiplication using those blocks! If A and B were both split into 2 × 2 chunks, each block being a square. Then, C11 = A11 B11 + A12 B21 ! 1.3 Finding Inverses with Gauss-Jordan Say we want to find an inverse of A. We have the following equation: A [c1 c2 · · · cn ] = In 2 where ci is the i-th column of A−1 . Now, each column in In are linear combinations of columns of A - namely, ith column of In is Aci . So each column in In gives us a system of linear equations, that can be solved by Gauss elimination. The way of solving n linear systems at once is called the Gauss-Jordan method. We work with an augmented matrix of form [A|In ] and we eliminate A to be In . We can say: Y Ej [A|In ] = [In |?] Say we found a set of Es that make the above equation hold. Then, we got: Y Ej A = In ⇐⇒ Y Ej = A−1 = Y Ej I n the last equality telling us that the right half of the augmented matrix after the elimination is A−1 , thus proving the validity of the algorithm. 1.3.1 Inverses of Products and Transposes What is (AB) −1 ? We can easily see B −1 A−1 is the answer because: B −1 A−1 AB = I = ABB −1 A−1 Now, (AT )−1 ? We can start from A−1 A = I and transpose both sides. Now we get A−1 So A−1 1.4 T is the inverse of AT . T AT = I T = I Elimination = Factorization; LU Decomposition Doing a Gaussian elimination to a matrix A will reduce it to a upper triangular matrix U . How are A and U related? LU decomposition tells us that there is a matrix L that connects the two matrices. ”Also, note we ignore row exchanges for now) We take all the elimination matrices used to transform A to E. Since row exchanges are not allowed, all of these elements are lower triangular. ”We take an upper row, and add an multiple of it to a lower row). Example: let " 2 A= 8 # 1 7 We can represent the elimination with a elimination matrix: " #" # " 1 0 2 1 0 A= −4 1 8 −4 1 Thus 3 # " 1 2 = 7 0 # 1 3 " # 1 2 4 7 = | {z } A " | 1 0 #" # 1 2 −4 1 0 3 {z } | {z } U E −1 We can factor out a diagonal matrix so U will only have ones on the diagonal: A= " #" 1 0 −4 1 2 0 #" 0 1 3 0 1 2 1 # 1.4.1 A case for 3 × 3 matrices Say n = 3. Then we can represent the elimination is E32 E31 E21 A = U Now, the following holds: −1 −1 −1 A = E21 E31 E32 U = LU and we call the product of elimination matrices L. Question: how is L always lower triangular? Let’s start with E32 E31 E21 . Since each elimination matrix subtracts an upper from from lower rows - so everything is moving downwards . A nonzero number cannot move up . Now how do we calculate L? We go through an example, and we make the following claim: if you are not using row exchanges, the multipliers will go into L! That means, the multiplier we used to make U21 zero will go into L21 . This is checked with an example. 1.4.2 Time Complexity for Gaussian elimination Of course, the naive way gives O n3 . To eliminate using the i-th ”0-based) row, we would have to change 2 2 (n − i) cells. So, n2 + (n − 1) + · · · + 12 . Integrating n2 gives 31 n3 – which is the ballpark range for this sum. 1.5 Permutation Matrices Say we have a list of all possible permutation matrices for a matrix of size n × n. There are n! possibilities: we have n! different permutations. What if we multiply two of those? The result is another permutation, so this set is closed under multiplication. What if we invert one of those? The result is also a permutation - so this is closed under inversion as well. 1.5.1 On Transpose and Symmetric Matrices Trivial result: AT A is always symmetric for any A. Proof? T AT A = AT AT T = AT A 4 1.5.2 Permutation and LU matrices How do we account for row exchanges in LU decomposition? We exchange rows before we start! P A = LU 2 Vector Spaces and Subspaces 2.1 Definitions and Examples • Closed under scalar multiplication • Closed under vector addition Some things are obvious: • Closed under linear combination • Contains 0 2.2 Subspaces A subspace is a subset of a vector space, which is a vector space itself. For example, R2 has three kinds of subsets: the plane itself, any line that goes through (0, 0), and {(0, 0)}. If you take a union of two subspaces, in general, it is not a subspace. However, their intersection is still a subspace. 2.3 Spaces of a matrix Given a vector A, the set of all possible linear combinations of its vectors is called the column space of A: C(A). A column space is inherently related to the solvability of linear systems. Say we want to solve Ax = b. Any possible value of Ax is in the column space by definition; so Ax = b is solvable iff when b ∈ C(A). The Null space is defined by the solution space of Ax = 0. Null and column spaces can have different sizes: if A ∈ Rm×n , N (A) ∈ Rn and C (A) ∈ Rm . How do we find column and null spaces? Once again, elimination. 2.4 Finding the Null Space: Solving Ax = 0 Say we eliminated A to get a row echelon form matrix U . Here are some definitions. Pivot columns The columns that contain the pivots used in the elimination. Free columns The rest of the columns. Rank of a matrix Number of pivot columns. 5 Why are free columns called free ? In solving Ax = 0, we can assign arbitrary values to the variables associated with free columns. The rest of the variables will be uniquely defined from those values. To find the entire null space, we construct a particular solution for each of the free variables. We can set its value 1, with rest of the free variables 0. Now we can get a particular solution. We repeat for all the n − r free variables, and take their linear combination. We now know this set spans all possible values for the free variables. 2.4.1 Reduced-row Echelon Form Reduced-row echelon form does one more elimination upwards, and make the pivots 1. Making pivots won’t change the solution since we are solving Ax = 0. Also, note that since every entry ”except the pivot itself) of the pivot column is eliminated, if we take the pivot rows and columns we get an identity matrix of size r. The typical form of an rref can be shown as a block matrix: R= " I F 0 0 # where I is the identity matrix, the pivot part, and F is the free part. Note that you can read off the particular solutions directly off the matrix: now each row of the equation Rx = 0 takes the following form: xp + axf1 + bxf2 + cxf3 + · · · = 0 where xp is a pivot variable, and xfi s are the free variables. And now getting the value of xp is extremely easy. We can abstract even further; think of a null space matrix N such that RN = 0. Each column of this matrix is the particular solution. And we can set: N = " −F I # From the block multiplication, we know RN = 0 and how each column of N looks like. 2.5 Solving Ax = b Now we solve a generic linear system. First, some solvability condition: we can solve it if b ∈ C (A). Finding the solution space is pretty simple: • Find a particular solution by setting all free vars to 0, and solving for pivot variables. • Add it to the null space! Is the solution space going to be a subspace? No, unless it goes through origin. 2.5.1 Rank and Number of Solutions The key takeaway is that you can predict the number of solutions by only looking at the rank of the matrix. Say A is a m × n matrix. What is the rank r? 6 • Full rank square matrix: When r = n = m, the rref becomes I and we have exactly one solution for any b in Ax = b. " # I and we • Full column rank: This happens in tall matrices, where r = n < m. The rref looks like 0 n o have no free variables, so N (A) = ~0 . Also, for any b, there might be 0 solutions ”when the zero row should equal a nonzero bi ) or exactly one solution. h i • Full row rank: This happens in wide matrices, where r = m < n. The rref looks like I F ”in prac- tice, the columns of I and F are intertwined.). Since we have no zero rows, the number of solutions is not going to be 0. Also, since there is a free variable, we are always getting a ∞ number of solutions. # " I F . We get 0 or ∞ solutions depending on b. • Not-full column/row rank: The rref looks like 0 0 3 Linear Independence, Basis and Dimension First, a lemma: when A ∈ Rm×n where m < n, there is a nonzero solution to Ax = 0 since we always get a free variable. 3.1 Linear Independence Linear independence A set of vectors v1 , v2 , · · · , vn is linearly independent when no linear combination of them ”except for the 0 combination) result in a 0 vector. i h Equivalently, say A = v1 v2 · · · vn . The column vectors are linearly independent: • N (A) = {0} • A is full column rank. A corollary of the above lemma: 3 vectors in a 2-dimensional space cannot be independent. 3.2 Spanning, Basis, and Dimensions Definition: A set of vectors {v1 , v2, · · · , vl } span a space iff the space consists of all linear combinations of those vectors. A basis for a space is an independent set of vectors {v1 , v2 , · · · , vd } which span the space. The number of vectors d is called the dimension of the space. Here are some facts: • A set of vectors in Rn {v1 , · · · , vn } gives a basis iff the n × n matrix with those as columns gives an invertible matrix. • Every basis has the same number of vectors, the number being the dimension of the space. 7 3.2.1 Relationship Between Rank and Dimension The rank of matrix A is the number of pivot columns. At the same time, it is the dimension of the column space of A - C (A). OTOH, what is the dimension of N (A)? For each free variable, we get a special solution with that free variable set to 1 and other free variable to 0. Each of these special solutions are independent, and span the null space! So the dimension of N (A) = n − r. 3.3 Four Fundamental Spaces of A Given a A ∈ Rn×m , here are the four fundamental spaces. • Column space C (A) ∈ Rn • Null space N (A) ∈ Rm • Row space R (A) = all linear combinations of rows of A = C AT ∈ Rm • Null space of AT - often called the left null space of A : N AT ∈ Rn This is called the left null space because, N AT = y|AT y = 0 = y|y T A = 0 the latter equality derived from taking the transpose. We should understand what dimensions and basis do they have; and also how do they relate with each other. First, the dimension and the basis: • C (A) has dimension r, and the pivot columns are the basis. • N (A) has dimension n − r , and the special solutions are the basis. • R (A) has dimension r, and the first r rows in the rref are the basis. • N AT has dimension m − r, and the last m − r rows in the elementary matrix E s.t. EA = R. IOW, the E that comes out of Gauss-Jordan. Note that summing the dimension of C (A) and N (A) gives n, where summing dimensions of R (A) and N AT gives m! 3.3.1 Elimination and Spaces What does taking rref do to the matrix’s spaces? We do know C (A) 6= C (R) since the last row of R can potentially be zero. However, elimination does not change the row space; and its basis is the first r rows in R. 3.3.2 Sets of Matrices as Vector Space Suppose the following set: all sets of 3 × 3 matrices. It is a vector space because it is closed under addition, multiplication by scalar! What are some possible subspaces? All upper triangular matrices, all symmetric matrices, all diagonal matrices, multiples of I, .. 8 We discuss an interesting properties of these different subspaces: dim (A + B) = dim A + dim B − dim (A ∩ B) 3.3.3 Solutions As Vector Space What are the solutions of the following differential equation? ∂2y +y =0 ∂x2 We can say: y = a sin x + b cos x. Now, we can think of the solution as a vector space with sin x and cos x as their basis. Note these are functions, not vectors! So this is a good example why the idea of basis and vector spaces plays a large role outside the world of vectors and matrices. 3.3.4 Rank One Matrices Rank one matrices are special, as we can decompose it into a product of column vector and row vector A = uv T . They are building blocks of other higher-rank matrices. A four-rank matrix can be constructed by adding four rank-one matrices together. 4 Applications 4.1 Graphs and Networks The most important model in applied math! A graph with m edges and n nodes can be represented by an incidence matrix of size m × n, each row representing an edge. The entry Aij = 1 if edge i is coming into node j, −1 if edge i leaves node j, and 0 otherwise. Note this is different from the adjacency matrix form I am used to. Some remarks about how notions in electric network and linear algebra concepts relate to each other. • Loops: When 2 or more edges form a loop ”not necessarily a cycle), those rows are _not_ independent and vice versa. • Sparsity: This is a very sparse matrix! However, in applied linear algebra, it is way more common to have structured matrices. • Null space: Say x is a vector of potentials for each nodes - then Ax means differences between potentials of nodes. So Ax = 0 gives you pairs of nodes for which the potentials are the same. If the graph is connected, the null space is a single dimensional space - c~1. • N AT : What does AT y = 0 mean? Kirchhoff’s circuit law is like the flow preservation property in electrical networks; net incoming/outgoing current is zero for any node. If y is a vector of currents, AT y is a vector of net incoming currents. – The basis of this null spaces are related to the loops in the graph. Suppose we pick a loop and send a unit current along it. This gives us a basis. 9 – Repeat, and we can take all loops one by one and take all the basis! – Say there are two loops: a − b − c − a and a − b − e − a. Is a − c − b − e − a a valid loop? No, it is the sum ”or difference) of two loops and the special solution will be dependent of the previous two special solutions. – Now, realize that the number of the loop is dim N AT = m − r! • R AT : What do the pivot columns represent? It is a fucking spanning tree! Whoa If there is a cycle those rows are not going to be independent! Taking all of this together, we can derive Euler’s formula! • dim N AT = m − r • r = n − 1 ”since the pivot columns represent a spanning tree which always have n − 1 edges!) • Then Number of loops = Number of edges − (Number of nodes − 1) Now, in graph theory speak: F = E − V + 1 ⇐⇒ V − E + F = 1 Ladies and gentlemen, let me introduce Euler’s formula. Holy crap. Also, we can merge everything in a big equation. So far, we know: • e = Ax ”potential differences) • y = Ce ”Ohm’s law) • AT y = f ”Kirchhoff’s law) So we get: AT CAx = f whatever that means haha. 5 Orthogonality 5.1 Definition What does it mean for two subspaces/vectors/basis to be orthogonal? Vector orthogonality: Two vectors x and y are orthogonal iff xT y = 0. We can connect this to Pythagorean 2 2 2 theorem - kxk + kyk = kx + yk iff x and y are orthogonal. 2 2 2 kxk + kyk = xT x + y T y = kx + yk = xT x + y T y + 2xT y ⇐⇒ xT y = 0 10 Subspace orthogonality: two subspace S is orthogonal to subspace T when every vector in S is orthogonal to every vector in T . Examples: • Are xz and yz planes orthogonal in R3 ? No they aren’t: they have a nonzero intersection! The vectors in that intersection cannot be orthogonal to themselves. Facts: • Row space orthogonal to null space. Why? x ∈ N (A) iff 0 r1 · x . . . . Ax = . = . 0 rn · x So x is orthogonal to all rows. And of course, it will be orthogonal to all linear combinations of the rows. • Row space and null spaces are orthogonal complements of R3 : nullspace contains all vectors orthogonal to the row space. 5.2 Projections 5.2.1 Why Project? If Ax = b cannot be solved in general. So what do we do? We find the closest vector in C (A) that is closest to b, which is a projection! 5.2.2 2D Case Suppose we project vector b onto a subspace that is multiple of a. Say that the projected point is ax. We know the vector from ax to b is orthogonal to a. We have: 0 = aT (ax − b) = aT ax − aT b ⇐⇒ x = aT b aT a Look at the projected point ax: ax = a aT b = aT a aaT aT a b Note the last formula - that rank one matrix is the projection matrix P ! It has the following properties: P 2 = P and P T = P 5.2.3 General Case It’s the same derivation! If p is the projected point, we can write it as Aˆ x. Then the error vector b − Aˆ x is perpendicular to the column space of A. So: −1 T 0 = AT (b − Aˆ x) = AT b − AT Aˆ x ⇐⇒ x ˆ = AT A A b 11 Welcome pseudoinverse! Now, get p by −1 T p = Aˆ x = A AT A A b {z } | P We got the projection matrix! 5.3 Least Squares When A is tall, Ax = b is not generally solvable exactly. We multiply AT to both sides of the equation to get AT Ax = AT b Hoping AT A is invertible and we can solve this exactly. When is AT A invertible? It turns out rank of AT A is equal to rank of A - so AT A is invertible only when A is full column rank. 5.3.1 Invertibility ofAT A Assume A is full column rank. Let’s prove the following set of equivalent statements: AT Ax = 0 ⇐⇒ x = 0 ⇐⇒ N AT A = {0} ⇐⇒ AT A is invertible Take the first equation, and calculate dot products of each side with x: T xT AT Ax = 0 = (Ax) Ax ⇐⇒ Ax = 0 Since A is full column rank, N (A) = {0}. So x must be 0. 5.3.2 Least Squares as A Decomposition If least square decomposes a vector b into p + e, p ∈ C (A) and e ∈ N (A). Now, if p = P b, what is e? Of course, e = (I − P ) b. We get p + e = (P + I − P ) b = b. 5.4 Orthonormal Basis A set of orthonormal vectors {q1 , q2, · · · } is a set of unit vectors where every pair is perpendicular. We can write this with a matrix Q: Q = [q1 q2, · · · ] where qi s are column vectors. Now, the above requirement can be written as: QT Q = I This matrix Q is called a orthonormal matrix. ”Historically, we only call it orthogonal when it’s a square...) What happens when Q is square? Since QT Q = I, Q = Q−1 . 12 5.4.1 Rationale The projection matrix can be found as P = Q QT Q −1 QT = QQT 5.4.2 Gram-Schmidt Given a set of vectors, how can we make them orthonormal? Well... I sorta do know... tedious process to do by hand. • Take an arbitrary vector, and normalize it. Include it in the result set. • For each other vector v, – For each vector u in the result set, subtract the projection of v onto u from v: v = v − uT v · u – Normalize the resulting v and include it in the result set. 5.4.3 QR Decomposition How do we write Gram-Schmidt in terms of matrices? We could write Gaussian elimination by P A = LU We write this as: A = QR Note that, because of how Gram-Schmidt works, R is going to be a lower triangular matrix! The first column of Q is going to be the first column of A, scaled! Also, the second column is going to be a linear combination of first two columns of A and etc. 6 Determinants 6.1 Properties 1. Identity matrix has determinant 1. 2. When you swap two rows, the sign of the determinant will change. 3. The determinant is a linear function of the matrix: ”I’m not saying det A + det B = det (A + B) – this is not true) ”a) If you multiply a row by a scalar t, the determinant will be multiplied by t. h h iT h iT + det a · · · y = det a · · · x · · · b ”b) det a · · · x + y · · · b The following can be derived from the above points: 13 ··· b iT • If two rows are equal, determinant is 0. • If we subtract a multiple of a row from another row, determinant doesn’t change. ”This can be proved from 3b and 4) • If there’s a row of zeros, determinant is 0. • For a upper triangular matrix, determinant is the product of the diagonal products. ”Proof: do reverse elimination to get a diagonal matrix with same determinant, use rule 3a repeatedly until we get I) • det A ⇐⇒ A is singular • Determinant is multiplicative: det AB = det A · det B – So: det A−1 = 1 det A • det A = det AT ”this means, swapping columns will flip the sign) – Proof: let A = LU . det A = det (LU ) = det L det U . det L = 1, and det U = det U T since it is upper triangular. 6.2 Calculation 6.2.1 Big Formula X det A = p∈permute(1···n) ± Y aipi Argh.. messy. Whatever. 6.2.2 Cofactor Taking the big formula, and collecting terms by the number in the first row gives the cofactor expansion formula. Say the matrix is 3 × 3: det A = a11 (a22 a33 − a23 a32 ) + a12 (−a21 a33 + a23 a31 ) + a13 (a21 a32 − a23 a31 ) Notice the quantities in parenthesis are either determinants of the 2 × 2 matrices, or their negatives. Formally, Cij is defined to be a cofactor Cij = ± det (smaller matrix with row iand col jremoved) where the sign is + when i + j is even, - when i + j is even. This follows the checkerboard pattern. ”Formally, cofactors with the sign are called minors.) The resulting cofactor formula for the determinant is: det A = a11 C11 + a12 C12 + · · · + a1n C1n 14 6.3 Applications 6.3.1 Formula for A−1 A−1 = 1 CT det A where C is the matrix of cofactors in A. How do we verify it? Let’s check if AC T = (det A) I Expand the elements of the matrix - we actually see the diagonals are the determinants, from the cofactor formula! But what about the off-diagonal elements? We claim those calculations are actually using cofactor formula for a matrix with two equal rows! Aaaaah..... 6.3.2 Ax = b and Cramer’s Rule Of course, we know x= 1 CT b det A What are the entries of x in this formula? Since ci b is always a determinant of some matrix, we can write it as: xi = det Bi det A for some matrix Bi . Cramer realized that Bi is A with column 1 replaced by b. This are beautiful, but not practical ways of calculating stuff. 6.3.3 Determinant and Volume The determinant of a n × n matrix A is the volume of a box in a n dimensional space with n sides of it coinciding with the column/row vectors of A. Let’s look at some example cases to get ourselves convinced: • A = I: it’s going to be a ”hyper)cube with volume 1. • A = Q ”orthonormal): another cube, rotated. From here we can rediscover QT Q = I - take determi2 nants from both sides: (det Q) = 1. So det Q = ±1. Also, we revisited many determinant properties and made sure they hold in this context as well. 7 Eigenvalues and Eigenvectors 7.1 Definition You can think of a matrix as a linear mapping, using f (x) = Ax. For a matrix, we can find vector”s) x such that f (x) is parallel to x. Formally: 15 Ax = λx where λ is a scalar, called the eigenvalue. The xs are called the eigenvectors. 7.1.1 Example: Projection Matrix Say there is a projection matrix, which projects stuff into a plane: when a vector is already in the plane, it won’t change. So they will be eigenvector with eigenvalue 1. We can say there are two perpendicular eigenvectors that span the plane. Are there any other eigenvalue? ”Intuitively, we expect to find one, since we are in a 3D space) Yes, find the normal vector that goes through the origin. This will become a 0 vector - so this one is an eigenvector with eigenvalue 0. 7.1.2 Example 2: Permutation Matrix Let A= " 0 1 # 1 0 Trivially, [1, 1] is an eigenvector with eigenvalue 1. Also, [−1, 1] is an eigenvector with eigenvalue -1. T T 7.1.3 Properties • n × n matrices will have n eigenvalues. • Sum of the eigenvalues equal the trace of the matrix ”sum of the diagonal entries). • The determinant is the product of the eigenvalues. 7.2 Calculation Rewrite the equation as: (A − λI) x = 0 Now, for this to be true for nontrivial x, A − λI has to be singular: this is equvalent to: det (A − λI) = 0 We solve this to find λs. After that, we can use elimination to find x. 7.2.1 Properties If we add aI to a matrix, each of its eigenvalues will increase by a. The eigenvectors will stay the same! See: if Ax = λx, (A + aI) x = λx + ax = (λ + a) x 16 What do we know about general addition? If we know eigenvalues and eigenvectors of A and B, what do we know about A + B? First guess would be their eigenvalues be added, but false. Because they can have different eigenvectors. 7.2.2 When Things Are Not So Rosy Think of a rotation matrix; what vector is parallel to itself after rotating 90 degrees? None! When we carry out the calculation, we get complex eigenvalues. Also, for some matrices we can have duplicate eigenvalues, and no independent eigenvectors. Why is this important? We will see. 7.3 Diagonalization of A Matrix Let us assume that A has n linearly independent eigenvectors, x1 to xn , each associated with eigenvalues λ1 to λn . We can put them in columns of a n × n matrix, and call this S. Then, we can write what we know as follows: h AS = A x1 x2 i h x n = λ1 x 1 ··· λ2 x 2 ··· λn x n i How do we write the latter with a matrix representation? We can multiply S with a diagonal matrix with eigenvalues along the diagonal: h λ1 x 1 λ2 x 2 ··· ··· λ1 0 i 0 λn x n = S .. . λ2 .. . ··· .. . 0 .. . 0 ··· λn 0 We call the diagonal matrix Λ. Now we have: 0 = SΛ AS = SΛ ⇐⇒ S −1 AS = Λ ⇐⇒ A = SΛS −1 Note since we assumed the eigenvectors are linearly independent, S is invertible. From this, we can infer interesting properties of eigenvalues. What are the eigenvectors and eigenvalues of A2 ? Intuitively, of course, the eigenvectors are the same - for an eigenvector x, Ax is a scalar multiplication of x. So A2 x will still be a scalar multiplication, with a factor of λ2 . However, we can see it from diagonalization as well: A2 = SΛS −1 2 = SΛS −1 SΛS −1 = SΛ2 S −1 In general, if you take powers of a matrix, it will have the same eigenvectors, but the eigenvalues will get powered. 7.3.1 Understanding Powers of Matrix Via Eigenvalues What does lim An n→∞ look like? Does it ever go to 0? We can find out, by looking at its eigenvalues: 17 An = SΛn S −1 For An to go to 0, Λn has to go to zero - so the absolute value of all eigenvalues are less than 1! 7.3.2 Understanding Diagonalizability A is sure to have n independent eigenvectors ”and thus be diagonalizable) if all the eigenvalues are different. Note there are cases where there are repeated eigenvalues and there are independent eigenvectors ”well, take I for an example). 7.4 Applications 7.4.1 Solving Recurrences Let’s solve a difference equation: uk+1 = Auk with a given u0 . How to find uk = Ak u0 , without actually powering the matrix? The idea is to rewrite u0 as a linear combination of normalized eigenvectors of A: u0 = c 1 x 1 + c 2 x2 + · · · + c n x n Now, Au0 is: Au0 = Ac1 x1 + Ac2 x2 + · · · + Acn xn = c1 λ1 x1 + c2 λ2 x2 + · · · Yep, we got a pattern! Now we know: Ak u0 = X ci λki xi i The idea of eigenvalues kind of sank in after looking at this example; they, sort of, decompose the linear mapping represented by A into orthogonal basis. After you represent a random vector in this space, the effects of A can be isolated in each direction. So it actually describes A pretty well! The name eigen now kind of makes sense. 7.4.2 Deriving Closed Form Solution of Fibonacci Sequence Let f0 = 0, f1 = 1, fn = fn−1 + fn−2 . I know that I can write un = " fn fn−1 # and un+1 " 1 = 1 # 1 un = Aun 0 What are the eigenvalues of A? The characteristic polynomial comes out to be (1 − λ) · (−λ) − 1 = λ2 − λ − 1 = 0 18 Plugging this into the quadratic formula, we get: √ √ √ 1± 5 1+ 5 1− 5 λ= : λ1 = , λ2 = 2 2 2 Since λ1 > 1, λ2 < 1, when n grows, λ1 will dominate the growth of the fibonacci number. So we know: √ !100 1+ 5 2 f100 ≈ c · Why? Rewrite u0 as u0 = c 1 x1 + c 2 x2 and we know 100 u100 = c1 λ100 1 x 1 + c 2 λ2 x 2 and with λ2 < 1, the second term is meaningless when k is large. Whoa whoa.... nice... For the sake of completeness, let’s calculate the eigenvectors as well. The eigenvectors are: x1 = " λ1 1 # , x2 = " λ2 1 # Solve for c1 and c2 by equating: u0 = " # 0 1 = c 1 x1 + c 2 x2 = " √ # c1 +c2 +(c1 −c2 ) 5 2 c1 + c2 Now we have the formula for uk - thus a closed form solution for fk . 7.4.3 Differential Equations Consider the following system of differential equations: du1 = −u1 + 2u2 dt du2 = u1 − 2u2 dt with initial value u1 (0) = 1, u2 (0) = 0. Let u (t) = [u1 (t) , u2 (t)] and we can write above as: T du = Au dt with A= " −1 1 2 # −2 The eigenvalues of A are 0 and -3, and the associated eigenvectors are x1 = [2, 1] and x2 = [1, −1] , T respectively. 19 T Now, the solution is a linear combination of two special solutions, each corresponding with an eigenvalue: u (t) = c1 eλ1 t x1 + c2 eλ2 t x2 which we can check by plugging into the above representation. We can solve for c1 and c2 using the initial condition - and we now know everything. So eigenvalues still give us insights about which parts of the solution blows up, or goes to 0, etc. Of course, since eigenvalues now sit on the exponent, it has to be negative to go to 0. If the eigenvalue is 0, the corresponding portion will stay constant. Note: the eigenvalues might be imaginary - in that case, only the real portion counts in terms of asymptotic behavior. For example, e(−3+6i)t = e−3t e6it = e−3t (cos t + i sin t) 6 and the latter part’s magnitude is 1. 7.4.4 Thinking In Terms of S and Λ In du = Au dt A is a non-diagonal matrix, and represents the interaction, relation between the variables. This is coupling; we can decouple variables by using eigenvalues. Now, decompose u into a linear combination of eigenvectors by setting u = Sv. We get: du dv dv =S = ASv ⇐⇒ = S −1 ASv = Λv dt dt dt Wow, we now have a set of equations like: v1′ = λ1 v1 , v2′ = λ2 v2 , and so on. Same as in the difference equation example. Now, how do we express the solution in this? Since dv = Λv dt we would like to express v as v (t) = eΛt v (0) which gives u (t) = SeΛt S −1 u (0) which gives the decoupling effect we are looking for. But WTF is that eΛt ? First let’s define eAt as: eAt = I + At + ∞ 2 n X (At) (At) + ···+ = 2 n! n=0 Just like the power series definition for eax = 1 + ax + 20 (ax)2 2! + (ax)3 3! + · · · . Now what is SeΛt S −1 ? e At =e SΛS −1 So it’s same as eAt ! 7.5 X SΛS −1 = n! n tn = X SΛn S −1 tn n! =S X Λ n tn n! S −1 = SeΛt S −1 Applications: Markov Matrices and Fourier Series 7.5.1 Markov Matrix What is a Markov Matrix? Nonnegative square matrix, with all columns summing up to 1. Now, we know those processes are never going to blow up. Maybe they will reach a steady state. We already know: • Any eval cannot be greater than 1, because it will make things blow up. • If an eval equals 1, the evec for that eval will be the steady state. We will find out that Markov matrices always have 1 as an evalue. Also, it will never be a repeated eigenvalue. 7.5.2 Proof of 1 Being An Eigenvector Since A has 1 as column sums, A − 1I has zero sum columns. Now, the rows are dependent: add up all rows and they sum to 0. This leads us to the corollary that A and AT has same eigenvalues ”because T det (A − λI) = det (A − λI) = det AT − λI ) 7.5.3 Projections with Orthonormal Basis If we have a set of orthonormal basis, arbitrary vector v can be represented as: v = Qx Since Q is a projection matrix, Q−1 = QT . So we can solve for x as: x = QT v Nothing Fourier related so far. What now? 7.5.4 Fourier Series We write a given function f as a linear combination of sin and cos: f (x) = a0 + a1 cos x + b1 sin x + a2 cos 2x + b2 sin 2x + · · · This infinite series is called the Fourier series. We now work in function space; instead of orthogonal vectors we use orthogonal functions: 1, cos x, sin x, cos 2x, and so on. We represent a function with a linear combination of those basis functions. But what does it mean that two functions are orthogonal? How is dot product defined between two functions? We define: f T g (x) = ˆ f (x) g (x) dx 21 We can calculate this between constants, sines and cosines because they are all periodic. Now, a0 is easy to determine - take the average value. What is a1 ? ˆ 2π f (x) cos xdx = a1 0 ˆ 0 2π 1 cos xdx =⇒ a1 = π 2 ˆ 2π f (x) cos xdx 0 where the latter equality comes from the fact the basis functions are orthogonal. ”Btw, I’m not sure how we can fix the bounds on the above integral. Maybe I should go back to the book.) 7.6 Symmetric Matrices and Positive Definiteness When A ∈ Sn where Sn is the set of n × n symmetric matrices, we state: • All eigenvalues are real • We can choose eigenvectors such that they are all orthogonal. The exact proof is left to the book. The usual diagonalization, A = SΛS −1 now becomes A = QΛQ−1 = QΛQT , the latter equality coming from the fact that Q has orthonormal columns, so QQT = I. This is called the spectral theorem; spectrum means the eigenvalues of the matrix. 7.6.1 Proof Why real eigenvalues? Let’s say Ax = λx We can take conjugates on both sides; ¯x ¯x = λ¯ A¯ However, since we assume A to be real, we know: ¯x ¯x = A¯ A¯ x = λ¯ Try using symmetry, by taking transposing stuff: ¯ x ¯T AT = xT A = x ¯T λ The second equality coming from symmetry assumption. Now, multiply x ¯T to the both sides of the first equation: x ¯T Ax = λ¯ xT x And we multiply x to the right side of the last equality: ¯ Tx x ¯T Ax = λx Then 22 λ¯ xT x = x ¯T Ax = λxT x Now, we know: ¯ λ=λ thus λ is real - if x ¯T x is nonzero. x ¯T x = X i ”unless x is 0. But if x is 0, λ = 0) (a + ib) (a − ib) = X a 2 + b2 > 0 i 7.6.2 When A is Complex ¯ The last equality can work if: We repeat the above argument, without assuming A = A. A=A T 7.6.3 Rank One Decomposition Recall, if A is symmetric, we can write: A = QΛQT = [q1 q2 · · · ] λ1 λ2 q1T T q2 = λ1 q1 q1T + λ2 q2 q2T + · · · .. .. . . So every symmetric matrix can be decomposed as a linear combination of perpendicular projection ”rank one) matrix! 7.6.4 Pivots And Eigenvalues Number of positive/negative eigenvalues for symmetric matrices can be determined from the signs of the pivots. The number of positive eigenvalues is the same as the number of positive pivots. 7.6.5 Positive Definiteness A PSD matrix is a symmetric matrix. If symmetric matrices are good matrices, PSD are excellent . It is a symmetric matrix with all eigenvalues are positive. Of course, all the pivots are positive. So, for 2 × 2 matrices, PSD matrices always have positive determinants and positive trace. However, this is not a sufficient condition for positive definiteness, as can be demonstrated in the following matrix: " # −1 0 0 −2 We state that a matrix is positive definite iff all its subdeterminants are positive; they determinants of submatrices formed by taking a m × m submatrix from the left top corner. 23 To summarize: • All eigenvalues are positive • All pivots are positive • All subdeterminants are positive 7.7 Complex Numbers and Examples Introducing complex numbers and FFT. 7.7.1 Redefining Inner Products for Complex Vectors If z ∈ Cn , z T z is not going to give me the length of the vector squared, as in real space. Because z T z = P P 2 2 2 j (aj + ibj ) = j aj − bj 6= kzk. As seen in the proof of real eigenvalues of symmetric vectors, we need: z¯T z. For simplicity, we write: z¯T z = z H z = X 2 kzi k = kzk 2 where H stands for Hermitian. So, from now on, let’s use Hermitian instead of usual inner product. 7.7.2 Redefining Symmetric Matrices We also claim our notion of symmetric matrix A = AT is no good for symmetrix matrix. We want A¯T = A 2 for obvious reasons ”so the diagonal elements of A¯T A are kai k ). We define a Hermitian matrix A to satisfy: AH , A¯T = A 7.7.3 Orthonormal Basis Now, for a matrix Q with orthonormal columns, we say: QH Q = I Also we call these matrices unitary. 7.7.4 Fourier Matrices 1 1 Fn = 1 . . . 1 w 1 w2 w2 .. . w4 .. . 1 wn−1 24 w2(n−1) ··· · · · · · · · · · ··· to generalize, we have (Fn )ij = wij . Note both indices are 0-based. Also, we want wn = 1 - nth primitive root of unity. So we use w = cos 2π 2π + sin = ei(2π/n) n n ”Of course I know we can use modular arithmetic to find a different primitive root of unity.. but meh.) One remarkable thing about Fourier matrices is that their columns are orthonormal. Then the following is true: T FnH Fn = I ⇐⇒ Fn−1 = F¯n which makes it easy to invert Fourier transforms! 7.7.5 Idea Behind FFT Of course, FFT is a divide-and-conquer algorithm. In the lecture, larger order Fourier matrices are connected to a smaller order matrice by noticing: Fn = " I D I −D #" Fn/2 0 0 Fn/2 # P for which P is a odd-even permutation matrix. Exploiting the structures of these matrices, this multiplication can be done in linear time. 7.8 Positive Definiteness and Quadratic Forms 7.8.1 Tests of Positive Definiteness These are equivalence conditions of positive definiteness for a symmetric matrix A: 1. All eigenvalues are positive. 2. All subdeterminants are positive. 3. All pivots are positive. 4. xT Ax > 0 for all x. ”Also, if all the positiveness in above definition is swapped by nonnegativeness, we get a positive semidefinite matrix.) Now what’s special with the new 4th property? Actually, property 4 is the definition of positive definiteness in most texts; property 1-3 are actually just the tests for it. What does the product xT Ax mean? If we do it by hand we get: xT Ax = X Aij xi xj i,j This is called the quadratic form. Now, the question is: is this positive for all x or not? 25 7.8.2 Graphs of Quadratic Forms Say x ∈ R2 and let z = xT Ax; what’s the graph of this function? If x is not positive ”semi)definite, we get a saddle point. A saddle point is a maximum in one direction whilest being a minimum in another. ”Actually these directions are eigenvalue directions.) What happens when we have a positive definite matrix? We know z will be 0 at the origin, so this must be the global minimum. Therefore, we want the first derivative to be all 0. However, this is not enough to ensure minimum point. We want to refactor quadratic form as a sum of squares form ” the completing the squares trick). So we can ensure that xT Ax is positive everywhere except 0, given a particular example. But how do we do it in a general case? The course reveals that, actually, Gaussian elimination is equivalent to completing the squares! Holy crap... Positive coefficients on squares mean positive pivots, which means positive definiteness! And if we try to recall Calculus we were presented with a magic formula called the second derivative test - which was just checking if second derivative matrix was positive definite! Niiicee. 7.8.3 Geometry of Positive Definiteness; Ellipsoids If a matrix is positive definite, we know xT Ax > 0 for except x = 0. If we set xT Ax = c for a constant c, this is an equation of a ellipse - or an ellipsoid. The major/middle/minor axis of this ellipsoid will be determined by the eigenvectors of A, their lengths being determined by the eigenvalues. 7.8.4 AT A is Positive Definite! Yep, AT A is always positive definite regardless of A. Because covariances.. but here’s a proof: xT AT Ax = (Ax) (Ax) = kAxk > 0 unless x = 0 2 T 7.9 Similar Matrices 7.9.1 Definition Two n × n matrices A and B are similar, if for some invertible M , A = M BM −1 . Example: A is similar to Λ because Λ = S −1 AS. Why are they similar? They have the same eigenvalues. How do we prove it? Let Ax = λx. Then Ax = M BM −1 x = λx ⇐⇒ BM −1 x = λM −1 x. Now, M −1 x is an eigenvector of B with the same eigenvalue. So this measure divides matrices into groups with identical set of eigenvalues. The most preferable of them, obviously, are diagonal matrices. They have trivial eigenvectors. 7.9.2 Repeated Eigenvalues And Jordan Form What if two or more eigenvalues are the same? Then the matrix might not be diagonalizable - it might not have a full set of independent eigenvectors. What happens now? Using above definition of similar matrices, there can be two families of matrices with same set of eigenvalues, but not similar to each 26 other. One is the diagonal matrix, in its own family. The other family contains all the other matrices with given eigenvalues. In the latter family, the matrix that is as close as possible to the diagonal matrix, is called the Jordan Form for the family of matrices. 7.9.3 Updated Definition Looking at some examples reveals that similar matrices actually have the same number of eigenvalues as well. So when eigenvalues are repeated, diagonal matrices have n eigenvectors - other matrices don’t. 7.9.4 Jordan Theorem Every square matrix A is similar to a Jordan matrix J which is composed of Jordan blocks in the main diagonal. For an eigenvalue λi repeated r times, the Jordan block is a r × r matrix with λi on the diagonals, and 1s on the above diagonal with rest of the entries 0. 7.10 Singular Value Decomposition 7.10.1 Introduction We can factorize symmetric matrices as A = QΛQT . We can also factor a general matrix A as A = SΛS −1 but this can’t be done in some cases, when S is not invertible. SVD is a generalized diagonalization approach which defines a decomposition A = U ΣV T for any matrix A with a diagonal Σ and orthonormal U and V . In other words, we can say: A = U ΣV T = U ΣV −1 ⇐⇒ AV = U Σ where V is a orthnormal basis for the row space, U is an orthonormal basis for the column space. Hmm. Do the dimensions even match? 7.10.2 Calculation How can we find V ? Let’s think of AT A. AT A = V ΣT U T U ΣV T = V Σ2 V T Yes! We can factorize AT A ”which is posdef) to find its eigenvalues and orthnormal eigenvectors. The eigenvectors will be V , and we can construct Σ by taking the square root of eigenvalues of AT A ”which is possible, since AT A is posdef). Similarly, looking at AAT will let us find the U s. Of course, our assertion ”that U and V are basis of column and row spaces, respectively, and why the eigenvalues of AT A and AAT are the same) needs to be proven. ”In the lecture, the latter fact is stated as obvious.. where did I miss it?) 27 8 Linear Transformation 8.1 Linear Transformation and Matrices A linear transformation is a function T with the following properties: • T (u + v) = T (u) + T (v) • T (cu) = cT (u) Of course, all linear transformations have an unique matrix representation, and vice versa. How can we find a matrix given a linear transform? Let’s say we have a linear transform T : Rn → Rm . We have a basis for the input space v1 , · · · , vn and a basis for the output space w1 , · · · , wm . How do we find the matrix for this transformation? Transform the first basis v1 to get: T (v1 ) = c1 w1 + c2 w2 + · · · + cm wm . And those coefficients c1 · · · cm take up the first column of the matrix. 8.2 Change of Basis Image compression: say we are compressing a grayscale image. Using standard basis to represent this image does not exploit the fact that neighboring pixels tend to have similar luminousity value. Are there other bases that can give us good sparse approximations? JPEG uses the Fourier basis. It divides images into 8 × 8 blocks and changes the basis to Fourier basis, and we can threshold the coefficients. Hmm, actually, I want to try this out. Also, wavelets are a popular choice recently. 8.2.1 Same Linear Transformation from Different Bases Say we have a linear transformation T . If we put vectors in coordinate system defined by a set of basis v1 · · · vn , we will get a matrix for the transformation. Let’s call it A. If we use another set of basis w1 · · · wn , we get another matrix which we call B. A and B are similar as in 7.9! 8.2.2 Eigenvector basis Say we have an eigenvector basis: T (vi ) = λi vi . Then, the change of basis matrix is diagonal! 8.3 Left, right, pseudoinverse Let’s generalize the idea of an inverse. A 2-sided inverse is the usual inverse: AA−1 = I = A−1 A A matrix A has a 2-sided inverse when it’s square, and has full rank: n = m = r. 28 8.3.1 Left and Right Inverses Suppose a full column-rank matrix n = r. The null space is just {0}, and for any Ax = b there is either 0 or 1 solution. Since A is full column rank, AT A is full rank and invertible. Note that we have a left inverse −1 T here: AT A A . If we multiply this inverse and A we get: −1 T −1 T AT A A A = AT A A A =I Resulting I is a n × n matrix. Similarly, suppose a full row-rank matrix ”m = r). The null space has dimension n − r, so for every −1 Ax = b there are infinitely many solutions. Now we have a right inverse: AT AAT . 8.3.2 Left Inverse and Project What do we get if we multiply the left inverse on the right? −1 T A AT A A This is a projection matrix! Similarly, if we multiply the right inverse on the left, we will get a projection matrix that projects onto its row space. 8.3.3 Pseudoinverse What is the closest thing to an inverse when A is neither full row or column rank? Think of this: take any vector in the row space, and transform it by A, you’ll get something from a column space. ”In this regard, A is a projection onto the column space.) The two spaces ”row and column) have the same dimension, so they should have a 1:1 ”or invertible) relationship - so the matrix that undoes this transformation is called the pseudoinverse, A+ . 8.3.4 Pseudoinverse from SVD How do we find a pseudoinverse? Maybe we can start from SVD: A = U ΣV −1 where Σ is a ”sort-of) diagonal matrix sized m × n with singular values on the diagonal. What is its pseudoinverse? Well that’s easy - we can get a n×m matrix and put inverse singular values on the diagonal. Then what happens in ΣΣ+ ? We get a m × m matrix with first r diagonal entries 1. Σ+ Σ works similarly. How do we go from Σ+ to A+ ? Because U and V are orthonormal, we can just use: A+ = V Σ+ U T 29 Singular Vector Decomposition January 19, 2015 Abstract This is my writeup for Strang’s Introduction to Linear Algebra, Chapter 6, and the accompanying video lectures. I have never had an intuitive understanding about SVDs... now I sorta do. Let’s go over the basics, derivation, and intuition. 1 Eigenvalues and Eigenvectors 1.1 Introduction Let A be a n × n matrix. Then x ∈ Rn is an eigenvector of A iff: Ax = λx ”1) for some number λ. In laymen’s terms, x does not change its direction when multiplied by - it merely scales by λ. λ is called the eigenvalue associated with x. Of course, any nonzero multiple of x is going to be a eigenvector associated λ; it is customary we take unit vectors. 1.1.1 Calculation How do we find eigenvalues and eigenvectors given A? Rewrite ”1) as: Ax = λIx ⇐⇒ (A − λI) x = 0 In other words, x must be in null space of A − λI. In order to have nontrivial x, A − λI must be singular. That’s how we find eigenvalues - solve: det |A − λI| = 0 This boils down to solving a nth order polynomial. The roots can be anything - they can be repeated, negative, or even complex. 1.1.2 Properties These nice properties hold: • If A is singular, 0 is an eigenvalue - of course, because det A = det |A − 0I| = 0. 1 • Determinant of A equals the product of all eigenvalues. • Trace of A equals the sum of all eigenvalues. 1.1.3 Eigenvectors Are In C (A) Something that was not immediately obvious was that each x was in the column space C (A). x comes from null space of A − λI, which doesn’t seem to be related to A - so it sounded surprising to me first. However, recall the definition: Ax = λx. Therefore, λx ∈ C (A) and so is x. 1.2 Diagonalization Everything we want to do with eigenvectors work fine when we have n linearly independent eigenvectors. For now, let us assume we can choose such eigenvectors. Then, we can perform something that is very nice called diagonalization. Let x1 · · · xn be n eigenvectors, each associated with eigenvalues λ1 · · · λn . It is defined: Axi = λi xi for i = 1 · · · n We can write this in matrix form. Let S be a matrix with xi as column vectors. This is a n × n matrix, and the above LHS can be written as: h A x1 x2 ··· x3 i xn = AS Let Λ be a diagonal matrix where Λii = λi , then RHS can be written as: h λ1 x 1 λ2 x 2 λ3 x 3 ··· i λn xn = SΛ Joining the two gives AS = SΛ S is invertible since its columns are independent. Then we can write: A = SΛS −1 which is called the diagonalization of A. 1.2.1 Matrices That Are Not Diagonalizable When is A not diagonalizable? Say we have a repeated eigenvalue, λd which is repeated r times. A − λd will be singular, but its rank might be greater than n − r. In such case, rank of the null space of the matrix is less than r, and we won’t be able to choose r vectors that are independent. 1.3 Intuition A n × n matrix can be seen as a function ”actually it’s a linear transformation): it takes a vector, and returns a vector. Eigenvectors can be regarded as axis of this function, where those on this axis are not changed 2 ”at least in terms of directions). If we use eigenvectors as axis, we can represent any vector in C (A) in this coordinate system, by representing it as a linear combination of eigenvectors. After we do this change of coordinates, the transformation is done by multiplying each coordinate with its eigenvalues individually. There are no interactions between each axis anymore. What happens when x ∈ / C (A)? Of course, even if x ∈ / C (A), Ax ∈ C (A). Say x = a + b where a ∈ C (A) and b ∈ / C (A) ⇐⇒ b ∈ N (A). Then Ax = Aa + Ab = Aa. Therefore we can just project x onto C (A) first and proceed as if x was in C (A). So, now we see x as: projecting x onto C (A) and do a change of coordinates, multiply each coordinate, and convert back to the original coordinate system. Note the diagonalization: A = SΛS −1 Multiplying x by A is multiplying 3 matrices - S −1 which maps x onto the eigenvector coordinate system, Λ that multiplies each coordinates ”remember that Λ is diagonal!), and S that maps the result onto the original coordinate system again. 1.3.1 Application: Powers of Matrix Using this diagonalization, powers of matrices can be calculated easily. Let what is A100 ? Since A2 is A2 = SΛS −1 SΛS −1 = SΛ2 S −1 A100 = SΛ100 S −1 . And exponential of a diagonal matrix is really trivial. 2 Symmetric And Positive Definite-ness 2.1 Orthonormal Eigenvectors When A is symmetric, we have special characteristics that make the diagonalization even better. Those are: 1. All eigenvalues are real. 2. We can always choose n orthonormal eigenvectors; not only they are independent, but they can be chosen to be perpendicular to each other! The latter point now means that S T S = I ⇐⇒ S = S −1 . We should actually call this matrix Q now, as in QR decomposition. That gives the following diagonalization: A = QΛQT 2.1.1 Proof ¯ The second The first property is proven by taking complex conjugate of λ and discovering that λ = λ. property is more complex to prove; it comes from Schur’s theorem. Schur’s theorem states that: 3 Every square matrix can be factored into QT Q−1 where T is upper triangular and Q is orthonormal. I think this is very intuitive - it’s an analogue of using QR decomposition to find an orthonormal basis for the column space. Now, R is upper triangular - because first column in A is represented as a multiple of the first column of Q. Second column in A is represented as linear combinations of first two columns in R, etc. Now, we can think of decomposing R into R = T Q−1 where Q−1 maps x onto this coordinate system, and T working in this coordinate system. Then QT Q−1 works just like the diagonalization in 1.3. Now we use induction and prove the first row and column of T are zeros, except for the top left element. If we continue like this, we get a diagonal T which means we will have: A = QΛQ−1 = QΛQT 2.1.2 Sum of Rank One Matrices The symmetric diagonalization can be rewritten as A = QΛQT = λ1 x1 xT1 + λ2 x2 xT2 + · · · Yep, it’s a weighted sum of rank one matrices! Nice! Even better, x1 xT1 are projection matrices! Because kxi k = 1 since orthonormal, the projection matrix formula −1 T A AT A A becomes just xi xTi in this case. So, we do have a great interpretation of this; multiplication by a symmetric matrix can be done by mapping x onto different, orthogonal 1D spaces. Then, each coordinate will be multiplied by a certain number. Later we can map it back to the original coordinates. This provides another insight regarding what eigenvalues and eigenvectors actually mean. The eigenvector associated with the largest eigenvalue is the axis where multiplying A makes the biggest change! Since truncated SVD is just a generalization of this diagonalization, it is very intuitive how PCA can be done by SVD. 2.2 Positive Definite Matrices 2.2.1 Definition A special subset of symmetric matrices are called positive definite. The following facts are all equivalent; if one holds, everything else will. 1. If we do elimination, all pivots will be positive. 2. All eigenvalues are positive. 4 3. All n upper-left determinants are positive. 4. xT Ax is positive except at x = 0. 2.2.2 Gaussian Elimination is Equivalent to Completing the Square How on earth is property 4 related to other properties? Why are they equivalent? The course proceeds with an example, and states the following without further generalization. P xT Ax is effectively a second order polynomial: ij xi xj Aij . How on earth do we know if this is bounded at 0? We complete the squares! Represent that formula by a sum of squares - and since squares are non- negative we know the polynomial will be positive unless all numbers are 0. The big revealation is that this process is same as Gaussian elimination. Positive coefficients on squares mean positive pivots! Holy crap. Thus, if 1-3 holds, 4 will hold. If 4 holds, the result of the completed squares will show that 1-3 holds. 2.2.3 Relation to Second Order Test in Calculus Recall the awkward second order test in Multivariate Calculus, which was stated without proof? It actually checks if the Hessian is positive definite. Hahaha! 2.2.4 AT A is Always PosDef A special form, AT A, always yields positive definite matrix regarless of the shape of R - if R has independent columns. This is why covariance matrices are always positive! Actually, the converse always holds too: if B is posdef, there always exists an A such that AT A = B. This can be found by the Cholesky decomposition of B! Recall: all covariance matrices are positive definite, and all positive definite matrices are covariance matrices of some distribution . 3 Singular Value Decomposition 3.1 Definition and Intuition SVD is a generalization of the symmetric diagonalization. It is applicable to any matrix ”doesn’t have to be symmetric, or even square). Therefore it is the most useful. How can this be done? Instead of using a single set of orthonormal basis, we use two sets U and V . Then a matrix A can be factored as: A = U ΣV T where U and V are orthonormal. U is a basis of column space of A, V is a basis of row space of A. Σ is a ”sort-of) diagonal matrix with singular values on its diagonals. 3.1.1 Intuition The same intuition from symmetric diagonalization applies here. Given x, we can first map it to the row space. ”Since V is orthonormal, V T = V −1 - so think of it as the mapping to the row space.) Now, x is rep- 5 resented as a linear combination of an orthnormal basis of the row space of A. We now multiply each coordinate by a number, and convert back to original coordinates by U . Since Ax is always in C (A), columns of U are the basis of C (A). Hmm, sounds like magic. I know I can map to a space, and recover original coordinate system from that space. But I am mapping x to row space and recovering from column space as if we mapped x to the column space as if we mapped to column space in the first place. WTF? This holds because columns of V are sort-of eigenvectors of A; if we transform vi , we get a multiple of ui . Those are called singular vectors, and the relation goes like this: Avi = σi ui where σi are called singular values. Also, orthogonality gives that all vi and ui s are orthogonal to each other! Woah, there’s too much magic in here.. :) 3.1.2 Analogue to Rank-one Decomposition We can also write: A = U ΣV T = σ1 u1 v1T + σ2 u2 v2T + · · · we can easily see how PCA works with SVD. 3.2 Derivation When m 6= n for A ∈ Rm×n , the dimensions are kind of match up. But I will gloss over the details. ”It’s past midnight) Let U be the eigenvector matrix for AAT , V be the eigenvector matrix for AT A and everything works out. We can choose these matrices to be orthnormal, because AT A and AAT are symmetric. Now we assert we can find Σ such that: A = U ΣV T Multiply both sides by AT on the left: AT A = U ΣV T T U ΣV T = V ΣU T U ΣV T = V Σ2 V T the last equality coming from that we chose Σ to be orthonormal. Yep, RHS is the symmetric decomposition of AT A - I said it works out. So the diagonal entries of Σ will contain square roots of eigenvalues of AT A. Now we can close the loop by proving AV Σ−1 = U First, we prove that columns of AV Σ−1 have unit length: AT AV = V Σ2 ⇐⇒ V T AT AV = V T V Σ2 T ⇐⇒ (AV ) AV = Σ2 6 ”2) The last equality shows that columns of AV are orthogonal, and the ith singular value gives its length squared. Next, we prove AV Σ−1 is indeed an eigenvector of AAT . Multiply ”2) by A on both sides, on the left, and rearrange to get: AAT AV = ΣAV Note that column vectors of AV are actually eigenvectors of matrix AAT . ”Smart parenthesis will let you realize this). 4 That Was It! Wasn’t too hard right? 7 Multivariable Calculus Lecture Notes [email protected] January 21, 2015 Contents 1 Directional Derivatives 2 2 Lagrange Multipliers 2 3 Non-independent Variables 3 4 Double Integrals 4 5 Polar Coordinates 4 5.1 Moment of Inertia . . . . . . . . . . . . . . . . . . . . . . . . . . . . . . . . . . . . . . . . . . . . . 6 Change Of Variables 4 4 6.1 General Method and Jacobian . . . . . . . . . . . . . . . . . . . . . . . . . . . . . . . . . . . . . . 4 6.2 Outline of Proof . . . . . . . . . . . . . . . . . . . . . . . . . . . . . . . . . . . . . . . . . . . . . . 5 6.3 Revisiting Polar Coordinates . . . . . . . . . . . . . . . . . . . . . . . . . . . . . . . . . . . . . . . 5 6.4 Determining Boundaries with Changed Variables . . . . . . . . . . . . . . . . . . . . . . . . . . 5 7 Vector Fields and Line Integrals 5 7.1 Parameterized Representation of Trajectory . . . . . . . . . . . . . . . . . . . . . . . . . . . . . 6 7.2 Geometric Approach . . . . . . . . . . . . . . . . . . . . . . . . . . . . . . . . . . . . . . . . . . . 6 7.3 Gradient Field . . . . . . . . . . . . . . . . . . . . . . . . . . . . . . . . . . . . . . . . . . . . . . . 6 7.3.1 The Fundamental Theorem of Calculus for Line Integrals . . . . . . . . . . . . . . . . . 7 7.3.2 Testing If F Is A Gradient Field . . . . . . . . . . . . . . . . . . . . . . . . . . . . . . . . . 7 7.3.3 Identifying Potentials . . . . . . . . . . . . . . . . . . . . . . . . . . . . . . . . . . . . . . . 7.4 Curl . . . . . . . . . . . . . . . . . . . . . . . . . . . . . . . . . . . . . . . . . . . . . . . . . . . . . 7 8 8 Green’s Theorem 8.1 Proof . . . . . . . . . . . . . . . . . . . . . . . . . . . . . . . . . . . . . . . . . . . . . . . . . . . . 8 8 9 Flux and Green’s Theorem in Normal Form 9 9.1 Interpretation . . . . . . . . . . . . . . . . . . . . . . . . . . . . . . . . . . . . . . . . . . . . . . . 9 9.2 Green’s Theorem in Normal Form . . . . . . . . . . . . . . . . . . . . . . . . . . . . . . . . . . . 9 10 Triple Integrals and Spherical Coordinates 9 10.1 Cylinderical Coordinates . . . . . . . . . . . . . . . . . . . . . . . . . . . . . . . . . . . . . . . . . 9 10.2 Spherical Coordinates . . . . . . . . . . . . . . . . . . . . . . . . . . . . . . . . . . . . . . . . . . 9 1 11 Vector Fields in Space 10 11.1 Flux in Space . . . . . . . . . . . . . . . . . . . . . . . . . . . . . . . . . . . . . . . . . . . . . . . . 11.1.1 Examples: Spheres and Cylinders . . . . . . . . . . . . . . . . . . . . . . . . . . . . . . . 10 10 11.1.2 General Case . . . . . . . . . . . . . . . . . . . . . . . . . . . . . . . . . . . . . . . . . . . . 10 11.1.3 Even More General: Parametric Description . . . . . . . . . . . . . . . . . . . . . . . . . 11 11.1.4 When You Only Know The Normal Vector . . . . . . . . . . . . . . . . . . . . . . . . . . . 11.2 Divergence Theorem . . . . . . . . . . . . . . . . . . . . . . . . . . . . . . . . . . . . . . . . . . . 11 12 11.2.1 Del Notation . . . . . . . . . . . . . . . . . . . . . . . . . . . . . . . . . . . . . . . . . . . . 12 11.2.2 Physical Interpretation . . . . . . . . . . . . . . . . . . . . . . . . . . . . . . . . . . . . . . 13 11.2.3 Proof . . . . . . . . . . . . . . . . . . . . . . . . . . . . . . . . . . . . . . . . . . . . . . . . 13 11.2.4 Application: Diffusion Equations . . . . . . . . . . . . . . . . . . . . . . . . . . . . . . . . 13 11.3 Line Integrals In The Space . . . . . . . . . . . . . . . . . . . . . . . . . . . . . . . . . . . . . . . 11.3.1 Testing If A Vector Field Is A Gradient Field . . . . . . . . . . . . . . . . . . . . . . . . . . 14 14 11.3.2 Using Antiderivatives to Find The Potential . . . . . . . . . . . . . . . . . . . . . . . . . . 14 11.4 Curl in 3D . . . . . . . . . . . . . . . . . . . . . . . . . . . . . . . . . . . . . . . . . . . . . . . . . . 11.5 Stokke’s Theorem . . . . . . . . . . . . . . . . . . . . . . . . . . . . . . . . . . . . . . . . . . . . . 15 15 11.5.1 Orientation . . . . . . . . . . . . . . . . . . . . . . . . . . . . . . . . . . . . . . . . . . . . . 15 11.5.2 Relationship To Green’s Theorem . . . . . . . . . . . . . . . . . . . . . . . . . . . . . . . . 16 11.5.3 Outline of Proof . . . . . . . . . . . . . . . . . . . . . . . . . . . . . . . . . . . . . . . . . . 16 11.6 Green and Related Theorems . . . . . . . . . . . . . . . . . . . . . . . . . . . . . . . . . . . . . . 16 11.7 Simply-connectedness . . . . . . . . . . . . . . . . . . . . . . . . . . . . . . . . . . . . . . . . . . 16 11.8 Path Independence and Surface Independence 16 . . . . . . . . . . . . . . . . . . . . . . . . . . . 12 Exam Review 17 13 Extra: Matrix Derivatives 17 13.1 Derivative Matrix and Gradient . . . . . . . . . . . . . . . . . . . . . . . . . . . . . . . . . . . . . 17 13.2 The Chain Rule for Derivative Matrices . . . . . . . . . . . . . . . . . . . . . . . . . . . . . . . . 18 13.3 Hessian Matrix 18 . . . . . . . . . . . . . . . . . . . . . . . . . . . . . . . . . . . . . . . . . . . . . . 1 Directional Derivatives What is the derivative of function f along a vector ~v ? Simply, ∇f · ~v |~v | which is the gradient vector projected onto the unit vector. Makes so much sense. 2 Lagrange Multipliers Instead of solving regular minimization/maximization problems, one can solve such problems when the inputs are constrained , where they are on a curve. Restating, Maximize/minimize f (x, y, z) such that g (x, y, z) = c 2 How do we solve this? Note that when the extreme will happen on one of the boundary, or where the level curve of f is parallel to the curve g = c. Here is a colloquial, informal argument; if they were not parallel, working along the curve in the right direction will increase/decrease the value of f , thus it won’t be a maximum/minimum. Finding such point is easy: the gradient vector of f is perpendicular to the level curve, and the gradient of g is perpendicular to the constraint curve. So we set ∇f = λ∇g which gives us a system of equations. The λ is called the Lagrange Multiplier. Note the Lagrange Multiplier condition being satisfied is only a necessary condition for minimum/maximum points; always check the boundary, as well as minimum/maximum criteria. 3 Non-independent Variables What happens when some of the variables are related in a multivariate function? Let w = x2 + y 2 + z 2 , where z = x2 + y 2 . What is ∂w ∂x ? Turns out this problem is ill-defined. All the materials so far assumed all the variables are independent; however in this problem it is not. The restriction equation is a curve; we are differentiating the value of w along a curve. It depends on which direction you are differentiating – in other words, which direction you are holding constant. A new notation is in order: ∂w ∂x y means differentiating w with respect to x, while holding y constant. Therefore, z will become a dependent variable and change as we go. This has the effect of slicing the constraint surface with a xy plane and differentiating on the resulting curve. Now how do we calculate these? • Total differentials: take total differentials, let the differentials for the fixed variables to be 0. Solve for interested derivative. dw = 2xdx + 2ydy + 2zdz = 2xdx + 2zdz dz = 2xdx + 2ydy = 2xdx Combining, Solving for dw/dx dw = 2xdx + 2 x2 + y 2 2xdx dw = 2x + 4x3 + 4xy 2 dx • Chain rule: 3 ∂w ∂x y ∂y ∂z ∂x +wy +wz = 2x + 4xz = 2x + 4x3 + 4xy 2 = wx ∂x ∂x ∂x | {z } | {z } | {z } 1 0 2x 4 Double Integrals Iterative integral method is introduced. 5 Polar Coordinates Sometimes it is helpful to use polar coordinates, r and θ. When we use this change of variables, we cannot say: dxdy = drdθ Why? We are dividing the region as a set of infinitesimal rectangles, one side of which is dr, but the another side is r · dθ. So we have dxdy = r · drdθ 5.1 Moment of Inertia I= ¨ 2 d (x, y) δ (x, y) dA d being the distance from the axis of rotation, δ being the density. 6 Change Of Variables 6.1 General Method and Jacobian Say we have a function of x and y, and want to integrate it by u (x, y), v (x, y). ”This usually happens when this change simplifies the integrand greatly, or the boundaries of the integration) How do we do this in general? When we transform dxdy into dudv – what is the conversion factor for transformation? It is the absolute value of the Jacobian, which is defined as: ∂ (u, v) ux J= = ∂ (x, y) vx uy vy which is the determinant of the matrix of partial derivatives. We have: ˆ dudv = ˆ |J| dxdy You can also remember it as |J|∂ (x, y) = ∂ (u, v) 4 Note the absolute value: the area of the area element is always positive. Also note ∂ (u, v) ∂ (x, y) · =1 ∂ (x, y) ∂ (u, v) which is useful for easier calculation. 6.2 Outline of Proof We take total derivatives of the relationship to get: " ∆u ∆v # = " ux ∆x + uy ∆y vx ∆x + vy ∆y # = " ux vx uy vy #" ∆x ∆y # Now transform(∆x, 0) and (0, ∆y) to uv-coordinate space. We get (ux ∆x, vx ∆y) and (uy ∆y, vy ∆y). Now, take the cross product of these variables which is the area of the translated rectangle: dA′ = dudv = (ux vy − vx uy ) ∆x∆y = Jdxdy 6.3 Revisiting Polar Coordinates Let’s try to revalidate our polar coordinates formula using the Jacobian. We have the following transformation: " x y # = " r cos θ r sin θ # The Jacobian is: x r J= yr So xθ cos θ = yθ sin θ −r sin θ =r r cos θ dxdy = |r| dudv = rdudv which justifies our formula for polar coordinates. 6.4 Determining Boundaries with Changed Variables There are no general methods, a careful case-by-case analysis is needed. One good tip is transform the integrated region into uv-coordinate space ”not always possible, when we are in higher dimension), and consider each edge one by one. 7 Vector Fields and Line Integrals Vector field is defined by a function from R2 → R2 : F~ (x, y) = M (x, y) ˆi + N (x, y) ˆj 5 A line integral integrates a function of the vector field along a trajectory. For example, you can find the work done by the forces in the vector field, to a particle moving along a given trajectory. The work is defined as the dot product of the force and the displacement: W = F~ · ∆r So the quantity we want to calculate is: ˆ F~ (x, y) ∆r C which is very vague. What should we do? 7.1 Parameterized Representation of Trajectory Let ~r be a function of time parameter, t. Then we can slice the trajectory by infinitesimal dt and have: ˆ F~ (x, y) dr = C ˆ dr F~ (x (t) , y (t)) dt dt the latter integral is just a single variable integral with respect to t. Effectively, we are integrating the dot product of the force vector and the velocity vector. The same calculation could be carried out using a different notation: letting dr = hdx, dyi and realizing ~ F = hM, N i gives ˆ M dx + N dy C We cannot integrate this directly; M and N both rely on each of the two parameters. We can get dx and dy by using total differentials and represent them at t. This results in the same integral. 7.2 Geometric Approach Notice: d~r = T~ ds where T~ is the tangent vector along the trajectory, and ds is the length element. Noticing this will let you integrate some of the integrals just intuitively. 7.3 Gradient Field In physics, we see something called gradient field; vector field where F is defined as a gradient of a function. F~ = ∇f The following three statements are equivalent. 1. F is a gradient field. 6 2. Path-dependency: if two paths have coinciding starting and ending points, the work done by the field along the two paths are the same. 3. Conservativeness: the work done to any closed path is 0. The proofs are not too involved. ”Don’t think we covered the proof from 3 to 1 though..) 7.3.1 The Fundamental Theorem of Calculus for Line Integrals States ˆ ∇f · d~r = f (P1 ) − f (P0 ) C where P1 and P0 are ending and starting points of the path. Outline of proof: ˆ ∇f · d~r = C ˆ fx C dy dx + fy dt dt with the second equality coming from the chain rule. dt = ˆ C df dt = dt ˆ df C 7.3.2 Testing If F Is A Gradient Field It is claimed that F~ = M ˆi + N ˆj is a gradient field iff: My = N x and the field is defined & differentiable in the entire plane. 7.3.3 Identifying Potentials Say the above equation holds - can we recover the potential function from the gradients? Two ways are discussed: 1. Set up an arbitrary path from (0, 0) to (x1 , y1 ) and do a line integral. The value will be f (x1 , y1 )−f (0, 0) but as we don’t care about constants ”potentials are equivalent up to a constant) we can just calculate f (x1 , y1 ) and take it to the potential function. 2. Use antiderivatives - we know fx = M and fy = N . So calculate ˆ M dx = u (x, y) + g (y) x note g (y) appears in place of the integration constant. We can differentiate this with regard to y and try to match it with N . You generally don’t want to integrate N wrt y and match the two equations when trigs are involved it might not be easy to see the equivalence of two portions of the equations, causing confusion. I guess this kind of serves as a constructive proof for the equivalence in the beginning of 7.3. 7 7.4 Curl The curl is defined as: curlF = Nx − My from the definition, we know the curl is 0 when F is a gradient field. In physics context, the curl measures the angular/rotational velocity/torque. Of course, I don’t care about those applications. 8 Green’s Theorem Green’s Thorem relates seemingly unrelated concepts, the curl and the line integral. If C is a closed curve that encloses the region R in counterclockwise direction, and F~ is defined everywhere, Green’s theorem says: ˛ F~ · d~r = C ˛ M dx + N dy = C ¨ Nx − My dA = R ¨ curlF dA R Note this can be used to prove that F~ is conservative if the curl is 0. 8.1 Proof Here’s an outline of the proof. First, we take the special case N = 0. Why does this suffice? The similar strategy can be used to prove the case for M = 0, and then we have two equalities which can be added to get the desired equality. ˛ ¨ M dx = ˛C −My dA ¨R N dy = Nx dA R C Second, we note that we are able to divide the region freely, calculate the integral separately, and sum them. The line which separates the two regions will get counted twice; but if we keep the counterclockwise direction, the two curves will cancel each other out. So, we say we will slice the region into vertically simple slices, which is defined by a ≤ x ≤ b, f1 (x) ≤ y ≤ f2 (x). Then ˛ M dx = ˆ b M (x, f1 (x)) dx − b M (x, f2 (x)) dx a a C ˆ Note the first equality holds because the line integrals are 0 in the vertical edges of the region, since dx = 0. What about the curl integral? ¨ b −My dA = ˆ b = ˆ f2 (x) − f1 (x) a R ˆ ∂M dydx ∂y M (x, f1 (x)) − M (x, f2 (x)) dx a which is equivalent to the expression for ¸ C M dx above and thus gives the proof. 8 9 Flux and Green’s Theorem in Normal Form Flux along a curve C is defined by ˆ F ·n ˆ ds C where n ˆ is a unit vector normal to C, rotated 90 degrees clockwise from the curve. If you think about it, it is actually rotating all the vectors in the vector field and calculating the work done by the field. Therefore, the Flux becomes, if F = hP, Qi, the rotated field F ′ = h−Q, P i ”note the field is rotated clockwise) ˆ F ·n ˆ ds = C ˆ −Qdx + P dy C and after that it’s just the regular line integral. 9.1 Interpretation If F is a velocity field, the flux measures the amount that passes through the given line, each unit time. 9.2 Green’s Theorem in Normal Form If F = hP, Qi, ˛ F ·n ˆ ds = C ˛ −Qdx + P dy = C ¨ Px + Qy dA = ¨ divF dA we know this is equivalent to the regular Green’s theorem. Also, Px + Qy = divF is called the divergence which measures the expanding-ness of the field. 10 Triple Integrals and Spherical Coordinates This portion of the course deals with integrating in the 3D space. The most obvious way is to use (x, y, z) coordinates – but that can be tricky at times. Often, using alternative coordinate system can make things easier. 10.1 Cylinderical Coordinates This is an extension of the polar coordinates, keeping z axis intact. Each point in space is represented by the triplet (r, θ, z). The volume element dV becomes r · dr · dθ · dz. Similarly, dS = rdθdz 10.2 Spherical Coordinates A point is represented by a triplet of coordinates (ρ, φ, θ). ρ represents the distance from the origin (ρ ≥ 0), φ represents the angle from the positive z-axis (0 ≤ φ ≤ π), θ represents the usual angle from the positive x-axis. First, we see z = ρ cos φ. r, the distance from the origin to the projection onto XY -plane, is given by ρ sin φ; therefore we have (x, y, z) = (ρ sin φ cos θ, ρ sin φ sin θ, ρ cos φ) 9 Mostly, they are integrated in the following order: dρdφdθ. What does a volume element dV look like? Note it is approximately a cuboid. The depth of the cuboid is easily found; it is ∆ρ. What are the lengths of the sides? The top-bottom sides ”parallel to the xy plane) are basically arcs of circles of length r = ρ sin φ. Therefore, its length is given by ρ sin φ∆θ. The left-right sides are arcs of circles of length ρ, so they are ρ∆φ. So we have: dV = ρ2 sin φdρdφdθ Similarly, the surface element can be found as dS = ρ2 sin φdφdθ 11 Vector Fields in Space Vector fields in spaces are defined. They are not that different from the 2D cousin. 11.1 Flux in Space The flux is not defined for lines in space; they are defined for surfaces. You should set up a double integral which represents the surface, and take the integral of F · n ˆ dS where F is the vector field, n ˆ is the normal vector to the surface, and dS is the surface area element. Note that there is not a preset way to set the orientation of n ˆ as in 2D cases – you’ll have to set it explicitly. Then Flux = ¨ F~ · ~ndS S If F is a velocity field, the flux of F through the surface S represents the amount of the matter that passes through S per unit time. 11.1.1 Examples: Spheres and Cylinders For a sphere of radius a centered at the origin, we have: 1 n ˆ = ± hx, y, zi a For a cylinder of radius a with its center coinciding with the z axis, we have: 1 n ˆ = ± hx, y, 0i a 11.1.2 General Case When z = f (x, y), you should set up bounds for x and y according to the shadow the surface casts on the xy plane. Also, we have: n ˆ dS = ± h−fx , −fy , 1i dxdy so if F = hP, Q, Si, 10 ¨ F~ · n ˆ dS = ± R ¨ −P fx − Qfy − Rdxdy R What is the proof/intuition behind this? Find a rectangle in the shadow of the curve with two sides ∆x and ∆y: the corresponding part of the curve will roughly look like a parallelogram, if the shadow rectangle is small enough. How do we find the area of a parallelogram? Of course: cross products. Also note the cross product will give us a normal vector; so it gives two in one! Say the lower-left point of the shadow rectangle is (x, y). The corresponding point in the curve will be (x, y, f (x, y)). We now can find two vectors ~u and ~v which coincide with the sides of the parallelogram, and their cross product will be: ~u × ~v = ~ndS Fortunately, they are easy to find. ~u goes from (x, y, f (x, y)) to (x + ∆x, y, f (x + ∆x, y)). Note that f (x + ∆x, y) ≈ f (x, y) + ∆x · fx (x, y) . Using similar process for ~v , we have: ~u = h∆x, 0, fx (x, y) · ∆xi = h1, 0, fx i ∆x ~v = h0, ∆y, fy (x, y) · ∆yi = h0, 1, fy i ∆y Now ˆi ˆj kˆ ~u × ~v = 1 0 fx = h−fx , −fy , 1i dxdy 0 1 f y 11.1.3 Even More General: Parametric Description S : (x, y, z) where each coordinate is a function of two parameters: x = x (u, v) , y = y (u, v) , z = z (u, v). Now, we want to express n ˆ dS as somethingdudv. Therefore, we find a position at ~r (u, v) and find a parallelogram with two sides ending at ~r. Using the similar technique, we get n ˆ ∆S = ± ∂~r ∂~r ∂~r ∂~r ∆u∆v ∆u × ∆v = ± × ∂u ∂v ∂u ∂v Note the analogeous pattern of this to the above formula. 11.1.4 When You Only Know The Normal Vector Say, if you know an equation of a plane, then the normal vector comes free. Another case; if your surface is given by g (x, y, z) = 0, you have ∆g as the normal vector. You can still use the above methods, but there is a shortcut. Slanted Plane If your surface is a slanted plane: find the angle the plane and the xy plane makes. Call this α. Then, the area element of the shadow ∆A is related to the area element of the shadow ∆S by: 11 ∆A = cos α∆S which is trivial. However, note that we can find cos α by taking the inner product between their normal vectors! ~ · kˆ N cos α = ~ N So we have ∆S = and n ˆ ∆S = ~ n ˆ · N ~ · kˆ N ~ N ~ · kˆ N ∆A ∆A = ± ~ N dxdy ~ · kˆ N g (x, y, z) = 0 Say we have a surface described by: z − f (x, y) = 0 Then ~ = ∇g = h−fx , −fy , 1i N Apply the above method and it is equivalent to what we saw in 11.1.2. 11.2 Divergence Theorem Also known as Gauss-Green theorem , it is a 3D analogue for Green in Normal Form. Goes like this: If a closed surface S completely encloses a region D, and we choose to orient the normal vectors to point outwards, and F~ is a vector field defined and differentiable everywhere in D: ‹ S ~= F~ · dS ‹ F~ · n ˆ dS = ˚ divF~ dV D S Now what is the divergence in 3D? Very easy to remember: div P ˆi + Qˆj + Rkˆ = Px + Qy + Rz 11.2.1 Del Notation Before we proceed to proof, a del notation is introduced: ∇= ∂ ∂ ∂ , , ∂x ∂y ∂z 12 which is a very informal notation, but we’ll just use this for now. So now we can think of divergence in terms of: ∇ · F~ = ∂Q ∂R ∂P + + ∂x ∂y ∂z This is not equivalent to a gradient; notice the dot there. The gradient is a vector; the divergence is a function. 11.2.2 Physical Interpretation A divergence of a vector field corresponds to a source rate , which is the amount of flux generated per unit volume. If our vector field is a velocity field of an incompressible fluid, then the surface integral of Flux is the amount of fluid leaving D per unit time. 11.2.3 Proof We employ the exact same strategy we used for proving Green’s theorem. Here’s an outline. • First, assume a vector field with only z component. ”We can later do the same thing to x and y, and sum up three identities to get the theorem.) • Assume a vertically simple region - something that lives between two graphs z1 (x, y) and z2 (x, y). ˝ ‚ • Now evaluate the integral Rz dzdxdy and h0, 0, Ri · n ˆ dS and hope to meet in the middle. – The latter integral can be done by dividing the entire surface into three pieces; the top, the bottom, and the sides. We can expect to have 0 flux for sides since our vector field doesn’t have any x or y component. – The top and the bottom integral can be done by using the formula in 11.1.2. ”Caveat: we’ll need to take care of the different orientation of the normal vector on top and bottom!) • Then we can move on to the general case; we can always slice any region into vertically simple slices, take the flux integral, and sum them up and they will be the same.. 11.2.4 Application: Diffusion Equations Diffusion equation governs how a new liquid diffuses within the ambient ”immobile) liquid. Ink in a cup of water, smoke in the air, ... We want to find the function that represents the concentration at the given point, from its partial derivatives: u (x, y, z, t). We have the set of equations: ∂u =k ∂t 2 =k∇ · ∇u} = k ∇ u | {z |{z} Laplacian div(∇u) ∂2u ∂2u ∂2u + 2 + 2 ∂x2 ∂y ∂z The same equation can be used in modeling heat in immobile air. So how is the vector field defined? Given a concentration, every point moves towards the direction where the concentration decreases the fastest; that is negative gradient. In fact: 13 F~ = −k∇u Now, whats the relationship between F~ and ∂u ∂t ? It’s the divergence theorem! Assume a small closed region D with a surface S. The flux of D through S is given as: ˚ divF~ dV = D d F~ · n ˆ dS = amount of smoke/liquid through S = − dt S ‹ ˚ udV D The first equality holding by the divergence theorem, and the latter equality justified by our definition above. We can modify the RHS to state: ˚ divF~ dV = − D d dt ˚ udV = − D ˚ ∂u dV ∂t The latter equality holds because the middle quantity is the derivative of sums; which is equivalent to sums of derivatives. So we have: divF~ = − ∂u ∂t 11.3 Line Integrals In The Space Doesn’t change things much, but checking if a vector field is a gradient field becomes more complicated. F~ = P ˆi + Qˆj + Rkˆ Now then Work = ˆ C F~ · d~r = ˆ P dx + Qdy + Rdz C Similar to the planar case, we parameterize the line and express the integral in terms of the parameter. ”See above) 11.3.1 Testing If A Vector Field Is A Gradient Field Contrary to the 2D case where we only checked My = Nx , we now have three different conditions to check. We exploit that the second derivatives are the same regardless of the order you take them. So we check: • Py = Q x • Pz = R x • Q z = Ry The field is a gradient field iff these hold and the field is defined for a simply connected region. 11.3.2 Using Antiderivatives to Find The Potential Say we want to solve: • fx = 2xy • fy = x2 + z 3 14 • fz = 3yz 2 − 4z 3 Calculate ˆ fx dx = x2 y + g (y, z) Note the integration constant g (y, z) is a function only consists of y and z. Then differentiate by y and compare with fy . ∂ fy = x + z = x + g y = ∂y 2 3 2 ˆ fx dx that tells us g = yz 3 + h (z). Of course, we will find h (z) with comparing the derivative with fz . fz = 3yz 2 − 4z 3 = 3yz 2 + h′ which tells us h (z) = −z 4 + c then we have f (x, y, z) = x2 y + yz 3 − z 4 + c 11.4 Curl in 3D Curl measures how much a vector field fails to be conservative. It is a vector-valued function: curlF~ = (Ry − Qz ) ˆi + (Pz − Rx ) ˆj + (Qx − Py ) kˆ F~ is defined in a simply connected region and is conservative, iff curl is 0. How to remember this: ˆi ∂ ∇ × F~ = ∂x P ˆj ∂ ∂y Q kˆ ∂ = curlF~ ∂z R Geometrically, curl measures the rotation component in a velocity field. Its direction points to the axis of rotation, and its magnitude gives us twice the angular velocity. 11.5 Stokke’s Theorem ˛ C F~ · d~r = ¨ ∇ × F~ ·ˆ ndS S| {z } curlF~ If C is a closed curve, and S is any surface bounded by C. Any surface, for real? 11.5.1 Orientation The orientations of C and S needs to be compatible. What does it mean? Right-hand rule: if we walk along C with S on our left side, the normal vector should be pointing up for us. Right hand rule: point thumb along C in the positive direction. Point index finger towards interior of S, tangent to S. Middle finger points n ˆ. 15 11.5.2 Relationship To Green’s Theorem When we limit a surface and the curve to a 2D plane, we get Green’s theorem. 11.5.3 Outline of Proof • By Green’s theorem, we know it holds for C and S in x, y plane. • By swapping coordinates accordingly, we can say the same for any coordinate plane; yz and xz planes. • Actually, it holds for any right-handed coordinates; whatever rotation you use, it will hold by Green’ theorem. ”Using that work, flux, curl make sense independently of coordinates.) • Given any S, we can decompose it into tiny, almost flat pieces. I guess we know where we are going! • So using the same cancelling argument, the only line integrals that are calculated are the ones along the edges. • In each of the small surface, since it’s almost flat , Green’s theorem works and the line integral equals the flux. • Now: the sum of flux = the sum of line integrals = line integral along C. 11.6 Green and Related Theorems Thesis 2 dimensions Total work ”line integral) equals total curl/flux of curl ”surface integral) Green’s theorem Flux ”line/surface integral) equals total divergence ”surface/volume integral) Green’s theorem in normal form Note that for 2D ˆ flux of curl equals total z component of 3D curl, which is • since the normal vector of 2D xy plane is k, the total 2D curl. • the surface and the volume are the same things so the Green’s theorem in normal form works in surface form. The direction conventions are set that the theorems will be compatible between 2D and 3D. 11.7 Simply-connectedness A region is simply-connected if every closed loop inside it bound at least one surface inside the region. ”The surface can be arbitrary.) Simply connectedness is critical to applying Green’s or Stoke’s theorem. 11.8 Path Independence and Surface Independence Green’s theorem gives you path independence when F~ is a gradient vector; the line integral will be the same whatever line you choose, when the endpoints are the same. Now note that Stoke’s theorem does somesthing similar; we are getting surface independence , where the surface integrals are the same whenever the edges are the same. 16 S Di In the 2D case, the gradient field property gives this independence; what is its 3D equivalent that yields surface independence? Take two surfaces S1 and S2 bounded by a curve C. What are the difference between two surface integrals? Merge the two surfaces S1 and S2 to get a surface S which is closed. We can calculate the flux across that surface by divergence theorem! Jeez, my head is spinning. ˚ D div ∇ × F~ dV If this divergence integral is always 0, this gives you the surface independence. We can check: ∇ × F~ = hRy − Qz , Pz − Rx , Qx − Py i The divergence of this is div ∇ × F~ = (Ry − Qz )x + (Pz − Rx )y + (Qx − Py )z = Rxy − Qxz + Pyz − Rxy + Qxz − Pyz =0 Yes, the divergence of a curl is always zero! 12 Exam Review We did triple, double, and single integrals in space: 13 Extra: Matrix Derivatives This summarizes the treatment of multivariate calculus through gradient and Jacobian. Although they are mostly technical matter, these have been important in many cases. 13.1 Derivative Matrix and Gradient If f : Rn → Rm , we have f1 f2 f (x1 , x2 , · · · , xn ) = f3 . . . fm the derivative matrix of f , Df is a m × n matrix consisting of first-order partial derivatives: ∂f1 ∂x1 ∂f2 ∂x1 ∂f1 ∂x2 ∂f2 ∂x2 ∂f1 ∂x3 ∂f2 ∂x3 ··· .. . ··· .. . ∂fm ∂x1 ∂fm ∂x2 ∂fm ∂x3 ··· . . . .. . 17 ∂f1 ∂xn ∂f2 ∂xn .. . ∂fm ∂xn ∂fi . Note Dfij = ∂x j When m = 1, which means a f is a real-valued function, we define ∇f , the gradient, to be a column vector consisting of partial derivatives: ∂f 1 ∂x ∂f ∂x 2 ∂f ∂x3 ∂f ∂f ∂f ∂f ∇f = , , ,··· , = . ∂x1 ∂x2 ∂x3 ∂xn . . ∂f ∂xn The latter round bracket notation is introduced for brevity on paper. Note Df is a row vector in this case; Df = ∇f T . 13.2 The Chain Rule for Derivative Matrices We have D (f ◦ g) (x) = Df (g (x)) Dg (x) where the multiplication is a matrix multiplication. Note the order is important! If we change the order it might not work. 13.3 Hessian Matrix When f is real-valued, we can define the Hessian matrix to be a n × n matrix with second-order partial derivatives: ∂2f 2 ∂∂x2 f1 ∂x2 ∂x1 H (f ) = .. . ∂2f ∂xn ∂x1 ∂2f ∂x1 ∂x2 ∂2f ∂x2 ∂x2 ··· .. . ··· .. . ∂2f ∂xn ∂x2 ··· ∂2f ∂x1 ∂xn ∂2f ∂x2 ∂xn .. . ∂2f ∂xn ∂xn Note this is a symmetric matrix. Note that D∇f = ∂f 1 ∂x ∂f ∂x 2 ∂f D ∂x3 2 ∂ f 2 ∂∂x2 f1 ∂x2 ∂x1 = . ... . . ∂2f ∂f ∂xn ∂xn ∂x1 ∂2f ∂x1 ∂x2 ∂2f ∂x2 ∂x2 ··· .. . ··· .. . ∂2f ∂xn ∂x2 ··· 18 ∂2f ∂x1 ∂xn ∂2f ∂x2 ∂xn .. . ∂2f ∂xn ∂xn = H(f ) Convex Optimization Lecture Notes ”Incomplete) [email protected] January 21, 2015 Contents 1 Introduction 5 2 Convex Sets 5 2.1 Types of Sets . . . . . . . . . . . . . . . . . . . . . . . . . . . . . . . . . . . . . . . . . . . . . . . . 2.1.1 Affine Sets . . . . . . . . . . . . . . . . . . . . . . . . . . . . . . . . . . . . . . . . . . . . . 5 5 2.1.2 Convex Sets . . . . . . . . . . . . . . . . . . . . . . . . . . . . . . . . . . . . . . . . . . . . 5 2.1.3 Cones . . . . . . . . . . . . . . . . . . . . . . . . . . . . . . . . . . . . . . . . . . . . . . . . 2.2 Important Sets . . . . . . . . . . . . . . . . . . . . . . . . . . . . . . . . . . . . . . . . . . . . . . . 5 5 2.2.1 Norm Balls / Norm Cones . . . . . . . . . . . . . . . . . . . . . . . . . . . . . . . . . . . . 6 2.2.2 Positive Semidefinite Cone . . . . . . . . . . . . . . . . . . . . . . . . . . . . . . . . . . . 2.3 Operations that Preserve Convexity . . . . . . . . . . . . . . . . . . . . . . . . . . . . . . . . . . 6 6 2.3.1 Linear-fractional and Perspective Functions . . . . . . . . . . . . . . . . . . . . . . . . . 6 2.4 Generalized Inequalities . . . . . . . . . . . . . . . . . . . . . . . . . . . . . . . . . . . . . . . . . 2.4.1 Positive Semidefinite Cone . . . . . . . . . . . . . . . . . . . . . . . . . . . . . . . . . . . 2.4.2 Minimum and minimal Elements . . . . . . . . . . . . . . . . . . . . . . . . . . . . . . . . 6 7 7 2.5 Supporting Hyperplane Theorem . . . . . . . . . . . . . . . . . . . . . . . . . . . . . . . . . . . . 7 2.6 Dual Cones . . . . . . . . . . . . . . . . . . . . . . . . . . . . . . . . . . . . . . . . . . . . . . . . . 2.6.1 Dual Generalized Inequality . . . . . . . . . . . . . . . . . . . . . . . . . . . . . . . . . . . 7 7 2.6.2 Dual Generalized Inequality and Minimum/Minimal Elements . . . . . . . . . . . . . . 7 3 Convex Functions 8 3.1 Basic Properties and Definitions . . . . . . . . . . . . . . . . . . . . . . . . . . . . . . . . . . . . 3.1.1 Extended-value Extensions . . . . . . . . . . . . . . . . . . . . . . . . . . . . . . . . . . . 8 8 3.1.2 Equivalent Conditions . . . . . . . . . . . . . . . . . . . . . . . . . . . . . . . . . . . . . . 8 3.1.3 Examples . . . . . . . . . . . . . . . . . . . . . . . . . . . . . . . . . . . . . . . . . . . . . . 8 3.1.4 Epigraph . . . . . . . . . . . . . . . . . . . . . . . . . . . . . . . . . . . . . . . . . . . . . . 9 3.1.5 Jensen’s Inequality . . . . . . . . . . . . . . . . . . . . . . . . . . . . . . . . . . . . . . . . 3.2 Operations That Preserve Convexity . . . . . . . . . . . . . . . . . . . . . . . . . . . . . . . . . . 9 9 3.2.1 Composition . . . . . . . . . . . . . . . . . . . . . . . . . . . . . . . . . . . . . . . . . . . . 10 3.3 The Conjugate Function . . . . . . . . . . . . . . . . . . . . . . . . . . . . . . . . . . . . . . . . . 10 3.4 Quasiconvex Functions . . . . . . . . . . . . . . . . . . . . . . . . . . . . . . . . . . . . . . . . . . 3.4.1 Properties . . . . . . . . . . . . . . . . . . . . . . . . . . . . . . . . . . . . . . . . . . . . . 11 11 3.4.2 Operations That Preserve Quasiconvexity . . . . . . . . . . . . . . . . . . . . . . . . . . 11 3.5 Log-concavity and Log-convexity . . . . . . . . . . . . . . . . . . . . . . . . . . . . . . . . . . . . 11 1 4 Convex Optimization Problems 11 4.1 Optimization Problems . . . . . . . . . . . . . . . . . . . . . . . . . . . . . . . . . . . . . . . . . . 4.1.1 Feasibility Problem . . . . . . . . . . . . . . . . . . . . . . . . . . . . . . . . . . . . . . . . 11 11 4.1.2 Transformations and Equivalent Problems . . . . . . . . . . . . . . . . . . . . . . . . . . 4.2 Convex Optimization . . . . . . . . . . . . . . . . . . . . . . . . . . . . . . . . . . . . . . . . . . . 12 12 4.2.1 Optimality Conditions . . . . . . . . . . . . . . . . . . . . . . . . . . . . . . . . . . . . . . 12 4.2.2 Equivalent Convex Problems . . . . . . . . . . . . . . . . . . . . . . . . . . . . . . . . . . 13 4.3 Quasiconvex Optimization . . . . . . . . . . . . . . . . . . . . . . . . . . . . . . . . . . . . . . . . 13 4.3.1 Solving Quasiconvex Optimization Problems . . . . . . . . . . . . . . . . . . . . . . . . . 13 4.3.2 Example: Convex over Concave 14 . . . . . . . . . . . . . . . . . . . . . . . . . . . . . . . . 4.4 Linear Optimization Problems . . . . . . . . . . . . . . . . . . . . . . . . . . . . . . . . . . . . . 14 4.4.1 Examples . . . . . . . . . . . . . . . . . . . . . . . . . . . . . . . . . . . . . . . . . . . . . . 14 4.4.2 Linear-fractional Programming . . . . . . . . . . . . . . . . . . . . . . . . . . . . . . . . . 14 4.5 Quadratic Optimization . . . . . . . . . . . . . . . . . . . . . . . . . . . . . . . . . . . . . . . . . 15 4.5.1 Examples . . . . . . . . . . . . . . . . . . . . . . . . . . . . . . . . . . . . . . . . . . . . . . 15 4.5.2 Second Order Cone Programming . . . . . . . . . . . . . . . . . . . . . . . . . . . . . . . 15 4.5.3 SOCP: Robust Linear Programming . . . . . . . . . . . . . . . . . . . . . . . . . . . . . . 16 4.5.4 SOCP: Stochastic Inequality Constraints . . . . . . . . . . . . . . . . . . . . . . . . . . . . 4.6 Geometric Programming . . . . . . . . . . . . . . . . . . . . . . . . . . . . . . . . . . . . . . . . . 16 16 4.6.1 Monomials and Posynomials . . . . . . . . . . . . . . . . . . . . . . . . . . . . . . . . . . 16 4.6.2 Geometric Programming . . . . . . . . . . . . . . . . . . . . . . . . . . . . . . . . . . . . . 17 4.6.3 Convex Transformation . . . . . . . . . . . . . . . . . . . . . . . . . . . . . . . . . . . . . 17 4.7 Generalized Inequality Constraints . . . . . . . . . . . . . . . . . . . . . . . . . . . . . . . . . . . 4.7.1 Conic Form Problems . . . . . . . . . . . . . . . . . . . . . . . . . . . . . . . . . . . . . . . 17 17 4.7.2 SDP: Semidefinite Programming . . . . . . . . . . . . . . . . . . . . . . . . . . . . . . . . 18 4.8 Vector Optimization . . . . . . . . . . . . . . . . . . . . . . . . . . . . . . . . . . . . . . . . . . . . 4.8.1 Optimal Values . . . . . . . . . . . . . . . . . . . . . . . . . . . . . . . . . . . . . . . . . . 4.8.2 Pareto Optimality . . . . . . . . . . . . . . . . . . . . . . . . . . . . . . . . . . . . . . . . . 18 18 18 4.8.3 Scalarization for Pareto Optimality . . . . . . . . . . . . . . . . . . . . . . . . . . . . . . 18 4.8.4 Examples . . . . . . . . . . . . . . . . . . . . . . . . . . . . . . . . . . . . . . . . . . . . . . 19 5 Duality 5.1 The Lagrangian And The Dual . . . . . . . . . . . . . . . . . . . . . . . . . . . . . . . . . . . . . . 19 19 5.1.1 The Lagrangian . . . . . . . . . . . . . . . . . . . . . . . . . . . . . . . . . . . . . . . . . . 19 5.1.2 The Lagrangian Dual Function . . . . . . . . . . . . . . . . . . . . . . . . . . . . . . . . . 19 5.1.3 Lagrangian Dual and Lower Bounds . . . . . . . . . . . . . . . . . . . . . . . . . . . . . . 20 5.1.4 Intuitions Behind Lagrangian Dual . . . . . . . . . . . . . . . . . . . . . . . . . . . . . . . 20 5.1.5 LP example and Finite Dual Conditions . . . . . . . . . . . . . . . . . . . . . . . . . . . . 20 5.1.6 Conjugate Functions and Lagrange Dual . . . . . . . . . . . . . . . . . . . . . . . . . . . 20 5.2 The Lagrange Dual Problem . . . . . . . . . . . . . . . . . . . . . . . . . . . . . . . . . . . . . . . 5.2.1 Duality Gap . . . . . . . . . . . . . . . . . . . . . . . . . . . . . . . . . . . . . . . . . . . . 20 21 5.2.2 Strong Duality And Slater’s Constraint Qualification . . . . . . . . . . . . . . . . . . . . 21 5.2.3 Examples . . . . . . . . . . . . . . . . . . . . . . . . . . . . . . . . . . . . . . . . . . . . . . 5.3 Geometric Interpretation . . . . . . . . . . . . . . . . . . . . . . . . . . . . . . . . . . . . . . . . 5.3.1 Strong Duality of Convex Problems . . . . . . . . . . . . . . . . . . . . . . . . . . . . . . 21 21 21 5.4 Optimality Conditions . . . . . . . . . . . . . . . . . . . . . . . . . . . . . . . . . . . . . . . . . . 22 2 5.4.1 Certificate of Suboptimality and Stopping Criteria . . . . . . . . . . . . . . . . . . . . . . 22 5.4.2 Complementary Slackness . . . . . . . . . . . . . . . . . . . . . . . . . . . . . . . . . . . . 5.4.3 KKT Optimality Conditions . . . . . . . . . . . . . . . . . . . . . . . . . . . . . . . . . . . 22 23 5.5 Solving The Primal Problem via The Dual . . . . . . . . . . . . . . . . . . . . . . . . . . . . . . . 5.6 Sensitivity Analysis . . . . . . . . . . . . . . . . . . . . . . . . . . . . . . . . . . . . . . . . . . . . 23 23 5.6.1 Global Sensitivity . . . . . . . . . . . . . . . . . . . . . . . . . . . . . . . . . . . . . . . . . 5.6.2 Local Sensitivity . . . . . . . . . . . . . . . . . . . . . . . . . . . . . . . . . . . . . . . . . . 24 24 5.7 Examples and Reformulating Problems . . . . . . . . . . . . . . . . . . . . . . . . . . . . . . . . 24 5.7.1 Introducing variables . . . . . . . . . . . . . . . . . . . . . . . . . . . . . . . . . . . . . . 5.7.2 Making explicit constraints implicit . . . . . . . . . . . . . . . . . . . . . . . . . . . . . . 5.7.3 Transforming the objective . . . . . . . . . . . . . . . . . . . . . . . . . . . . . . . . . . . 25 25 25 5.8 Generalized Inequailities . . . . . . . . . . . . . . . . . . . . . . . . . . . . . . . . . . . . . . . . 25 6 Approximation and Fitting 6.1 Norm Approximation . . . . . . . . . . . . . . . . . . . . . . . . . . . . . . . . . . . . . . . . . . . 25 25 6.1.1 Examples . . . . . . . . . . . . . . . . . . . . . . . . . . 6.1.2 Different Penalty Functions and Their Consequences 6.1.3 Outliers and Robustness . . . . . . . . . . . . . . . . . 6.1.4 Least-norm Problems . . . . . . . . . . . . . . . . . . . 6.2 Regularized Approximations . . . . . . . . . . . . . . . . . . . . . . . . . . . . . . . . . . . . . . . . . . . . . . . . . . . . . . . . . . . . . . . . . . . . . . . . . . . . . . . . . . . . . . . . . . . . . . . . . . . . . . . . . . . . . . . . . . . . . . 25 26 26 27 27 6.2.1 Bi-criterion Formulation . . . . . . . . . . . . . . . . . . . . . . . . . . . . . . . . . . . . . 6.2.2 Regularization . . . . . . . . . . . . . . . . . . . . . . . . . . . . . . . . . . . . . . . . . . . 6.2.3 ℓ1 Regularization . . . . . . . . . . . . . . . . . . . . . . . . . . . . . . . . . . . . . . . . . 27 28 28 6.2.4 Signal Reconstruction Problem . . . . . . . . . . . . . . . . . . . . . . . . . . . . . . . . . 6.3 Robust Approximation . . . . . . . . . . . . . . . . . . . . . . . . . . . . . . . . . . . . . . . . . . 28 29 6.3.1 Stochastic Formulation . . . . . . . . . . . . . . . . . . . . . . . . . . . . . . . . . . . . . . 6.3.2 Worst-case Robust Approximation . . . . . . . . . . . . . . . . . . . . . . . . . . . . . . . 6.4 Function Fitting . . . . . . . . . . . . . . . . . . . . . . . . . . . . . . . . . . . . . . . . . . . . . . 29 30 30 6.4.1 Constraints . . . . . . . . . . . . . . . . . . . . . . . . . . . . . . . . . . . . . . . . . . . . . 6.4.2 Sparse Descriptions and Basis Pursuit . . . . . . . . . . . . . . . . . . . . . . . . . . . . . 6.4.3 Checking Model Consistency . . . . . . . . . . . . . . . . . . . . . . . . . . . . . . . . . . 30 30 31 7 Statistical Estimation 7.1 Parametric Distribution Estimation . . . 7.1.1 Logistic Regression Example . . . 7.1.2 MAP Estimation . . . . . . . . . . . 7.2 Nonparameteric Distribution Estimation 31 . . . . . . . . . . . . . . . . . . . . . . . . 31 32 32 32 7.2.1 Priors . . . . . . . . . . . . . . . . . . . . . . . . . . . . . . . . . . . . . . . . . . . . . . . . 7.2.2 Objectives . . . . . . . . . . . . . . . . . . . . . . . . . . . . . . . . . . . . . . . . . . . . . 32 33 7.3 Optimal Detector Design And Hypothesis Testing 7.4 Chebyshev and Chernoff Bounds . . . . . . . . . . 7.4.1 Chebyshev Bounds . . . . . . . . . . . . . . 7.4.2 Chernoff Bounds . . . . . . . . . . . . . . . 7.5 Experiment Design . . . . . . . . . . . . . . . . . . . . . . . . . . . . . . . . . . . . . . . . . . . . . . . . . . . . . . . . . . . . . . . . . . . . . . . . . . . . . . . . . . . . . . . . . . . . . . . . . . . . . . . . . . . . . . . . . . . . . . . . . . . . . . . . . . . . . . . . . . . . . . . . . . . . . . . . . . . . . . . . . . . . . . . . . . . . . . . . . . . . . . . . . . . . . . . . . . . . . . . . . . . . . . . . . . . . . . . . . . . . . . . . . . . . . . . . . . 33 33 33 34 34 7.5.1 Further Modeling . . . . . . . . . . . . . . . . . . . . . . . . . . . . . . . . . . . . . . . . . 34 3 . . . . . . . . . . . . . . 8 Geometric Problems 34 8.1 Point-to-Set Distance . . . . . . . . . . . . . . . . . . . . . . . . . . . . . . . . . . . . . . . . . . . 8.1.1 PCA Example . . . . . . . . . . . . . . . . . . . . . . . . . . . . . . . . . . . . . . . . . . . . 34 35 8.2 Distance between Sets . . . . . . . . . . . . . . . . . . . . . . . . . . . . . . . . . . . . . . . . . . 8.3 Euclidean Distance and Angle Problems . . . . . . . . . . . . . . . . . . . . . . . . . . . . . . . . 35 35 8.3.1 Expressing Constraints in Terms of G . . . . . . . . . . . . . . . . . . . . . . . . . . . . . 8.3.2 Well-Condition Constraints . . . . . . . . . . . . . . . . . . . . . . . . . . . . . . . . . . . 8.3.3 Examples . . . . . . . . . . . . . . . . . . . . . . . . . . . . . . . . . . . . . . . . . . . . . . 35 36 36 8.4 Extremal Volume Ellipsoids . . . . . . . . . . 8.4.1 Lowner-John Ellipsoid . . . . . . . . . 8.4.2 Maximum Volume Inscribed Ellipsoid 8.4.3 Affine Invariance . . . . . . . . . . . . 8.5 Centering . . . . . . . . . . . . . . . . . . . . . . . . . . . . . . . . . . . . . . . . . . . . . . . . . . . . . . . . . . . . . . . . . . . . . . . . . . . . . . . . . . . . . . . . . . . . . . . . . . . . . . . . . . . . . . . . . . . . . . . . . . . . . . . . . . . . . . . . . . . . . . . . . . . . . . . . . . . . . . . . . . . . . . 36 36 36 37 37 8.5.1 Chebychev Center . . . . . . . . . . . . . . . . . . . . . . . . . . . . . . . . . . . . . . . . . 8.5.2 Maximum Volume Ellipsoid Center . . . . . . . . . . . . . . . . . . . . . . . . . . . . . . 8.5.3 Analytic Center . . . . . . . . . . . . . . . . . . . . . . . . . . . . . . . . . . . . . . . . . . 37 37 38 8.6 Classification . . . . . . . . . . . . . . . . . . . . . . . . . . . . . . . . . . . . . . . . . . . . . . . . 38 8.6.1 Linear Discrimination . . . . . . . . . . . . . . . . . . . . . . . . . . . . . . . . . . . . . . 8.6.2 Robust Linear Discrimination . . . . . . . . . . . . . . . . . . . . . . . . . . . . . . . . . . 8.6.3 Nonlinear Discrimination . . . . . . . . . . . . . . . . . . . . . . . . . . . . . . . . . . . . 38 38 39 8.7 Placement and Location . . . . . . . . . . . . . . . . . . . . . . . . . . . . . . . . . . . . . . . . . 8.8 Floor Planning . . . . . . . . . . . . . . . . . . . . . . . . . . . . . . . . . . . . . . . . . . . . . . . 39 39 9 Numerical Linear Algebra Background 40 10 Unconstrained Optimization 40 10.1 Unconstrained Minimization Problems . . . . . . . . . . . . . . . . . . . . . . . . . . . . . . . . 40 10.1.1 Strong Convexity . . . . . . . . . . . . . . . . . . . . . . . . . . . . . . . . . . . . . . . . . 10.1.2 Conditional Number of Sublevel Sets . . . . . . . . . . . . . . . . . . . . . . . . . . . . . 40 41 10.2 Descent Methods . . . . . . . . . . . . . . . . . . . . . . . . . . . . . . . . . . . . . . . . . . . . . 10.3 Gradient Descent . . . . . . . . . . . . . . . . . . . . . . . . . . . . . . . . . . . . . . . . . . . . . 10.3.1 Performance Analysis on Toy Problems . . . . . . . . . . . . . . . . . . . . . . . . . . . . 41 41 42 10.4 Steepest Descent . . . . . . . . . . . . . . . . . . . . . . . . . . . . . . . . . . . . . . . . . . . . . . 42 10.4.1 Steepest Descent With an ℓ1 Norm . . . . . . . . . . . . . . . . . . . . . . . . . . . . . . . 10.4.2 Performance and Choice of Norm . . . . . . . . . . . . . . . . . . . . . . . . . . . . . . . 42 42 10.5 Newton’s Method . . . . . . . . 10.5.1 The Newton Decrement 10.5.2 Newton’s Method . . . . 10.5.3 Convergence Analysis . 10.5.4 Summary . . . . . . . . . . . . . . . . . . . . . . . . . . . . . . . . . . . . . . . . . . . . . . . . . . . . . . 42 43 43 43 44 10.6 Self-Concordant Functions . . . . . . . . . . . . . . . . . . . . . . . . . . . . . . . . . . . . . . . . 44 4 . . . . . . . . . . . . . . . . . . . . . . . . . . . . . . . . . . . . . . . . . . . . . . . . . . . . . . . . . . . . . . . . . . . . . . . . . . . . . . . . . . . . . . . . . . . . . . . . . . . . . . . . . . . . . . . . . . . . . . . . . . . . . . . . . . . . . . . . . . . . 1 Introduction 2 Convex Sets This chapter introduces numerous convex sets. 2.1 Types of Sets 2.1.1 Affine Sets A set is affine when it contains any line that passes through any two points that belong to the set. Examples: • Hyperplanes • Solution set of linear equation systems. An affine combination is defined to be a linear combination where the coefficients sum up to 1. An affine set is closed under affine combination. 2.1.2 Convex Sets A set is convex when it contains any line segment that passes through any two points that belong to the set. A convex combination is defined to be an affine combination with nonnegative coefficients. A convex set is closed under convex combination. All affine sets are convex. 2.1.3 Cones A set is a cone when a nonnegative scalar multiple of any element belongs to the set. A cone feels like a ice-cream cone; it starts at the origin, and it gets wider going away from the origin. It could be analogous to a pie slice. Given an point in a cone, the cone will contain the ray ”half-lines) originating from the origin and going through the point. A conic combination is a linear combination with nonnegative coefficients. A convex cone is closed under conic combinations. 2.2 Important Sets • Hyperplane is affine. • Halfspaces are convex. • Polyhedra/polyhedron are intersections of halfspaces, so are convex. • Euclidean balls are defined by ||2 . They are convex. Elipsoids are related to balls, related by a positive definite matrix P . 5 2.2.1 Norm Balls / Norm Cones Given a norm, a norm ball replaces the L2 norm for Euclidean balls. A norm cone is a different beast; it is the set C = {(x, t) | kxk ≤ t, t ≥ 0} ∈ Rn+1 where x ∈ Rn . The norm cone with an L2 norm is called the second-order cone. 2.2.2 Positive Semidefinite Cone The following notations are used: • Sn is the set of all symmetric n × n matrices. • Sn+ is the set of all positive semidefinite n × n matrices. • Sn++ are positive definite. Because θ1 , θ2 ≥ 0, A, B ∈ Sn+ =⇒ θ1 A + θ2 B ∈ Sn+ the set is a convex cone. 2.3 Operations that Preserve Convexity Some functions preserve convex-ness of the set. • Intersections • Taking image under an affine function 2.3.1 Linear-fractional and Perspective Functions The perspective function P (z, t) = z/t preserves convexity. ”The domain needs that t > 0) Similarly, a linear-fractional function, f (x) = Ax + b cT x + b which is formed by combining the perspective function with an affine function, preserves convexity as well. 2.4 Generalized Inequalities A cone can be used to define inequalities, if it meets certain criteria. It goes like: x K y ⇐⇒ y − x ∈ K 6 where K is a cone. It certainly makes sense; since K contains any rays, we get transitivity. If K is pointed at the origin, we get asymmetry. Since K contains the origin, we get reflexivity. This is an useful concept that will be exploited later in the course a lot. 2.4.1 Positive Semidefinite Cone Actually, using the positive semidefinite cone to compare matrices is a standard practice so for the rest of the book, matrix inequalities are automatically done used PSD cone. 2.4.2 Minimum and minimal Elements Generalized inequalities do not always give you a single element that is the minimum; we sometimes get a class of elements that are not smaller than any other elements, and are incomparable to each other. 2.5 Supporting Hyperplane Theorem This has not proved to be useful in the course yet; when it is needed I will come back and fill it in... 2.6 Dual Cones Let K be a cone. Then the dual cone is that K ∗ = y|xT y ≥ 0 ∀x ∈ K The idea of it is hard to express intuitively. When the cone is sharp, the dual cone will be obstuse, and vice versa. Also, when K is a proper cone, K∗∗ = K. 2.6.1 Dual Generalized Inequality The relationship K∗ is a generalized inequality induced by the dual cone K∗. In some ways it can relate to the original inequality K . Most notably, x K y ⇐⇒ y − x ∈ K ⇐⇒ λT (y − x) ≥ 0 ⇐⇒ λT x ≤ λT y where λ is any element of K∗. The takeaway of this is that we can use dual cones to compare values with respect to the original cone. See below for how this is used. 2.6.2 Dual Generalized Inequality and Minimum/Minimal Elements Minimum Element From above, we can see x ∈ S will be a minimum element with respect to K, when it is a unique minimizer λT x for all λ ∈ K∗. Geometrically, when x is a minimum element, the hyperplane passing through x with λ as a normal vector z|λT (x − z) = 0 is a strict supporting hyperplane; it touches S only at x. To see this: say x 6= y ∈ S. Since λT x < λT y by our assumption, we have λT (y − z) > 0. Minimal Elements Here, we have a gap between necessary and sufficient conditions. Necessity If x is a minimizer of λT x for all λ ∈ K∗, x is a minimal element. Sufficiency Even if x is a minimal element, it is possible that x is not a minimizer of λT x for some λ ∈ K∗. 7 However, if S is convex, the two conditions are indeed equivalent. 3 Convex Functions 3.1 Basic Properties and Definitions A function f is convex if the domain is convex, and for any x, y ∈ domf and θ ∈ [0, 1] we have θ · f (x) + (1 − θ) · f (y) ≥ f (θx + (1 − θ) y) Colloquially, you can say the chord is above the curve . 3.1.1 Extended-value Extensions We can augment a function f : f˜ (x) = f (x) ∞ x ∈ domf otherwise which is called the extended-value extension of f . Care must be taken in ensuring the extension is still convex/concave: the extension can break such properties. 3.1.2 Equivalent Conditions The following conditions, paired with the domain being convex, is equivalent to convexity. First Order Condition T f (y) ≥ f (x) + ∇f (x) (y − x) Geometrically, you can explain this as the tangential hyperplane which meets a convex function at a certain point, it will be a global lower bound in the entire domain. It has outstanding consequences; by examining a single point, we get information about the entire function. Second Order Condition ∇2 f (x) 0 which says the Hessian is positive semidefinite. 3.1.3 Examples • ln x is concave on R++ • eax is convex on R • xa is convex on R++ if a ≥ 1, concave 0 ≤ a ≤ 1 • |x| is convex on R a • Negative entropy: x log x is convex on R++ 8 • Norms: every norm is convex on Rn • Max functions: max {x1 , x2, x3 , · · · } is convex in Rn • Quadratic-over-linear: x2 /y is convex in {y > 0} • Log-sum-exp: as a soft approximation of the max function, f (x) = log ( • Geometric mean: ( Qn i=1 xi ) 1/n is concave on Rn++ P exi ) is convex on Rn . • Log-determinant: log det X is convex on positive definite X. 3.1.4 Epigraph An epigraph for a function f : Rn → R is a set of points above the graph. Naturally, it’s a subset of Rn+1 and sometimes is an useful way to think about convex functions. A function is convex iff its epigraph is convex! 3.1.5 Jensen’s Inequality The definition of convex function extends to multiple, even infinite, sums: f as long as 3.2 P X X xi θi ≤ f (xi ) θi θ = 1. This can be used to prove a swath of other inequalities. Operations That Preserve Convexity • Nonnegative weighted sums • Composition with an affine mapping: if f is convex/concave, f (Ax + b) also is. • Pointwise maximum/supremum: f (x) = maxi fi (x) is convex if all fi are convex. This can be used to prove that: – Sum of k largest elements is convex: it’s the max of • Max eigenvalue of symmetric matrix is convex. n k combinations. • Minimization: g (x) = inf f (x, y) y∈C is convex if f is convex. You can prove this by using epigraphs – you are slicing the epigraph of g. • Perspective function 9 3.2.1 Composition Setup: h: Rk → R and g: Rn → Rk . The composition f (x) = h (g (x)). Then: • f is convex: – if h is convex and nondecreasing, and g is convex, or – if h is convex and nonincreasing, and g is concave • f is concave: – if h is concave and nondecreasing, and g is concave, or – if h is concave and nonincreasing, and g is convex To summarize: if h is nondecreasing, and h and g has same curvature ”convexity/concavity), f follows. If h is nonincreasing, and h and g have differing curvature, f follows h. When determining nonincreasing/nondecreasing property of h, use its extended-value extension. Since extended-value extension can break nonincreasing/nondecreasing properties, you might want to come up with alternative definitions which are defined everywhere. Composition Examples • exp g (x) is convex if g is. • log g (x) is concave if g is concave and positive. • 1 g(x) is convex if g is positive and concave. • g (x) is convex if p ≥ 1 and g is convex and nonnegative. p Vector Composition If f (x) = h (g1 (x) , g2 (x) , g3 (x) , · · · ) the above rules still hold, except: • All gs need to have the same curvature. • h need to be nonincreasing/nondecreasing with respect to every input. 3.3 The Conjugate Function Given an f : Rn → R, the function f ∗: Rn → R is the conjugate: f ∗ (y) = sup x∈domf y T x − f (x) It is closely related to Lagrange Duals. I will omit further materials on this. 10 3.4 Quasiconvex Functions Quasiconvex functions are defined by having all its sublevel sets convex. Colloquially, they are unimodal functions. Quasiconvex functions are solved by bisection method + solving feasibility problems. The linear-fractional function f (x) = aT x + b cT x + b is quasiconvex. ”Can prove: let f (x) = α and try to come up with the definition of the sublevel set.) Remember how we solved this by bisection methods? :-) 3.4.1 Properties • First-order condition: f (y) ≤ f (x) =⇒ ∇f (x) (y − x) ≤ 0. Note: the gradient defines a supporting T hyperplane. Since f is quasiconvex, all points y with f (y) ≤ f (x) must lie in one side of the hyperplane. • Second-order condition: f ′′ (x) ≥ 0 3.4.2 Operations That Preserve Quasiconvexity • Nonnegative weighted sum • Composition: if h is nondecreasing and g is quasiconvex, then h (g (x)) is quasiconvex. • Composition with affine/linear fractional transformation. • Minimization along an axis: g (x) = miny f (x, y) is quasiconvex if f is. 3.5 Log-concavity and Log-convexity The function is log-concave or log-convex if its log is concave/convex. • The pdf of a Gaussian distribution is log-concave. • The gamma function is log-concave. 4 Convex Optimization Problems 4.1 Optimization Problems A typical optimization problem formulation looks like: minimize f0 (x) subject to fi (x) ≤ 0 (i = 1, · · · , m) hi (x) = 0 (i = 1, · · · , p) 4.1.1 Feasibility Problem There are cases where you want to find a single x which satisfies all equality and inequality constraints. These are feasibility problems. 11 4.1.2 Transformations and Equivalent Problems Each problem can have multiple representations which are same in nature but expressed differently. Different expression can have different properties. • Nonzero equivalence constraints: move everything to LHS. • Minimization/maximization: flip signs. • Transformation of objective/constraint function: transforming objective functions through monotonic functions can yield an equivalent problem. • Slack variables: f (x) ≤ 0 is swapped out by f (x) + s = 0 and s ≥ 0. • Swapping implicit/explicit constraint: move an implicit constraint to explicit, by using extended value extension. 4.2 Convex Optimization A convex optimization problem looks just like the above definition, but have a few differences: • All f s are convex. • All gs are affine. Thus, the set of equivalence constraints can be expressed by aTi x = bi thus Ax = b Note all convex optimization problems do not have any locally optimal points; all optimals are global. Also, another important property arises from them: the feasible set of a convex optimization problem is convex, because it is an intersection of convex and affine sets – a sublevel set of a convex function is convex, and the feasible set is an intersection of sublevel sets and an affine set. Another important thing to note is that convexity is a function of the problem description; different formulations can make a non-convex problem convex and vice versa. It’s one of the most important points of the course. 4.2.1 Optimality Conditions If the objective function f0 is differentiable, x is the unique optimal solution if for all feasible y, we have T ∇f0 (x) (y − x) ≥ 0 this comes trivially from the first order condition of a quasiconvex function ”a convex function is always quasiconvex). Optimality conditions for some special ”mostly trivial) cases of problems are discussed: • Unconstrained problem: Set gradient to 0. • Only equality constraint: We can derive the below from the general optimality condition described above. ∇f0 (x) + AT ν = 0 (ν ∈ Rp ) Here’s a brief outline: for any feasible y, we need to have ∇f0 (x) (y − x) ≥ 0. Note that y − x ∈ N (A) ⊥ ”the null space) because Ax = b = Ay =⇒ A (x − y) = 0. Now, this means ∇f0 (x) ∈ N (A) = R AT , T the last term being the column space of AT . Now, we can let 12 ∇f0 (x) = AT (−ν) for some ν and we are done. • Minimize over nonnegative orthant: for each i, we need to have ∇f (x) = 0 0 i ∇f (x) ≥ 0 0 i if xi > 0 if xi = 0 This is both intuitive, and relates to a concept ”KKT conditions) which is discussed later. If xi is at the boundary, it can have some positive gradient along that axis; we can still be optimal because decreasing xi will make it infeasible. Otherwise, we need to have zero gradients. 4.2.2 Equivalent Convex Problems Just like what we discussed for general optimization problems, but specially for convex problems. • Eliminating affine constraint: Ax = b is equivalent to x ∈ F z + x0 where the column space of F is N (A) and x0 is a particular solution of Ax = b. So we can just put f0 (F z + x0 ) in place of f0 (x). • Uneliminating affine constraint: going in the opposite direction; if we are dealing with f0 (Ai x + bi ), let Ai x + bi = yi . – On eliminating/uneliminating affine constraint: on a naive view, eliminating affine constraint always seem like a good idea. However, it isn’t so; it is usually better to keep the affine constraint, and only do the elimination if it is immediately computationally advantageous. ”This will be discussed later in the course.. but I don’t remember where) • Slack variables • Epigraph form: minimize t subject to f0 (x) − t ≤ 0 is effectively minimizing f0 (x). This seems stupid, but this gives us a convenient framework, because we can make objectives linear. 4.3 Quasiconvex Optimization When the objective function is quasiconvex, it is called a quasiconvex optimization problem. The biggest difference is that we will now have local optimal points; quasiconvex functions are allowed to have flat portions which give rise to local optimal points. 4.3.1 Solving Quasiconvex Optimization Problems Quasiconvex optimization problems are solved by bisection methods; at each iteration we ask if the sublevel set empty for given threshold. We can solve this by a convex feasibility problem. 13 4.3.2 Example: Convex over Concave Say p (x) is convex, q (x) is concave. Then f (x) = p (x) /q (x) is quasiconvex! How do you know? Consider the sublevel set: {x : f (x) ≤ t} = {x : p (x) /q (x) ≤ t} = {x : p (x) − t · q (x) ≤ 0} and p (x) − t · q (x) is convex! So the sublevel sets are convex. 4.4 Linear Optimization Problems In an LP problem, objectives and constraints are all affine functions. LP algorithms are very, very advanced and all these problems are readily solvable in today’s computers. It is a very mature technology. 4.4.1 Examples • Chebyshev Center of a Polyhedron: note that the ball lying inside a halfplane aTi x ≤ bi can be represented as kuk2 ≤ r =⇒ aTi (xc + u) ≤ bi Since sup aTi u = r kai k2 kuk2 ≤r we can rewrite the constraint as aTi xc + r kai k2 ≤ bi which is a linear constraint on xc and r. Therefore, having this inequality constraint for all sides of the polyhedron gives a LP problem. • Piecewise-linear minimization. Minimize: max aTi x + bi i This is equivalent to LP: minimize t subject to aTi x + bi ≤ t! This can be a quick, dirty, cheap way to solve convex optimization problems. 4.4.2 Linear-fractional Programming If the objective is linear-fractional, while the constraints are affine, it becomes a LFP problem. This is a quasiconvex problem, but it can also be translated into a LP problem. I will skip the formulation here. 14 4.5 Quadratic Optimization QP is a special kind of convex optimization where the objective is a convex quadratic function, and the constraint functions are affine. 1 minimize xT P x + q T x + r 2 subject to Gx h Ax = b and P ∈ Sn+ . When the inequality constraint is quadratic as well, it becomes a QCQP ”Quadratically Con- strainted Quadratic Programming) problem. 4.5.1 Examples • Least squares: needs no more introduction. When linear inequality constraints are added, it is no longer analytically solvable, but still is very tractable. • Isotonic regression: we add the following constraint to a least squares algorithm: x1 ≤ x2 ≤ · · · ≤ xn . This is still very easy in QP! • Distance between polyhedra: Minimizing Euclidean distance is a QP problem, and the constraints ”two polyhedras) are convex. • Classic Markowitz Portfolio Optimization – Given an expected return vector p¯ and the covariance matrix Σ, find the minimum variance portfolio with expected return greater than, or equal to, rmin . This is trivially representable in QP. – Many extensions are possible; allow short positions, transaction costs, etc. 4.5.2 Second Order Cone Programming SOCP is closely related to QP. It has a linear objective, but a second-order cone inequality constraint: minimize f T x subject to |Ai x + bi |2 ≤ cTi x + di Fx = g The inequality constraint forces the tuple Ai x + bi , cTi + di to lie in the second-order cone in Rn+1 . When ci = 0 for all i, we can make them regular quadratic constraints and this becomes a QCQP. So basically, using a second-order cone instead of a ”possibly open) polyhedra in LP. t. Note that the linear objective does not make SOCP weaker than QCQP. You can minimize t where f0 (x) ≤ 15 4.5.3 SOCP: Robust Linear Programming Suppose we have a LP minimize cT x subject to aTi x ≤ bi but the numbers given in the problem could be inaccurate. As an example, let’s just assume that the true value of ai can lie in a ellipsoid defined by Pi , centered at the given value: ai ∈ E = {a¯i + Pi u| kuk2 ≤ 1} and other values (c and bi ) are fixed. We want the inequalities to hold for all possible value of a. The inequality constraint can be cast as sup (a¯i + Pi u) = a¯i T x + PiT x2 ≤ bi kuk2 ≤1 which is actually a SOCP constraint. Note that the additional norm term PiT x2 acts as a regularization term; they prevent x from being large in directions with considerable uncertainty in the parameters ai . 4.5.4 SOCP: Stochastic Inequality Constraints When ai are normally distributed vectors with mean a¯i and covariance matrix Σi , the following constraint P aTi x ≤ bi ≥ η says that a linear inequality constraint will hold with a probability of η or better. This can be cast as a SOCP constraint as well. Since x will be concrete numbers, we can say aTi x ∼ n u¯i , σ 2 . Then P aTi x ≤ bi = P ui − u¯i bi − u¯i ≤ σ σ =P Z≤ bi − u¯i σ ≥ η ⇐⇒ Φ bi − u ¯i σ ≥ η ⇐⇒ bi − µ¯i ≥ Φ−1 (η) σ The last condition can be rephrased as 1/2 a¯i T x + Φ−1 (η) Σi x ≤ bi 2 which is a SOCP constraint. 4.6 Geometric Programming Geometric programming problems involve products of powers of variables, not weighted sums of variables. 4.6.1 Monomials and Posynomials A monomial function f is a product of powers of variables in the form 16 f (x) = cxa1 1 xa2 2 · · · xann where c > 0. A sum of monomials are called a posynomial; which looks like f (x) = K X k ck xa1 1k xa2 2k · · · xannk 4.6.2 Geometric Programming A GP problem looks like: minimize f0 (x) subject to fi (x) ≤ 1 (i = 1, 2, 3, · · · , m) hi (x) = 1 (i = 1, 2, 3, · · · , p) where f are posynomials and h are monomials. The domain of this problem is Rn++ . 4.6.3 Convex Transformation GP problems are not convex in general, but a change of variables will turn a GP into a convex optimization problem. Letting yi = log xi ⇐⇒ xi = eyi yields a monomial f (x) to f (x1 , x2 , x3 , · · · ) = f (ey1 , ey2 , ey3 , · · · ) = c · e a 1 y1 · e a 2 y 2 · e a 3 y3 · · · = exp aT y + b which is now an exponential of affine function. Similarly, a posynomial will be converted into a sum of exponentials of affine functions. Now, taking log of the objective and the constraints. The posynomials turn into log-sum-exp ”which are convex), the monomials will be become affine. Thus, this is our regular convex problem now. 4.7 Generalized Inequality Constraints 4.7.1 Conic Form Problems Conic form problem is a generalization of LP, replacing componentwise inequality with generalized linear inequality with a cone K. minimize cT x subject to F x + g K 0 Ax = b 17 The SOCP can be expressed as a conic form problem if we set Ki to be a second-order cone in Rni +1 : minimize cT x subject to − Ai x + bi , cTi x + di Ki 0 (i = 1, · · · , m) Fx = g from which the name of SOCP comes. 4.7.2 SDP: Semidefinite Programming A special form of conic program, where K is Sn+ , which is the set of positive semidefinite matrices, is called a SDP. It has the form: minimize cT x subject to x1 F1 + x2 F2 + · · · + xn Fn 0 Ax = b 4.8 Vector Optimization We can generalize the regular convex optimization by letting the objective function take vector values; we can now use proper cones and generalized inequalities to find the best vector value. These are called vector optimization problems. 4.8.1 Optimal Values When a point x∗ is better or equal to than every other point in the domain of the problem, x∗ is called the optimal. In a vector optimization problem, if an optimal exists, it is unique. ”Why? Vector optimization requires a proper cone; proper cones are pointed – they do not contain lines. However, if x1 and x2 are both optimal, p = x1 − x2 and −p are both in the cone, making it improper.) 4.8.2 Pareto Optimality In many problems we do not have a minimum value achievable, but a set of minimal values. They are incomparable to each other. A point x ∈ D is pareto-optimal when for all y that f0 (y) K f0 (x) implies f0 (y) = f0 (x). Note that there can be multiple values with the same minimal value. Note that every pareto value has to lie on the boundary of the set of achievable values. 4.8.3 Scalarization for Pareto Optimality A standard technique for finding pareto optimal points is to scalarize vector objectives by taking a weighted sum. This can be explained in terms of dual generalized inequality. Pick any λ ∈ K∗ and solve the following problem: 18 minimize λT f0 (x) subject to fi (x) ≤ 0 hi (x) = 0 By what we discussed in 2.6.2, a pareto optimal point must be a minimizer of this objective for any λ ∈ K∗. Now what happens when the problem is convex? Each λ with λ ≻K∗ 0 will likely give us a different pareto point. Note λ K∗ 0 might not give us such guarantee, some elements might not be pareto optimal. 4.8.4 Examples • Regularized linear regression tries to minimize RMSE and norm of the coefficient at the same time so we optimize kAx − bk2 + λxT x. Changing λ lets us explore all pareto optimal points. 2 5 Duality This chapter explores many important ideas. Duality is introduced and used as a tool to derive optimality conditions. KKT conditions are explained. 5.1 The Lagrangian And The Dual 5.1.1 The Lagrangian The Lagrangian L associated with a convex optimization problem minimize f0 (x) subject to fi (x) ≤ 0 (i = 1, · · · , m) hi (x) = 0 (i = 1, · · · , p) is a function taking x and the weights as input, and returning a weighted sum of the objective and constraints: L (x, λ, ν) = f0 (x) + m X λi fi (x) + i=1 p X νi hi (x) i=1 So positive values of fi (x) are going to penalize the objective function. The weights are called dual variables or Lagrangian multiplier vectors. 5.1.2 The Lagrangian Dual Function The Lagrangian dual function takes λ and ν, and minimizes L over all possible x. g (λ, ν) = inf L (x, λ, ν) = inf x∈D x∈D f0 (x) + m X i=1 19 λi fi (x) + p X i=1 νi hi (x) ! 5.1.3 Lagrangian Dual and Lower Bounds It is easy to see that for any elementwise positive λ, the Lagrangian dual function provides a lower bound on the optimal value p∗ of the original problem. This is very easy to see; if x is any feasible point, the dual function value is the sum of ”possibly suboptimal) value p; if xp is the feasible optimal point, we have negative values of fi (i ≥ 1) and zeros for hi . Then, g (λ, ν) = inf L (x, λ, ν) ≤ L (xp , λ, ν) ≤ f (xp ) = p∗ x∈D 5.1.4 Intuitions Behind Lagrangian Dual An alternative way to express constraints is to introduce indicator functions in the objectives: minimize f0 (x) + m X I− (fi (x)) + i=1 p X I0 (hi (x)) i=1 the indicator functions will have a value of 0 when the constraint is met, ∞ otherwise. Now, these represent how much you are irritated by a violated constraint. We can replace them with a linear function - just a different set of preferences. Instead of hard constraints, we are imposing soft constraints. 5.1.5 LP example and Finite Dual Conditions A linear program’s lagrange dual function is g (λ, ν) = inf L (x, λ, ν) = −bT ν + inf c + AT ν − λ x x T x The dual value can be found analytically, since it is a affine function of x. Whenever any element of c + AT ν − λ is nonzero, we can manipulate x to make the dual value −∞. So it is finite only on a line where c + AT ν − λ = 0, which is a surprisingly common occurrence. 5.1.6 Conjugate Functions and Lagrange Dual The two functions are closely related, and Lagrangian dual can be expressed in terms of the conjugate function of the objective function, which makes duals easier to derive if the conjugate is readily known. 5.2 The Lagrange Dual Problem There’s one more thing which is named Lagrangian: the dual problem. The dual problem is the optimization problem maximize g (λ, ν) subject to λ 0 A pair of (λ, ν) is called dual feasible if it is a feasible point of this problem. The solution of this problem, (λ∗, ν∗) is called dual optimal or optimal Lagrange multipliers. The dual problem is always convex; whether or not the primal problem is convex. Why? g is a pointwise infimum of affine functions of λ and ν. Note the langrange dual for many problems were bounded only for a subset of the domain. We can bake this restriction into the problem explicitly, as a constraint. 20 5.2.1 Duality Gap Langrangian dual’s solution d∗ are related to the solution of the primal problem p∗, notably: d∗ ≤ p∗ Regardless of the original problem being convex. When the inequality is not strict, this is called a weak duality. The difference p ∗ −d∗ is called the duality gap. Duality can be used to provide lower bound of the primal p roblem. 5.2.2 Strong Duality And Slater’s Constraint Qualification When the duality gap is 0, we say strong duality holds for the problem. That means the lower bound obtained from the dual equals to the optimal solution of the problem; therefore solving the dual is ”sort of) same as solving the primal. For obvious reasons, strong duality is very desirable but it doesn’t hold in general. But for convex problems, we usually ”but not always) have strong duality. Given a convex problem, how do we know if strong duality holds? There are many qualifications, which ensures strong duality if the qualifications are satisfied. The text discusses one such qualification; Slater’s constraint qualification. The condition is quiet simple: if there exists x ∈ relintD such that all inequality conditions are strictly held, we have strong duality. Put another way: fi (x) < 0 (i = 0, 1, 2, · · · ) , Ax = b Also, it is noted that affine inequality constraints are allowed to held weakly. 5.2.3 Examples • Least-squares: since there are no infeasibility constraints, Slater’s condition just equals feasibility: so as long as the primal problem is feasible, strong duality holds. • QCQP: The Lagrangian is a quadratic form. When all λs are nonnegative, we have a positive semidefinite form and we can solve minimization over x analytically. • Nonconvex example: Minimizing a nonconvex quadratic function over the unit ball has strong duality. 5.3 Geometric Interpretation This section introduces some ways to think about Lagrange dual functions, which offer some intuition about why Slater’s condition works, and why most convex problems have strong duality. 5.3.1 Strong Duality of Convex Problems Let’s try to explain figure 5.3 to 5.5 from the book. Consider following set G: G = {(f1 (x) , · · · , fm (x) , h1 (x) , · · · , hp (x) , f0 (x)) |x ∈ D} = {(u, v, t) |x ∈ D} Note ui = fi (x), vi = gi (x) and t = f0 (x). Now the Lagrangian of this problem 21 L (λ, ν, x) = X λi ui + X ν i vi + t can be interpreted as a hyperplane passing through x with normal vector (λ, ν, 1)1 and that hyperplane will meet t-axis at the value of the Lagrangian. ”See figure 5.3 from the book.) Now, the Lagrange dual function g (λ, ν) = inf L (λ, ν, x) x∈D will find x in the border of D: intuitively, the Lagrangian can still be decreased by wiggling x if x ∈ relintD. Therefore, the value of the Lagrange dual function can now be interpreted as a supporting hyperplane with normal vector (λ, ν, 1). Next, we solve the Lagrange dual problem which maximizes the position where the hyperplane hits the t-axis. Can we hit p∗, the optimal value? When G is convex, the feasible portion of G ”i.e. u 0 and ν = 0) is convex again, and we can find a supporting hyperplane that meets G at the optimal point! But when G is not, p∗ can hide in a nook inside G and the supporting hyperplane might not meet p∗ at all. 5.4 Optimality Conditions 5.4.1 Certificate of Suboptimality and Stopping Criteria We know, without assuming strong duality, g (λ, ν) ≤ p⋆ ≤ f0 (x) Now, f0 (x) − g (λ, ν) gives a upper bound on f0 (x) − p⋆, the quantity which shows how suboptimal x is. This gives us a stopping criteria for iterative algorithms; when f0 (x) − g (λ, ν) ≤ ǫ, it is a certificate that x is less than ǫ suboptimal. The quantity will never drop below the duality gap, so if you want this to work for arbitrarily small ǫ we would need strong duality. 5.4.2 Complementary Slackness Suppose the primal and dual optimal values are attained and equal. Then, f0 (x⋆ ) = g (λ⋆ , ν ⋆ ) X X = inf f0 (x) + λi fi (x) + νi hi (x) x X X ≤ f0 (x⋆ ) + λi fi (x⋆ ) + νi hi (x⋆ ) ≤ f0 (x⋆ ) ”assumed 0 duality gap) ”definition of Lagrangian dual function) ”taking infimum is less than or equal to any x) ”λ⋆i are nonnegative, fi values are nonpositive and hi values are 0) So all inequalities can be replaced by equalities! In particular, it means two things. First, x⋆ minimizes the Lagrangian. Next, X λ⋆i fi (x⋆ ) = 0 Since each term in this sum is nonpositive, we can conclude all terms are 0: so for all i ∈ [1, m] we have: 1 Yep, there are some notation abusing here since λ and ν themselves are vectors. 22 λ⋆ = 0 i either f (x⋆ ) = 0 i This condition is called complementary slackness. 5.4.3 KKT Optimality Conditions KKT is a set of conditions for a tuple (x⋆ , λ⋆ , ν ⋆ ) which are primal and dual feasible. It is a necessary condition for x∗ and (λ∗, ν∗) being optimal points for their respective problems with zero duality gap. That is, all optimal points must satisfy these conditions. KKT condition is: • x⋆ is prime feasible: fi (x⋆ ) ≤ 0 for all i, hi (x⋆ ) = 0 for all i. • (λ⋆ , ν ⋆ ) is dual feasible: λ⋆i ≥ 0 • Complementary slackness: λ⋆i fi (x⋆i ) = 0 • Gradient of Lagrangian disappears: ∇f0 (x⋆ ) + P λ⋆i ∇fi (x⋆ ) + P νi⋆ ∇hi (x⋆ ) = 0 Note the last condition is something we didn’t see before. It makes intuitive sense though - the optimal point for the dual problem must minimize the Lagrangian. Since the primal problem is convex, the Lagrangian is convex - and the only point with 0 gradient is the minimum. KKT and Convex Problems When the primal problem is convex, KKT condition is necessary-sufficient for optimality. This has immense importance. We can frame solving convex optimization problems by solving KKT conditions. Sometimes KKT condition might be solvable analytically, giving us closed form solution for the optimization problem. The text also mentions that when Slater’s condition is satisfied for a convex problem, we can say that arbitrary x is primal optimal iff there are (λ, ν) that satisfies KKT along with x. I actually am not sure about why Slater’s condition is needed for this claim but the lecture doesn’t make a big deal out of it, so meh.. 5.5 Solving The Primal Problem via The Dual When we have strong duality and dual problem is easier to solve”due to some exploitable structure or analytical solution), one might solve the dual first to find the dual optimal point (λ⋆ , ν ⋆ ) and find the x that minimizes the Lagrangian. If this x is feasible, we have a solution! Otherwise, what do we do? If the Lagrangian is strictly convex, then there is a unique minimum: if this minimum is infeasible, then we conclude the primal optimal is unattainable. 5.6 Sensitivity Analysis The Lagrange multipliers for the dual problem can be used to infer the sensitivity of the optimal value with respect to perturbations of the constraints. What kind of perterbations? We can tighten or relax constraints for an arbitrary optimization problem, by changing the constraints to: 23 f (x) ≤ u i i h (x) = v i (i = 1, 2, · · · , m) (i = 1, 2, · · · , p) i Letting ui > 0 means we have more freedom regarding the value of fi ; ui < 0 otherwise. 5.6.1 Global Sensitivity The Lagrange multipliers will give you information about how the optimal value will change when we do this. Let’s denote the optimal value of the perturbed problem as a function of u and v: p⋆ (u, v). We have a lower bound for this value when strong duality holds: f0 (x) ≥ p⋆ (0, 0) − λ⋆T u − ν ⋆T v which can be obtained by manipulating the definitions. Using this lower bound, we can make some inferences about how f0 (x) will change with respect to u and v. Basically, when lower bound increases greatly, we make an inference the optimal value will increase greatly. However, when lower bound decreases, we don’t have such an assurance2 . Examples: • When λ⋆i is large, and we tighten the constraint (ui < 0), this will increase the lower bound a lot; the optimal value will increase greatly. • When λ⋆i is is small, and we loosen the constraint (ui > 0), this will decrease the lower bound a bit, but this might not decrease the optimal value a lot. 5.6.2 Local Sensitivity The text shows an interesting identity: λ⋆i = − ∂p⋆ (0, 0) ∂ui Now, λ⋆i gives you the slope of the optimal value with respect to the particular constraint. All these, along with complementary slackness, can be used to interpret Lagrange multipliers; they tell you how tight a given inequality constraint is. Suppose we found that λ⋆1 = 0.1, and λ⋆2 = 100 after solving a problem. By complementary slackness, we know f1 (x⋆ ) = f2 (x⋆ ) = 0 and they are both tight. However, when we do decrease u2 , we know p⋆ will move much more abruptly, because of the slope interpretation above. On the other hand, what happens when we increase u2 ? Locally we know p⋆ will start to decrease fast; but it doesn’t tell us how it will behave when we keep increasing u2 . 5.7 Examples and Reformulating Problems As different formulations can change convex problems to non-convex and vice versa, dual problems are affected by how the problem is exactly formulated. Because of this, a problem that looks unnecessarily complicated might end up to be a better representation. The text gives some examples of this. 2 Actually I’m a bit curious regarding this as well - lower bound increasing might not increase the optimal value when optimal value was well above the lower bound to begin with. 24 5.7.1 Introducing variables 5.7.2 Making explicit constraints implicit 5.7.3 Transforming the objective 5.8 Generalized Inequailities How does the idea of Lagrangian dual extend to problems with vector inequalities? Well, it generalizes pretty well - we can define everything pretty similarly. Except how the nonnegative restriction for λ becomes a nonnegative restriction with dual cone. Here are some intuition behind this difference. Say we have the following problem: minimize f0 (x) s.t. fi (x) Ki 0 hi (x) = 0 (i = 1, 2, · · · , m) (i = 1, 2, · · · , p) Now the Lagrangian multiplier λ is vector valued. The Lagrangian becomes: f0 (x) + X λTi fi (x) + X νi hi (x) fi (x) is nonpositive with respect to Ki means that −fi (x) ∈ Ki . Remember we want each product (x) to be nonpositive - otherwise this dual won’t be a lower bound anymore. Now we try to find the set of λ that makes λT y negative for all −y ∈ K. We will need to make λT y positive for all y ∈ K. What is λTi fi this set? The dual cone. The dual of SDP is also given as an example. The actual derivation involves more linear algebra than I am comfortable with ”shameful) so I’m skipping things here. 6 Approximation and Fitting With this chapter begins part II of the book on applications of convex optimization. Hopefully, I will be less confused/frustrated by materials in this part. :-) 6.1 Norm Approximation This section discusses various forms of the linear approximation problem: minx |Ax − b| with different norms and constraints. Without doubt, this is one of the most important optimization problems. 6.1.1 Examples • ℓ2 norm: we get least squares. • ℓ∞ norm: Chebyshev approximation problem. Reduces to an LP which is as easy as least squares, but no one discusses it! 25 • ℓ1 norm: Sum of absolute residuals norm. Also reduces to LP, extremely interesting, as we will discuss further in this chapter. 6.1.2 Different Penalty Functions and Their Consequences The shape of the norm used in the approximation affects the results tremendously. The most common norms are ℓp norms - given a residual vector r, X i |ri | p !1/p We can ignore the powering by 1/p and just minimize the base of the exponentiation. Now we can think of ℓp norms giving separate penalties to each of the residual vector. Note that most norms do the same - so we can think in terms of a penalty function φ (r) when we think about norms. The text examines a few notable penalty functions: • Linear: sum of absolute values; associated with ℓ1 norm. • Quadratic: sum of squared errors; associated with ℓ2 norm. • Deadzone-linear: zero penalty for small enough residuals; grows linearly after the barrier. • Log-barrier: grows infinitely as we get near the preset barrier. Now how does these affect our solution? The penalty function measures our level of irritation with regard to the residual. When φ (r) grows rapidly as r becomes large, we are immensly irritated. When φ (r) shrinks rapidly as r becomes small, we don’t care as much. This simple description actually explains the stark difference between ℓ1 and ℓ2 norms. With a ℓ1 norm, the slope of the penalty does not change when the residual gets smaller. Therefore, we still have enough urge to shrink the residual until it becomes 0. On the other hand, with a ℓ2 norm the penalty will quickly get smaller when the residual gets smaller than 1. Now, once we go below 1, we do not have as much motivation to shrink it further - the penalty does not decrease as much. What happens when the residual is large? Then, ℓ1 is actually less irritated by ℓ2 ; the penalty grows much more rapidly. These explanations let us predict how the residuals from both penalty functions will be distributed. ℓ1 will give us a lot of zeros, and a handful of very large residuals. ℓ2 will only have a very small number of large residuals; and it won’t have as many zeros - many residuals will be near zero, but not exactly. The figures in the text confirms this theory. This actually was one of the most valuable intuitions I got out of this course. Awesome. Another little gem discussed in the lecture is that, contrary to the classic approach to fitting problems, the actual algorithms that find the x are not your tools anymore - they are standard now. The penalty function is your tool - you shape your problem to fit your actual needs. This is a very interesting, and at the same time very powerful perspective! 6.1.3 Outliers and Robustness Different penalty functions behave differently when outliers are present. As we can guess, quadratic loss functions are affected much worse than linear losses. When a penalty function is not sensitive to outliers, it is called robust. Linear loss function is an obvious example of this. The text introduces another robust penalty function, which is the Huber penalty function. It is a hybrid between quadratic and linear losses. 26 φhub (u) = u2 (|u| < M ) M (2 |u| − M ) otherwise Huber function grows linearly after the preset barrier. It is the closest thing to a constant-beyondbarrier loss function, without losing convexity. When all the residuals are small, we get the exact least square results - but if there are large residuals, we don’t go nuts with it. It is said in the lecture that 80% of all applications of linear regression could benefit from this. A bold, but very interesting claim. 6.1.4 Least-norm Problems A closely related problem is least-norm problem which has the following form: minimize |x| subject to Ax = b which obviously is meaningful only when Ax = b is underdetermined. This can be cast as a norm approximation problem by noting that the solution space is given by a particular solution, and the null space of A. Let Z consist of column vectors that are basis for N (A), and we minimize: |x0 + Zu| Two concrete examples are discussed in the lecture. • If we use ℓ2 norm, we have a closed form solution using the KKT conditions. • If we use ℓ1 norm, it can be modeled as an LP. This approach is in vogue, say in last 10 years or so. We are now looking for a sparse x. 6.2 Regularized Approximations Regularization is a practice of minimizing the norm of the coefficient |x|, as well as the norm of the residual. It is a popular practice in multiple disciplines. Why do it? The text introduces a few examples. First of all, it can be a way to express our prior knowledge or preference towards smaller coefficients. There might be cases where our model is not a good approximation of reality when x gets larger. Personally, this made the most sense to me; it can be a way of taking variations/errors of the matrix A into account. For example, say we assume an error ∆ in our matrix A. So we are minimizing (A + ∆) x−b = Ax − b + ∆x; the error is multiplied by x! We don’t want a large x. 6.2.1 Bi-criterion Formulation Regularization can be cast as a bi-criterion problem, as we have two objectives to minimize. We can trace the optimal trade-off curve between the two objectives. On one end, where |x| = 0, we have Ax = 0 and the residual norm is |b|. At the other end, there can be multiple Pareto-optimal points which minimize |Ax − b|. ”When both norms are ℓ2 , it is unique) 27 6.2.2 Regularization The actual practice of regularization is more concrete than merely trying to minimize the two objectives; it is a scalarization method. We minimize |Ax − b| + γ |x| where γ is a problem parameter. ”Which, in practice, is typically set by cross validation or manual intervention) Practically, γ is the knobs we turn to solve the problem. Another common practice is taking the weighted sum of squared norms: 2 |Ax − b| + δ |x| 2 Note it is not obvious that the two problems sweep out the same tradeoff curve. ”They do, and you can find the mapping between γ and δ given a specific problem). The most prominent scheme is Tikhonov regularization/ridge regression. We minimize: 2 2 |Ax − b|2 + δ |x|2 which even has an analytic solution. The text also mentions a smoothing regularization scheme - the penalty is on Dx instead of x. D can change depending on your criteria of fitness of solutions. For example, if we want x to be smooth, we can roughly penalize its second derivative by setting D as the Toeplitz matrix: 1 −2 1 0 1 −2 D= 0 0 1 .. .. .. . . . 0 0 −2 .. . 0 0 0 0 1 .. . 0 .. . ··· · · · · · · .. . So that the elements of Dx are approximately the second derivatives (2xi − xi−1 − xi+1 ). 6.2.3 ℓ1 Regularization ℓ1 regularization is introduced as a heuristic for finding sparse solutions. We minimize: |Ax − b|2 + γ |x|1 The optimal tradeoff curve here can be an approximation of the optimal tradeoff curve between |Ax − b|2 and the cardinality cardx, which is the number of nonzero elements of x. ℓ1 regularization can be solved as a SOCP problem. 6.2.4 Signal Reconstruction Problem An important class of problem is introduced: signal reconstruction. There is an underlying signal x which is observed with some noise; resulting in corrupted observation. x is assumed to be smooth. What is the most plausible guess for the time series x? This can be cast as a bicriterion problem: first we want to minimize |ˆ x − xcor |2 where x ˆ is our guess and xcor is the corrupted observation. On the other hand, we think smooth x ˆ are more likely, so we minimize a penalization function: φ (ˆ x). Different penalization schemes are introduced, quadratic smoothing 28 and total variance smoothing. In short, they are ℓ2 and ℓ1 penalizers, respectively. When underlying process has some jumps, as you can expect, total variance smoothing preserves those jumps, while quadratic smoothing tries to smooth out the transition. Some more insights are shared in the lecture videos. Recall ℓ1 regularization gives you a small number of nonzero regularized terms. So if you are penalizing φ (ˆ x) = X |ˆ xi+1 − x ˆi | the first derivative is going to be sparse. What does the resulting function look like? Piecewise constant. Similarly, say we take the approximate second derivative |2ˆ xi − x ˆi−1 − x ˆi+1 |? We get piecewise linear! The theme goes on - if we take the third difference, we get piecewise quadratic ”actually, splines). 6.3 Robust Approximation How do we solve approximation when A is noisy? Let’s say, A = A¯ + U where A¯ represents the componentwise mean, and U represents the random component with zero mean. How do we handle this? The prevalent method is to ignore that A has possible errors. It is okay, as long as you do a posterior analysis on the method: try changing A by a small amount and try the approximation again, see how it changes. 6.3.1 Stochastic Formulation A reasonable formulation for an approximation problem is to minimize: minimize E kAx − bk This is untractable in general, but tractable in some special cases, including when we minimize the ℓ2 norm: minimize E kAx − bk2 2 Then: 2 ¯ − b + U x T Ax ¯ − b + Ux E kAx − bk2 = E Ax ¯ − b + ExT U T U x ¯ − b T Ax = Ax ¯ − b 2 + x T P x = Ax 2 2 2 1/2 ¯ − b + = Ax x P 2 2 Tada, we got Tikhonov regularization! This makes perfect sense - increasing magnitudes of x will increase the variation of Ax, which in turn increase the average value of kAx − bk by Jensen’s inequality. So ¯ − b small with making the variance small. This is a nice interpretation we are trying to balance making Ax for Tikhonov regularization as well. 29 6.3.2 Worst-case Robust Approximation Instead of taking expected value of the error, we can try to minimize the supremum of error across a set A consisting possible values of A. The text describes several types of A we can use to come up with explicit solutions. The following are those examples: • When A is a finite set • When A is mean plus U , where U is an error in a norm ball. • When each row of A is mean plus Pi , where Pi describes an ellipsoid of possible values. • more examples.. Worst-case robust least squares is mentioned in the lecture. This is not a convex problem, but it can be solved exactly. In fact, any optimization problem with two quadratic functions can be solved exactly ”see appendix of the book). 6.4 Function Fitting In a function fitting problem, we try to approximate an unknown function by a linear combination of basis functions. We determine the coefficient vector x which yields the following function: f (u) = X xi fi (u) where fi () is the i-th basis function. A typical basis function are powers of u: the possible set of f is the set of polynomials. You can use piecewise linear and polynomial functions; using piecewise polynomial will give you spline functions. 6.4.1 Constraints We can impose various constraints on the function being fitted. The text introduces some tractable set of constraints. P • Function value interpolation: the function value at a given point f (v) = xi fi (v) is a linear function of x. Therefore, equality constraints and inequality constraints are actually linear constraints. • Derivative constraints: the derivative value at a given point f (v) = of x. P xi ∇fi (v) is also a linear function 6.4.2 Sparse Descriptions and Basis Pursuit In basis pursuit problems, we want to find a sparse f out of a very large number of basis functions. By a sparse f , we mean there are a few nonzero entries in the coefficient vector x. Mathematically, this is equivalent to the regressor selection problem ”quite unsurprisingly), so the similar set of heuristics can be used. First, we can use ℓ1 regularization to approximate optimizing for cardx. 30 6.4.3 Checking Model Consistency The text introduces an interesting problem - given a set of data points, is there a convex function that satisfies all those data? Fortunately, recall the first order convexity condition from 3.1.2 - using this, ensuring the convexity of a function is as easy as finding the gradients at the data points so that the first order condition is satisfied. We want to find g1 , · · · , gm so that: yj ≥ yi + giT (uj − ui ) for any pair of i and j. Fitting Convex Function To The Data We can fit a convex function to the data by finding fitted values of y, and ensuring the above condition holds for the fitted values. Formally, solve: minimize (yi − yˆi ) 2 subject toˆ yj ≥ yˆi + giT (uj − ui ) for any pair of i, j This is a regular QP. Note the result of this problem is not a functional representation of the fitted function, as in regular regression problems. Rather, we get the value of the function - so it’s a point-value representation. Bounding Values Say we want to find out if a new data point is irregular or not - is it consistent with what we saw earlier? In other words, given a new unew , what is the range of values possible given the previous data? We can minimize/maximize for yˆnew subject to the first order constraint, to find the range. These problems are LP. 7 Statistical Estimation I was stuck in this chapter for too long. It’s time to finish this chapter no matter what. This chapter shows some example applications of convex optimization in statistical settings. 7.1 Parametric Distribution Estimation The first example is MLE fitting - the most obvious, but the most useful. We of course require the constraints on x to be convex optimization friendly. A linear model with IID noise is discussed: yi = aTi x + vi The MLE is of course xml = argmaxx l (x) = argmaxx log px (y) px (y) depends on the distribution of vi s. Different assumptions on this distribution leads to different fitting methods: • Gaussian noise gives you OLS 31 • Laplacian noise gives you ℓ1 regularized regression ”of course, Laplacian distribution has a sharp peak at 0, which equates to having high incentive to reduce residual when residual is really small) • Uniform noise Also note that we need to have log px (y) to be concave in x, not y: and exponential families of distribution meet this criteria. Also, in many cases, your natural choice of parameters might not yield a log likelihood function that is concave. Usually with a change of variables, we achieve this. Also, we discuss that these distributions are equivalent to different penalty schemes - as demonstrated by the equivalence of L2 with Gaussian, L1 with Laplacian. There are 1:1 correspondence. If you have a penalty function p (v), the corresponding distribution is ep(v) normalized! 7.1.1 Logistic Regression Example exp aT u+b We model p = S a u + b = 1+exp(aT u+b) where u are the explanatory variables, a and b are model parameters. Say we have n = q + m examples, the first q of them having yi = 1 and next m of them having yi = 0. T Then, the likelihood function has: q Y i=1 pi n Y i=q+1 (1 − pi ) Take log and plug in above equation for p and we get the following concave function: q X i=1 n X log 1 + exp aT ui + b aT ui + b − i=q+1 7.1.2 MAP Estimation MAP is the Bayes equivalent of MLE. The underlying philosophy is vastly different, but the optimization technicality remains more or less the same, except a term that describes the prior distribution. 7.2 Nonparameteric Distribution Estimation A nonparameteric distribution is one which we don’t have any closed formula for. So we will estimate a vector p where prob (x = αk ) = pk which lies in Rn . 7.2.1 Priors • Expected value of any function are just linear equality in terms of p, so we can express them easily. • The variance of the random variable is a concave function of p. Therefore, a lower bound on the variance can be expressed within the convex setting. • The entropy of X is a concave, so we can express the lower bound as well. • The KL-divergence between p and q is convex. So we can impose upper bound here. 32 7.2.2 Objectives • We can minimize/maximize expected values because they are affine to p. • We can find MLE because log likelihood for p in this setting is always concave. • We can find maximum entropy. • We can find minimum KL-divergence between p and q. 7.3 Optimal Detector Design And Hypothesis Testing I will only cover this section briefly. Problem setup: the parameter θ can take m values. For each value of θ, we have a nonparameteric distribution over n possible values α1 · · · αn . The probabilities can be represented by a matrix P = Rn×m . We call each θ a different hypothesis. We want to find which θ generated given sample. So the detector we want to design is a function from a sample to θ. We can create either deterministic or probabilistic detectors; like in game theory, introducing extra randomness can improve the detector in many ways. For a simple and convincing example; say we have a binary problem. Draw an ROC curve which shows the tradeoff between false positive and false negative errors. A deterministic detector might not be able to hit the sweet spot where pf n = pf p depending on the θs - but probabilistic detectors can. 7.4 Chebyshev and Chernoff Bounds 7.4.1 Chebyshev Bounds Chebyshev bounds give an upper bound on a probability of a set based on known quantities; many inequalities follow this form. For example, Markov’s inequality says: If X ∈ R+ has EX = µ then we have prob (X ≥ 1) ≤ µ. ”Of course, this inequality is completely useless when µ > 1 but that’s how all these inequalities are.) This section looks at cases where we can find such bounds using convex optimization. In this setup, our prior knowledge is represented as a pair of functions and their expected values. The set whose probability we want to find bounds for is given as C. We want something like: prob (X ∈ C) ≤ Ef (X) for some function f whose expectation we can take. The recipe is to concoct an f which is a linear combination of the prior knowledges. Then Ef (X) is simply a linear combination of the expectations. How do we ensure the EV is above prob (X ∈ C)? We can impose that f (x) ≥ 1C (x) pointwise, where 1C is an indicator function for C. We can now state the following problem: minimize X ai xi = Efi (X) xi = Ef (X) X subject tof (z) = xi fi (z) ≥ 1 if z ∈ C X f (z) = xi fi (z) ≥ 0 if z ∈ S\C X This is a convex optimization problem, since the constraints are convex. For example, the first constraint can be recast as 33 g1 (x) = 1 − inf f (z) < 0 z∈C which is surely convex. There is another formulation where we solve a case where the first two moments are specified; but I am omitting it. 7.4.2 Chernoff Bounds This section deals with Chernoff bounds, which has a different form, but the same concept. 7.5 Experiment Design We discuss various solutions to the experiment design problem as an application. The setup is as follows. We have a fixed menu of p different experiments which is represented by ai (1 ≤ i ≤ p). We will perform m experiments, each experiment taken from the menu. For each experiment, we get yi as the result which is yi = aTi x + wi where wi are independent unit Gaussian noise. The maximum likelihood estimate is of course given by least squares. Then, the associated error e = x ˆ − x has zero mean and has covariance matrix E: E = EeeT = X ai aTi How do we minimize E? What kind of metrics do we use? −1 7.5.1 Further Modeling First, this is an offline problem and we don’t actually care about the order we perform. So the only thing we care is that for each experiment on the menu, how many times do we perform it. So the optimization variables are a list of nonnegative integers mi which sum up to m. Of course, the above problem is combinatorially hard and we relax it a bit, by modeling what fraction of m do we run each experiments. Still, the objective E is a vector ”actually a matrix) so we need some scalarization scheme to minimize it. The text discusses some strategies including: • D-optimial design: minimize determinant of E. Since determinant is the volume of the box, we are in effect minimizing the volume of the confidence ellipsoid. • E-optimal design: we minimize the largest eigenvalue of E. Rationale: the diameter of the confidence ellipsoid is proportional to norm of the matrix. • A-optimal design: we minimize the trace. This is, effectively, minimizing the error squared. 8 Geometric Problems 8.1 Point-to-Set Distance A project of the point x0 to a closed set C is defined as the closest point in C that minimizes the distance from x0 . When C is closed and convex, and the norm is strictly convex ”e.g. Euclidean), we can prove the 34 projection is unique. When the set C is convex, finding the projection is a convex optimization problem. Some examples are discussed - planes, halfplanes, and a proper cone. Finding the separating hyperplane between a point and a convex set is discussed as well. When we use Euclidean norm, we have a geometric, intuitive way to find one - take x0 and its projection p (x0 ), and use ~ 0 ) − ~x and passes the mean of two points. However, for other norms, the hyperplane which is normal to p (x we have to construct such hyperplane using dual problem; if we find a particular Lagrangian multiplier for which the dual problem is feasible, we know that multiplier constitutes a separating hyperplane. 8.1.1 PCA Example Suppose the set C of m × n matrices with at most k rank. A projection of X0 onto C which minimizes the Euclidean norm is achieved by a truncated SVD - yes PCA! 8.2 Distance between Sets Distance between two convex sets is an convex optimization problem, of course. The dual of this problem can be interpreted as a problem finding a separating hyperplane between the two sets. The argument can be made: if strong duality holds, a positive distance implies an existence of a separating hyperplane. 8.3 Euclidean Distance and Angle Problems This section deals with problems where Euclidean distances and angles between vectors are constrained. Setup: n vectors in Rn , for which we assume their Euclidean lengths are known: li = kai k2 . Distance and angular constraints can be cast as a constraint on G, which is the Gram matrix of A which has ai as column vectors: G = AT A G will be our optimization variable; after the optimization we can back out the interested vectors by Cholesky factorization. This is a SDP since G is always positive semidefinite. 8.3.1 Expressing Constraints in Terms of G • Diagonal entries will give length squared: Gii = li2 • The distance between vector i and j dij can be written as: kai − aj k2 = li2 + lj2 − 2aTi aj which means Gij is an affine function of d2ij : Gij = 1/2 = li2 + lj2 − 2Gij li2 +lj2 −d2ij 2 1/2 This means range constraints on d2ij can be a pair of linear constraints on Gij . • Gij is an affine function of the correlation coefficient ρij . • Gij is also an affine function of cosine of the angle between two vectors: cos α. Since cos−1 is monotonic, we can use this to constrain the range of α. 35 8.3.2 Well-Condition Constraints The condition number of A, σ1 /σn , is a quasiconvex function of G. So we can impose a maximum value or try to minimize it using quasiconvex optimization. Two additional approaches to well-conditionness are discussed - dual basis and maximizing log det G . 8.3.3 Examples • When we only care about angles between vectors ”or correlations) we can set li = 1 for all i. • When we only care about distance between vectors, we can assume that the mean of the vectors are 0. This can be solved using the squared lengths as the optimization variable. Since Gij = li2 + lj2 − 2d2ij /2, we get: G = z1T + 1z T − D /2 which should be PSD ”zi = li2 ). 8.4 Extremal Volume Ellipsoids This section deals with problems which approximates given sets with ellipsoids. 8.4.1 Lowner-John Ellipsoid The LJ ellipsoid ǫlj for a set C is defined as the minimum-volume ellipsoid that contains C. This can be cast as a convex optimization problem, however is only tractable when C is tractable. ”Of course, C has an infinite number of points or whatever, it’s not going to be tractable..) We set our optimization variable A and b such that: εlj = {v| kAv + bk2 ≤ 1} The volume of the LJ ellipsoid is proportional to det A−1 , so that’s what we optimize for. We minimize: log det A−1 subject to supv∈C kAv + bk2 ≤ 1. As a trivial example, consider when C is a finite set of size m; then the constraints translate into m convex constraints on A and b. A notable feature of LJ ellipsoid is that its efficiency can be bounded; if you shrink an LJ ellipsoid by a factor or n ”the dimension), it is guaranteed to fit inside C ”of course, when C is bounded and has nonempty √ interior). So roughly we have a factor of n approximation. ”Argh.. the proof is tricky. Uses modified problem’s KKT conditions.) √ When the set is symmetric about a point x0 , the factor 1/n can be improved to 1/ n. 8.4.2 Maximum Volume Inscribed Ellipsoid A related problem tries to find the maximum volume ellipsoid which lies inside a bounded, convex set C with nonempty interrior. We use a different formulation of the ellipsoid now; it’s a forward projection of a unit ball. 36 ε = {Bu + d| kuk2 ≤ 1} Now its volume is proportional to det B. The constraint would be: sup IC (Bu + d) ≤ 0 kuk2 ≤1 Max Ellipsoid Inside A Polyhedron A polyhedron is described by a set of m linear inequalities: C = x|aTi x ≤ bi We can now optimize regarding B and d. We can translate the constraint as: sup IC (Bu + d) ≤ 0 ⇐⇒ kuk2 ≤1 which is a convex constraint on B and d. sup aTi (Bu + d) ≤ bi kuk2 ≤1 ⇐⇒ BaTi 2 + aTi d ≤ bi 8.4.3 Affine Invariance If T is an invertible matrix, it is stated that the transformed LJ ellipsoid will still cover the set C after transformation. It holds for maximum volume inscribed ellipsoid as well. 8.5 Centering 8.5.1 Chebychev Center Given a bounded, nonempty-interior set C ∈ Rn , a Chebychev centering problem finds a point where the depth is maximized, which is defined as: depth (x, C) = dist (x, Rn \C) So it’s a point which is farthest from the exterior of C. This is not always tractable; suppose C is defined as a set of convex inequalities fi (x) ≤ 0. Then, Chebychev center could be found by solving: maximize subject to R gi (x, R) ≤ 0 (i = 0, 1, · · · ) where gi is a pointwise maximum of fi (x + Ru) where kuk2 ≤ 1. Since fi is convex and x + Ru is affine in x and R, gi is a convex function. However, it’s hard to evaluate gi ; since we have to find a pointwise maximum of convex functions. Therefore, Chebychev center problem is feasible only for specific classes of C. For example, when C is a polyhedron. ”An LP can solve this case) 8.5.2 Maximum Volume Ellipsoid Center A generalization of Chebychev center is MVE center; the center of the maximum volume inscribed ellipsoid. When the MVE problem is solvable, MVE center is trivially attained. 37 8.5.3 Analytic Center An analytic center works with the logarithmic barrier − log x. If C is defined as fi (x) ≤ 0 for all i, the analytic center minimizes − X log (−fi (x)) i This makes sense; when x is feasible, the absolute value of fi (x) kind of denotes the margin between x and infeasible regions. Analytic center tries to maximize the product of those margins. The analytic center is not invariant under different representations of the same set C, obviously. 8.6 Classification This section deals with two sets of data {x1 , x2 , · · · , xN } and {y1 , y2 , · · · , yM }. We want to find a function f (x) such that f (xi ) > 0 and f (yi ) < 0. 8.6.1 Linear Discrimination Linear discrimination finds an affine function f (x) = aT x − b which satisfies the above requirements. Since these requirements are homogeneous in a and b, we can scale them arbitrarily so the following are satisfied: aT x − b ≥ 1 i aT y − b ≤ −1 i 8.6.2 Robust Linear Discrimination If two sets can be linearly discriminated, there will always be multiple functions that separate them. One way to choose among them is to maximize the minimum distance from the line to each sample; in other words, maximum margin or the thickest slab . This leads to the following problem: maximize t subject to aT xi − b ≥ t aT yi − b ≤ −t kak2 ≤ 1 Note the last requirement; we normalize a, since we will be able to arbitrarily increase t unless we normalize a. Support Vector Classifier When two sets cannot be linearly separated, we can relax the constraints f (xi ) > 1 and f (yi ) < −1 by rewriting them as: f (xi ) > 1 − ui , and f (yi ) < −1 + vi 38 where ui and vi are nonnegative. Those numbers can be interpreted as a measure of how much each constraint is violated. We can try to make these sparse by optimizing for the sum; this is an ℓ1 norm and u and v will ”hopefully) be sparse. Support Vector Machine The above are two approaches for robust linear discrimination. First tries to maximize the width of the slab. Second tries to minimize the number of misclassified points ”actually, it optimizes its proxy). We can consider the trade-off between the two. Note the width of the slab z| − 1 ≤ aT z − b ≤ 1 Can be calculated by the distance between the two hyperplanes aT z = b − 1 and aT z = b + 1. Let aT z1 = b − 1 and aT z2 = b + 1. aT (z1 − z2 ) = 2. It follows kz1 − z2 k2 = 2/ kak2 . Now we can solve the following multicriterion optimization problem: minimize kak2 + γ 1T u + 1T v subject to aT xi − b ≥ 1 − ui aT yi − b ≤ −1 + vi u 0, v 0 We have SVM! Logistic Regression Another way to do approximate linear discrimination is logistic regression. This should be very familiar now; the negative log likelihood function is convex. 8.6.3 Nonlinear Discrimination We can create nonlinear separation space by introducing quadratic and polynomial features. For polynomial discrimination, we can do a bisection on the degree to find the smallest polynomial that can separate the input. 8.7 Placement and Location Placement problem deals with n points in Rk , where some locations are given, and the rest of the problems are the optimization variables. The treatment is rather basic. In essense, • You can minimize the sum of distances between connected nodes when the distance metric is convex. • You can place upper bounds on distance between pairs of points, or lengths of certain paths. • When the underlying connectivity represents a DAG, you can also minimize the max distance from a source node to a sink node using a DP-like argument. 8.8 Floor Planning A floor planning tries to place a number of axis-aligned rectangles without overlaps, optimizing for the size of the bounding rectangle. This is a hard combinatorial optimization problem in general, but specifying 39 relative positioning of the boxes can make these problems convex. A relative positioning constraint gives how individual pairs of rectangles are positioned. For example, rectangle i must be either above, below, left to, right to rectangle j. These can be cast as linear inequalities. For example, we can specify that rectangle i is left to rectangle j by specifying: xi + w i ≤ xj Some other constraints we can use: • Minimum area for each rectangle • Aspect ratio constraints are simple linear ”in)equalities. • Alignment constraints: for example, two rectangles are centered at the same line • Symmetry constraints • Distance constraints: given relative positioning constraints, ℓ1 or ℓ∞ constraints can be cast pretty easily. Optimizing for the area of the bounding box gives you a geometric programming problem. 9 Numerical Linear Algebra Background 10 Unconstrained Optimization Welcome to part 3! For the rest of the material I plan to skip over the theoretical parts, only covering the motivation and rationale of the algorithms. 10.1 Unconstrained Minimization Problems An unconstrained minimization doesn’t have any constraints but a function f () we need to minimize. We assume f to be convex and differentiable, so the optimality can be checked by looking at the gradient ∇f . This can sometimes be solved analytically ”for example, least squares), but in general we need to resort to an iterative method ”for example, geometric programming or analytic center). 10.1.1 Strong Convexity For most of this chapter we assume that f is strongly convex; which means that there exists m > 0 such that ∇2 f (x) mI for all symmetric x. This feels like an analogue of having a positive second order coefficient - is this different from having posdef Hessian? ”Hopefully video lecture provides some insights) Anyways, this is an extremely strong assumption, and we can’t, in general, expect our functions to be strongly convex. Then why assume this? We are looking at theoretical convergence, which is already not attainable ”because no algorithm is going to run infinitely). Professor says it’s more of a feel good stuff so let’s make assumptions that can shorten the proof. 40 Strong convexity has interesting consequences; the usual convexity bound can be improved so we have: T f (y) ≥ f (x) + ∇f (x) (y − x) + m 2 ky − xk2 2 We can analytically find the minimum point of RHS of this equation, and plug it back into the RHS to get the lower bound of f (y): f (y) ≥ f (x) − 1 2 k∇f (x)k2 2m So this practically means that we have a near-optimal point when the gradient is small. When we know m 2 this can be a hard guarantee, but m is not attainable in general. Therefore, we resort to making k∇f (x)k2 small enough so that we have a high chance of being near optimal. 10.1.2 Conditional Number of Sublevel Sets Conditional numbers of sublevel sets have a strong effect on efficiency of some algorithms. Conditional number of a set is defined as the ratio between maximum and minimum width of the set. The width for a convex set C along a direction q (kqk2 = 1) is defined by: W (C, q) = sup q T z − inf q T z z∈C z∈C 10.2 Descent Methods The family of iterative optimization algorithms which generate a new solution x(k+1) from x(k) by taking x(k+1) = x(k) + t(k) ∆x(k) where t(k) is called the step size, and ∆x(k) is called the search direction. Depending on how we choose t and ∆x, we get different algorithms. There are two popular ways of choosing t: • Exact line search minimizes f (t) = f x(k) + t · ∆x(k) exactly, by either analytic or iterative means. This is used when this minimization problem can be solved efficiently. • Backtracking search tries to find a t where the objective function sufficiently decreases. The exact details isn’t very important; it is employed when the minimization problem is harder to solve. The algorithm is governed by two parameters, which, practically, does not drastically change the performance of the search. 10.3 Gradient Descent Taking ∆x(k) = −∇f (x) will give you gradient descent algorithm. Some results for the convergence analysis are displayed. The lower bound for iteration is given as: log ((f (x0 ) − p∗ ) /ǫ) log (1/c) where p∗ is the optimal value, and we stop when we have f x(k) −p∗ < ǫ. The numerator is intuitive; the denominator involves the condition number and roughly equal to m/M . Therefore, as condition number increases, the number of required iterations will grow linearly. Given a constant condition number, this 41 bound shows that the error will decrease exponentially. For some reason this is called linear convergence in optimization context. 10.3.1 Performance Analysis on Toy Problems Exact search and backtracking line search is compared on toy problems; the number of iteration can differ by a factor of 2 or something like that. Also, we look at an example where we play with the condition number of the Hessian of f ; and the number of iteration can really blow up. 10.4 Steepest Descent Steepest descent algorithm generalizes gradient descent by employing a different norm. Given a norm, the normalized steepest descent direction is given by n o T ∆x = argmin ∇f (x) v| kvk = 1 Geometrically, we look at all vectors in a unit ball centered at current x and try to minimize f (x). When we use Euclidean norm, we regain gradient descent. Also, in some cases, we can think of SD as GD after a change of coordinates ”intuitively this makes sense, because using a different norm is essentially employing a different view on the coordinate system). 10.4.1 Steepest Descent With an ℓ1 Norm When we use ℓ1 norm, SD essentially becomes the coordinate descent algorithm. It can be trivially shown: take the basis vector with the largest gradient component, and minimize along that direction. Since we are using ℓ1 norm, we can never take a steeper descent. 10.4.2 Performance and Choice of Norm Without any problem-specific assumptions, essentially same as GD. However, remember that the condition number greatly affects the performance of GD - and change of coordinates can change the sublevel set’s condition number. Therefore, if we can choose a norm such that the sublevel sets will approximate an ellipsoid/sphere, SD works very well. A Hessian at the optimal point, if attainable, will minimize the condition number greatly. 10.5 Newton’s Method Newton’s method is the workhorse of convex optimization. The major motivation is that it tries to minimize the quadratic approximation of f () at x. To do this, we choose a Newton step ∆xnt : ∆xnt = −∇2 f (x) −1 ∇f (x) Several properties and interpretations are discussed. • The Newton step minimizes the second-order Taylor approximation of f . So, when f () roughly follows a quadratic form, Newton’s method is tremendously efficient. 42 • It’s the steepest descent direction for the quadratic norm defined by the Hessian. Recall that the Hessian at the optimal point is a great choice for a norm for SD - so when we have a near-optimal point, this choice minimizes the condition number greatly. • Solution of linearized optimality condition: we want to find v such that ∇f (x + v) = 0. And approximately: ∇f (x + v) ≈ ∇f (x) + ∇2 f (x) v = 0 and the Newton update is a solution for this. • Newton step is affinely invariant; so multiplying only a single coordinate by a constant factor will not change convergence. This is a big advantage over the usual gradient descent. Therefore, Newton’s method is much more resistant to high condition number sublevel sts. In practice, extremely high condition number can still hinder us because of finite precision arithmetic, yet it is still a big improvement. 10.5.1 The Newton Decrement The Newton decrement is a scalar value which is closely related; it is used as a stopping criterion as well: 1/2 T −1 λ (x) = ∇f (x) ∇2 f (x) ∇f (x) This is related to our estimate of our error f (x) − p∗ by the following relationship: f (x) − p∗ ≈ f (x) − inf fˆ (y) = y 1 2 λ 2 We stop when this value ”λ2 /2) is less than ǫ. 10.5.2 Newton’s Method Newton’s method closesly follows the gradient descent algorithm, except it uses the Newton decrement for stopping criterion, which is checked before making the update. 10.5.3 Convergence Analysis The story told by the convergence analysis is interesting. There exists a threshold for k∇f (x)k2 , when broken, makes the algorithm converge quadratically. This condition ”broken threshold for gradient), once attained, will hold in all further iterations. Therefore, the algorithm works in two separate stages. • In the dampen Newton phase, line search can give us an update size t < 1, and f will decrease by at least γ, another constant. • Pure Newton phase will follow, where we will only use full updates ”t = 1) and we get quadratic convergence. 43 10.5.4 Summary • Very fast convergence: especially, quadratic convergence when we reach the optimal point. • Affine invariant: much more resistant to high condition numbers. • Performance does not depend much on the correct choice of parameters, unlike SD. 10.6 Self-Concordant Functions This section covers an alternative assumption on f which allows us a better ”or more elegant) analysis on the performance of Newton method. This seems like more of an aesthetic, theoretic result, so unless some insights come up in the video lectures, I am going to skip it. 44 Murphy Ch13: Sparse Linear Models September 11, 2014 1.3 Useful for cases where we have more features than examples. Real world applications, kernel basis functions, representing signals in terms of wavelet basis functions. 1 1. There are lots of heuristics. Forward selection, backward selection. Orthogonal least squares (where we try to fit residuals from previous models). Orthogonal matching pursuits (variant of orthogonal least squares, but we do not refit linear model after we choose a new feature). And on, and on, and on. Bayesian variable selection We want to determine a binary vector γ which means “relevance” of each variable. A Bayesian approach dictates: p (γ|D) = P 2. Stochastic search: use MCMC. Metropolis Hastings algorithm? However it is unnecessarily inefficient, and there are better approximations. p (D|γ) ′ γ ′ p (D|γ ) 3. EM: EM cannot be applied to spike-and-slab model because we cannot back out γ from w, or something like that. We can make another approximation to make EM work (gah). Bernoulli-Gaussian is intractable in EM, but there’s another approximation. If dimension is small enough, we can either 1. take the combination with largest posterior 2. take features with individual posterior probability bigger than 0.5 1.1 Algorithms Spike and slab model 2 The above approach is intractable when dimension is large, of course. Let us approximate it by a model. 2.1 p (γ|D) ∝ p (γ) p (D|γ) ℓ1 regularization: basics Sparsity argument (1) A Laplacian prior results in ℓ1 regularization (yeah I already know this). Then why is this sparse? The peThe spike and slab model represents the prior part nalized optimization is the lagrangian dual of the conp (γ) by treating each variable individually, and giving strained optimization problem. (And this should have each variable a fixed probability to be relevant: π0 . This zero duality gap, I guess) Then we get this famous figure is a dial we use to control sparcity. The likelihood part is modeled as a linear model of variables with normal error. The weight of the linear model comes from γ, and also from a normal prior we also get to set. (when rj = 0, wj is set to be fixed at given parameter.) The prior part peaks sharply at sparse models, and the normal part is kind of spreads further... so this is called the spike and slab model. Then for a given bound on kwk1 , we can draw the feasible region as a diamond around the origin. Also, 1.2 Bernoulli-Gaussian for each value of the objective, we can draw a contour This is essentially similar to spike and slab. Instead, w of weights that results in that objective. Note the two is P not determined by γ - the input to the likelihood is regions are in a tradeoff relationship. If we increase the bound, the diamond will get bigger, and the contour will j γj wj xij . Also it is shown that this can be massaged into ℓ0 be smaller (we will go closer to the least squares soluregularization, where the penalization is on the number tion). Note that at the optimal point, the contour and the diamond will touch each other (if it strictly overlaps, of features. Meh. 1 we can always make the diamond smaller but retain the 2.5 Bayesian Inference same objective value). And geometrically it is more likely to hit the corner of the diamond because it is spiky in There are some results stating that the spike-and-slab model results in better prediction accuracy than lasso. higher dimensions. 2.2 Soft Thresholding 3 Another notable property is the soft thresholding effect. We use subgradients to prove optimality of the ℓ1 loss. This involves a quantity called cj , which is proportional to the correlation between the jth feature and the residual due to the other features. Then, the final weight wj is given as: (cj + λ) /aj if cj < −λ w ˆj = 0 if cj ∈ [−λ, λ] (cj − λ) /aj if cj > λ 3.1 3.2 LARS and homotopy methods Homotopy methods exploit the fact that it is sometimes faster to calculate the weights with given λk when λk ≈ λk−1 . LARS is a special case of such methods - starts from a large enough λ so that only one variable will be chosen. From there, we can add one variable at a time fast, using an analytical result. LARS cannot be used for ℓ1 -regularized GLMs. Regularization paths 3.3 For different values of λ, we can plot how the weight of jth feature changes - this is called the regularization path. The figure in the book shows that the weights for ridge regression deviates gradually from 0; but for lasso they stay at 0 until it becomes nonzero suddenly. It is noted that the regularization path is piecewise linear, and LARS exploits this to solve this problem faster(roughly, the same time required for a single least squares). 2.4 Coordinate descent When all coordinates are fixed except one, the optimal solution might be calculated analytically. This gives rise to the coordinate descent algorithm. So, the weights will be zero if the absolute value of the correlation power is smaller than λ. Also notable is that the weight in other cases are also “shrunk”, which makes lasso a biased estimator. So this is the problem we deal with Hierarchical Adaptive Lasso. 2.3 ℓ1 regularization: algorithms Proximal and gradient projection methods FISTA belongs to this category! When the objective f can be decomposed of two convex functions L and R, L differentiable and R _not_ differentiable, ISTA optimizes f in an iterative fashion. It approximates L with a quadratic function Lq (θ) around last guess. So the update looks like θk+1 = argminz R (z) + Lq (z) Model selection Random facts and strategies. For some popular forms of R we can solve this easily. FISTA approximates L around a point other than the most recent guess. Intuitively, it was said (during the study group session) that this is effectively the “heavyball” method. • Naive strategy: use lasso to pick features, and do a least squares on the chosen variables. (well, in practice, lasso is also used to fight collinearity as well - so I think this is a poor idea) • Theoretical considerations: using cross-validation for model selection might not be optimal. Cross validation optimizes model prediction accuracy which might be different from finding the correct model. 3.4 EM for lasso Gah. Approximate Laplace prior with a Gaussian scale mixture and we have a setup for EM. Why? The variance-gamma distribution, which is a normal distribution with its variance following a gamma distribution, is also called the generalized Laplace distribution. It actually includes the usual Laplace as a special case. I initially thought, WTF? But turns out the formulation is useful for extending ℓ1 . • Problem: ℓ1 regularization is unstable which means small perturbations in data can result in drastically different results. (Therefore Bayesian is more stable) Bagging can help - do a number of bootstrapped lasso and find the probability of each variable being included. This is called bolasso. 2 4 Extensions of ℓ1 regularization come by giving separate penalty parameter for each variable. Using cross-validation to tune those D parameters might be infeasible in traditional sense, but using a Bayesian modeling we can just use EM to fit them. The model looks like: γj → τj2 → wj . If we integrate τ s out, we get a Laplace distribution (wow). γ follows inverse Gamma, which is the conjugate for Laplace (wow), so EM works kind of smoothly.. Impressive. So this is like a generalized version of lasso, I guess. You are searching through different “Laplace-like” priors which include Laplace. The contour of the penalty looks more like a starfish rather than a diamond. • Group lasso solves the problem of one variable being related to multiple variables. For instance, when we have a categorical variable. The approach is to group coefficients together, and penalize each group’s square root of sum of squared coefficients. The text claims that the square root gives you sparsity. Intuitively, if each group consists of just one variable, this is the same as ℓ1 so that kind of make sense. However, still not sure why they do not just use ℓ1 . This can be fit using proximal methods or EM. • Fused lasso is useful for denoising stuff. Usually, the Automatic relevance determinadesign matrix is set to I and we have one weight per 6 one observation. The penalty is given by the ℓ1 norm tion & sparse Bayesian learning of the coefficients and ℓ1 norm of differences between adjacent coefficients. You can also use EM to fit this, All approaches so far had the form: τj2 → wj → y ← X again using the GSM formulation of Laplace. - and we integrated τ out. Instead, we can integrate out w and maximize the likelihood with regard to τ 2 . This • Elastic net is a mixture of lasso and ridge. There are gives rise to a method called ARD or SBL. results that state lasso works poorly with correlated variables - lasso will only pick one of them. Elastic net supposedly solves all these problems. 6.1 ARD for linear regression Conventionally, we denote weight precision (stdev) by αj = 1/τ 2 , and measurement precision by βj = 1/σ2 . −1 and y ∼ N y|wT x, 1/β . Then, w ∼ N w|0, A (A = diag(α)) Now we can integrate out w, and put a Gamma prior on both α and β. Now the likelihood is – Also mentionable is the grouping effect, where a function of parameters to the distribution of α and β, highly correlated variables split up the weights which is maximized. that lasso would have given to only one. Why is it sparse? Not really sure, the sparsity argu– However, the vanilla elastic net is known to ment here is definitely one of the crappier arguments in give you rather unimpressive results. It is this book. :-( said it’s because the shrinkage is performed ARD is different from regular MAP in the sense that twice - and you have to undo the ℓ2 shrink- we integrate out the prior parameter (in this case, α) age. Hmmm........ where can I find research but here we integrate out w. However, there are some regarding this? Maybe Hastie? results that they are connected - ARD is in fact MAP of a certain problem. – You can fit elastic net using a standard lasso algorithm by augmenting the design matrix and response vector (the same trick we used for nnlasso). 5 Non-convex regularizers 6.2 Algorithms for ARD Two problems with Laplace prior is claimed: the peak and the tails are not heavy enough. (?) So the noise ARD objective is not convex, so the results will depend are insufficiently shrunk, and the relevant coefficients are on the initial value. shrunk too much. The text says there are more flexible • Of course, EM can be used. priors that have larger spike at 0 and heavier tails. Practically, it is said that they often outperform ℓ1 regular• Or a fixed-point algorithm can be used as well. We ization. (!) know that at the optimal point the gradients disapdℓ dℓ = 0), so we enforce it iteratively = dβ pear ( dα j 5.1 Hierarchical adaptive lasso until everything converges. So the tradeoff: higher λs suppress noise better, but • Iteratively reweighted ℓ1 algorithm shrinks relevant parameters too much. This can be over- 3 6.2.1 For Logistic Regression When we do binary logistic regression, we cannot use EM because Gaussian prior is not conjugate to the logistic likelihood. We can do some approximations (such as Laplace approximation) to use EM though. 7 Sparse Coding Sparse coding is similar to sparse PCA/ICA in idea. However, sparse coding generates lots of factors, usually more than the number of dimensions; however, the coefficients are promoted to be sparse. So out of a lot of factors, we choose a small number of them to represent each data. 7.1 Learning a sparse factor loading matrix We can maximize the following likelihood: log p (D|W) = N X i=1 log ˆ zi N xi |Wzi , σ 2 I p (zi ) dzi Two problems - this is too hard to optimize, and sparsity is not being promoted. We approximate it by summing maximum likelihood for each zi instead. Also we use a Laplacian prior for z. After the approximation and massaging the formula, this is optimized in the following fashion - pick a guess for Z, find optimal W. Now estimate Z using W, and repeat. These two steps can be done by least squares and lasso, respectively. There are different variants of this - trying to approximate X by WZ (non-negative sparse coding), adding sparsity constraint on both Z and W (sparse matrix factorization). 7.2 Compressed sensing The rough idea: we do not get to observe x, but its low dimensional projection y = Rx + ǫ. How do we optimize it? We model x = Wz with a sparsity promoting prior on z. Picking the right basis is important - wavelet, domain specific. 4 Gaussian Processes January 19, 2015 1 Introduction In supervised learning, we try to learn an unknown function f for some inputs xi and outputs yi , such that f (xi ) = yi , possibly corrupted by noise. Then, we work with the distribution of function over given data: p (f |X, y). Usually, we assume a specific form of f , so we learn a parameter set θ and work with the distribution p (θ|X, y). Nonparametric regression techniques, such as LOWESS (locally weighted scatterplot smoother), overcome this problem by using the given data as our knowledge representation directly. Gaussian Process regression is a Bayesian equivalent of such technique. How is GP different from LOWESS? We make an important assumption: any vector [f (xi )] for any xi is jointly Gaussian. Also, the covariance between two function values f (x1 ) and f (x2 ) relies on the user-provided kernel κ (x1 , x2 ). 2 GP Regression 2.1 Noise-free Observations We usually assume the mean function E [f (x)] = 0 because GPs are usually flexible enough that we don’t need an intercept. (However, µ is not omitted from below discussion because there are some modeling techniques which employ a parametric representation of µ) Say we have the training examples X and y. Since observations are noiseless, we assume yi = f (xi ) and write y = f. Now we can take a test example X∗ and predict the distribution of the corresponding output f∗ . How do we do it? By our assumption of f , the vector of fs are jointly Gaussian, and follows the distribution: f f∗ ! ∼N µ µ∗ ! , K K∗ KT∗ K∗∗ !! where K, K∗ and KT∗ are covariance matrices calculated from user-specified κ. Then, by standard rules for conditioning Gaussians (of course I don’t know how to do this, but see section 4.3), we can get a distribution for f∗ conditioned on the rest of the observed variables: p (f∗ |X∗ , X, f) = N (f∗ |µ∗ , Σ∗ ) where µ∗ = µ (X∗ ) + KT∗ K−1 (f − µ (X)) and Σ∗ = K∗∗ − KT K−1 K∗ . We now got a posterior distribution of output values for X∗ . 1 2.2 Noisy Observations We now have: cov [yp , yq ] = κ (xp , xq ) + σy2 δpq where δpq is the Kronecker delta. 2.3 Kernel Parameters Different kernel parameters will result in different functions. Say we use a squared-exponential kernel: κ (xp , xq ) = σf2 1 2 exp − 2 (xp − xq ) + σy2 δpq 2ℓ • Increasing ℓ will decrease covariance between any two points by discounting distances; the function will be more wiggly as a result. • Increasing σf will increase the vertical scale of the function. • Increasing σy will increase the uncertainty around near points. This basically means we encode our belief on the function’s behavior in the kernel. 2.4 Estimating Kernel Parameters Kernel parameters are chosen by maximizing the marginal likelihood p(y|X). 2 Murphy Ch16: Adaptive Basis Function January 21, 2015 1.1.2 Pros and Cons Instead of manually concocting kernels, we try to learn the features from the input data. Methods CART are easy to interpret, but they do not predict based on ABF use weak learners as a way to come very accurately, and it has a high variance. up with features from the data. 1.2 1 Trees 1.1 Random Forests In a random forest, we fit M different trees each trained by a different subset of the data ”bootstrapped samples, and choosing a subset of the fea- CART tures). So this is bagged decision trees. For performance of RF compared with different tools, see CART ”Classification and Regression Trees) is a clas- Caruana”2006). sical decision tree model. Basically, at each node of Why does RF perform well? Recall the error can the tree, it splits the input space into two chunks by an axis-parallel hyperplane. When we reach the leaf be decomposed into bias and variance. Decision trees are very high variance and low bias. And tak- of the tree, the final prediction/classification is made ing average of multiple decision tree will keep the bias ”if the bias is same across all trees) and lowers by a constant, or a simple learner such as linear regression. variance by a square root factor. ”See mathematicalmonk for proof) In practice, not only we take subsets of data points 1.1.1 Growing and Shrinking Trees and attributes, we add random types of splitting operators to increase the randomness. Given a loss function, we can always try to find the pair of optimal parameter and the threshold which minimizes the average error, assuming the 2 Generalized Additive Models next nodes will be leaves. We can try all parameters; and for each parameter we sort the possible Generalized additive model employs multiple ”pos- values and try each threshold between two adja- sibly nonparameteric) models, one for each feature. cent observed values. We can stop growing the tree Each model j tries to predict yi from feature xij ; so when some stopping criteria is met; this criteria is a the model looks like: heuristic. For example, you can limit the depth, or have a threshold in reduction of cost, etc. Growing f (x) = α + f1 (x1 ) + · · · + fD (xD ) a tree sometimes is sometimes to myopic; we might not make any splits at all. An alternative is grow a fj () can be any scatterplot smoother; regularized splines are common. ”Hmm, why not use something full tree and prune. 1 nonparametric like LOESS?) 3.2 2.1 Different loss functions result in different boosting algorithms. Examples: Backfitting GAMs can be fit by an iterative scheme; at each stage • Squared loss results in L2Boosting each fj tries to fit the residual from all models except • Exponential loss results in AdaBoost fj . Also, note α is not identifiable in the above form; PN we need to set i=1 fj (xij ) = 0 to ensure this. 2.2 • Logloss results in LogitBoost ”since exponential loss explodes for outliers, this is more robust) MARS These approaches typically require that you do a weighted fit at each stage. Multivariate Adaptive Regression Splines introduces interaction terms to GAMs. Interaction terms are generated by multiplying basis functions in the form of (xj − t) , (t − xj ) where t is an observed value of xj . 3.3 Functional Gradient Boosting So far, we tried to predict the residual between the target and our prediction in each stage of the boosting process. Instead, we can try to approximate the gradient of the loss function. The target of the regression g looks like this: 3 Boosting 3.1 Different Flavors of Boosting Forward Stagewise Additive Boosting gim = Boosting tries to optimize the sum of losses given a ∂L (yi , fm−1 (xi )) ∂fm−1 (xi ) And we do a line search to find ρm which mini- loss function L(): mizes L (fm−1 − ρgm ). This does not require the re- f ∗ = min f X gression process to work on weighted sets, which is an advantage. Also it can be easily extended to different types of losses, such as Huber loss. L (yi , f (xi )) i We will have different functions for different types of L(). Typical choices include the squared loss ”in regression contexts), log loss and exponen- 3.4 tial loss ”in classification contexts). At each stage, Sparse boosting uses simple linear regression as the adaptive basis function. This is known as forward stagewise linear regression ”how is this different from stepwise regression?). we try to fit the residual between y and the current prediction, by minimizing: (βm , γm ) = argminβ,γ X Sparse Boosting L (yi , fm−1 (xi ) + βφ (xi ; γ)) i 3.5 where γ is the parameter set for the weak learner; and β is the weight for it. Then fm is taken to be: MART When shallow CART models are used as the weak learner for gradient boosting, it is called MART. This fm (x) = fm−1 (x) + βm φ (x; γm ) has a slight modification to the gradient boosting al- In practice, shrinking β by multiplying it with 0 < ν ≤ 1 works better than the above update. the leaves of the tree to minimize the loss, instead of minimizing the gradient. gorithm though; we re-estimate the parameters at 2 3.6 Interpretations Boosting can be interpreted as an ℓ1 regularization. Also, there’s a Bayesian interpretation ”well, sort of broken IMO) about boosting as well. 4 Notes • Subsampling: empirically max is preferred over avg for some reason • Feeding artificially distorted input ”hmm) • Convolutional neural net uses human ”domain specific) expertise in feature generation 3 Murphy Ch14: Kernel Methods January 21, 2015 Kernels are measures of similarity defined for two elements in an abstract space. Of course, this is hugely useful. 1 Kernel Functions A kernel function κ (x, x′ ) ≥ 0 is a real-valued function for x, x′ ∈ χ. Typically this function is symmetric. This section goes through different types of kernels and their properties. This page also seems to provide valuable insights: http://mlg.eng.cam.ac.uk/duvenaud/cookbook/index.html 1.1 RBF Kernels The Radial Basis Function kernel, or the squared exponential kernel, or the Gaussian kernel looks like: 1 T κ (x, x′ ) = exp − (x − x′ ) Σ−1 (x − x′ ) 2 Σ is commonly diagonal, so the function ends up looking like: 1X 1 2 (xi − x′i ) κ (x, x ) = exp − 2 i σi2 ′ ! where σi is called the characteristic length scale of dimension i. When all dimensions share the characteristic length (you probably want to standardize the data beforehand), we get: kx − x′ k κ (x, x′ ) = exp − 2σ 2 2 ! which only depends on the distance between two vectors (the radial basis), so this is called the RBF kernel. 1.2 Cosine Similarity The cosine similarity between TF/IDF vectors for document similarity can also be thought of a kernel. 1 1.3 Mercer Kernels Mercer Kernel is a class of kernels which a very desirable property. Many kernels we use are Mercer kernels. A Mercer kernel satisfies the following: for any sets of input xi , the Gram matrix K with Kij = κ (xi , xj ) is positive definite kernel. For this reason, Mercer is also called positive definite kernel. The Mercer kernel’s importance comes from the fact that Mercer kernel can be expressed by an inner product. We can decompose the Gram matrix K as: K = U T ΛU And we can now set: where 1 φ (xi ) = Λ 2 U:,i T kij = φ (xi ) φ (xj ) So you can find the feature vector implied by the kernel function. This fact is very important to apply the kernel trick, described below. 1.4 Linear Kernels κ (x, x′ ) = xT x′ Wat. 1.5 Matern Kernel The Matern kernel is commonly used in GP regression.... but don’t know what is going on 1.6 Domain Specific Kernels An example of a highly domain-specific kernel, we define a kernel measuring the similarity between two strings: κ (x, x′ ) = X ws φs (x) φs (x′ ) s where s is any possible substring, φs (x) is the number of times s occurs in x. Another example is the pyramid matching kernel; when spatial matching of two sets of points are desired, we can group points into a multi-sized histogram and each histogram are compared. 2 1.7 Kernels From Probabilistic Generative Models 1.7.1 Probability Product Kernels Say we have a generative model: p (x|θ). Given two examples xi and xj , we can try to estimate the parameter from one and see how the other is probable. This gives rise to the probability product kernel. 1.7.2 Fisher Kernel I don’t fully understand details, but Fisher kernel relies on this idea: if two observations are similar, they will want to update the MLE in a similar direction. So their gradient should look similar. 2 Using Kernels Inside GLMs We can easily use kernels in any GLM, by using a feature vector comprised of distances from some centroids: φ (x) = [κ (x, µ1 ) , κ (x, µ2 ) , κ (x, µ3 ) , · · ·] µi ∈ χ is a set of K centroids. Of course, picking the right set of centroids is very tricky. If we have a low dimension input space, we can make a grid of centroids, but that’s plain impossible in a high dimensional space. One way of solving this problem is making every observation a centroid of its own, and use a sparsitypromoting prior to make sure we don’t get a hairy overfitted monster. There are a few approaches; • L1VM, ℓ1 -regularized vector machine uses ℓ1 regularization. • RVM, relevance-vector machine uses techniques similar to ARD/SBL algorithms. • SVM modifies the likelihood term (into hinge loss, I guess) to promote sparsity. 3 The Kernel Trick Instead of replacing all feature vector with its kernel-based representation φ (x) = [κ (x, µ1 ) , κ (x, µ2 ) , κ (x, µ3 ) , · · ·], we can rewrite algorithms to replace inner product with a call to κ. This is called the Kernel trick. For example, we can replace the following calculation: 2 kxi − xj k2 = xTi xi + xTj xj − 2xTi xj = κ (xi , xi ) + κ (xj , xj ) − 2κ (xi , xj ) The latter equivalence requires that the kernel is Mercer. (Note that x in the first two parts are actually φ (x) - don’t know why the book uses x) 3.1 Kernelized Ridge Regression Unlike k-means or nearest neighbor, ridge regression is not based on the notion of similarity. So how do we kernelize them? The closed form solution for ordinary ridge looks like this: 3 w = X T X + λID −1 XT y Using matrix inversion lemma, this can be rewritten as: w = X T XX T + λIN −1 y See that XX T ? We’re going to replace it with the Gram matrix K! 3.2 Kernel PCA The detailed treatment is kind of complex; here’s a brief description of the idea. We also want to replace XX T with the Gram matrix. We usually calculate eigenvectors from X T X, but to kernelize we need to get them from XX T (so we can put K in place). Fortunately, getting eigenvectors of X T X from that of XX T requires some simple algebraic manipulation. After that, we have to take care of normalization of eigenvectors and centering; but I leave it to future myself to understand if need arises.... 4 Support Vector Machines This section gives a brief treatment of SVMs, both for regression and classification. There seems to be two different ways to derive SVM; the large-margin approach (which coincides with the introduction from 2 Boyd) and the loss-function approach. The loss-function approach will treat the kwk2 term as an ℓ2 regularization term. 4.1 Loss Function Treatment SVM regression uses the epsilon insensitive loss function which is flat 0 around 0, and grows linearly after that. It’s a symmetric version of the hinge loss. Obviously this is not differentiable, but we can introduce slack variables - and we have a constrained problem with a differentiable objective. Also, one can show that the optimal weights w ˆ is given by w ˆ= X α i xi i where α is a nonnegative, sparse vector. So the weight is a weighted sum of input samples; these are the support vectors which are the namesake. SVM classification uses the hinge loss, obviously. 4.2 Multiclass Classification There’s no elegant generalization of SVM for multiclass problems, unlike the Bayesian approaches. (It’s quite evident that Murphy doesn’t think highly of SVMs ;) 4 4.3 Choosing Parameters We need to both choose the kernel parameter and the regularization multiplier. This can be done by a grid-search fashion, or a LARS-like fashion - exploiting narrow kernels need high regularization, and vice versa. 5 Comparison of Discriminative Kernel Methods This section describes the difference between different kernel-based methods. The conclusion seems to be that most methods have comparable performance - and L1VM should be the fastest. SVM doesn’t give you well-calibrated probabilities, so avoid it unless you have a structured output. 6 Kernels for Building Generative Models This section deals with a different type of kernels; smoothing kernels. Topics like Nadaraya-Watson, or LOESS are discussed. 6.1 Smoothing Kernel Obviously, smoothing kernel is more or less a pdf; they sum to 1. Gaussian is a popular smoothing kernel. We Epanechnikov kernel, tri-cube kernel is also mentioned. 6.2 Kernel Density Estimation KDE is a nonparametric method to come up with a distribution given samples: p (x|D) = 1 X κh (x − xi ) N which is also called the Parzen window density estimator. h is a bandwidth parameter you get to set. If you want to do this to estimate a class conditional density, you might want to let each point have a different bandwidth, and expand it until you hit K neighboring samples. (This doesn’t mean much if you are using Gaussian kernels; something with a compact support would be needed.) Anyways, this is similar to K-means. 6.3 Kernel Regression Kernel regression is a natural extension of nearest neighbors: f (x) = X wi (x) yi i and wi is just normalized distance between xi and x: κh (x − xi ) wi (x) = P j κh (x − xj ) 5 So the regression takes the weighted mean of observed ys. You don’t have to use smoothing kernel for this; replace κh (x − xi ) with κ (x, xi ) and you got yourself a LOESS, locally-weighted regression. 6
© Copyright 2026 Paperzz