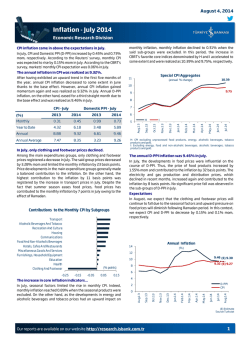
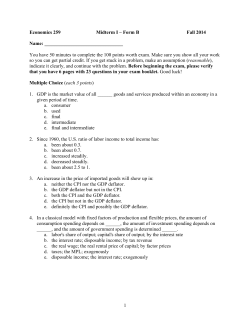
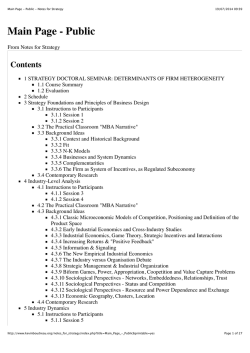
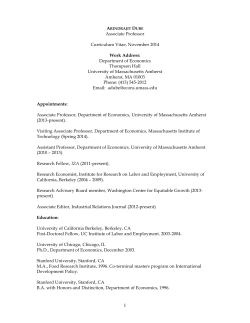
India Monetary Policy by Group Economics April 2015 Summary & Overview The RBI held the benchmark Repo rate at 7.5% in its April 7 Meeting. Governor Rajan also chided banks for not passing prior rate cuts. Following his remarks, a number of banks reduced their base rates. Headline consumer inflation rose to 5.4% in February. However, inflationary pressures remained contained, with Core CPI falling to 4.1% in February. India’s external position is much more secure than before, with FX reserves at USD343bn. Reflecting increasing confidence in India’s economic prospects, Moody’s upgraded India’s outlook from stable to positive. The RBI announced a number of regulatory changes, including measures to allow Indian Corporations to issue Rupee-denominated bonds overseas. NAB Economics is forecasting another 25bp cut to the Repo rate in 2015– most likely in the June quarter, with the year-end Repo rate expected at 7.25%. Further rate cuts are possible but depend on : path of food prices and the monsoon rains; the supply response (land, power, etc) and possible external uncertainty. The RBI’s decision was largely anticipated, given the previously ‘front-loaded’ rate cuts in January and March. In its Statement, the RBI highlighted that recent unseasonal rains had generated some uncertainty and that banks had not passed on the previous rate cuts. With regard to weather disturbances, the Farm Ministry indicated that there could be a 4-5% decline in the wheat crop. Recognising the potential negative impact on affected farmers, Prime Minister Modi indicated an increase in the compensation package to be provided to distressed farmers. On interest rates, Governor Rajan chided the banks for not passing on the previous rated cuts. He also highlighted the ‘tepid’ pace of credit growth (9.5% over the year to March) and easing liquidity as factors enabling banks to cut rates. More specifically, he suggested that banks should compute their lending rate based on the marginal cost of funds (which are more sensitive to the policy rates), instead of average costs. Credit & Deposit growth Indian Banking: Credit & Deposit Growth 30 25 Credit RBI’s Decision 20 YOY At its April, 7th meeting, the RBI: Deposit Maintained the policy Repo rate at 7.5%; the MSF (Marginal Standing Facility) and Reverse Repo Rate were held at 8.5% and 6.5% respectively; Kept the Cash Reserve ratio at 4% Continued providing liquidity under overnight repos at 0.25% of banks’ NDTL (Net Demand & Time Liabilites), and 7-day and 14-day term repos at 0.75% of banks’ NDTL. 15 10 5 Indian Policy Rates Mar-15 Mar-14 Mar-13 Mar-12 Mar-11 Mar-10 Mar-09 Mar-08 0 Following the remarks by the Governor, a number of banks announced a reduction in their base rate, the minimum lending rate. SBI indicated a 15bp cut in its base rate to 9.85%; ICICI 25bps to 9.75%; and HDFC 15bps to 9.85%. Policy Rates: Repo, Reverse Repo & MSF 12 Inflation and growth 10 Headline consumer inflation increased a touch in February, rising by 5.4% over the year (5.2% in January). Food prices (6.8%) remained somewhat elevated, due largely to fruits (8.9%), vegetables (13%), dairy (9.2%) and pulses (10.6%). By contrast, the wholesale price measure turned negative, impacted by falling fuel prices. %ge 8 6 4 MSF Repo Reverse Repo 2 Source: DX/RBI Apr-15 Oct-14 Apr-14 Oct-13 Apr-13 Oct-12 Apr-12 Oct-11 Apr-11 Oct-10 Apr-10 Oct-09 Apr-09 Oct-08 Apr-08 Oct-07 Apr-07 0 Underlying inflationary pressures though, remain contained. This can be seen in the declining trend in Core CPI (ex fuel and food), which has fallen over the past 9 months to a low of 4.1% in February. This is partly due to the impact of lower fuel prices on transport costs. Besides, National Australia Bank – Group Economics | 1 India GDP & Monetary Policy 10 April 2015 housing costs have eased partly due to revisions in the coverage of the new CPI measure; and muted demand for health, education and services has restrained price increases in these categories. Further, rural wage growth has eased substantially, rising by 5.5% in January 2015, c.f. 15% during 2007-13, according to the Labour Bureau. durables) has been weak, but capital goods has shown strong growth. That said, it is still too early to call this the start of a new capital investment cycle, although progress on clearing stalled projects will help. Industrial Production - Sectoral Headline inflation Industrial Production: Sectoral 20 15 Indian Inflation: WPI vs CPI %ge YOY 20 10 5 %ge YOY 15 0 10 -5 5 -10 Industrial Workers CPI New CPI Mining Mfg Electricity Jan-15 Jul-14 Jan-14 Jul-13 Jan-13 Jul-12 Jan-12 Jul-11 Jan-11 Jul-10 Jan-10 Jan-09 Feb-15 Feb-14 Aug-14 Feb-13 Aug-13 Feb-12 Aug-12 Feb-11 Aug-11 Feb-10 Aug-10 Aug-09 Feb-09 Feb-08 Aug-08 Feb-07 Aug-07 WPI -5 IP -15 Jul-09 0 Source: CEIC Source:CEIC Industrial Production - Use Core inflation Industrial Production: Use-Based 60 %GE YOY Core Inflation in India: CPI vs WPI 9.00 8.00 50 Basic Capital 40 Inter Consumer 30 7.00 CPI 20 %ge YOY WPI 6.00 5.00 10 0 4.00 -10 3.00 -20 2.00 -30 1.00 Jan-15 Jul-14 Jan-14 Jul-13 Jan-13 Jul-12 Jan-12 Jul-11 Jan-11 Jul-10 Jan-10 Jan-09 Feb-15 Oct-14 Jun-14 Feb-14 Oct-13 Jun-13 Jul-09 -40 0.00 Source: CEIC Source: NAB Economics The RBI’s survey of household inflationary expectations is a useful forward-looking price indicator, and provides an insight into future behaviour of prices, and hence interest rates. In the most recent (March 2015) survey, household inflation expectations for the year head rose slightly (from 8.9% to 9.1%). However, they remain in single digits, and well below levels since September, 2014. This does give some confidence that the RBI will cut rates again. External and Financial Inflation Expectations EQUITIES The equity market seems to have shrugged off the rate decision, and continues to gain strength. Data from SEBI revealed that foreigners continue to have a strong appetite for Indian shares, buying a net USD41.4 million of shares, taking the year’s inflows at USD6.3bn, the highest in Asia. Coal India, Reliance Industries and Tata Consultancy have been among the stronger performers. Household Inflation Expectations: 1-Year ahead Mumbai Sensex 100 18 10,000 9,000 16 9,000 8,000 14 8,000 12 %ge 7,000 7,000 Index 10 6,000 8 6,000 6 5,000 5,000 08-Apr-15 19-Nov-14 02-Jul-14 12-Feb-14 25-Sep-13 08-May-13 19-Dec-12 3,000 01-Aug-12 3,000 14-Mar-12 Industrial production has shown positive growth over the 3 months to January, 2015. Mining has still been in the doldrums, although electricity, and more importantly given its relatively larger share, manufacturing has shown positive growth. By use, consumer goods (particularly 4,000 26-Oct-11 Source: RBI 4,000 08-Jun-11 Mar-15 Sep-14 Mar-14 Sep-13 Mar-13 Sep-12 Mar-12 Sep-11 Mar-11 Sep-10 Mar-10 4 Source: Datastream India’s rupee has been trading around the USD62-63 range, and FX volatility remains broadly muted. However, India’s National Australia Bank – Group Economics | 2 India GDP & Monetary Policy 10 April 2015 REER (Real Effective Exchange rate) has risen noticeably over the past few quarters. The RBI noted this in its review and suggested that it maybe a factor constraining export growth – although it also made the point that it did not target any particular level for the exchange rate. FDI and Portfolio Inflows FDI & Portfolio Inflows in India 20,000 FDI Portfolio 15,000 FX Rate: 30 30 35 35 40 40 45 45 Depreciation 50 USD Millions 10,000 INR/USD 0 -5,000 50 55 55 60 60 65 65 70 70 75 75 5,000 Dec-14 Jun-14 Sep-14 Mar-14 Dec-13 Jun-13 Sep-13 Mar-13 Dec-12 Sep-12 Jun-12 FX Reserves 09-Apr-15 17-Nov-14 24-Jun-14 29-Jan-14 10-Sep-13 22-Apr-13 30-Nov-12 11-Jul-12 05-May-11 27-Sep-11 16-Feb-12 Source: DX Mar-12 Dec-11 Sep-11 Jun-11 -10,000 India's FX Reserves: USD- M 350,000 Source: Bloomberg Effective Exchange rates 300,000 Effective Exchange Rates: Nominal and Real 120 U SD M REER NEER 110 200,000 100 90 Source: Bloomberg Feb-15 Feb-14 Aug-14 Feb-13 Aug-13 Feb-12 Aug-12 Feb-11 Aug-11 Aug-10 Feb-10 Aug-09 Feb-09 Aug-08 Feb-08 Aug-07 Feb-07 Aug-06 Feb-06 60 Source: BIS Whilst exports have been constricted by the higher exchange rate, imports too have fallen in nominal terms due to lower crude oil prices. Besides, gold purchases remained broadly contained. The RBI also indicated that service exports have held up, particularly for software and tourism, ensuring limited pressure on the Current Account (the deficit for the December quarter was at -1.6%. Strong capital inflows from both foreign direct investments as well as strong debt and equity portfolio inflows from overseas investors have more than covered India’s deficit shortfall and have swelled India’s foreign exchange reserves. The latest RBI data reveal that they have increased to USD 343billion, and provide a meaningful buffer against any volatility which may arise from anticipated US Federal Reserve rate hikes later in the year. Moody’s has upgraded India’s outlook to positive, from stable. This reflects a number of favourable developments: increased confidence in the economic outlook, improvements in its institutional profile and confidence in measures to boost infrastructure and ease business regulations. Outlook The RBI indicated that ‘Going forward, the accommodative stance of monetary policy will be maintained, but monetary actions will be conditioned by incoming data’. Its aim was to achieve a below 6% inflation target by January 2016, followed by a 4% target (the mid-point of the proposed 4+/-2% target band) by March 2018. Over the coming year, it expected inflation to evolve around the current level (5.4%) till June 2016, moderate to 4% by August, and rise to 5.8% by the end of the year. This pattern can be seen in the chart below, showing the projection of ‘base effects’ over the year head. National Australia Bank – Group Economics | 3 27-M ar-15 25-Jul-14 22-N ov-13 22-M ar-13 20-Jul-12 18-N ov-11 18-M ar-11 16-Jul-10 70 13-N ov-09 80 13-M ar-09 150,000 11-Jul-08 Index 2010 = 100 250,000 India GDP & Monetary Policy 10 April 2015 Tom Taylor CPI Inflation: Base & Momentum Effects Head of International Economics CPI Inflation: Base & Momentum Effects [email protected] 2.00 Base Momentum Mthly Change 1.50 1.00 % ge 0.50 0.00 -0.50 -1.00 -1.50 Feb-16 A ug-15 Feb-15 A ug-14 Feb-14 A ug-13 Feb-13 -2.00 Source:NAB Economics NAB Economics is forecasting one more rate cut (during the June quarter), which will ensure a Repo rate of 7.25% by the end of 2015. Further rate cuts are possible, but depend on: the outlook for food prices and the coming monsoon rains; progress on improving the supply side of the economy; potential external uncertainty (e.g. from expected rate hikes from the Fed). Financial and Regulatory measures The monetary policy announcement was accompanied by a number of regulatory developments. Some of the key elements include: Allowing trading of Government bonds by retail investors. This could potentially lessen demand for certain types of bank deposits. Facilitating the issue of rupee bonds overseas by Indian corporations. Overseas investors will be able to enjoy high yields, and at the same time Indian corporations will not be subject to currency risk. This could be akin to ‘dimsum’ bonds issued by Chinese corporations in Renminbi. Permit banks to invest in each other’s bonds for trading purposes – subject to restrictions. Doing away with the ‘Calendar of Reviews’ to be deliberated by bank boards. Instead, bank boards are to focus on key issues: business strategy, risk, compliance, financial reporting integrity, financial inclusion and human resources. Increasing the cap on borrowing limits of clients in the Micro finance sector. John Sharma Economist – Sovereign Risk [email protected] National Australia Bank – Group Economics | 4 India GDP & Monetary Policy Global Markets Research Peter Jolly Global Head of Research +61 2 9237 1406 Australia Economics Ivan Colhoun Chief Economist, Markets +61 2 9237 1836 David de Garis Senior Economist +61 3 8641 3045 Tapas Strickland Economist +61 2 9237 1980 10 April 2015 New Zealand Stephen Toplis Head of Research, NZ +64 4 474 6905 Craig Ebert Senior Economist +64 4 474 6799 Doug Steel Senior Economist +64 4 474 6923 Kymberly Martin Senior Market Strategist +64 4 924 7654 Raiko Shareef Currency Strategist +64 4 924 7652 Yvonne Liew Publications & Web Administrator +64 4 474 9771 FX Strategy Ray Attrill Global Co-Head of FX Strategy +61 2 9237 1848 Emma Lawson Senior Currency Strategist +61 2 9237 8154 Asia Christy Tan Head of Markets Strategy/Research, Asia +852 2822 5350 UK/Europe Interest Rate Strategy Skye Masters Head of Interest Rate Strategy +61 2 9295 1196 Nick Parsons Head of Research, UK/Europe, and Global Co-Head of FX Strategy +44 207 710 2993 Rodrigo Catril Interest Rate Strategist +61 2 9293 7109 Gavin Friend Senior Markets Strategist +44 207 710 1588 Credit Research Derek Allassani Research Production Manager +44 207 710 1532 Michael Bush Head of Credit Research +61 3 8641 0575 Simon Fletcher Senior Credit Analyst – FI +61 2 9237 1076 Distribution Barbara Leong Research Production Manager +61 2 9237 8151 Group Economics Alan Oster Group Chief Economist +61 3 8634 2927 James Glenn Senior Economist – Australia +61 3 9208 8129 Vyanne Lai Economist – Australia +61 3 8634 0198 Phin Ziebell Economist – Agribusiness +61 475 940 662 Amy Li Economist – Australia +61 3 8634 1563 Dean Pearson Head of Industry Analysis +61 3 8634 2331 Robert De Iure Senior Economist – Industry Analysis +61 3 8634 4611 Brien McDonald Senior Economist – Industry Analysis +61 3 8634 3837 Karla Bulauan Economist – Industry Analysis +61 3 8641 4028 Tom Taylor Head of Economics, International +61 3 8634 1883 Tony Kelly Senior Economist – International +61 3 9208 5049 Gerard Burg Senior Economist – Asia +61 3 8634 2788 John Sharma Economist – Sovereign Risk +61 3 8634 4514 Jacqui Brand Personal Assistant +61 3 8634 2181 Important Notice This document has been prepared by National Australia Bank Limited ABN 12 004 044 937 AFSL 230686 ("NAB"). Any advice contained in this document has been prepared without taking into account your objectives, financial situation or needs. Before acting on any advice in this document, NAB recommends that you consider whether the advice is appropriate for your circumstances. NAB recommends that you obtain and consider the relevant Product Disclosure Statement or other disclosure document, before making any decision about a product including whether to acquire or to continue to hold it. Please click here to view our disclaimer and terms of use. National Australia Bank – Group Economics | 5
© Copyright 2026 Paperzz