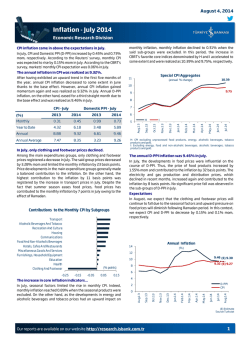
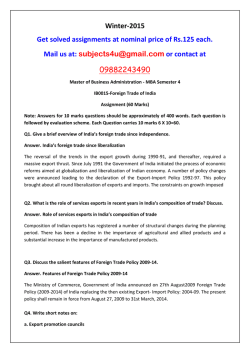
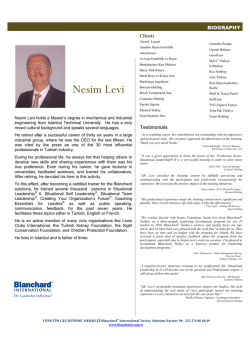
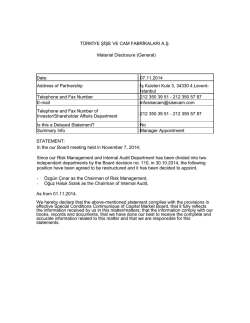
August 29, 2014
Foreign Trade Balance - July 2014
Economic Research Division
25
20
Exports
Imports
10
5
2.4
0
-1.9
Aug.1 2
Sep.12
Oct.12
Nov.1 2
Dec.12
Ja n.1 3
Feb.1 3
Mar.13
Apr.1 3
May.13
Jun.13
Jul.13
Aug.1 3
Sep.13
Oct.13
Nov.1 3
Dec.13
Ja n.1 4
Feb.1 4
Mar.14
Apr.1 4
May.14
Jun.14
Jul.14
-5
The decline in exports to Iraq played an important role in the
deceleration in total exports. After having decreased in
June, exports to Iraq continued to fall dramatically in July (by
45.3% yoy) due to the ongoing conflicts in this country. The
fall in exports to Iraq was realized as 19.4% yoy in June. On
the other hand, having dropped one place to third rank in
total exports in June, Iraq maintained its rank in July despite
the rapid decline. When Iraq is excluded, exports to Near and
Middle Eastern countries registered a limited increase.
Exports to European Union countries also increased in the
first seven months of this year compared to the previous
year. In line with this development, the share of EU
countries in total exports increased to 45% in July from
41.6% in the same month of last year. During the same
Foreign Trade Balance
80
60
40
20
11.1
0
-12.9
Jul.14
Ja n.1 4
Apr.1 4
Oct.13
Jul.13
Apr.1 3
Ja n.1 3
-45.3
Oct.12
Jul.12
Apr.1 2
Ja n.1 2
Oct.11
-60
Jul.11
Iraq
EU
Near and Middle Eastern
-20
-40
period, the share of Near and Middle Eastern countries in
total exports, on the other hand, receded to 19.9% from
23.4%.
Foreign Trade
(12-month cumulative, annual % change)
15
(annual % change)
100
Apr.1 1
Although exports exhibited the weakest performance of the
last nine months with an increase of 2.6% yoy in July,
foreign trade deficit narrowed to 6.5 billion USD, below the
market expectations, thanks to the sharp decline in imports
(13.5% yoy). In fact, imports dropped at the fastest rate
since October 2009. Thus, the import coverage ratio
increased by 10.6 points yoy and reached 67.5%, the
highest level in four months. Seasonally and calendar
adjusted figures also confirmed that exports performed
much better than imports in July.
Exports Volume
120
Ja n.1 1
Foreign trade deficit came in below the market
expectations.
The rapid decline in imports, which helped the foreign trade
deficit come in below the expectations, indicated that the
slowdown in domestic demand continued. In fact, imports of
consumption goods declined on an annual basis for the sixth
month in a row. In particular, the annual fall of 23.8% in
motor vehicles item was noteworthy in July. Gold imports,
which had been watched closely during last year, also
supported the contraction in foreign trade deficit. Gold
imports amounted to 182 million in July from 1.6 billion USD
in the same month of the last year.
Expectations...
In addition to the concerns regarding Iraq, relative
slowdown in European countries recorded recently,
especially in Germany, might put a downward pressure on
export performance of Turkey in the coming period.
Nevertheless, both moderate domestic demand conditions
and the potential trade agreements between Turkey and
Russia in near future are anticipated to enforce the
narrowing trend of foreign trade deficit.
(USD billion)
July
Change
January-July
Change
2013
2014
(%)
2013
2014
(%)
Exports
13.1
13.4
2.6
88.2
93.5
6.1
Imports
23.0
19.9
-13.5
148.8
139.6
-6.2
Foreign Trade Balance
-9.9
-6.5
-34.8
-60.6
-46.1
-24.0
Import Coverage Ratio (%)
56.9
67.5
-
59.3
67.0
-
Source: Turkstat
Our reports are available on our website http://research.isbank.com.tr
1
August 29, 2014
Foreign Trade Balance - July 2014
Economic Research Division
Türkiye İş Bankası A.Ş. - Economic Research Division
İzlem Erdem - Manager
[email protected]
Hatice Erkiletlioğlu - Asst. Manager
[email protected]
Alper Gürler - Unit Manager
[email protected]
Kıvılcım Eraydın - Economist
[email protected]
Bora Çevik - Economist
Eren Demir - Asst.Economist
[email protected]
[email protected]
M. Kemal Gündoğdu - Asst.Economist
[email protected]
Gamze Can - Asst.Economist
[email protected]
LEGAL NOTICE
This report has been prepared by Türkiye İş Bankası A.Ş. economists and analysts by using the
information from publicly available sources believed to be reliable, solely for information
purposes; and they are not intended to be construed as an offer or solicitation for the purchase
or sale of any financial instrument or the provision of an offer to provide investment services.
The views, opinions and analyses expressed do not represent the official standing of Türkiye İş
Bankası A.Ş. and are personal views and opinions of the analysts and economists who prepare
the report. No representation or warranty, express or implied, is made as to the accuracy or
completeness of the information contained in this report. All information contained in this report
is subject to change without notice, Türkiye İş Bankası A,Ş, accepts no liability whatsoever for
any direct or consequential loss arising from any use of this report or its contents.
This report is copyright-protected. Reproducing, publishing and/or distributing this report in
whole or in part is therefore prohibited. All rights reserved.
Our reports are available on our website http://research.isbank.com.tr
3
© Copyright 2026 Paperzz