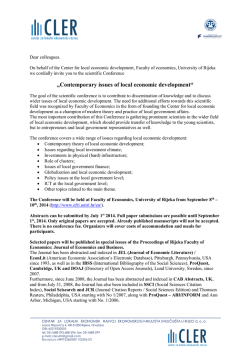
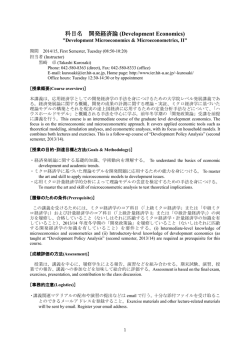
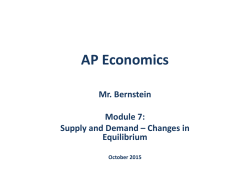
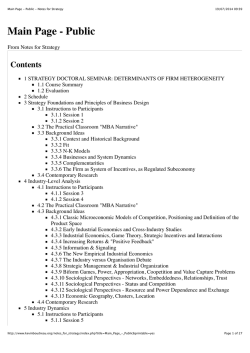
Crop Market Outlook Oct. 9, 2015 Chad Hart Associate Professor/Crop Markets Specialist [email protected] 515-294-9911 Extension and Outreach/Department of Economics U.S. Corn Supply and Use 2011 2012 2013 2014 2015 91.9 97.3 95.4 90.6 88.4 Area Planted (mil. acres) Yield (bu./acre) 147.2 123.1 158.1 171.0 168.0 Production (mil. bu.) 12,360 10,755 13,829 14,216 13,555 Beg. Stocks (mil. bu.) 1,128 989 821 1,232 1,731 Imports (mil. bu.) 29 160 36 32 30 Total Supply (mil. bu.) 13,517 11,904 14,686 15,479 15,316 Feed & Residual (mil. bu.) 4,557 4,315 5,034 5,317 5,275 Ethanol (mil. bu.) 5,000 4,641 5,134 5,207 5,250 Food, Seed, & Other (mil. bu.) 1,428 1,397 1,369 1,359 1,380 Exports (mil. bu.) 1,543 730 1,917 1,864 1,850 Total Use (mil. bu.) 12,528 11,083 13,454 13,748 13,755 Ending Stocks (mil. bu.) 989 821 1,232 1,731 1,561 Season-Average Price ($/bu.) 6.22 6.89 4.46 3.70 3.80 Source: USDA-WAOB Extension and Outreach/Department of Economics U.S. Soybean Supply and Use 2011 2012 2013 2014 2015 Area Planted (mil. acres) 75.0 77.2 76.8 83.3 83.2 Yield (bu./acre) 41.9 40.0 44.0 47.5 47.2 Production (mil. bu.) 3,094 3,042 3,358 3,927 3,888 Beg. Stocks (mil. bu.) 215 169 141 92 191 Imports (mil. bu.) 16 41 72 33 30 Total Supply (mil. bu.) 3,325 3,252 3,570 4,052 4,109 Crush (mil. bu.) 1,703 1,689 1,734 1,875 1,880 Seed & Residual (mil. bu.) 88 105 97 143 130 Exports (mil. bu.) 1,365 1,317 1,647 1,843 1,675 Total Use (mil. bu.) 3,155 3,111 3,478 3,861 3,685 Ending Stocks (mil. bu.) 169 141 92 191 425 Season-Average Price ($/bu.) 12.50 14.40 13.00 10.10 9.15 Source: USDA-WAOB Extension and Outreach/Department of Economics Corn Yield Estimate Top: 2015 Estimated Yields Bottom: Change from last month Units: Bushels/acre Source: USDA-NASS Extension and Outreach/Department of Economics Corn Objective Yield Data Source: USDA-NASS Extension and Outreach/Department of Economics Soybean Yield Estimate Top: 2015 Estimated Yields Bottom: Change from last month Units: Bushels/acre Source: USDA-NASS Extension and Outreach/Department of Economics Soybean Yield Estimate Source: USDA-NASS Extension and Outreach/Department of Economics World Corn Production Source: USDA-WAOB Extension and Outreach/Department of Economics World Soybean Production Source: USDA-WAOB Extension and Outreach/Department of Economics Hog Crush Margin The Crush Margin is the return after the pig, corn and soybean meal costs. Carcass weight: 200 pounds Pig price: 50% of 5 mth out lean hog futures Corn: 10 bushels per pig Soybean meal: 150 pounds per pig Source: ISU Extension Extension and Outreach/Department of Economics Cattle Crush Margin The Crush Margin is the return after the feeder steer and corn costs. Live weight: 1250 pounds Feeder weight: 750 pounds Corn: 50 bushels per head Source: ISU Extension Extension and Outreach/Department of Economics U.S. Meat Production & Prices Source: USDA-WAOB Extension and Outreach/Department of Economics Corn Export Sales Source: USDA-FAS Extension and Outreach/Department of Economics Corn Export Sales Source: USDA-FAS Extension and Outreach/Department of Economics Soybean Export Sales Source: USDA-FAS Extension and Outreach/Department of Economics Soybean Export Sales Source: USDA-FAS Extension and Outreach/Department of Economics Crude Oil Prices Sources: EIA and CME Extension and Outreach/Department of Economics Strength of the U.S. Dollar Source: Federal Reserve Extension and Outreach/Department of Economics Corn Grind for Ethanol Extension and Outreach/Department of Economics Ethanol Stocks Source: EIA Extension and Outreach/Department of Economics Ethanol Exports Source: EIA Extension and Outreach/Department of Economics Current Corn Futures 3.86 3.64 Source: CME Group, 10/2/2015 Extension and Outreach/Department of Economics Current Soybean Futures 8.43 8.53 Source: CME Group, 10/2/2015 Extension and Outreach/Department of Economics 2015/16 Crop Margins Extension and Outreach/Department of Economics 2016/17 Crop Margins Extension and Outreach/Department of Economics Iowa Corn Prices vs. Costs Extension and Outreach/Department of Economics Iowa Soybean Prices vs. Costs Extension and Outreach/Department of Economics Thoughts for 2015 and Beyond Supply/demand concerns Rain made grain, but we’re still debating how much Exports weaken as dollar strengthens and China slows Negative margins for 2015-2016 crops 2014/15 2015/16 USDA USDA Corn Soybeans $3.70 $10.10 $3.80 $9.15 Extension and Outreach/Department of Economics 2015/16 Futures (10/9/15) $3.64 $8.43 2016/17 Futures (10/9/15) $3.86 $8.53 Thank you for your time! Any questions? My web site: http://www2.econ.iastate.edu/faculty/hart/ Iowa Farm Outlook: http://www2.econ.iastate.edu/ifo/ Ag Decision Maker: http://www.extension.iastate.edu/agdm/ Extension and Outreach/Department of Economics
© Copyright 2026 Paperzz