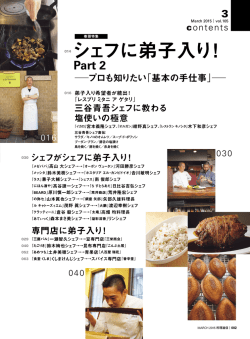
Fiscal Years Ended March 31, 2005–2014 Investors’ Guide 2014 インベスターズ・ガイド C o n t e n t s 業績概要(連結)................................................................................................... 1 Performance Highlights (Consolidated) 主な連結財務指標の推移...................................................................................... 2 Main Consolidated Financial Indicators 連結財務諸表 Consolidated Financial Statements 連結貸借対照表.............................................................................................. 5 Consolidated Balance Sheets 連結損益計算書.............................................................................................. 8 Consolidated Statements of Income 連結包括利益計算書....................................................................................... 9 Consolidated Statements of Comprehensive Income 連結キャッシュ・フロー計算書....................................................................... 10 Consolidated Statements of Cash Flows セグメント情報(連結).......................................................................................... 13 Segment Information (Consolidated) 退職給付関係........................................................................................................ 16 Retirement Benefit Plans 株式情報............................................................................................................... 19 Common Stock Information 会社概況............................................................................................................... 20 Corporate Data 本インベスターズ・ガイドは、投資家の皆さまに弊社の決算数字の推移をわかり やすくご理解いただくために、過去 10 年間のアニュアルレポート、フィナンシャル レポートからデータを抜粋、分析の便宜のため、指標を一部グラフ化しまとめた ものです。 本文注記での会計基準等、より詳細なデータについては、個別のアニュアル レポート、フィナンシャルレポートをご参照いただきたくお願い申しあげます。 This investors’ guide has been prepared by taking data from annual reports and financial reports over the last ten years, and includes graphic summaries for investors’ convenience. For more detailed data and notes on accounting standards, please refer to the relevant past annual reports and financial reports. 業績概要(連結) Performance Highlights (Consolidated) 売上高 Years ended March 31, 2012 through 2014 2014 2013 Net 2012 Sales 売上高(百万円) Net sales (¥ million) 991,332 984,967 1,200 営業利益(百万円) Operating income (¥ million) 62,548 71,232 当期純利益(百万円) Net income (¥ million) 42,795 48,373 69.7 74.4 1,009.0 1,004.4 21.2 19.0 株価純資産倍率(倍) Price/Book value ratio — PBR (times) 1.5 1.4 株価キャッシュ・フロー倍率(倍) Price/Cash flow ratio — PCFR (times) 9.4 9.3 1株当たり当期純利益(円) Net income per share (¥) 1株当たり純資産額(円) Book value per share (¥) 2011 1,007,208 (十億円/¥ Billion) 72,584 69,374 41,754 30,400 61.3 43.6 894.6 871.6 16.9 19.9 1.2 1.0 900 600 1,015,215 300 株価収益率(倍) Price/Earnings ratio — PER (times) 0 20117.92012 20148.1 2013 (注) 2014 年 3 月期より提携事業等の総発売元取引について純額での計上に変更しています。2011 年 3 月期以降の過去数値は純額計上ベースに組替え済みです。 Note: For the coffee and edible oils business and some other businesses, the gross figures for sales and cost of goods sales were recorded in the accounts but from the year ended March 31, 2014 this method is changed by netting off sales and cost of goods sold and recording the net figure in the accounts. Post-reclassification basis from the year ended March 31, 2011. 営業利益/当期純利益 営業利益/当期純利益 株価収益率 株価収益率 PER PER 売上高株価収益率 PER Net Sales 30 30 1,200 30 20 900 20 (倍/Times) (倍/Times) (倍/Times) (十億円/¥ Billion) Operating Income and and Operating Income 営業利益/当期純利益 Net Income Net Income 株価収益率 Operating Income and PER Net Income (十億円/(¥十億円/ Billion)¥ Billion) 80 80 60 20 40 20 10 10 0 0 0 2011 0 2012 2011 2013 2012 2014 2013 0 2011 2011 2012 2012 2013 2013 2014 2012 2011 2013 2012 2014 2013 2014 40 4.0 20 2.0 2014 0 営業利益 Operating Income Income 営業利益 Operating 2011 2013 2012 2014 2013 2014 2011 2012 当期純利益 Net Income (Loss) (Loss) 当期純利益 Net Income 0 6.0 0 2011 2014 60 8.0 1,000 800 6.0 (%) (円/¥) 1,200 1,000 2011 1,000 800 80 60 60 800 40 40 4.0 400 600 400 600 40 20 400 20 2011 0 200 0 2012 2011 2013 2012 2014 2013 0 2011 PER 1株当たり当期純利益 Net Income 30Per Share 0 2011 2012 2012 2013 2013 2014 2014 (倍/Times) (円/¥) 900 60 600 40 20 0 0 2012 2011 20112013 201220142013 2013 2014 2012 0 2011 10 300 0 2011 2014 2014 株価収益率 80 20 200 0 2013 20 800 600 0 (円/¥) 60 400 200 2013201120142012 当期純利益 Net Income (Loss) 1,000 600 200 2.0 (円/¥) 2012 営業利益 Operating Income 1株当たり当期純利益 1株当たり当期純利益 売上高 Net Income Per Sales Share Net Income Per Share Net 1株当たり当期純利益 1株当たり純資産額 Net Income Per Share(十億円/ Book Value Per ¥) ¥ Billion) 1,200Share (円/¥) (円/ 80 80 1,200 0 0 営業利益 Operating Income 当期純利益 Net Income (Loss) 1株当たり純資産額 1株当たり純資産額 BookBook ValueValue Per Share Per Share 1株当たり純資産額 自己資本当期純利益率 Book Value Per Share ROE (円/¥) (円/¥) 1,200 1,200 (%) 20 20 300 8.0 (十億円/¥ Billion) 40 40 10 80 60 60 20 600 10 Net Income ROE (倍/Times) (十億円/¥ Billion) 80 30 営業利益/当期純利益 自己資本当期純利益率 Operating Income and 2014 2011 2012 2013 2014 0 20112013 20122014 2013 2012 2014 2011 2012 2013 2014 1 主な連結財務指標の推移 Main Consolidated Financial Indicators 百万円 ¥ million; Years ended March 31, 2005 through 2014 2014 2013 2012 2011 2010 2009 2008 2007 2006 2005 売上高・営業利益及び当期純利益(純損失)の推移. Net sales, operating income and net income (loss) 売上高 Net sales 991,332 984,967 1,007,208 1,015,215 1,170,876 1,190,371 1,216,572 1,158,510 1,106,807 1,073,010 営業利益 Operating income 62,548 71,232 72,584 69,374 64,034 40,827 60,523 63,800 60,322 70,916 当期純利益(純損失) Net income (loss) 42,795 48,373 41,754 30,400 16,646 (10,227) 28,229 30,229 34,912 44,817 売上高営業利益率(%) Operating income ratio (%)*1 6.3 7.2 7.2 6.8 5.5 3.4 5.0 5.5 5.5 6.6 売上高当期純利益率(%) Return on sales (%)*2 4.3 4.9 4.1 3.0 1.4 (0.9) 2.3 2.6 3.2 4.2 売上高総利益率(%) Gross profit margin (%)*3 35.9 39.0 40.1 39.7 32.9 30.0 29.6 28.5 28.2 29.1 ※4 売上高販管費率(%) SGA ratio (%)*4 29.6 31.8 32.9 32.9 27.4 26.6 24.6 23.0 22.7 22.5 1,091,650 1,091,741 1,097,057 1,077,418 1,082,238 1,057,786 1,100,709 1,061,688 997,405 903,542 収益性の比率 . Profitability ratios ※1 ※2 ※3 総資産・自己資本及び有利子負債の推移 . Total assets, total shareholders’ equity and interest-bearing debt 総資産 Total assets 自己資本 Total shareholders’ equity 598,925 635,287 605,349 608,191 602,769 585,234 628,325 563,446 528,762 467,297 有利子負債 Interest-bearing debt 142,954 119,314 130,040 133,391 147,902 149,402 144,328 151,223 145,644 125,604 ※5 自己資本比率(%) Shareholders’ equity ratio (%)*5 54.9 58.2 55.2 56.4 55.7 55.3 57.1 53.1 53.0 51.7 ※6 負債・自己資本比率(%) Debt/Equity ratio (%)*6 23.9 18.8 21.5 21.9 24.5 25.5 23.0 26.8 27.5 26.9 自己資本当期純利益率(%) Return on equity (ROE) (%)*7 6.9 7.8 6.9 5.0 2.8 (1.7) 4.7 5.5 7.0 10.0 総資産当期純利益率(%) Return on total assets (ROA) (%)*8 3.9 4.4 3.8 2.8 1.6 (0.9) 2.6 2.9 3.7 5.0 69.7 74.4 61.3 43.6 23.9 (14.6) 41.9 46.7 53.6 68.8 1,009.0 1,004.4 894.6 871.6 863.7 838.5 899.4 870.0 815.8 720.6 156.8 152.5 131.2 106.6 103.9 60.1 121.9 116.1 121.2 139.2 利益率の指標 . Return indicators ※7 ※8 1株当たり指標. Per share value indicators 1株当たり当期純利益(純損失) (円) Net income (loss) per share (¥) 1株当たり純資産額(円) Book value per share (BPS) (¥) ※9 1株当たりキャッシュ・フロー(円) Cash flow per share (CFPS) (¥)*9 ※ 1 ~ 9につきましてはP3 の注記をご参照ください。 *1~9: See accompanying notes on page 3. (注 1 )自己資本として、2007 年 3 月期以降は純資産合計から少数株主持分を引いた額を、2006 年 3 月期までは株主資本合計を表示し、関連指標はこれらを基に計算しております。 (注 2 ) 2014 年 3 月期より提携事業等の総発売元取引について純額での計上に変更しています。2011 年 3 月期以降の過去数値は純額計上ベースに組替え済みです。 Note 1:Total shareholders’ equity for the fiscal years from the year ended March 31, 2007 on this page is net assets minus minority interests, and the related indicators are calculated using this total shareholders’ equity. Note 2:For the coffee and edible oils business and some other businesses, the gross figures for sales and cost of goods sales were recorded in the accounts but from the year ended March 31, 2014 this method is changed by netting off sales and cost of goods sold and recording the net figure in the accounts. Post-reclassification basis from the year ended March 31, 2011. 2 主な連結財務指標の推移 Main Consolidated Financial Indicators 2014 2013 2012 2011 2010 2009 2008 2007 2006 2005 0.91 0.90 0.93 0.94 1.09 1.10 1.13 1.13 1.16 1.21 6.1 6.4 7.1 7.2 8.0 8.4 9.4 10.0 10.8 11.0 59.5 57.0 51.3 50.7 45.8 43.4 38.7 36.4 33.9 33.1 ※13 負債・キャッシュ・フロー比率(%) Debt/Cash flow ratio (%)*13 73.5 77.7 67.6 53.1 48.9 28.7 57.7 50.9 58.1 67.2 ※14 インタレストカバレッジ倍率(倍) Interest coverage ratio (times)*14 32.4 38.4 34.8 29.3 19.1 9.0 13.3 13.3 19.1 24.3 237.7 229.3 226.5 236.5 213.5 204.3 180.0 172.7 179.1 179.5 21.2 19.0 16.9 19.9 38.8 — 24.1 29.0 23.4 19.0 株価純資産倍率(倍) Price/Book value ratio — PBR (times) 1.5 1.4 1.2 1.0 1.1 0.8 1.1 1.6 1.5 1.8 株価キャッシュ・フロー倍率(倍) Price/Cash flow ratio — PCFR (times) 9.4 9.3 7.9 8.1 8.9 11.6 8.3 11.7 10.4 9.4 20.0 18.0 16.0 16.0 16.0 16.0 16.0 15.0 14.0 13.0 28.7 24.2 26.1 36.7 67.1 — 38.1 32.1 26.1 18.9 (480) 103,703 51,611 66,833 42,597 (10,788) 23,143 7,852 (28,556) 49,202 Years ended March 31, 2005 through 2014 効率性の指標. Efficiency indicators ※10 総資本回転率(回) Asset turnover (times)*10 ※11 棚卸資産回転率(回) Inventory turnover (times)*11 ※12 棚卸資産回転日数(日) Inventory turnover (days)*12 流動性の指標. Liquidity indicators ※15 流動比率(%) Current ratio (%)*15 投資の指標. Investment ratios 株価収益率(倍) Price/Earnings ratio — PER (times) 配当金及び配当性向. Dividends and payout ratio 1 株当たり配当金(円) Dividends per share (¥) ※16 配当性向(%) Payout ratio (%)*16 企業価値の指標. Value indicators ※17 フリーキャッシュ・フロー(百万円) Free cash flow (¥ million)*17 ※ 10 ~ 17につきましては下記の注記をご参照ください。 *10~17: See notes below. ■ 注記:主な財務指標の推移 指標計算式 Methods of Calculating Main Financial Indicators 11. 売上高営業利益率=営業利益/売上高 Operating income ratio = Operating income/Net sales 12. 売上高当期純利益率=当期純利益/売上高 Return on sales = Net income/Net sales 13. 売上高総利益率=売上総利益/売上高 Gross profit margin = Gross profit/Net sales 14. 売上高販管費率=販売費及び一般管理費/売上高 SGA ratio = Selling, general and administrative expenses/Net sales 15. 自己資本比率=自己資本/総資産 Shareholders’ equity ratio = Total shareholders’ equity/Total assets 16. 負債・自己資本比率=有利子負債/自己資本 Debt/Equity ratio = Interest-bearing debt/Shareholders’ equity 17. 自己資本当期純利益率=当期純利益/期中平均自己資本 ROE = Net income/Average shareholders’ equity 18. 総資産当期純利益率=当期純利益/期中平均総資産 ROA = Net income/Average total assets 19. 1株当たりキャッシュ・フロー=(当期純利益+減価償却費+法人税等調整額)/発行済株式総数 CFPS = (Net income + Depreciation and amortization + Deferred income tax)/Outstanding shares 10. 総資本回転率=売上高/総資本 (期中平均) Asset turnover = Net sales/Average total assets 11. 棚卸資産回転率=売上高/棚卸資産 (期中平均) Inventory turnover = Net sales/Average inventory 12. 棚卸資産回転日数=365/棚卸資産回転率 Number of days of inventory held = 365/Inventory turnover 13. 負債・キャッシュ・フロー比率= (当期純利益+減価償却費+法人税等調整額) /有利子負債の期中平均 Debt/Cash flow ratio = (Net income + Depreciation and amortization + Deferred income tax)/Average interest-bearing debt 14. インタレストカバレッジ倍率= (営業利益+受取利息・配当金) /支払利息・割引料 Interest coverage ratio = (Operating income + Interest and dividend income)/Interest expense 15. 流動比率=流動資産/流動負債 Current ratio = Current assets/Current liabilities 16. 配当性向=配当金/当期純利益 Payout ratio = Dividends paid/Net income 17. フリーキャッシュ・フロー=営業活動によるキャッシュ・フロー-投資活動によるキャッシュ・フロー Free cash flow = Net cash provided by operating activities - Net cash used in investing activities 3 2.0 15.0 15.0 3.0 1.0 10.0 10.0 2.0 0 1.0 -1.0 0 2007 2008 2009 2010 2011 売上高営業利益率 Operating Income Ratio (%) 8.0 5.0 5.0 0 0 2007 2008 2009 2010 2011 売上高当期純利益率 2007 2008 2009 2010 2011 2007 2008 2009 2010 2011 売上高総利益率 Return on Sales 売上高販管費率 Gross Profit Margin (%) 5.0 4.0 SGA Ratio (%) 50.0 40.0 6.0 30.0 3.0 30.0 2.0 20.0 1.0 10.0 20.0 4.0 10.0 2.0 0 0 2011 2012 2013 2014 総資産 自己資本 総資産 /自己資本 / 総資産 /自己資本 Total Assets and Assets TotalTotal Assets and and Total Shareholders’ Equity Shareholders’ Equity TotalTotal Shareholders’ Equity 1,200 1,200 1,200 1,000 1,000 1,000 800 800 800 600 600 600 400 400 400 200 200 200 (十億円/ Billion) (十億円/(¥十億円/ Billion)¥¥Billion) 0 2011 2012 0 (十億円/ Billion) 150 (¥十億円/ 150 Billion)¥¥Billion) 150 (十億円/ 総資産 TotalAssets Assets 総資産 Total 総資産 Total Assets 自己資本 TotalShareholders’ Shareholders’ Equity 自己資本 Total 自己資本 Total Shareholders’ Equity Equity 0 2011 2012 120 120 90 90 (%) )50.0 50.0 (%) 50.0 (% 40.0 30.0 20.0 20.0 20.0 30 30 30 10.0 10.0 10.0 0 00 00 2014 2011 2012 2013 2014 自己資本当期純利益率 自己資本当期純利益率 / 自己資本当期純利益率 / / 総資産当期純利益率 総資産当期純利益率 総資産当期純利益率 ROE and ROA ROA and ROEROE and ROA 8.0 8.0 8.0 6.0 6.0 6.0 4.0 4.0 4.0 2.0 2.0 2.0 (%) (%) ) (% 30.0 30.0 60 60 2011 2013 40.0 40.0 60 0 2011 2012 2012 2013 2013 2014 2014 2011 2012 2013 2014 2014 Interest-bearing Debt and Interest-bearing Interest-bearing DebtDebt and and Debt/Equity Ratio Debt/Equity Debt/Equity RatioRatio 120 00 2011 2013 有利子負債/ 有利子負債/ 有利子負債/ 負債・自己資本比率 負債・自己資本比率 負債・自己資本比率 90 4 (%) 40.0 00 0 2011 2012 2012 2013 2013 2014 2014 2011 2012 2013 2014 有利子負債 Interest-bearing Debt 有利子負債 Interest-bearing 有利子負債 Interest-bearing Debt Debt 負債・自己資本比率 Debt/Equity Ratio 負債・自己資本比率 Debt/Equity 負債・自己資本比率 Debt/Equity Ratio Ratio 2011 ROE ROA 2011 2012 2012 2013 2013 2014 2014 2011 2012 2013 2014 ROE ROE ROA ROA 連結貸借対照表 Consolidated Balance Sheets 百万円 ¥ million; As of March 31, 2005 through 2014 2014 2013 2012 2011 2010 2009 2008 2007 2006 2005 130,028 184,770 146,647 133,744 95,063 67,790 83,164 81,486 75,133 92,980 2,681 2,149 3,680 8,568 3,042 2,426 1,212 503 1,263 2,234 受取手形及び売掛金 Notes and accounts receivable 200,115 196,473 205,778 194,227 194,545 188,444 191,838 205,084 195,841 187,214 たな卸資産 Inventories 163,528 159,818 147,657 135,311 146,810 147,340 135,557 122,652 108,324 97,459 50,338 42,863 38,611 44,580 47,889 46,637 54,103 50,398 45,427 34,525 546,693 586,074 542,375 516,432 487,351 452,639 465,875 460,126 425,991 414,415 関係会社への投資及び貸付金 Investments in and advances to unconsolidated subsidiaries and affiliates 73,701 60,996 54,332 51,755 50,613 46,910 47,501 75,763 68,785 67,087 その他の投資有価証券 Investment securities 38,777 34,887 31,912 32,418 39,314 36,952 49,589 60,170 78,213 55,164 9,112 11,316 12,766 13,183 11,656 12,670 10,893 8,314 7,342 5,952 121,591 107,200 99,012 97,357 101,583 96,533 107,983 144,247 154,341 128,204 47,068 51,065 96,139 98,167 98,628 100,146 102,625 59,708 55,611 57,861 建物及び構築物 Buildings and structures 358,043 348,963 350,782 350,654 357,010 336,660 341,939 312,585 272,416 252,206 機械装置・運搬具・工具・建設仮勘定 Machinery and equipment 652,073 630,369 606,467 596,443 609,130 602,258 623,901 585,408 554,107 492,441 1,057,185 1,030,398 1,053,389 1,045,265 1,064,769 1,039,065 1,068,466 957,702 882,135 802,509 資産の部. Assets 流動資産. Current assets: 現金及び現金等価物 Cash and cash equivalents 定期預金及び短期投資 Time deposits and short-term investments その他 Other 流動資産合計 Total current assets 投資及び貸付金. Investments and long-term advances: その他 Other 投資及び貸付金合計 Total investments and long-term advances 有形固定資産. Property, plant and equipment: 土地 Land 合計 Total 減価償却累計額 Accumulated depreciation (697,814) (679,173) (664,705) (657,215) (652,930) (606,099) (631,779) (571,773) (540,184) (500,050) 有形固定資産合計 Property, plant and equipment, net 359,370 351,224 388,683 388,050 411,839 432,966 436,686 385,928 341,950 302,458 63,994 47,241 66,985 75,578 81,463 75,646 90,164 71,385 75,122 58,463 1,091,650 1,091,741 1,097,057 1,077,418 1,082,238 1,057,786 1,100,709 1,061,688 997,405 903,542 その他資産 Other assets 資産合計 Total assets 5 連結貸借対照表 Consolidated Balance Sheets 百万円 ¥ million; As of March 31, 2005 through 2014 2014 2013 2012 2011 12,365 17,790 16,209 23,411 4,406 109,310 2010 2009 2008 2007 2006 2005 9,963 26,706 36,036 27,734 34,851 24,305 5,316 20,923 3,056 23,296 15,401 410 10,764 113,545 104,226 99,643 95,537 104,065 122,804 109,966 109,894 20,590 9,465 7,900 13,095 8,328 6,997 12,122 7,274 16,584 89,861 94,245 84,689 84,609 87,877 88,373 88,390 85,337 69,259 255,541 239,455 218,348 228,236 221,506 258,769 266,453 237,840 230,810 104,429 81,434 104,837 109,272 114,788 118,594 84,996 108,088 110,382 90,533 12,424 13,020 13,202 13,220 13,330 13,312 13,373 13,232 13,298 13,104 61,845 28,796 62,962 58,554 52,623 47,856 45,784 51,421 57,234 63,275 415 517 1,016 1,331 1,113 1,315 1,956 2,201 1,607 1,860 23,015 20,720 25,422 26,406 28,966 36,546 28,111 12,706 15,634 11,952 202,128 144,489 207,442 208,786 210,822 217,625 174,222 187,650 198,157 180,726 79,863 79,863 79,863 79,863 79,863 79,863 79,863 79,863 — — 83,443 112,757 162,381 182,716 182,719 182,723 182,850 111,581 — — 505,921 482,501 444,728 414,189 394,672 389,100 383,648 365,791 — — (31,085) (2,817) (2,219) (2,514) (2,437) (2,378) (1,858) (2,902) — — 638,143 672,304 684,755 674,255 654,818 649,308 644,504 554,334 — — 13,043 9,419 2,678 1,339 (232) (1,517) 5,702 15,633 — — 負債・純資産の部. Liabilities and net assets 流動負債. Current liabilities: 短期借入金及びコマーシャルペーパー 14,641 Short-term borrowings 1年以内返済予定長期借入金・1年以内償還予定社債 22,011 Current portion of long-term debt 支払手形及び買掛金 105,697 Notes and accounts payable 未払法人税等 8,497 Accrued income taxes その他 79,182 Other 流動負債合計 230,033 Total current liabilities 固定負債. Long-term liabilities: 長期借入金 Long-term debt 預り保証金 Customers’ deposits received 退職給付引当金 Accrued employees’ retirement benefits 役員退職慰労引当金 Accrued officers’ severance benefits その他 Other 固定負債合計 Total long-term liabilities 純資産. Net assets 株主資本. Shareholders’ equity: 資本金 Common stock 資本剰余金 Capital surplus 利益剰余金 Retained earnings 自己株式 Treasury stock 株主資本合計 Total shareholders’ equity その他の包括利益累計額. Accumulated other comprehensive income: その他有価証券評価差額金 Unrealized holding gain (loss) on securities 繰延ヘッジ損益 Unrealized gain (loss) from hedging instruments 為替換算調整勘定 Translation adjustments その他 Other その他の包括利益累計額合計 Total accumulated other comprehensive income (26) (141) (1) (31) (16) 220 (142) 27 — — (31,669) (46,295) (81,603) (67,045) (51,799) (62,777) (21,739) (6,549) — — (20,567) — (478) (327) — — — — — — (39,218) (37,017) (79,405) (66,064) (52,048) (64,074) (16,179) 9,111 — — 少数株主持分 Minority interests 60,562 56,423 44,809 42,099 40,409 33,419 39,392 44,138 — — 659,487 691,710 650,159 650,291 643,179 618,654 667,717 607,584 — — 1,091,650 1,091,741 1,097,057 1,077,418 1,082,238 1,057,786 1,100,709 1,061,688 — — 純資産合計 Total net assets 負債純資産合計 Total liabilities and net assets 6 連結貸借対照表 Consolidated Balance Sheets 百万円 ¥ million; As of March 31, 2005 through 2014 2014 2013 2012 2011 2010 2009 2008 2007 2006 2005 — — — — — — — — 32,644 24,707 資本金 Common stock — — — — — — — — 79,863 79,863 資本剰余金 Capital surplus — — — — — — — — 111,579 111,579 利益剰余金 Retained earnings — — — — — — — — 341,528 315,981 その他有価証券評価差額金 Unrealized holding gains on securities — — — — — — — — 23,848 9,239 為替換算調整勘定 Translation adjustments — — — — — — — — (25,547) (47,116) 自己株式 Treasury common stock, at cost — — — — — — — — (2,510) (2,250) 株主資本合計 Total shareholders’ equity — — — — — — — — 528,762 467,297 負債、少数株主持分及び資本合計 Total liabilities and shareholders’ equity — — — — — — — — 997,405 903,542 負債・資本の部. Liabilities and shareholders’ equity 少数株主持分 Minority interests 株主資本. Shareholders’ equity: 7 連結損益計算書 Consolidated Statements of Income 百万円 ¥ million; Years ended March 31, 2005 through 2014 2013 2012 2011 2010 2009 2008 2007 2006 2005 売上高 Net sales 991,332 984,967 1,007,208 1,015,215 1,170,876 1,190,371 1,216,572 1,158,510 1,106,807 1,073,010 売上原価 Cost of sales 635,594 600,630 603,420 612,237 785,578 833,123 856,974 828,050 795,007 760,554 売上総利益 Gross profit 355,738 384,337 403,788 402,978 385,298 357,247 359,597 330,459 311,799 312,455 販売費及び一般管理費 Selling, general and administrative expenses 293,190 313,104 331,203 333,604 321,264 316,420 299,074 266,658 251,476 241,538 営業利益 Operating income 62,548 71,232 72,584 69,374 64,034 40,827 60,523 63,800 60,322 70,916 支払利息 Interest expense (2,032) (1,931) (2,167) (2,440) (3,468) (4,774) (4,751) (5,008) (3,292) (3,020) 受取利息及び配当金 Interest and dividend income 3,196 2,902 2,821 2,171 2,174 2,000 2,685 2,610 2,567 2,537 699 552 (7) (205) 2,639 (12,429) 844 793 960 (215) 退職金引当金戻入 Reversal to income of accrued severance indemnities (benefits) — — — 0 16 61 0 2 96 7 投資有価証券評価損 Loss on devaluation ofsecurities (52) (2,346) (607) (7,416) (64) (799) (84) (121) (92) (104) (381) (9) (24) (92) (322) (257) (905) (251) (7) (0) — (36) 526 900 66 286 4,101 5,280 1,314 11,202 2,315 18,201 — — — — — — — — 厚生年金基金代行返上益 Gain on transfer of benefit obligation relating to employees’ pension fund 236 27,752 — — — — — — — — 減損損失 Loss on impairment of fixed assets (624) (14,562) (1,106) (8,503) (14,325) (18,838) (125) (1,769) — (6,075) 関係会社整理損 Loss on liquidation of affiliates (859) — — — (178) — (4,137) (22) (872) (124) 固定資産売却益 Gain on sales of fixed assets 3,081 908 — — — — — — — — 関係会社清算益 Gain on liquidation of affiliates 1,005 — — — — — — — — — 持分法による投資利益 Equity in earnings of affiliates 3,360 3,058 2,401 2,990 3,461 2,524 3,541 3,920 3,703 3,263 固定資産除却損 Loss on disposal of fixed assets (1,222) (2,951) (3,320) (1,356) (4,536) (3,401) (2,544) (7,725) (4,699) (2,604) その他 Other, net 2,032 (1,033) 990 (6,975) (4,705) (1,943) (7,297) (5,788) (2,831) 5,954 営業外損益、特別損益 Non-operating income (expenses), Extraordinary gains (losses) 10,754 29,595 (493) (20,929) (19,242) (37,570) (8,673) (8,079) (3,153) 10,821 税金等調整前当期純利益(純損失) Income (loss) before income taxes and minority interests 73,302 100,828 72,091 48,444 44,791 3,256 51,849 55,721 57,169 81,737 法人税、住民税及び事業税 Current income taxes 15,293 39,716 20,881 18,150 21,741 14,402 18,536 22,125 15,800 28,513 7,778 6,015 3,631 (5,581) 681 (2,879) 1,903 118 3,510 5,826 法人税、住民税及び事業税合計 Total income taxes 23,072 45,732 24,513 12,568 22,423 11,522 20,439 22,243 19,311 34,340 少数株主利益 Minority interests (7,434) (6,722) (5,823) (5,475) (5,721) (1,961) (3,180) (3,248) (2,945) (2,580) 当期純利益(純損失) . Net income (loss) 42,795 48,373 41,754 30,400 16,646 (10,227) 28,229 30,229 34,912 44,817 為替差(損)益 Exchange gains (losses) 関係会社株式評価損 Loss on devaluation of investments in affiliates 有価証券売却(損)益 Gain (loss) on sales of securities 関係会社株式売却益 Gain on sales of shares in affiliated company 法人税等調整額 Deferred income taxes 8 2014 連結包括利益計算書 Consolidated Statements of Comprehensive Income 百万円 ¥ million; Years ended March 31, 2011 through 2014 2014 2013 2012 2011 少数株主損益調整前当期純利益. Income before minority interests 50,230 55,095 47,578 35,876 その他有価証券評価差額金. Unrealized holding gain on securities 3,479 6,363 1,227 1,677 10 (159) (9) 34 14,792 41,462 (14,831) (16,713) 退職給付に係る調整額. Adjustments for retirement benefits 5,650 — — — 在外子会社の年金負債調整額 Adjustment in pension liabilities of overseas subsidiaries — 478 (151) 5 722 1,339 (567) (626) その他の包括利益合計 Total other comprehensive income 24,656 49,485 (14,332) (15,622) 包括利益. Comprehensive income 74,886 104,581 33,245 20,253 親会社株主に係る包括利益 Comprehensive income attributable to Ajinomoto shareholders 67,482 90,761 28,413 16,717 少数株主に係る包括利益 Comprehensive income attributable to minority interests 7,404 13,819 4,831 3,536 繰延ヘッジ損益 Unrealized gain (loss) from hedging instruments 為替換算調整勘定. Translation adjustments 持分法適用会社に対する持分相当額 Share of other comprehensive income of equity-method affiliates (内訳) (Breakdown) 9 連結キャッシュ・フロー計算書 Consolidated Statements of Cash Flows 百万円 ¥ million; Years ended March 31, 2005 through 2014 2014 2013 2012 2011 2010 2009 2008 2007 2006 2005 営業活動によるキャッシュ・フロー Cash flows from operating activities 税金等調整前当期純利益 Income before income taxes and minority interests 73,302 100,828 72,091 48,444 44,791 3,256 51,849 55,721 57,169 81,737 減価償却費 Depreciation and amortization 45,746 42,463 43,717 49,825 55,382 55,192 55,189 45,138 40,341 39,854 624 14,562 1,106 8,503 14,325 18,838 125 1,769 — 6,075 のれん償却額. Amortization of goodwill 1,589 2,265 4,503 4,505 5,000 5,497 4,902 4,650 4,421 4,219 受取保険金 Insurance income (1,189) (1,800) (6,012) (182) — — — — — — 貸倒引当金の増減額(( ):減少額) Increase (decrease) in allowance for doubtful accounts 252 (210) — — — — — — — — 賞与引当金の増減額(( ):減少額) Increase (decrease) in bonus reserve 354 (237) — — — — — — — — 役員賞与引当金の増減額(( ):減少額) Increase (decrease) in bonus reserve for directors and others (5) (16) — — — — — — — — 退職給付引当金の増減額( () :減少額) Increase (decrease) in accrued employees’ retirement benefits — (3,688) 4,095 6,036 4,988 2,134 (6,705) (6,236) (6,326) (6,365) 退職給付に係る負債の増減額 Increase (decrease) in liabilities for retirement benefits (3,005) — — — — — — — — — 役員退職慰労引当金の増減額( () :減少額). Increase (decrease) in allowance for directors’ retirement benefits (103) (240) (314) 220 (204) (638) (572) 500 (255) 273 環境対策引当金の増減額(( ):減少額) Increase (decrease) in provision for environmental measures (38) 52 — — — — — — — — 投資損失引当金の増減額(( ):減少額) Increase (decrease) in provision for allowance of investment loss 152 107 — — — — — — — — 受取利息及び受取配当金 Interest and dividend income (3,196) (2,902) (2,821) (2,171) (2,174) (2,000) (2,685) (2,610) (2,567) (2,537) 支払利息 Interest expense 2,032 1,931 2,167 2,440 3,468 4,774 4,751 5,008 3,292 3,020 持分法による投資利益 Equity in earnings of affiliates (3,360) (3,058) (2,401) (2,990) (3,461) (2,524) (3,541) (3,920) (3,703) (3,263) 関係会社整理損 Loss on liquidation of affiliates — — — — — — 4,137 22 872 — 投資有価証券売却損(益) (Gain) loss on sales of securities (54) 37 (526) (900) (66) 174 (789) (4,092) (1,634) (6,860) 投資有価証券評価損 Loss on devaluation of securities 52 2,346 607 7,416 64 799 84 121 92 104 関係会社株式売却損(益) Loss (gain) on sales of investments in affiliates — — — — — (437) (3,290) (1,188) 319 (4,341) 関係会社株式評価損 Loss on devaluation of investments in affiliates — — 24 — 322 257 905 251 7 0 関係会社株式売却益 Loss (gain) on sales of shares in affiliated company (2,315) (18,201) — — — — — — — — 関係会社清算損益 Gain on liquidation of affiliates (1,005) — — — — — — — — — 有形固定資産の除売却損 Loss (gain) on sales and disposal of tangible fixed assets (1,430) 2,174 — — — — — — — — (236) (27,752) — — — — — — — — 売上債権の増減額( () :増加額). Notes and accounts receivable 2,095 15,158 (14,098) (2,054) (5,340) (3,882) 9,455 (4,598) (1,734) (7,435) 仕入債務の増減額( () :減少額). Notes and accounts payable (6,212) (18,516) 10,562 5,527 4,114 (5,256) (8,359) 8,957 (612) (738) 棚卸資産の増減額(( ):減少額) Decrease (increase) in inventories (1,377) (7,048) — — — — — — — — 減損損失 Loss on impairment of fixed assets 厚生年金基金代行返上益 Loss (gain) on transfer of benefit obligation relating to employees’ pension fund 10 連結キャッシュ・フロー計算書 Consolidated Statements of Cash Flows 百万円 ¥ million; Years ended March 31, 2005 through 2014 2014 2013 2012 2011 2010 2009 2008 2007 2006 2005 未払消費税の増減額(( ):減少額) Increase (decrease) in accrued consumption tax 2,501 1,863 — — — — — — — — その他流動資産の増減額(( ):減少額) Decrease (increase) in other current assets 5,073 1,180 — — — — — — — — その他流動負債の増減額(( ):減少額) Increase (decrease) in other current liabilities (7,727) 6,699 — — — — — — — — 和解金 Settlement package — — — — — — — — — 2,048 課徴金・罰科金 Penalty paid — — — — — — — — — 131 (1,447) (1,518) (12,137) 14,541 2,176 (9,826) (28,779) (5,791) (8,794) (5,175) 101,070 106,480 100,563 139,165 123,387 66,360 76,695 93,700 80,887 100,746 保険金の受取額 Insurance fees received 1,189 2,764 5,087 182 — — — — — — 転籍に伴う退職金等 Retirement benefits for employment transfers paid, etc (3,080) — — — — — — — — — 利息及び配当金の受取額 Interest and dividends received 4,559 3,697 4,166 3,521 3,040 3,164 4,413 3,610 4,375 4,041 利息の支払額 Interest paid (2,034) (1,965) (2,185) (2,518) (3,704) (4,938) (4,580) (3,899) (2,596) (2,887) — — — — — — — (1,993) — (150) (40,214) (22,475) (14,318) (27,633) (16,799) (12,886) (25,092) (15,654) (27,490) (18,855) 1,526 — — — — — — — — — 63,017 88,501 93,312 112,716 105,924 51,699 51,436 75,764 55,174 82,895 有価証券の取得及び売却 Decrease (increase) in marketable securities — — — — — — 0 — — 156 有形固定資産の取得による支出 Acquisition of property, plant and equipment (47,864) (60,691) (45,401) (40,634) (38,273) (56,355) (62,404) (72,201) (62,628) (52,691) 有形固定資産の売却による収入 Proceeds from sales of property, plant and equipment 6,448 1,134 1,412 1,507 494 1,059 7,684 604 9,862 13,883 無形固定資産取得による支出 Acquisition of intangible assets, net of proceeds (5,391) (5,045) (3,659) (3,488) (23,352) (4,679) (3,742) (4,001) (9,317) (4,969) 投資有価証券の取得による支出 Acquisition of investments in securities (62) (324) (214) (1,020) (634) (273) (96) (424) (1,993) (6,088) 投資有価証券の売却による収入 Proceeds from sales of investments in securities 101 241 2,102 3,757 97 135 1,606 8,783 3,521 12,713 7,572 — — — — 480 577 2,742 5 5,952 連結の範囲の変更を伴う子会社株式の取得による支出 Acquisition of subsidiaries’ stock resulting from changes in the scope of consolidation (15,708) — — — — — 26,693 2,299 (19,612) — 連結の範囲の変更を伴う子会社株式の売却による収入 Proceeds from sales of subsidiaries’ stock resulting from changes in the scope of consolidation — 80,890 — — — — 5,501 — 11 — (5,104) (3,650) (1,414) (149) (679) (499) (3,194) (6,400) (2,379) (2,972) 502 1,862 — — — — — — — — (3,942) (108) — — — — — — — — (46) 2,646 5,473 (5,854) (979) (2,355) (917) 685 (1,202) 323 (63,497) 15,201 (41,701) (45,882) (63,327) (62,487) (28,292) (67,911) (83,731) (33,692) その他 Other 小計 Subtotal 和解金の支払額 Settlement package 法人税等の支払額 Income taxes paid 過年度法人税等の還付額 Refund of income taxes for prior periods 営業活動によるキャッシュ・フロー Net cash provided by operating activities 投資活動によるキャッシュ・フロー Cash flows from investing activities 関係会社株式の売却による収入 Proceeds from sales of shares of affiliates 関係会社株式等の取得による支出 Acquisition of shares of affiliates 定期預金の増減額(( ):減少額) Decrease (increase) in term deposits 長期貸付による支出 Payments for long-term loans receivable その他 Other 投資活動によるキャッシュ・フロー Net cash provided by (used in) investing activities 11 連結キャッシュ・フロー計算書 Consolidated Statements of Cash Flows 百万円 ¥ million; Years ended March 31, 2005 through 2014 2014 2013 2012 2011 2010 2009 2008 2007 2006 2005 財務活動によるキャッシュ・フロー Cash flows from financing activities 短期借入金の純増減額( () :減少額) Increase (decrease) in short-term borrowings 376 (6,026) 2,122 6,922 (17,387) 341 3,623 1,277 (2,434) (6,163) — — — — — (5,000) 5,000 (10,000) 10,000 (10,000) 長期借入れによる収入 Proceeds from long-term debt 45,000 115 23 52 17,013 3,034 1,114 14,665 21,383 1,073 長期借入金の返済による支出 Repayment of long-term debt (4,137) (4,344) (5,225) (5,956) (3,208) (2,951) (1,613) (2,509) (3,064) (4,003) — — — — — 34,986 — — — — 社債の償還による支出 Repayment of bonds and convertible bonds (20,000) — — (15,000) — (20,000) (15,000) — (10,000) — 配当金の支払額 Cash dividends paid (12,437) (10,604) (10,997) (11,162) (11,154) (11,172) (10,319) (9,063) (9,073) (7,776) 少数株主への配当支払 Distribution of dividends to minority shareholders (2,840) (2,226) — — — — — — — — 自己株式取得のための金銭の信託の増減額 Decrease (increase) in money held in trusts for repurchase of treasury stock (2,520) — — — — — — — — — (57,584) (50,225) (20,045) (87) (69) (1,107) (905) (439) (301) (450) 2 2 — — — — — — — — (1,108) (1,109) (3,333) (661) (3,204) (252) 509 564 131 (165) (55,248) (74,419) (37,456) (25,893) (18,011) (2,119) (17,592) (5,504) 6,640 (27,486) 958 8,838 (1,356) (2,245) 2,717 (2,824) (3,803) 4,732 3,928 1,474 () :減少額) 現金及び現金同等物の増減額( (Decrease) increase in cash and cash equivalents (54,770) 38,122 12,798 38,695 27,303 (15,732) 1,747 7,080 (17,987) 23,191 現金及び現金同等物の期首残高 Cash and cash equivalents at beginning of year 184,770 146,647 133,744 95,063 67,790 83,164 81,486 75,133 92,980 69,526 連結の範囲の変更による期首残高増加額 Increase due to inclusion of subsidiaries in consolidation — — 0 9 — 358 43 164 140 262 連結の範囲の変更による期首残高減少額 Decrease due to inclusion of subsidiaries in consolidation — — — (23) (30) — (113) (891) — — 非連結子会社との合併に伴う現金及び現金同等物の増加額 Increase in cash and cash equivalents on merger of nonconsolidated subsidiaries 28 — 103 — — — — — — — 130,028 184,770 146,647 133,744 95,063 67,790 83,164 81,486 75,133 92,980 設備投資 Capital expenditures 50,602 61,590 56,778 45,772 44,117 58,293 62,780 76,386 79,162 58,082 減価償却費 Depreciation and amortization 45,746 42,463 43,717 49,825 55,382 55,192 55,189 45,138 40,341 39,854 コマーシャルペーパーの純増減額( () :減少額) Increase (decrease) in commercial paper 社債の発行による収入 Proceeds from bond issuance 自己株式の取得による支出 Acquisition of shares of treasury common stock 自己株式の売却 Sales of treasury stock その他 Other 財務活動によるキャッシュ・フロー Net cash used in (provided by) financing activities 現金及び現金同等物に係る換算差額 Effect of exchange rate changes on cash and cash equivalents 現金及び現金同等物の期末残高 Cash and cash equivalents at end of year 12 セグメント情報(連結) Segment Information (Consolidated) 百万円 ¥ million; Years ended March 31, 2011 through 2014 2014 2013 2012 2011 国内食品 Domestic Food Products 337,533 391,554 428,996 427,707 海外食品 Overseas Food Products 293,237 245,397 230,541 231,990 バイオ・ファイン Bioscience Products and Fine Chemicals 228,528 204,206 198,021 198,291 51,228 71,450 77,922 82,645 72,360 71,728 74,582 事業別セグメント Business Segments 売上高 Net sales: 医薬 Pharmaceuticals その他 Other Business 計 Total 80,804 991,330 984,967 1,007,208 1,015,215 営業利益 Operating income: 国内食品 Domestic Food Products 27,429 32,641 31,705 26,506 海外食品 Overseas Food Products 25,231 20,703 21,545 26,837 バイオ・ファイン Bioscience Products and Fine Chemicals 6,530 14,368 12,159 8,685 医薬 Pharmaceuticals 3,842 3,194 6,488 7,940 その他 Other Business 計 Total (485) 324 687 (594) 62,547 71,230 72,584 69,374 (注1)2014年3月期より提携事業等の総発売元取引について純額で Note 1:For the coffee and edible oils business and some other businesses, the gross figures for sales and cost of goods sales were の計上に変更しています。2011 年 3月期以降の過去数値は純 recorded in the accounts but from the year ended March 31, 2014 this method is changed by netting off sales and cost of goods sold and recording the net figure in the accounts. Post-reclassification basis from the year ended March 31, 2011. 額計上ベースに組替え済みです。 (注2)各事業区分に属する製品の変更 2014年3月期より以下のとおり変更いたしました。 ・医薬の中の医療食: 「医薬」 から 「その他」 に変更 ・提携事業セグメントを廃止し、その他セグメントへ合算 百万円 ¥ million; Years ended March 31, 2009 through 2013 Note 2:Change of product classifications to business segments Changed as follows from the year ended March 31, 2014: ・Medical foods in Pharmaceuticals: From Pharmaceuticals to Other Business ・The Business Tie-Ups segment was eliminated and combined into Other Business 2013 2012 2011 2010 2009 事業別セグメント(2013 年 3 月期まで) Business Segments (To the Year Ended March 31, 2013) 売上高 Net sales: 国内食品 Domestic Food Products 401,183 438,423 437,838 436,021 453,436 海外食品 Overseas Food Products 245,397 230,541 231,990 214,613 199,038 バイオ・ファイン(旧アミノ酸) Bioscience Products and Fine Chemicals (former Amino Acids) 204,206 198,021 198,291 193,553 199,734 医薬 Pharmaceuticals 71,450 77,922 82,645 82,594 85,751 180,079 182,830 184,574 180,435 189,520 70,126 69,574 72,354 63,657 62,890 国内食品 Domestic Food Products 32,641 31,705 26,506 24,311 14,407 海外食品 Overseas Food Products 20,703 21,545 26,837 25,465 11,197 バイオ・ファイン(旧アミノ酸) Bioscience Products and Fine Chemicals (former Amino Acids) 14,368 12,159 8,685 5,252 5,072 医薬 Pharmaceuticals 3,194 6,488 7,940 12,353 14,526 提携事業(新設)Business Tie-Ups (new) 1,585 1,618 1,594 1,648 1,784 その他 Other Business (1,261) (931) (2,190) (4,996) (6,160) 提携事業(新設)Business Tie-Ups (new) その他 Other Business 営業利益 Operating income: Note:Changes of product classifications to business segments (注)各事業区分に属する製品の変更 Changed as follows from the year ended March 31, 2010: 2010年3月期より以下のとおり変更いたしました。 ・Umami seasonings for processed food manufacturers: From Amino Acids to Overseas Food Products ・加工用うま味調味料: 「アミノ酸」 から 「海外食品」 に変更。 Changed as follows from the year ended March 31, 2011: 2011年3月期より以下のとおり変更いたしました。 ・Health and nutrition business: from Domestic Food Products to Other ・健康事業: 「国内食品」 から 「その他」 に変更。 ・Edible oils and coffee products: from Domestic Food Products to Business Tie-Ups ・油脂・コーヒー類: 「国内食品」 から 「提携事業」 に変更。 ・Functional foods: from Amino Acids to Other ・健康栄養: 「アミノ酸」 から 「その他」 に変更。 ・Medical foods: from Pharmaceuticals to Other ・医療用食品: 「医薬」 から 「その他」 に変更。 Changed as follows from the year ended March 31, 2012: 2012年3月期より以下のとおり変更いたしました。 ・Domestic retail sweetener: from Domestic Food Products to Bioscience Products and Fine Chemicals ・国内リテール甘味料: 「国内食品」 から 「バイオ・ファイン」 に変更。 ・amino VITAL: from Domestic Food Products to Other Business ・国内 「アミノバイタル」 : 「国内食品」 から 「その他」 に変更。 ・Adjustment amount: allocated to each segment ・ 「調整額」:各セグメントに配賦。 Changes in product classifications for the years ended March 31, 2010, 2011 and 2012 are reflected in all of the above figures. 3年分の変更を上記数値に全て反映しております。 13 セグメント情報(連結) Segment Information (Consolidated) 百万円 ¥ million; Years ended March 31, 2005 through 2009 2009 2008 2007 2006 2005 国内食品 Domestic Food Products 653,921 632,719 617,172 608,573 598,888 海外食品 Overseas Food Products 148,768 155,509 127,723 99,588 80,825 アミノ酸 Amino Acids 246,901 286,042 271,417 255,794 251,646 事業別セグメント(2009 年 3 月期まで) Business Segments (To the Year Ended March 31, 2009) 売上高 Net sales: 医薬 Pharmaceuticals 85,751 84,074 83,325 83,227 80,736 その他 Other Business 55,028 58,226 58,870 59,623 60,913 国内食品 Domestic Food Products 16,995 15,746 27,705 31,802 30,317 海外食品 Overseas Food Products 11,519 14,947 10,156 5,018 2,986 9,482 19,156 14,980 14,819 29,106 営業利益 Operating income: アミノ酸 Amino Acids 医薬 Pharmaceuticals 13,653 14,947 15,774 12,578 11,399 その他 Other Business 2,409 2,805 2,874 3,267 3,635 (注)各事業区分に属する製品の変更 2006年3月期より社内カンパニー制の再編にともない、各事業区分に属する製品 を見直し、以下のとおり変更いたしました。 ・ 親会社輸出品: 「国内食品」 から 「海外食品」 に変更。 ・ 海外冷凍食品: 「海外食品」 から 「国内食品」 に変更。 ・ 加工用うま味調味料、海外 「アミノバイタル」 、海外サービスの一部: 「海外食品」 から 「アミノ酸」 に変更。 ・ 健康事業: 「消去又は全社」 から 「国内食品」 に変更。 百万円 ¥ million; Year ended March 31, 2005 Note:Changes of product classifications to business segments From the year ended March 31, 2006, Ajinomoto Co., Inc. has reorganized its internal company system. Accordingly, product classifications to business segments have been reclassified as follows. ・Food products exported by Ajinomoto Co., Inc.: from Domestic Food Products to Overseas Food Products ・Overseas frozen food business: from Overseas Food Products to Domestic Food Products ・Umami seasonings for processed food manufacturers, overseas amino VITAL and part of overseas services: from Overseas Food Products to Amino Acids ・Health and nutrition business: from Corporate to Domestic Food Products 2005 事業別セグメント(2005 年 3 月期まで) Business Segments (To the Year Ended March 31, 2005) 売上高 Net sales: 国内食品 Domestic Food Products 597,758 海外食品 Overseas Food Products 160,406 アミノ酸 Amino Acids 173,195 医薬 Pharmaceuticals 80,736 その他 Other Business 60,913 営業利益 Operating income: 14 国内食品 Domestic Food Products 32,203 海外食品 Overseas Food Products 4,490 アミノ酸 Amino Acids 26,681 医薬 Pharmaceuticals 11,399 その他 Other Business 3,635 セグメント情報(連結) Segment Information (Consolidated) 百万円 ¥ million; Years ended March 31, 2011 through 2014 2014 2013 2012 2011 514,048 577,458 624,809 638,332 所在地別セグメント. Geographical Segments 売上高 Net sales: 日本 Japan アジア Asia 231,143 194,846 177,977 174,836 米州 Americas 139,287 117,483 114,084 113,556 欧州 Europe 106,853 95,178 90,338 88,491 33,163 34,350 35,557 32,270 24,999 22,105 21,585 21,226 4,282 9,285 8,888 7,551 102 5,491 6,554 8,327 営業利益 Operating income: 日本 Japan アジア Asia 米州 Americas 欧州 Europe (注1)日本以外の区分に属する主な国又は地域 アジア :東アジア及び東南アジア諸国 米州 :北米及び南米諸国 欧州 :ヨーロッパ諸国及びアフリカ諸国 (注2)2012年3月期より当社の管理部門にかかる費用及び一部 の研究費用等は、 「地域外」 ではなく各セグメントに配賦。 百万円 ¥ million; Years ended March 31, 2005 through 2011 Note 1:Main countries and regions in geographical segments other than Japan Asia : Countries of East and Southeast Asia Americas : Countries of North and South America Europe : Countries of Europe and Africa Note 2:From the year ended March 31, 2012, expenses of administrative departments and certain research and development expenses are allocated to each segment instead of “Other.” 2011 2010 2009 2008 2007 2006 2005 所在地別セグメント(2011 年 3 月期まで). Geographical Segments (To the Year Ended March 31, 2011) 売上高 Net sales: 日本 830,810 812,456 843,395 832,330 813,769 804,634 793,652 アジア Asia 174,836 159,795 151,063 159,232 134,802 118,256 102,075 米州 Americas 113,556 105,437 106,511 109,886 92,598 76,734 69,487 欧州 Europe 88,491 93,187 89,400 115,123 117,338 107,181 107,794 32,522 29,353 26,913 31,027 43,130 43,675 42,125 Japan 営業利益 Operating income: 日本 Japan アジア Asia 26,371 26,164 16,042 13,390 11,024 5,550 9,388 米州 Americas 10,314 8,458 8,621 9,408 5,577 4,373 11,629 欧州 Europe 10,458 8,071 1,777 6,696 4,067 6,722 7,773 (10,293) (8,014) (12,527) — — — — 地域外 Other (注)2009 年 3 月期より当社の管理部門にかかる費用及び一部の 研究費用等は、 「日本」 ではなく 「地域外」 に計上。 Note: From the year ended March 31, 2009, expenses of administrative departments and certain research and development expenses are recorded in “Other” instead of “Japan.” 15 退職給付関係 Retirement Benefit Plans 採用している退職給付制度の概要: 当社及び国内連結子会社は、確定給付型の制度として、企業年金基金制度、厚生年金基金制度及び退職一時金制度を設けており、一部の連結子会社 が有する確定給付制度においては、簡便法により退職給付に係る負債及び退職給付費用を計算しております。また、当社及び一部の連結子会社では 確定給付型の制度の他、確定拠出型の制度を設けております。 なお、当社は、確定給付企業年金法に基づき、厚生年金基金の代行部分について、平成24年9月1日に厚生労働大臣から過去分返上の認可を受け、 2013年度に国に返還額 (最低責任準備金) の納付を行いました。 Description of retirement benefit system used: The Company and its domestic consolidated subsidiaries have defined benefit plans, i.e., corporate pension fund plans, welfare pension fund plans and lump-sum payment plans. Some consolidated subsidiaries use the simplified method for the calculation of liabilities for retirement benefits and retirement benefit cost. The Company and certain consolidated subsidiaries have defined contribution plans in addition to defined benefit plans. On September 1, 2012, the Company received approval from the Minister of Health, Labour and Welfare of Japan for an exemption from the obligation to pay benefits related to past services of employees under the substitutable portion of the Ajinomoto Employees’ Welfare Pension Fund in connection with the enforcement of the Defined-Benefit Corporate Pension Law. The Company refunded the minimum reserve during the year ended March 31, 2014. (注) 「退職給付に関する会計基準」 (企業会計基準第26号 平成24年5月17日。 「退職給付に関する会計基準の適用指針」 (企業会計基準適用指針第25号 平成24年5月17日) の適用に伴い、 2013年度 より新たな注記項目の記載が必要となりました。 連結財務諸表に含まれる比較情報 (前年情報) については、 「財務諸表等の用語、様式及び作成方法に関する規則等の一部を改正する内閣府令」 (平成24年9月21日内閣府令第61号) 附則第3条第2 項により、改正前の連結財務諸表規則に基づいて作成しております。 Note:With the adoption of the Accounting Standard for Retirement Benefits (Accounting Standards Board of Japan (ASBJ) Statement No. 26 of May 17, 2012) and the Guidance on Accounting Standard for Retirement Benefits (ASBJ Guidance No. 25 of May 17, 2012), disclosure of a new note became necessary from the year ended March 31, 2014. Pursuant to Article 3, paragraph 2 of the Supplementary Provisions of the Cabinet Office Ordinance Partially Amending the Regulations Concerning the Terminology, Forms and Preparation Methods of Financial Statements (Cabinet Office Ordinance No. 61 of September 21, 2012), comparative information (previous-year information) included in the consolidated financial statements is prepared in accordance with the Regulations for Consolidated Financial Statements before the amendment. 確定給付制度 Defined Benefit Plans 百万円 ¥ million; Year ended March 31 退職給付債務の期首残高と期末残高の調整表 Changes of beginning and ending balances of retirement benefit obligation 退職給付債務の期首残高 Beginning balance of retirement benefit obligation 2014 263,769 勤務費用 Service cost 7,004 利息費用 Interest cost 2,732 数理計算上の差異の発生額 Actuarial gain or loss 退職給付の支払額 Payment of retirement benefits 厚生年金基金の代行返上による減少額 Decrease due to transfer of benefit obligation relating to welfare pension fund その他 Other 退職給付債務の期末残高 Ending balance of retirement benefit obligation 年金資産の期首残高と期末残高の調整表 Changes of beginning and ending balances of plan assets 年金資産の期首残高 Beginning balance of pension assets 2,197 (12,331) (21,309) 667 242,729 190,682 期待運用収益 Expected return on plan assets 4,202 数理計算上の差異の発生額 Actuarial gain or loss 事業主からの拠出額 Contributions by the Company 6,348 退職給付の支払額 Payment of retirement benefits 厚生年金基金の代行返上による減少額 Decrease due to transfer of benefit obligation relating to welfare pension fund その他 Other 年金資産の期末残高 Ending balance of pension assets 12,051 (11,914) (21,073) 927 181,223 退職給付債務及び年金資産の期末残高と連結貸借対照表に計上された退職給付に係る負債及び退職給付に係る資産の調整表 Reconciliation of the ending balance of retirement benefit obligation and pension assets, and the book value of liabilities and assets for retirement benefits 積立型制度の退職給付債務 233,713 Funded retirement benefit obligation (181,223) 年金資産 Pension assets 非積立型制度の退職給付債務 Unfunded retirement benefit obligation 連結貸借対照表に計上された負債と資産の純額 Net amount of liabilities and assets in consolidated balance sheet 退職給付に係る負債 Liabilities for retirement benefits 退職給付に係る資産 Assets for retirement benefits 連結貸借対照表に計上された負債と資産の純額 Net amount of liabilities and assets in consolidated balance sheet (注) 厚生年金基金の代行部分を含めて記載しております。 16 9,016 61,505 61,845 (339) 61,505 Note: The public portion of welfare pension fund plans is included. 退職給付関係 Retirement Benefit Plans 百万円 ¥ million; Year ended March 31 2014 退職給付費用及びその内訳項目の金額 Retirement benefit costs and other details 勤務費用 Service cost 7,004 利息費用 Interest cost 2,732 期待運用収益 Expected return on plan assets 過去勤務費用の費用処理額 Amortization of prior service cost 数理計算上の差異の費用処理額 Amortization of actuarial gain or loss (4,202) (1,478) 5,106 その他 Other 確定給付制度に係る退職給付費用 Retirement benefit costs for defined benefit plans 74 9,237 (注1) 厚生年金基金に対する従業員拠出額を控除しております。 (注2) 簡便法を採用している連結子会社の退職給付費用は 「勤務費用」 に計上しております。 (注3) 上記のほか、最低責任準備金返納により、236百万円を特別利益に計上しております。 Note 1:Employee contributions to welfare pension fund are not included in the amounts shown. Note2:Retirement benefit costs at consolidated subsidiaries using the simplified method are recorded in “Service cost.” Note3:In addition to the above, other income of ¥236 million ($2,296 thousand) is recorded due to refunding the minimum reserve. 退職給付に係る調整額 Adjustments for retirement benefits included in other comprehensive income 過去勤務費用 Prior service cost (1,454) 数理計算上の差異 Actuarial gain or loss 9,283 合計 Total 7,829 退職給付に係る調整額累計 Adjustments for retirement benefits included in accumulated other comprehensive income 未認識過去勤務費用 (712) Unrecognized prior service cost 未認識数理計算上の差異 (26,386) Unrecognized actuarial gain or loss (27,098) 合計 Total 年金資産に関する事項 Pension assets ① 年金資産の主な内訳(%) ① Details of main pension assets (%) 債権 Fixed income securities 50 株式 Equity securities 生命保険一般勘定 Insurance company general accounts 現金及び預金 Cash and deposits 24 19 1 その他 Other 6 合計 Total 100 ② 長期期待運用収益率の設定方法 年金資産の長期期待運用収益率を決定するため、現在および予想さ れる年金資産の配分と、年金資産を構成する多様な資産からの現在 及び将来期待される長期の収益率を考慮しております。 ② Long-term expected rate of return on plan assets Long-term expected rate of return on plan assets is determined considering the pension asset allocation and long-term expected return on plan assets composed of various kinds of assets, at the present and in the future. ③ 数理計算上の計算基礎に関する事項 ③ Basis of actuarial calculation 割引率 Discount rate 長期期待運用収益率 Long-term expected return on plan assets 主として 1.1% Mainly 1.1% 主として 2.5% Mainly 2.5% 確定拠出制度 当社及び連結子会社の確定拠出制度への要拠出額は、960 百万円で あります。 Defined contribution plans The Company and its consolidated subsidiaries were obligated to contribute ¥960 million ($9,336 thousand) to the plan for the year ended March 31, 2014. 17 退職給付関係 Retirement Benefit Plans 百万円 ¥ million; Years ended March 31, 2010 through 2013 退職給付債務に関する事項 . Retirement benefit obligation 退職給付債務 Retirement benefit obligation 年金資産 Plan assets at fair value 未積立退職給付債務 Unfunded retirement benefit obligation 未認識数理計算上の差異 Unrecognized actuarial gain or loss 未認識過去勤務債務 Unrecognized prior service cost 連結貸借対照表計上額純額 Net accrued retirement benefits reflected in consolidated balance sheets 前払年金費用 Prepaid pension expenses 退職給付引当金 Accrued retirement benefits (注1)厚生年金基金の代行部分を含めて記載しております。 (注2)一部の連結子会社は、退職給付債務の算定にあたり、簡便法を採用しております。 退職給付費用に関する事項. Retirement benefit expenses 勤務費用 ※1 ※2 Service cost*1*2 利息費用 Interest cost 期待運用収益 Expected return on plan assets 過去勤務債務の費用処理額 Amortization of prior service cost 数理計算上の差異の費用処理額 Amortization of actuarial gain or loss 臨時に支払う割増退職金 Extraordinary additional retirement benefit payments 制度終了等に伴う費用 Expenses due to termination of system その他 Other 合計 Total ※1 厚生年金基金に対する従業員拠出額を控除しております。 ※2 簡便法を採用している連結子会社の退職給付費用は、 勤務費用に計上しております。 (注1)確定拠出年金への掛金支払額は、その他に計上しております。 (注2)上記のほか、厚生年金基金代行部分の過去分返上の認可を受けたことにより、 代行返上益27,752百万円を特別利益に計上しております。 退職給付債務等の計算の基礎に関する事項. Items related to basis of calculation of retirement benefit obligation 割引率 Discount rates 期待運用収益率 Expected return on assets 退職給付見積額の期間配分方法 Periodic allocation method for projected benefits 過去勤務債務の額の処理年数 Years over which prior service cost is amortized 数理計算上の差異の処理年数 Years over which actuarial gain or loss is amortized ※1 発生時の従業員の平均残存勤務期間以内の一定年数による定額法によります。 2013 2012 2011 2010 (253,842) (267,443) (276,532) (274,747) 190,682 184,432 184,329 187,064 (63,159) (83,010) (92,202) (87,682) 34,924 34,131 39,738 44,702 (497) (13,080) (5,207) (8,869) (28,732) (61,959) (57,671) (51,850) 64 1,002 882 773 (28,796) (62,962) (58,554) (52,623) Note 1: Includes public portion of welfare pension fund plans. Note 2: Some consolidated subsidiaries use the simplified method in calculating the retirement benefit obligation. 6,054 6,349 6,328 5,862 5,291 6,335 6,673 6,549 (4,068) (4,691) (4,764) (6,139) (2,262) (3,256) (2,172) (2,321) 5,443 9,411 9,826 10,115 — — — — — — — — 480 474 734 411 10,938 14,623 16,627 14,478 Employee contributions to the welfare pension fund are not included in the amounts shown. *12 Retirement expenses at consolidated subsidiaries using the simplified method are recorded in Service cost. *Note 1: Paymentsbenefit into defined contribution pension funds are recorded in Other. Note 2: In addition to the above, an extraordinary gain of ¥27,752 million is recorded due to recognition of prior return of the substitutional portion of the welfare pension fund. 主として1.5% Mainly 1.5% 主として2.5% Mainly 2.5% 期間定額基準 主として2.5% Mainly 2.5% 主として2.5% Mainly 2.5% 期間定額基準 主として2.5% Mainly 2.5% 主として2.5% Mainly 2.5% 期間定額基準 主として2.5% Mainly 2.5% 主として3.5% Mainly 3.5% 期間定額基準 Straight-line standard Straight-line standard Straight-line standard Straight-line standard 主として10年※1 主として10年※1 主として10年※1 主として10年※1 Mainly 10 years*1 Mainly 10 years*1 Mainly 10 years*1 Mainly 10 years*1 主として10年※2 主として10年※2 主として10年※2 主として10年※2 Mainly 10 years*2 Mainly 10 years*2 Mainly 10 years*2 Mainly 10 years*2 using the straight-line method over the certain years within the average remaining years of service at the time of occurrence. *※12 Amortized 各連結会計年度の発生時における従業員の平均残存勤務期間以内の一定の年数による定額法により按分した額をそれぞれ発生の翌連結会計年度から費用処理しております。 *2 Amortized on a straight-line basis over the certain years within the average remaining years of service of employees, allocated proportionately starting from the year following the respective fiscal year of occurrence. 18 株式情報 Common Stock Information Years ended March 31, 2005 through 2014 株価の推移 Common Stock Price Trends 株価 Common Stock Price (年度末 / 円 / 終値) (Year-end / ¥ / Close) 最 高 High 最 低 Low 発行済株式数(千株) 2014 2013 2012 2011 2010 2009 2008 2007 2006 2005 1,475 1,415 1,038 867 926 695 1,010 1,356 1,257 1,308 1,594 1,236 1,416 1,018 1,047 847 953 729 969 680 1,125 625 1,538 1,003 1,640 1,195 1,340 1,080 1,370 1,151 614,116 635,011 678,981 700,033 700,033 700,033 700,033 649,982 649,982 649,982 Outstanding shares (thousand shares) 時価総額(百万円)※ 905,821 898,540 704,782 606,928 648,230 486,523 707,033 881,375 817,027 850,176 Market capitalization (¥ million)* ※ 時価総額は年度末株価を基に算出しております。 * Market capitalization is calculated at the end of the fiscal year. 1 株当たり配当金(円) Dividends per share (¥) 配当性向 Payout ratio (%) (単体/ 2,000 Non-consolidated) 20.0 18.0 16.0 16.0 16.0 16.0 16.0 15.0 14.0 13.0 46.2 31.1 57.5 99.7 — — 90.2 49.4 52.1 31.3 株価(円) Common stock price range (¥) Common stock price range (¥) Tokyo Price Index Close Common stock price range (¥) Tokyo Price Index Close 1,600 2,000 1,200 1,600 800 1,200 400 800 400 出来高(百万株) Monthly trading volume (million shares) 140 120 140 100 120 80 100 60 80 40 60 20 40 0 20 FY2009 FY2010 FY2011 FY2012 FY2013 FY2010 FY2011 FY2012 FY2013 0 FY2009Bonds 社債 Corporate 発行年月日 /Date of Issue 第18回無担保社債 平成15年6月10日 第19回無担保社債 平成20年9月17日 第20回無担保社債 平成20年9月17日 Straight Bond #18 Straight Bond #19 Straight Bond #20 June 10, 2003 September 17, 2008 September 17, 2008 券面総額 /Total Par Value ( 百万円 /¥ million) 利率 /Coupon 15,000 0.710 15,000 1.370 20,000 1.890 (%) 償還期限 /Maturity 平成27年6月10日 June 10, 2015 平成26年9月17日 September 17, 2014 平成32年9月17日 September 17, 2020 19 会社概況 Corporate Data 2014年3月31日現在 As of March 31, 2014 味の素株式会社/Ajinomoto Co., Inc. 本社:〒104-8315 東京都中央区京橋一丁目15番1号 Corporate Headquarters: 15-1, Kyobashi 1-chome, Chuo-ku, Tokyo 104-8315, Japan 資本金:79,863百万円 Paid-in Capital: ¥79,863 million 株主数:58,055名 Number of Shareholders: 58,055 創業年月日:1909年5月20日 Date of Foundation: May 20, 1909 上場証券取引所:東京証券取引所市場一部 Listings: Tokyo Stock Exchange 設立年月日:1925年12月17日 Date of Incorporation: December 17, 1925 証券コード:2802 Ticker Code: 2802 従業員数:27,579名(連結) Number of Employees: 27,579 (consolidated basis) 名義書換代理人:三菱 UFJ 信託銀行株式会社 Shareholder registrar: Mitsubishi UFJ Trust and Banking Corporation 決算期:各年4月1日 — 各年3月31日 Fiscal Year: April 1 — March 31 発行可能株式総数:1,000,000,000株 Number of Shares Authorized to be Issued by the Company: 1,000,000,000 shares 発行済株式総数:614,115,654株 Number of Shares Issued and Outstanding: 614,115,654 shares 大株主 Major Shareholders 本冊子についてのお問合せ先: 財務部IRグループ 〒104-8315 東京都中央区京橋一丁目15番1号 TEL: (03) 5250-8291 FAX: (03) 5250-8378 For further information about this document, please contact the following: Investor Relations, Finance Dept. 15-1, Kyobashi 1-chome, Chuo-ku, Tokyo 104-8315, Japan TEL: 81 (3) 5250-8291 FAX: 81 (3) 5250-8378 持株比率 Equity Position ①日本マスタートラスト信託銀行株式会社(信託口)................. The Master Trust Bank of Japan, Ltd. (trust account)..................... 7.68% ②日本トラスティ・サービス信託銀行株式会社(信託口)........... Japan Trustee Services Bank, Ltd. (trust account).......................... 4.53 ③第一生命保険株式会社............................................................ The Dai-ichi Life Insurance Company, Limited............................... 4.27 ④日本生命保険相互会社............................................................ NIPPON LIFE INSURANCE COMPANY.............................................. 4.19 ⑤株式会社三菱東京UFJ銀行.................................................... The Bank of Tokyo-Mitsubishi UFJ, Ltd........................................... 3.28 ⑥明治安田生命保険相互会社.................................................... Meiji Yasuda Life Insurance Company............................................ 2.06 ⑦三菱UFJ信託銀行株式会社.................................................... Mitsubishi UFJ Trust and Banking Corporation............................... 1.88 ⑧GIC PRIVATE LIMITED........................................................ GIC PRIVATE LIMITED..................................................................... 1.73 ⑨株式会社みずほ銀行................................................................ Mizuho Bank, Ltd. ......................................................................... 1.64 ⑩ステート ストリート バンク ウェスト クライアント トリーティー...... State Street Bank West Client-Treaty............................................. 1.36 合計............................................................................................... Total.............................................................................................. 32.61 株主構成 Distribution of Shareholders % 金融機関.................................................................................... Financial institutions...................................................................... 43.9% 金融商品取引業者..................................................................... Financial instruments businesses ................................................. 2.0 事業会社・その他法人............................................................... Domestic companies..................................................................... 5.2 外国法人・外国人....................................................................... Foreign investors........................................................................... 27.9 個人・その他.............................................................................. Individuals and others .................................................................. 21.0 合計............................................................................................ Total ............................................................................................. 100.00 20 〒104-8315 東京都中央区京橋一丁目15番1号 15-1, Kyobashi 1-chome, Chuo-ku, Tokyo 104-8315, Japan TEL: 81 (3) 5250-8111 FAX: 81 (3) 5250-8378 URL:(和文版) http://www.ajinomoto.co.jp/ (English) http://www.ajinomoto.com/ July 2014
© Copyright 2026 Paperzz