ONLINE ISSN 2189-8871
TECHNICAL REPORTS OF THE METEOROLOGICAL RESEARCH INSTITUTE No. 76
Contribution of JMA to the WMO Technical Task Team
on Meteorological Analyses for Fukushima Daiichi
Nuclear Power Plant Accident and Relevant Atmospheric
Transport Modeling at MRI
BY
K. Saito, T. Shimbori, R. Draxler, T. Hara, E. Toyoda, Y. Honda,
K. Nagata, T. Fujita, M. Sakamoto, T. Kato, M. Kajino, T.T. Sekiyama,
T.Y. Tanaka, T. Maki, H. Terada, M. Chino, T. Iwasaki, M.C. Hort,
S.J. Leadbetter, G. Wotawa, D. Arnold, C. Maurer, A. Malo, R. Servranckx
and P. Chen
気象研究所技術報告
第 76 号
WMO福
福島第一原発事故に関する気象解析技術タスク
チーム活
活動と気象研究所の大気拡散モデリング
斉藤和雄・
・新堀敏基・
・R. Draxler
原旅人・豊田英司・
・本田有機・
・永田和彦・
・藤田司・
・坂本雅巳
巳
加藤輝之・
・梶野瑞王・関山剛・田中泰宙・眞木貴史
寺田宏
宏明・
・茅野政
政道・
・岩崎俊樹
M.C. Hort, S.J. Leadbetter, G. Wotawa, D. Arnold, C. Maurer,
A. Malo, R. Servranckx, P. Chen
気 象 研 究 所
METEOROLOGICAL RESEARCH INSTITUTE, JAPAN
OCTOBER 2015
METEOROLOGICAL RESEARCH INSTITUTE
Established in 1946
Director-General: Dr. Masashi Nagata
Senior Director for Research Affairs: Dr. Masafumi Kamachi
Senior Director for Research Coordination: Mr. Yoshiaki Takeuchi
Forecast Research Department
Climate Research Department
Typhoon Research Department
Atmospheric Environment and
Applied Meteorology Research Department
Meteorological Satellite and
Observation System Research Department
Seismology and Tsunami Research Department
Volcanology Research Department
Oceanography and Geochemistry Research Department
Director: Dr. Kazuo Saito
Director: Dr. Tomoaki Ose
Director: Mr. Isao Takano
Director: Dr. Izuru Takayabu
Director: Dr. Satoru Tsunomura
Director: Dr. Kenji Maeda
Director: Dr. Hitoshi Yamasato
Director: Dr. Tsurane Kuragano
1-1 Nagamine, Tsukuba, Ibaraki, 305-0052 Japan
TECHNICAL REPORTS OF THE METEOROLOGICAL RESEARCH INSTITUTE
Editor-in-chief:
Editors:
Tomoaki Ose
Wataru Mashiko
Masayoshi Ishii
Makoto Deushi
Toshiharu Izumi
Akimichi Takagi
Hideyuki Nakano
Managing Editors: Sadao Saito, Keiko Ono
Masahiro Sawada
Kazuhiro Kimura
The Technical Reports of the Meteorological Research Institute has been issued at irregular intervals by the Meteorological
Research Institute (MRI) since 1978 as a medium for the publication of technical report including methods, data and results of
research, or comprehensive report compiled from published papers. The works described in the Technical Reports of the MRI
have been performed as part of the research programs of MRI.
©2015 by the Meteorological Research Institute.
The copyright of reports in this journal belongs to the Meteorological Research Institute (MRI). Permission is granted to use
figures, tables and short quotes from reports in this journal, provided that the source is acknowledged. Republication,
reproduction, translation, and other uses of any extent of reports in this journal require written permission from the MRI.
In exception of this requirement, personal uses for research, study or educational purposes do not require permission from
the MRI, provided that the source is acknowledged.
気象研究所技術報告 第76号 平成27年10月
TECHNICAL REPORTS OF THE METEOROLOGICAL
RESEARCH INSTITUTE No.76, October 2015
doi:10.11483/mritechrepo.76
Contribution of JMA to the WMO Technical Task Team
on Meteorological Analyses for Fukushima Daiichi
Nuclear Power Plant Accident and Relevant Atmospheric
Transport Modeling at MRI
by
Kazuo Saito and Toshiki Shimbori
Meteorological Research Institute, Japan Meteorological Agency
Roland Draxler
Air Resource Laboratory, National Oceanic and Atmospheric Administration, USA
Tabito Hara, Eizi Toyoda, Yuki Honda, Kazuhiko Nagata, Tsukasa Fujita
and Masami Sakamoto
Japan Meteorological Agency
Teruyuki Kato, Mizuo Kajino, Tsuyoshi T. Sekiyama, Taichu Y. Tanaka
and Takashi Maki
Meteorological Research Institute, Japan Meteorological Agency
Hiroaki Terada and Masamichi Chino
Japan Atomic Energy Agency
Toshiki Iwasaki
Tohoku University
Matthew C. Hort and Susan J. Leadbetter
Met Office, United Kingdom
Gerhard Wotawa, Delia Arnold and Christian Maurer
Central Institute for Meteorology and Geodynamics, Austria
Alain Malo and Rene Servranckx
Canadian Meteorological Centre
Peter Chen
World Meteorological Organization
Contents
A
Preface
1
B
Overview
3
B-1
Overview of the WMO Task Team
3
B-2
Task Team meetings
5
B-3
Overview of JMA's contribution to the WMO Task Team
9
B-4
Offer of data
13
JMA data and meteorological analyses
14
C-1
Observation data of JMA
14
C-2
NWP system at JMA
18
C-3
Data configurations of JMA mesoscale analysis
22
C
C-4
C-5
Quantitative Precipitation Estimation (QPE) and Quantitative
Precipitation Forecasting by JMA
GRIB2 templates for JMA Radar/Rain gauge-Analyzed Precipitation
data
24
39
C-6
Radar / Rain gauge-Analyzed Precipitation dataset by JMA
51
C-7
File converter tool
56
C-8
JMA Meso-scale 4D-VAR analysis
65
C-9
Meteorological field
68
ATDM experiments
73
D-1
Design of the Task Team experiment
73
D-2
Reverse estimation of amounts of 131I and 137Cs discharged into the
atmosphere
77
D-3
Verification methods
81
D-4
The NOAA ARL website
84
D-5
Task team final report and follow-up
88
JMA-RATM
89
E-1
Original and preliminary RATM
89
E-2
Revision of RATM
95
E-3
Experiments with RATM
97
D
E
F
F-1
ATDM simulations by TT members
108
The NOAA ATDM experiments
108
i
F-2
The Met Office ATDM experiments
110
F-3
Impact of different meteorological input on ATM with FLEXPART
113
F-4
The CMC ATDM experiments
119
F-5
Results of ATDM simulations
122
Relevant modeling at MRI and JMA
126
Numerical Atmospheric Transport and Dispersion Models
126
G
G-1
G-2
G-3
WMO emergency response activities and the operational
atmospheric transport modelling at JMA
NHM-Chem: Sensitivity of Cs deposition to the size and
hygroscopicity of Cs-bearing aerosols
127
133
G-4
NHM-Chem-LETKF
143
G-5
Emission source estimation by an inverse model
150
G-6
Science Council of Japan atmospheric transport model
intercomparison
154
H
References
159
I
Appendix
172
I-1
Final report of the first meeting of WMO Task Team
174
I-2
Final report of the second meeting of WMO Task Team
201
I-3
Final report of the third meeting of WMO Task Team
215
total
225
ii
序
2011 年 3 月 11 日の東北地方太平洋沖地震は、マグニチュード Mw9.0 という日本観測史
上最大の超巨大地震であった。この地震動と津波は未曾有とも言える甚大な被害を東日本の
各地にもたらした。東京電力福島第一原子力発電所では、国際原子力事象評価尺度 (INES)
でレベル 7 に分類される深刻な事故が発生し、大量の放射性物質が大気と海洋に放出された。
気象庁は、環境緊急対応(Environmental Emergency Response: EER)地区特別気象セン
ター(Regional Specialized Meteorological Center: RSMC)として、国際原子力機関
(IAEA)の要請に応じて、事故直後から大気中に放出された放射性物質の拡散予測情報を作
成し、5 月 23 日まで提供した。この業務は世界気象機関(WMO)の「全球データ処理・予報
システムに関するマニュアル」に基づくもので、気象庁予報部数値予報課が中心となって行
われる。全球大気移流拡散数値モデルを用いて行うため、約 100km 四方の格子を一単位と
する分解能となっており、放射性物質の放出条件も単純なものが仮定されているため、日本
国内での放射性物質の拡散・沈着を予測・推定するためのものではない。
上記の気象庁の正式業務としての環境緊急対応とは別に、2011 年 8 月に WMO から気象
庁長官宛に福島第一原子力発電所事故に関する気象データと解析に関する協力要請があった。
こ の 要 請 は 、 原 子 放 射 線 の 影 響 に 関 する国連科学委員会( United Nations Scientific
Committee on the Effects of Atomic Radiation=UNSCEAR)が作成する福島第一原発事故
に関する評価報告書に関して UNSCEAR が WMO に対し行った気象解析に関する協力要請
に基づくものであった。気象庁では、総務部企画課国際室、予報部(業務課、数値予報課)
と気象研究所で対応を協議し、WMO が設置するタスクチームに気象研究所からメンバーを
出すとともに、予報部数値予報課が中心となって事故期間中の気象庁メソ解析や解析雨量の
データを WMO の国際気象通報式で用いられている標準書式である二進形式格子点資料気象
通報式(第 2 版)(GRIB2)に変換し、関連ツールの整備を行った。気象庁が行った WMO
タスクチームに関わる活動とその背景は、気象研究所と気象庁数値予報課のスタッフが主な
著者となって気象庁業務に関する刊行物である「測候時報」に 2014 年 6 月にまとまられて
いる。タスクチーム活動に関連して行われた気象庁領域拡散モデルの改良の一部は、気象庁
のオキシダント予測業務及び降灰予報業務の改善にも貢献した。
本技術報告は、タスクチーム活動に係る気象庁の貢献について技術的な部分を中心により
詳細に英文で記述するとともに、タスクチームメンバーや WMO 事務局、日本原子力研究開
発機構からも共著執筆を頂いて、放出源推定や放射性物質の移流拡散沈着モデル計算につい
て記述している。また関連する気象研究所と気象庁での大気輸送拡散沈着モデリングとして、
前述の EER モデルや日本学術会議による大気輸送拡散沈着モデルの相互比較などについて
も記述している。本報告がタスクチーム活動に関する技術的な資料として出版されることに
関して、関係者の労を多とし協力頂いた多くの方々に改めて感謝したい。
2015 年 6 月
研究調整官
竹内 義明
iii
WMO福島第一原発事故に関する気象解析技術タスクチーム活動と
気象研究所の大気拡散モデリング
斉藤和雄*1、新堀敏基*2、Roland Draxler*3
原旅人*4、豊田英司*5、本田有機*4、永田和彦*6、藤田司*6、坂本雅巳*4
加藤輝之*1、梶野瑞王*7、関山剛*7、田中泰宙*7、眞木貴史*7
寺田宏明*8、茅野政道*8、岩崎俊樹*9
Matthew C. Hort*10, Suzan J. Leadbetter*10,
Gerhard Wotawa*11, Delia Arnold*11, Christian Maurer*11
Alain Malo*12, Rene Servranckx*12, Peter Chen*13
2011 年 3 月 11 日に発生した東北地方太平洋沖地震とそれに伴って発生した津波は、東日
本大震災と呼ばれる大きな災害を各地にもたらした。東京電力福島第一原子力発電所(福島
第一原発)は、地震とこれに伴う津波によって被災し、極めて重大で広範囲に影響を及ぼす
原子力事故が発生した。原子放射線の影響に関する国連科学委員会(United Nations Scientific
Committee on the Effects of Atomic Radiation=UNSCEAR)は、2011 年 5 月に行われた第 58 回
総会において、東日本大震災による福島第一原発事故に関する放射線被曝のレベルと影響に
関する評価報告書を作成することを決定し、世界気象機関(WMO)に対し放射性物質の移流
拡散沈着を評価するための気象解析に関する協力を求めた。これに対応するため、WMO で
は 5 か国(米国、英国、カナダ、オーストリア、日本)からのメンバーによる「福島第一原
発 事 故 に 関 す る 気 象 解 析 に つ い て の 技 術 タ ス ク チ ー ム 」 ( Technical Task Team on
Meteorological Analyses for Fukushima Daiichi Nuclear Power Plant Accident、以下「タスクチー
ム」)を設置することを決め、気象庁に対してタスクチームへの専門家の推薦を含めた協力
についての要請を行った。タスクチームの主目的は、気象解析の利用がどのように移流拡散
沈着計算を改善できるかを調べることであった。
気象庁は、事故当事国の気象センターとしてタスクチーム活動に中心的に協力し、4 次元
変分法データ同化に基づく現業メソ解析と解析雨量データを WMO の標準書式である GRIB2
に変換してタスクチームへ提供した。タスクチームでは、3 回の会合と 4 回の電話会議を行
い、気象解析場の評価のための大気輸送拡散沈着モデル実験を行い、UNSCEAR に気象解析
場として気象庁メソ解析と解析雨量を提供するとともに、タスクチームとしての最終報告書
を 2013 年 2 月に作成した。気象庁は、大気汚染気象センターのオキシダント予測や地震火山
部から発表される降灰予報業務に用いられている領域移流拡散モデルをタスクチーム活動で
使用するために改良し、放射性物質の半減期・沈着性ガスの湿性沈着や軽量粒子の重力落下
*1 気象研究所予報研究部
*2 気象研究所火山研究部
*3 米国海洋大気庁大気資源研究所
*4 気象庁予報部数値予報課
*5 気象庁予報部業務課
*6 気象庁予報部アジア太平洋気象防災センター
*7 気象研究所環境・応用気象研究部
*8 日本原子力研究開発機構
*9 東北大学大学院理学研究科
*10 英国気象局
*11 オーストリア地球気象力学中央研究所
*12 カナダ気象局
*13 世界気象機関
iv
の取り扱いなどを新たに追加した。この改良モデルを用いてタスクチームで定めた実験手順
に従って、格子間隔 5km で単位放出に対する放射性物質の濃度と沈着の計算を行った。
UNSCEAR の福島第一原発事故に関する評価報告書は 2014 年 4 月に刊行され、上記に述べ
たタスクチーム活動については、2014 年 6 月に発刊された気象庁測候時報の第 81 巻に和文
でまとめられている。この技術報告では、タスクチーム活動に係る気象庁の貢献について
GRIB2 フォーマットのファイルやその変換ツールの詳細も含めて詳しく英文で記述するとと
もに、測候時報で簡単に触れた気象研究所での大気輸送拡散沈着モデル実験などについて記
述した。
本報告の構成は以下のとおりである。B 章ではタスチームについての概論と会合について
記述した。C 章では、タスクチームへの気象庁の貢献について述べ、現業メソ解析と解析雨
量についての説明とそれらのデータを取り扱うために開発された関連ツールについて記述
した。D 章では、タスクチームが行った大気輸送拡散沈着モデル実験について述べた。E 章
には、気象庁の領域移流拡散モデルとその改良について記述し、放出源高度や計算粒子数、
湿性沈着に関する係数や乾性沈着の高度に関する感度実験の結果を載せた。F 章では、他の
タスクチームメンバー国の大気輸送拡散沈着モデルについて紹介し、それらの計算結果をセ
シウム-137 についての大気濃度と沈着についての測定結果に対するモデル検証とともに示
した。G 章には、関連する気象研究所と気象庁での大気輸送拡散沈着モデリングについて紹
介し、日本学術会議による大気輸送拡散沈着モデルの相互比較への参加や放出源の逆推定に
ついても言及した。東北大学理学研究科の岩崎俊樹教授による大気輸送拡散沈着モデル計算
の必要性に関する特別寄稿も含めている。参考文献は H 章にまとめている。I 章に WMO か
らの厚意により、タスクチーム会合報告の写しを付録として付した。
タスクチーム活動と本報告の作成に関連して、多くの方々の協力を頂いた。気象庁予報部
数値予報課には竹内義明課長(当時)の理解のもと多くの協力を頂いた。片山桂一予報官か
らはモデル計算に関する情報を、佐藤芳昭数値予報モデル開発推進官には原稿についての丁
寧なコメントを頂いた。また総務部企画課の長谷川直之課長(当時)、吉田隆技術開発調整
官(当時)と郷田治稔技術開発調整官、国際室の木村達哉室長、予報部業務課の石田純一調
査官(当時)にも様々な助力・手配の労を頂いた。気象研究所では、三上正男研究総務官(当
時)、中村誠臣研究調整官(当時)や企画室から様々な助力・助言を頂いた。露木義気候研
究部長(当時)には、原稿全体を閲読頂き丁寧なコメントを頂いた。予報部数値予報課の根
本昇技官(当時)はメソ解析と解析雨量データの提供用 GRIB2 への変換の実施に関して C-3
節と C-6 節に、米国海洋大気庁 (NOAA) の Glen Rolph 博士は D-4 節の NOAA のタスクチー
ムウェブサイトに、予報研究部の国井勝研究官は G-4 節の気象研究所のモデル計算に、それ
ぞれ大きな貢献をしている。タスクチーム第 1 回会合での日本からの報告に際して、東京大
学大気海洋研究所の中島映至教授、鶴田治雄特任研究員、京都大学防災研究所の竹見哲也准
教授、名古屋大水循環研究センターの加藤雅也研究員、坪木和久教授、産業技術総合研究所
の近藤裕昭博士、海洋研究開発機構の滝川雅之博士の各位からは、気象学会秋季大会スペシ
ャルセッションでの発表資料の提供を頂いた。また主著者の講演発表に関わる出張において、
文部科学省 HPCI 戦略プログラム「超高精度メソスケール気象予測の実証」の補助を受けた。
これらに深く感謝するものである。
v
TECHNICAL REPORTS OF THE METEOROLOGICAL RESEARCH INSTITUTE No.76 2015
A. Preface1
The 2011 off the Pacific coast of Tohoku Earthquake (Great East Japan Earthquake) and
tsunami occurred on 11 March 2011 and caused severe damage in Japan. The United Nations
Scientific Committee on the Effects of Atomic Radiation (UNSCEAR) was asked to produce a
scientific report for the General Assembly on the levels and effects of radiation exposure caused
by the accident at the Fukushima Daiichi Nuclear Power Plant, and UNSCEAR requested the
World Meteorological Organization (WMO) to develop a set of meteorological analyses for
assessing the atmospheric transport, dispersion, and deposition of radioactive materials. In
response to UNSCEAR’s request, the WMO’s Commission for Basic Systems convened a
technical task team of experts from five countries (Austria, Canada, Japan, United Kingdom,
and the United States) in November 2011. The primary aim of this team was to examine how
the use of meteorological analyses could improve atmospheric transport, dispersion, and
deposition model (ATDM) calculations.
As the Regional Specialized Meteorological Center of the country in which the accident
occurred, the Japan Meteorological Agency (JMA) collaborated with the WMO Task Team by
providing its mesoscale analysis based on operational four-dimensional variational data
assimilation and radar/rain gauge-analyzed precipitation (RAP) data in the standard WMO
format (GRIB2). To evaluate the quality of the meteorological analyses, the WMO Task Team
conducted test simulations with their regional ATDMs and different meteorological analyses.
JMA developed a regional ATDM for radionuclides by modifying its operational regional
atmospheric transport model, which had been previously used for photochemical oxidant
predictions and volcanic ashfall forecasts. The modified model (hereafter referred to as JMARATM) newly implemented dry deposition, wet scavenging, and gravitational settling of
radionuclide aerosol particles. The preliminary and revised calculations of JMA-RATM were
conducted with a horizontal concentration and deposition grid resolution of 5 km and a unit
source emission rate, in accordance with the Task Team’s protocols.
This technical report describes JMA’s contribution to the WMO Task Team and summarizes
the Task Team activities and relevant ATDM modeling carried out at the Meteorological
Research Institute (MRI) of JMA.
The authors of this technical report thank many people for their help in making both our
participation in Task Team activities and this technical report possible. In particular, we are
grateful to Yoshiaki Takeuchi (then Director), Keiichi Katayama, Jun-ichi Ishida, and Yoshiaki
Sato of the Numerical Prediction Division of JMA, and Naoyuki Hasegawa, Takashi Yoshida,
Harutoshi Goda, and Tatsuya Kimura of the Planning Division of JMA, for their help with both
the Task Team activities and the preparation of this technical report. We also thank Masao
1
K. Saito
1
TECHNICAL REPORTS OF THE METEOROLOGICAL RESEARCH INSTITUTE No.76 2015
Mikami, Tadashi Tsuyuki, Masaomi Nakamura, and staff of the Office of Planning of MRI for
their help during the production of this technical report. A report on the Task Team activities
in Japanese has been published in Sokko-jiho (Saito et al., 2014), the bulletin of JMA’s business
reports. Noboru Nemoto of the Numerical Prediction Division of JMA, Glenn Rolph of the U.S.
National Oceanic and Atmospheric Administration, and Masaru Kunii of MRI contributed
Sections C-3 and C-6, D-4, and G-4, respectively. A part of this study was supported by the
Ministry of Education, Culture, Sports, Science and Technology through its High-Performance
Computing Infrastructure Strategic Program for Innovative Research (SPIRE) Field 3, “Ultrahigh Precision Meso-Scale Weather Prediction.”
The report is organized as follows. Section B presents an overview of the WMO Task Team
and the Task Team meetings. Section C reports on JMA’s contributions to the WMO Task
Team. The operational mesoscale analysis and RAP data, including a data conversion tool
prepared by JMA to facilitate their use by the scientific community, are described. In Section
D, the ATDM experiments conducted by the Task Team members are presented. Section E
describes the JMA-RATM and the modifications implemented to support the Task Team
activities. Experiments conducted to test the sensitivity of the JMA-RATM calculations to some
of the ATDM parameters (release height, number of computational particles, wet scavenging
coefficient and application height, and dry deposition application height) are also described.
Section F introduces the ATDMs of each of the Task Team member countries, and the results
of those ATDM calculations are presented and verified against 137Cs deposition measurements
and the air concentration time series. In Section G, relevant ATDM modeling conducted at MRI
and JMA is introduced, including an ATDM intercomparison performed by the Science Council
of Japan and an emission source estimation made by using an inverse model. A special
contribution from Prof. Toshiki Iwasaki of Tohoku University illustrates the necessity to utilize
ATDM modeling in the nuclear power plant accident. Section H is the list of references. Section
I, the appendix, contains copies of the WMO Task Team meeting reports, courtesy of the WMO.
2
TECHNICAL REPORTS OF THE METEOROLOGICAL RESEARCH INSTITUTE No.76 2015
B. Overview
B-1. Overview of the WMO Task Team 1
The World Meteorological Organization (WMO) organized a small Task Team (TT) to respond to a
request from the United Nations Scientific Committee on the Effects of Atomic Radiation (UNSCEAR)
to assist them with the meteorological aspects of a dose assessment from the radiological releases from
the Fukushima Daiichi nuclear power plant accident.
The TT consisted of participants from the Canadian Meteorological Centre (CMC), the U.S. National
Oceanic and Atmospheric Administration (NOAA), the Met Office UK (UKMET), the Japan
Meteorological Agency (JMA), and the Austrian Zentralanstalt für Meteorologie und Geodynamik
(ZAMG) (Table B-1-1). A representative from the European Commission Joint Research Centre’s
ENSEMBLE project (Ispra, Italy) was later invited to participate in the data analysis phase of the effort.
The TT’s primary mission was to examine how the use of enhanced meteorological analyses and the
introduction of additional meteorological observational data, could improve atmospheric transport,
dispersion and deposition calculations. Although the direct evaluation of meteorological analyses is
possible by comparing weather observations with the analyses, the TT members agreed that the best
way to evaluate the suitability of the various meteorological analyses for the assessment was to actually
use the meteorological data in Atmospheric Transport Dispersion and Deposition Models (ATDM) and
compare the model predictions against radiological monitoring data, total accumulated deposition as
well as time-varying air concentrations at a few locations.
Naturally the evaluation of the ATDM calculations relies not only upon the meteorological data, but
also upon the time varying source term used in the calculation, a preliminary version of which was
provided to the TT by the UNSCEAR source reconstruction group.
The methodology for evaluating the meteorological analyses by computing the dispersion and
deposition and comparing these calculations with measurement data was designed during the first
meeting (WMO, 2011; see I-1) of the TT and then updated during the TT’s second meeting (WMO,
2012a; see I-2). The general approach was that each of the TT participants would run their own ATDM
using the meteorological data analysis fields already available to them and, if possible, the higher spatial
and temporal resolution fields provided by JMA (see C-3). The ATDM calculations were standardized
as much as possible in terms of input and output parameters but each ATDM would retain its unique
treatment of the meteorological input data, dispersion, and deposition computations, thereby providing
a range of possible solutions due to variations in model parameterizations as well as the driving
meteorological analysis data (see D-1).
At the conclusion of the TT’s efforts, 20 simulations using different ATDM-meteorology
combinations were available and 18 of these were used in the final analysis. The meteorological
analyses, the individual ATDM air concentration and deposition calculations, and various ensemble
1
R. Draxler, M. Hort, A. Malo, K. Saito, R. Servranckx, and G. Wotawa
3
TECHNICAL REPORTS OF THE METEOROLOGICAL RESEARCH INSTITUTE No.76 2015
mean calculations were made available to UNSCEAR community as described in the third and final
meeting report (WMO, 2012b; see I-3) which also has been published (Draxler et al., 2013).
Because all of the TT ATDM calculations were done using a constant unit-source emission rate
during the respective time window (3 hours), varying the source term between the time windows did not
require re-running any of the ATDM calculations. The preliminary source term used in the WMO
evaluation was not the same as the final source term adopted by UNSCEAR (2013; 2014), and after the
completion of the TT efforts under the guidance of WMO, the TT continued its work independently to
re-compute all of the statistics and graphics (Draxler et al., 2015) using the source term of Terada et al.
(2012) (see D-2).
In addition, other WMO ATDM modeling centers were invited to add their
computations to the NOAA web page summarizing the TT calculations (see D-4).
Table B-1-1. List of the WMO Task Team members.
*
Name
Roland Draxler
Country
United States of
America
Affiliation
National Oceanic and
Atmospheric Administration
(NOAA)
Met Office (UKMET)
Matthew Hort
United Kingdom
Gerhard Wotawa
Austria
Zentralanstalt für Meteorologie
und Geodynamik (ZAMG)
Kazuo Saito
Japan
René Servranckx*
Canada
Peter Chen
--
Japan Meteorological Agency
(JMA)
Canadian Meteorological
Center (CMC)
World Meteorological
Organization (WMO)
Absent at the 1st meeting. Alain Malo (CMC) participated in the 2nd meeting.
4
Remarks
Air Resources Laboratory
(ARL)
Chairman of the Task Team
Research Scientific Manger
RSMC Exeter EER
Data, Methods and Modelling
Division
EER ATDM
Meteorological Research
Institute (MRI)
Chairman of CBS EER Group
Chief, Data Processing and
Forecasting Systems (DPFS)
Division
Secretary of the Task Team
TECHNICAL REPORTS OF THE METEOROLOGICAL RESEARCH INSTITUTE No.76 2015
B-2. Task Team meetings1
B-2-1. The first task team meeting
The Task Team’s first meeting was conducted at WMO Headquarters in Geneva from
November 30th to December 2nd, 2011.
The following eight items were confirmed as the terms of reference (ToR) for the Task
Team:
a) Determine the relevant meteorological observational data sets and related information
required to support the meteorological analyses and identify their archive location and
availability;
(b) Determine which of the existing meteorological analyses are of sufficient spatial and
temporal detail so that can be used to estimate the atmospheric transport, dispersion, and
surface deposition of radionuclides that were released from the nuclear accident and identify
their archive location and availability;
(c) Identify gaps in the existing meteorological analyses that if addressed would make them
more suitable for estimating atmospheric transport, dispersion, and deposition and in
coordination with the WMO Secretariat, identify which members will provide updated
analyses;
(d) Based upon the observational data and analyses, prepare a report on the temporal and spatial
variations in atmospheric conditions during the nuclear accident;
(e) Evaluate the suitability and quality of the observational data and meteorological analyses
for computing atmospheric transport, dispersion, and surface deposition by comparing the
computational results with radiological measurements;
(f) Estimate the uncertainty in the atmospheric transport, dispersion and deposition (ATM)
computations by comparing the results from several different ATMs and using different
meteorological analyses;
(g) Liaise and assist where possible with the UN Scientific Committee on the Effects of Atomic
Radiation (UNSCEAR), in their study on the levels and effects of exposure due to the
Fukushima Daiichi nuclear accident.
(h) Propose possible enhancements to the WMO EER system, including additional products
and/or additional modes of operation with the relevant international organizations.
Although the period of interest was from 11 March through 20 April, 2011, the Task Team
focused their study from 11 – 31 March 2011 because the largest emissions occurred during
this early period. The Task Team regarded the JMA 4D-VAR mesoscale analysis
meteorological data as the most suitable for local and regional scale simulations.
1
K. Saito, P. Chen and R. Draxler
5
TECHNICAL REPORTS OF THE METEOROLOGICAL RESEARCH INSTITUTE No.76 2015
In the first meeting, JMA presented its observation network, available meteorological fields
during the accident period, its numerical weather prediction (NWP) system and mesoscale 4DVAR, the JMA regional ATM, and other relevant studies in Japan (Section B-3-1).
As one of the main decisions of meeting, JMA decided to prepare its meso-ground surface
analysis and meso-analysis data in the original model coordinate system by the end of June
2012 and to be distributed in the GRIB2 format to the other Task Team members.
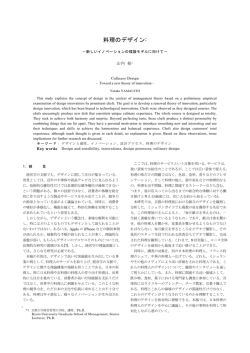
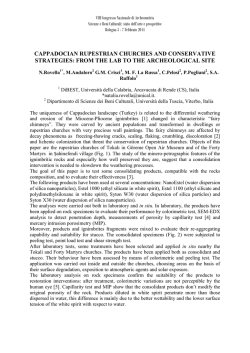
It was decided that the domain of the regional atmospheric transport dispersion and
deposition model (ATDM) experiment should target an area of 30 degrees east-west and 20
degrees north-south (Fig. B-2-1), with horizontal resolution of 0.05 degree (about 5 km). The
first meeting report has been uploaded on the WMO website (WMO, 2011; Appendix I-1).
Fig. B-2-1. Domain of regional ATDM experiment of the Task Team. After Draxler et al. (2013a).
B-2-2. The first telephone meeting
A telephone meeting of the Task Team members was held on February 13, 2012. Because
some ATDM simulations were already carried out in Group B of UNSCEAR using global
analysis data of ECMWF (originally 0.125 degrees), the Task Team decided not to perform
global ATDM simulations, but to focus on regional ATDM experiments. It was decided that
the period of the experiment would cover 11-31 March 2011 and each simulation would be for
a 3 hour emission period followed for up to 72 hours for each radionuclide release. Table B-21 shows the basic specifications of ATDM experiment. For further detail of the experiments,
see Section D-1.
6
TECHNICAL REPORTS OF THE METEOROLOGICAL RESEARCH INSTITUTE No.76 2015
Table B-2-1. Specifications of the regional ATDM experiment of the Task Team.
Remarks
Horizontal
resolution
Domain
Initial time
Forecast
time
Emission
rate
Release
height
Computation
B-2-3.
0.05 degree (about 5 km)
125E-155E, 28N-48N
2011 March 11-31, 3-hourly
72 hours
Fig. B-2-1
Totally 168 times
Unit release (1 Bq/hr)
Linear sum based on estimated
release rate is computed
From ground to 100 m
Concentration average from
the ground to 100 m AGL and
surface deposition for Noble
gases (Ngas), Depositional
gases (Dgas), Light particles
(Lpar)
half ‐ life period is considered
for Iodine-131 (131I)
The second Task Team meeting
The Task Team’s second meeting was held in the United Kingdom Met Office London Branch on
May 1-3, 2012. In addition to the six members of the Task Team, Dr. Florian Gering (Federal Office for
Radiation Protection of Germany), Dr. Oliver Isnard (Radiation Protection Nuclear Safety Institute of
France), and Mr. Peter Bedwell (UK Health Protection Agency) participated, as experts from the
UNSCEAR working groups.
Preliminary runs of the regional ATDMs targeting on March 11 to 31 were presented by the four
centers (ATDM NOAA-HYSPLIT, UKMET-NAME, the CMC-MLDP0, and JMA-RATM; see
Appendix I-2). From JMA, rainfall analysis data (Section C-4) and mesoscale analysis data (Section C2) for the whole period were distributed to the meeting attendees. In addition, JMA offered to provide a
software tool to convert these files to a latitude-longitude grid, while retaining the vertical hybrid terrainfollowing grid and also with an option to convert these data to pressure-level surfaces by the end of June
2012 (see Section C-6).
The TT members reviewed and made one modification to its ToR (in paragraph (f)), which is found
in Annex III of the meeting report (see Appendix I-2).
B-2-4.
The 2nd-4th telephone meetings
On June 7, 2012, the second telephone meeting was held. The regional ATDM simulation results of
each team member and assessment methods based on the sampling data were discussed. JMA
commented that a file conversion tool proposed in the second meeting would be prepared by the end of
June.
7
TECHNICAL REPORTS OF THE METEOROLOGICAL RESEARCH INSTITUTE No.76 2015
On July 23, the third telephone meeting was held. The chairman of the Task Team (Draxler) reported
on the meeting of the Expert Group B of UNSCEAR that took place in the previous week. The Task
Team confirmed the necessity to finish all ATDM calculations of the Task Team by the end of
September.
On October 4, the fourth telephone meeting was held. In addition to the successful NOAA, CMC and
UKMET ATDM calculations using the JMA Meso analysis, ZAMG reported that they would use the
JMA rainfall analysis in the calculation of wet deposition.
Discussions were held about the Fukushima special Symposium carried out in the 93rd annual
meeting of the American Meteorological Society and ATDM intercomparison by Science Council of
Japan (SCJ) to target the Fukushima nuclear accident (see Section G-1).
B-2-5.
The third task team meeting
The Task Team third meeting was carried out on 3-5 December 2012 at the Austrian Meteorology
and Geodynamic Central Research Institute (ZAMG).
Almost all the proposed ATDM calculations were completed, and verification results were shown.
As an additional topic, the ensemble analyses of the Task Team’s ATDM experiments were prepared
and presented by Dr. Stefano Galmarini (EC Joint Research Center). The final report of the third meeting
of
the
Task
team
(WMO,
2012b)
has
been
uploaded
on
WMO
website
(http://www.wmo.int/pages/prog/www/CBS-Reports/documents/FINAL-REPORT-ViennaDec2012.pdf, with a detailed description of verification results presented in Annex III. Based on Annex
III, a final report of the Task Team activity has been published as the WMO technical publication No.
1120 (Draxler et al., 2013). A summary of the scientific findings obtained in the Task Team activities
has been published in a special issue of the Journal of the Environmental Radioactivity (Draxler et al.,
2015).
8
TECHNICAL REPORTS OF THE METEOROLOGICAL RESEARCH INSTITUTE No.76 2015
B-3. Overview of JMA's contribution to the WMO Task Team1
B-3-1. JMA’s presentation at the first Task Team meeting
In the first Task Team meeting (Section B-2-1), JMA presented the following information on its
observation, analysis, and prediction systems and summary of the meteorology during the accident
period as potential contributions to the Task Team activity:
1) Observation network of JMA (Section C-1-1) and the example of the JMA precipitation
analysis rainfall (Section C-4)
2) Characteristic features of the meteorological field in the accident period (Surface weather charts,
surface wind field observed by the JMA’s AWS network (AMeDAS) with 24-hour accumulated
rainfall based on precipitation analysis, and 950hPa wind field from JMA Meso-scale (MESO)
analysis (Section C-9)
3)
Specifications of the numerical weather prediction products and operational analysis systems
of JMA (global and mesoscale forecast-analysis systems) (Section C-7), MESO 4DVAR
analysis (Section C-8) and hourly MESO atmospheric analysis, and the list of the data
assimilated in the operational analysis systems (Section C-1-2)
4) Introduction of JMA’s ATDMs (global ATM for EER; Section G-2) and regional ATM
(Section E).
5) Relevant studies at MRI and JMA (Section B-2 and Section G)
As for 5), based on the special session at the autumn meeting of the Meteorological Society of Japan
(Kondo et al., 2012), the following nine topics were introduced:
・Global transport model using MASINGAR (Tanaka)
・Regional passive tracer model using WRF (Kajino)
・MRI regional chemical transport model using NHM-Chem (Kajino; Section G-3)
・Emission flux estimation by inverse model (Maki; Section G-5)
・Regional Deposition of Radioactive cesium (Cs) and iodine (I) by the Accident of the Fukushima
Daiichi NPP (Tsuruta et al., Univ Tokyo)
・High-Resolution modeling and analyses of wind and diffusion fields over Fukushima (Takemi and
Ishikawa, Kyoto Univ.)
・Transport and deposition analysis by AIST-MM (Kondo et al., AIST)
・Deposition estimation using WRF/Chem (Takigawa et al., JAMSTEC)
・Transport and diffusion simulation using CReSS (Kato et al., Nagoya Univ.)
B-3-2.
MESO Analysis of JMA
To assist in the regional ATDM calculations, JMA provided their MESO analysis fields to the
WMO Task Team and UNSCEAR for the period of 11 to 31 March 2011, at three-hourly intervals and
at a 5-km horizontal resolution. The MESO analyses are produced by the operational JMA regional
1
K. Saito, T. Fujita, T. Kato, T. Hara, K. Nagata, Y. Honda and E. Toyoda
9
TECHNICAL REPORTS OF THE METEOROLOGICAL RESEARCH INSTITUTE No.76 2015
non-hydrostatic 4D-VAR system, which assimilates a variety of local meteorological observations,
including 16 radio sondes and 31 wind profilers, Doppler radial winds from 16 JMA C-band radars
and 9 Doppler radars for airport weather, total precipitable water vapor derived from about 1,200 GPS
stations of the Geospatial Information Authority of Japan and satellite data (Section C-1).
One of the unique features of JMA MESO analysis is that the JMA Radar/Rain Gauge-Analyzed
Precipitation (RAP) data, based on the JMA radar network and rain gauge observations (see B-3-3 and
C-4), is also assimilated in the 4D-VAR. These data are assimilated in hourly time slots in the 3-hour
data assimilation windows by the inner loop (simplified nonlinear/adjoint) model with a horizontal
resolution of 15 km, and all analysis fields including liquid and solid precipitation are produced by a
3-hour forecast of the non-linear outer-loop model (JMA nonhydrostatic model (JMA-NHM); Saito et
al., 2006; 2007; 2012) of the incremental 4D-VAR with a horizontal resolution of 5 km. The
JMA-MESO analysis covers Japan and its surrounding area by 719 (x-direction) x 575 (y-direction)
grid points on a Lambert Conformal projection (see Fig. 1 of Draxler et al. (2015)) up to about 21 km
above ground level (AGL). It has 50 vertical levels, including 11 levels below 1 km AGL. Although
the original horizontal and vertical grid configurations of the JMA Mesoscale model and 4D-VAR
analysis (JNoVA; C-8) are Arakawa-C and Lorentz types, respectively, for handling simplicity all data
on the staggered points (horizontal and vertical wind speeds) are interpolated to the scalar points
(position of pressures and potential temperatures) in the data provided to the Task Team.
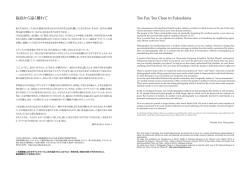
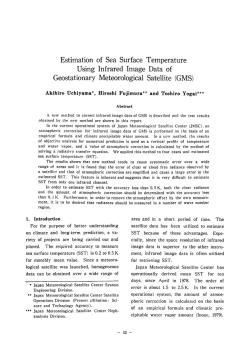
Figure B-3-1 shows averaged surface precipitation (mm per hour) by JMA-MESO for 15 March
1200-1500 UTC for rain (left), snow (center) and total precipitation (right). The time evolution of 950
hPa winds and mean sea level pressure by JMA-MESO for 15 March 2011 is shown in Fig. C-9-7.
One-hour average surface precipitation by JMA precipitation analysis for 15 March 1200-1500 UTC is
shown in Fig. B-3-2.
For more scientific details of JMA nonhydrostatic 4D-VAR, see Section C-8.
Fig. B-3-1. Averaged surface precipitation (mm per hour) by JMA-MESO for 15 March 1200-1500 UTC.
Rain (left), snow (center) and total precipitation (right). After Saito et al. (2015).
10
TECHNICAL REPORTS OF THE METEOROLOGICAL RESEARCH INSTITUTE No.76 2015
B-3-3.
Radar/Rain Gauge-Analyzed Precipitation (RAP)
JMA provided the RAP dataset at 30-minute intervals, with a horizontal resolution of 45 seconds
(about 1.11 km at 37°N) in longitude and 30 seconds (about 0.93 km) in latitude covering a region
from 118-150°E and from 20-48°N (2560 by 3360 grid points). RAP is produced from calibrating
radar reflectivity data with one-hour accumulated rain gauge precipitation data. In addition to the JMA
network of 20 C-band radars and 1,300 surface observations (Section C-1-1), echo data from
additional 26 C-band radars operated by the Ministry of Land, Infrastructure, Transport and Tourism
and precipitation data from additional 8,700 rain gauges in Japan are collected in the real-time
operation. A more detailed description of the RAP processing is found in section C-4.
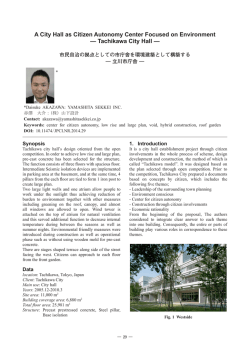
JMA-RAP intensities at one-hour intervals for 15 March 1200-1500 UTC are shown in Fig. B-3-2.
This illustrates a good agreement between RAP and the JMA-MESO total precipitation (Fig. B-3-1). A
circle-shaped very small intense precipitation area is seen around the radar site at Sendai (38.3N,
140.9E) for 1200-1300 UTC (left), which is due to a bright-band observed by the Sendai radar.
For more details of the JMA precipitation analysis, see Section C-4. A documentation of GRIB-2
format of RAP data is given in Section C-5.
Fig. B-3-2. Rainfall intensity (mm) by JMA-RAP for 15 March. 1200-1300 UTC (left), 1300-1400 UTC
(center) and 1400-1500 UTC (right). Colour shade corresponds to Fig. B-3-1. After Saito et al. (2015).
B-3-4. File converter kit and WMO FTP site
JMA provided the MESO and RAP data in GRIB2 format to members of the Task Team and
UNSCEAR group B. The MESO data is produced on a Lambert conformal projection in the horizontal
coordinate and a terrain-following hybrid vertical coordinate. Furthermore, while the GRIB2 format is
officially regulated by WMO as a common format to exchange meteorological data, for some users it
is not an easy task to decode and process GRIB2. Considering the situation, JMA also prepared a
software tool to read and process the MESO and RAP data. This file converter tool is prepared as a
UNIX software kit (C-6) and provides the following three functions;
i) conversion of the GRIB2 format data to the FORTRAN sequential binary format data (GrADS),
ii) re-projection of the data from the Lambert conformal projection to a regular latitude-longitude
projection,
11
TECHNICAL REPORTS OF THE METEOROLOGICAL RESEARCH INSTITUTE No.76 2015
iii) conversion of the data from terrain-following hybrid vertical coordinates to an isobaric
coordinate at user-specified pressure surfaces.
Figure B-3-3 illustrates the conceptual diagram of the file conversion kit. Both the JMA-MESO and
RAP data, detailed instructions, and the above mentioned file converter kit were made available to the
UNSCEAR community through a password protected FTP site hosted by WMO. The data were once
uploaded on the WMO web server to the scientific community for research purposes, and are still
available on the understanding that JMA is acknowledged as the data source.
For more details of the converter kit, see Section C-7.
Fig. B-3-3. Conceptual diagram of the file conversion kit provided by JMA. Reproduced from Saito et al.
(2015). For more detail, see C-7.
12
TECHNICAL REPORTS OF THE METEOROLOGICAL RESEARCH INSTITUTE No.76 2015
B-4. Offer of Data1
The WMO Task Team at its first meeting in Geneva, Switzerland, 30 November - 2 December 2011
(B-2-1 and I-1), determined that all of the observational data collected by JMA are potentially useful
in evaluating the meteorological analyses and any subsequent dispersion and deposition calculations
using the analysis data, and also, possibly serviceable for use by other groups involved in the
UNSCEAR assessment.
Among the observational data, correct precipitation is presumed to be the most critical element in
the deposition calculations. In this aspect, JMA agreed to provide its Radar/Rain Gauge analyzed
precipitation fields (C-4). Also, the meteorological NWP analysis data created by JMA, namely, the
4D-Var mesoscale analysis (C-2) into which very dense observational data are operationally
assimilated, was determined as the most suitable for local and regional scale atmospheric transport,
dispersion and deposition modeling (ATDM), while other mesoscale analyses provided by other
meteorological centers could possibly be used in the assessment of uncertainty limits to the critical
meteorological fields and their inclusion into any future data archive is encouraged. Thus JMA agreed
to provide these dataset along with analyzed precipitation data after reprocessing them from their
internal archive format to GRIB2 (C-3 and C-5). The mesoscale analysis data was first encoded in the
native Lambert Conformal horizontal coordinates on the original model levels (C-7).
At the meeting the possibility of improvement of the 4D-Var analysis fields by reanalysis with more
observational data was discussed, but finally it was agreed that there is not much room for
improvement in the 4D-VAR analysis fields. These data were supposed to be provided to Task Team
participants for evaluation purposes and subsequently to UNSCEAR after consultation with their data
working group.
At the second Task Team meeting, held in London, United Kingdom, 1 - 3 May 2012 (B-2-3 and
I-2), it turned out that the JMA high resolution precipitation analyses (derived from radar and rain
gauge data) was not yet applied in the computations by members other than NOAA and JMA due to a
technical reason related to its coordinates, and JMA suggested offering data conversion software to
promote its usage (C-6).
After preliminary provision of the dataset in May 2012, JMA finally provided its Radar/Rain Gauge
analyzed precipitation fields and the 4D-Var mesoscale analysis fields, both in GRIB2 format for the
period of 11 – 31 March 2011, along with data conversion software in July 2012. The data set was
successfully used by most of the members in their ATDM computations.
The JMA data mentioned above were made available to the UNSCEAR community through a
WMO-hosted password protected web site with instructions and a file converter kit for different
coordinate systems. The data are available to the scientific community for research purposes with
acknowledgement (WMO, 2013).
1
T. Fujita and Y. Honda
13
TECHNICAL REPORTS OF THE METEOROLOGICAL RESEARCH INSTITUTE No.76 2015
C. JMA data and meteorological analyses
C-1. Observation data of JMA1
This subsection describes the observation network for Meso-scale NWP system at JMA
based on the documents presented at the first Task Team meeting held at Geneva in 2011
(Section B-2-1).
C-1-1. Upper air observations
Figure C-1-1 shows the upper air observation network of JMA as of March 2011. It
consists of 31 wind profilers so-called WINDAS (wind profiler data acquisition system) and
16 radiosonde stations. These data are collected at the control center in the headquarters of
JMA through the Automated Data Editing and Switching System (ADESS) in real time, and
assimilated by the Mesoscale analysis (see C-2).
Fig. C-1-1. Upper air observation network of JMA. Large red circles indicate wind profilers, and small
orange circles show raidosonde stations. After Saito et al. (2015).
C-1-2. Surface observations
Figure C-1-2 shows the surface observation network of JMA as of March 2011. JMA has
totally 1,579 surface observation stations which consist of 156 manned and special automated
weather stations (AWSs), and an AWS network so-called AMeDAS (Automated
Meteorological Data Acquisition System). In AMeDAS, there are four types of AWSs. They
1
K. Saito and K. Nagata
14
TECHNICAL REPORTS OF THE METEOROLOGICAL RESEARCH INSTITUTE No.76 2015
are 686 AWSs for precipitation, temperature, wind, and sunshine duration, 79 AWSs for
precipitation, temperature and wind, 356 AWSs for precipitation, and 302 AWSs for snow
depth. The right figure of Fig. C-1-2 is the enlarged view over East Japan, where averaged
horizontal distance of AMeDAS is about 17 km for precipitation. These precipitation data are
used for precipitation analysis (section C-4) and the analysis data are assimilated in
Meso-scale 4D-VAR Analysis (section C-8).
■
○
○
○
+
Manned Station and Special AWS
AWS (Precipitation, temperature, wind, and sunshine duration)
AWS (Precipitation, temperature and wind)
AWS (Precipitation)
AWS (Snow depth)
Fig. C-1-2. Left)Surface observations of JMA. Solid squares indicate manned and special AWS station.
Red (green, blue) circles indicate AWS. Right) Enlarged view over East Japan.
C-1-3. Radar network
Figure C-1-3 shows the radar network of JMA. As of March 2011, JMA has 20 C-band
operational meteorological radars, and 16 of them are Doppler radars2. Radar reflectivity data
are calibrated and composited by the surface rain gauge data as the precipitation Nowcasting
(Fig. C-1-4). Precipitation Nowcasting provides precipitation intensity forecasts of swiftly
growing convections with a spatial resolution of 1 km up to an hour ahead to assist disaster
prevention activities. Radial winds observed by these Doppler radars and Doppler Radars for
Airport Weather are assimilated in Mesoscale 4D-VAR (section C-8).
2
JMA’s all 20 C-band operational radars have been Doppler radar since March 2013.
15
TECHNICAL REPORTS OF THE METEOROLOGICAL RESEARCH INSTITUTE No.76 2015
Fig. C-1-3. Weather radar network of JMA as of March 2011. Red circles indicate the Doppler radars
and blue circles indicate the conventional radars. Doppler Radars for Airport Weather are not
indicated.
Fig. C-1-4. Example of radar composite precipitation Nowcasting of JMA. .
16
TECHNICAL REPORTS OF THE METEOROLOGICAL RESEARCH INSTITUTE No.76 2015
C-1-4. GPS network
Figure C-1-5 shows GPS ground receiver network by the Geospatial Information Authority
of Japan, so-called GEONET. GEONET was originally deployed to obtain geospatial
information in Japan, while total precipitable water vapor (TPW) information is analyzed by
JMA in real time (Shoji, 2009). There are about 1,200 GPS stations in GEONET, and
GPS-derived TPW data have been assimilated in Meso-scale Analysis since October 2009
(section C-8).
Fig. C-1-5. GPS network by Geospatial Information Authority of Japan.
17
TECHNICAL REPORTS OF THE METEOROLOGICAL RESEARCH INSTITUTE No.76 2015
C-2. NWP system at JMA 1
This subsection describes operational NWP systems at JMA based on the documents presented at
the first Task Team meeting held at Geneva in 2011 (Section B-2-1).
C-2-1. JMA deterministic NWP systems
Table C-2-1 shows deterministic NWP systems of JMA as of March 2011 2. Two NWP systems are
operated in JMA to support its official forecasting. The main objective of the Meso-scale NWP system
is to support JMA’s short range forecast for disaster prevention. The forecast model operated in the
Meso-scale NWP system is the JMA nonhydrostatic model with a horizontal resolution of 5 km
(MSM: Meso-Scale Model; Saito et al., 2007; JMA, 2013). Lateral boundary condition is given by the
forecast of the JMA global spectral model (GSM). Initial condition of MSM is prepared by Meso-scale
Analysis, which employs the JMA nonhydrostatic 4D-VAR system (Section C-8).
Table C-2-2 lists observations used in JMA NWP systems as of March 2011. Here. G means that
the data are used in the Global Analysis, M in the Meso-scale Analysis (MESO), L in the Local
Analysis, and Q in the hourly analysis. The observations described in C-1 are included in the table
Data Assimilation System
NWP Model
(shown in red letters).
Table. C-2-1. Deterministic NWP systems of JMA as of March 2011.
Global NWP System
Meso-scale NWP System
Short and Medium range
Short range forecast
Objectives
forecast
for disaster mitigation
Japan and its surroundings
Forecast Domain
The whole globe
(3600km x 2880km)
Global Spectral Model
Meso-Scale Model
NWP Model
(GSM)
(MSM)
T L 959
Horizontal
5km
Resolution
(0.1875deg., ~20km)
Vertical Levels
60 Levels, up to 0.1 hPa
50 Levels, up to about 22km
Forecast Hours
084 hours (00, 06, 18UTC)
15hours(00,06,12,18UTC)
(Initial Times)
216 hours (12UTC)
33hours (03,09,15,21UTC)
Data Assimilation
Global Analysis
Meso-scale Analysis
System
(GSM 4D-Var)
(JNoVA 4D-Var)
Horizontal
TL319
15km
Resolution
(0.5625deg., ~60km)
Vertical Levels
60 Levels, up to 0.1 hPa
40 Levels, up to around 22km
+02h20m
Data Cut-Off
+50min
[Early Analysis]
+05h25m (06/18UTC)
+11h25m (00/12UTC)
[Cycle Analysis]
Assimilation
Window
1
-3h~+3h
-3h~0
K. Saito and Y. Honda
JMA has been operating local forecast model (LFM) with a horizontal resolution of 2 km since 2013.
Specifications of global and Meso-scale NWP systems have also been enhanced in the following years
(JMA, 2013).
18
2
TECHNICAL REPORTS OF THE METEOROLOGICAL RESEARCH INSTITUTE No.76 2015
Remote Sensing
Direct Observations
Land Surface Observations
GEO
Satellite
L
L
LQ
LQ
Sea Surface Observations
GM
GM
GMLQ GMLQ
Aircraft Observations
Upper Air Sounding
GM
Upper Air Wind Profiles
GM
GM
GM
GM
GM
GMLQ
Wind Profiler
MLQ
Doppler Radar
M
Radar/Raingauge-Analyzed Precipitation
M
Radar Reflectivity
ML
Ground-Based GPS
Atmospheric Motion Vector
GM
GM
GMQ
GM
Clear Sky Radiance
Polar Atmospheric Motion Vector
G
GM
Microwave Sounder
M
Microwave Imager
Scatterometer
Refractivity
GM
RH
Radiance
UV
Doppeler
Velocity
T
Automated Weather Stations
Bogus Typhoon Bogus
LEO Satellite
P
RR
Kind
IPW
Table. C-2-2. Observations used in JMA NWP systems as of March 2011.
GM
G
GPS Radio Occultation
G
C-2-2. History of operational Meso-scale NWP system at JMA
The first operational Meso-scale NWP system at JMA started in March 2001 using a spectral
hydrostatic model. The horizontal resolution was 10 km, the number of vertical levels was 40, and the
forecast was conducted every six hours. The forecast model was replaced by the JMA nonhydrostatic
model in 2004 (Saito, 2006) and the model resolution, vertical model levels, and operation time
interval were enhanced to 5 km, 50 levels, and 3 hour in 2006, respectively. Fig. C-2-1 shows the
model domain of MSM as of March 2011, which covers Japan and its surrounding areas with grid
numbers of 721x577 (3,600 km x 2,890 km) 3. The main purpose of the Meso-scale NWP system is to
support short-term weather forecast for disaster prevention, while its forecasts are used for very short
range precipitation forecast and forecast for aviation (Terminal Area Forecast, TAF).
3
The model domain of MSM has been enlarged to 4,320 km x 3,300 km since March 2014 (JMA,
2014).
19
TECHNICAL REPORTS OF THE METEOROLOGICAL RESEARCH INSTITUTE No.76 2015
Fig. C-2-1. Domain of MSM (as of 2011) and an example of its forecast.
Several modifications have been done to Meso-scale NWP system since its start of 2001. Table
C-2-3 lists the main modifications added to the operational Meso-scale NWP system at JMA from
2001 to 2011. It includes the modifications of the data assimilation system and the use of observation
data, such as the implementation of JMA nonhydrostatic 4DVAR in 2009 (Section C-9),introduction
of the global positioning system (GPS)-derived total precipitable water vapor (TPWV) data in 2009
(Ishikawa, 2010), and introduction of 1D-Var retrieved water vapor data from radar reflectivity in
2011 (Ikuta and Honda, 2011).
These modifications have contributed to the remarkable improvement of the QPF performance of
MSM (Fig. C-2-2).
20
TECHNICAL REPORTS OF THE METEOROLOGICAL RESEARCH INSTITUTE No.76 2015
Table. C-2-3. Modifications for operational Meso-scale NWP system at JMA up to
2011. After Saito (2012).
Year. Month
2001. 3
2001. 6
2002. 3
2003. 10
2004. 7
2004. 9
2005. 3
2006. 3
2007. 5
2009. 4
2009. 10
2011. 6
Modification
Start of Meso-scale NWP system (10kmL40+OI)
Wind profiler data
Meso 4D-Var
SSM/I microwave radiometer data
QuikSCAT Seawinds data
Nonhydrostatic model
Doppler radar radial winds data
Enhancement of model resolution (5kmL50)
Upgrade of physical processes
Nonhydrostatic 4D-Var
GPS total precipitable water vapor (TPWV) data
Water vapor data retrieved from radar reflectivity
Fig. C-2-2. Domain Threat score of MSM for three-hour precipitation averaged for FT = 3 h
to 15 h with a threshold value of 5 mm/3 hour from March 2001 to November 2011. The
red broken line denotes the monthly value, while the black solid line indicates the 12-month
running mean. After Saito (2012).
21
TECHNICAL REPORTS OF THE METEOROLOGICAL RESEARCH INSTITUTE No.76 2015
C-3. Data configurations of JMA mesoscale analysis1
For the task team, the 4D-VAR mesoscale analysis (MA) data in the GRIB2 format, bit-oriented
data exchange format standardized by the World Meteorological Organization (WMO) Commission
for Basic Systems (CBS) were provided in May 2012. Data configurations of provided data are
described as follows:
Horizontal grid numbers: 719 in an x-direction and 575 in a y-direction,
Horizontal resolution: 5 km,
Vertical layers: 48 with the terrain following hybrid vertical coordinate,
Model top height: 21.801km,
Map projection: Lambert conformal conic projection with standard latitudes of 30N and 60N, and
standard longitude of 140E, and grid point of (488, 408) corresponds to 30N and 140E.
Here grid point of (1, 1) is located at the northwestern edge. Three kinds of files in the GRIB2 format
were provided, found in detail in Table C-3-1; the first is model plain data including atmospheric
elements such as winds, temperature and hydrometeors, the second is surface land data, and the last is
sea surface temperature data.
For the scientific basis of JMA 4D-VAR mesoscale analysis, see C-8.
1
T. Kato, T. Hara and N. Nemoto
22
TECHNICAL REPORTS OF THE METEOROLOGICAL RESEARCH INSTITUTE No.76 2015
Table C-3-1. Mesoscale analysis (MA) data in the GRIB2 format provided by JMA.
Model plain data of JMA mesoscale analysis
File name: jma_ma_met_hybrid-coordinate_yyyyMMddhhmm.grib2bin
Element
Unit
Layer
Grib code
U
x-wind speed on Lambert projection
m/s
1,2,--,48
0,2,2
V
y-wind speed on Lambert projection
m/s
1,2,--,48
0,2,3
W
z-wind speed
m/s
1,2,--,48
0,2,9
Z
height *
m
surface
1,2,--,48
0,3,5
PT
potential temperature
K
1,2,--,48
0,0,2
QV
water vapor mixing ratio
(specific humidity)
kg/kg
1,2,--,48
0,1,2
QC
cloud water mixing ratio
kg/kg
1,2,--,48
0,1,22
QR
rain water mixing ratio
kg/kg
1,2,--,48
0,1,24
QCI
cloud ice mixing ratio
kg/kg
1,2,--,48
0,1,23
QS
snow mixing ratio
kg/kg
1,2,--,48
0,1,25
QG
graupel mixing ratio
kg/kg
1,2,--,48
0,1,32
P
pressure
Pa
surface
1,2,--,48
0,3,0
PSEA
sea level pressure
Pa
surface
0,3,1
kg/m2 surface
0,1,8
previous 3-hour accumulated
precipitation amount
*) Terrain height of model is stored as surface in Z.
RAIN
Surface land data of JMA mesoscale analysis
File name: jma_ma_land-surface_yyyyMMddhhmm.grib2bin
Element
TUGD
soil temperature (4 layers) *
KIND
surface kind (1-4) **
Unit
Grib code
K
2,0,2
2,192,0
*) depth of layers from the surface: 0.02m, 0.115m, 0.39m, 0.89m
**) 1: no snow on land, 2: no ice over the sea, 3: snow on land, 4: ice over the sea
Surface ocean data of JMA mesoscale analysis
File name: jma_ma_ocean_sst_yyyyMMddhhmm.grib2bin
Element
SST
sea surface temperature
23
Unit
Grib code
K
10,3,0
TECHNICAL REPORTS OF THE METEOROLOGICAL RESEARCH INSTITUTE No.76 2015
C-4. Quantitative Precipitation Estimation (QPE) and Quantitative Precipitation
Forecasting by JMA 1
Radar/Rain gauge-Analyzed Precipitation (referred to here as “R/A”) is a QPE product of JMA (see
Fig. C-4-1). It shows one-hour cumulative rainfall with a spatial resolution of 1 km, and is issued every
30 minutes.
JMA collects data from about 10,000 rain gauges operated by JMA (see Fig. C-1-2), the Ministry of
Land, Infrastructure, Transport and Tourism (MLIT) and local governments every ten minutes or every
hour (rain gauges are located in every 7-km grid square on average) and data from 46 C-band radars
operated by JMA (see Fig. C-1-3) and MLIT with a spatial resolution of 1 km every five minutes. Each
radar covers an area of 500 km × 500 km. All of these data are used for producing the R/A.
The R/A data are produced with the following steps. First, echo intensity data obtained every five
minutes are accumulated. If echoes move too fast, one-hour accumulated echo intensities sometimes
show an unnatural striped pattern. To avoid such unnatural patterns, accumulation is conducted taking
account of echo movements.
Second, to produce accurate R/A, calibration of one-hour accumulated radar data is performed to fit
the distribution of one-hour accumulated rain gauge data. Calibration is conducted in two steps. First,
each piece of radar data is calibrated to fit averaged rain gauge data within the relevant observation
range. Then, detailed calibration of radar data over land is conducted to fit rain gauge data on local
scales.
After the above calibration, R/A is produced using the calibrated accumulation of echo intensities by
transforming the coordination from zenithal projection into latitude-longitude grids with equidistant
cylindrical projection. Nagata (2011) which explains how to produce R/A in detail is carried in the
following pages. Further, JMA has issued “High-resolution Precipitation Nowcasts” since August 2014.
Fig. C-4-1. Sample of R/A product (06 UTC, 8 Sep. 2010).
1
K. Nagata
24
TECHNICAL REPORTS OF THE METEOROLOGICAL RESEARCH INSTITUTE No.76 2015
Quantitative Precipitation Estimation and Quantitative Precipitation Forecasting
by the Japan Meteorological Agency
Kazuhiko NAGATA
Forecast Division, Forecast Department
Japan Meteorological Agency
1. Introduction
Typhoons sometimes hit countries in East Asia and Southeast Asia, and may bring various hazards
including sediment-related disasters, flooding and inundation. To prevent and mitigate damage from such
disasters, analysis and forecasting of precipitation amounts is very important. Analysis relating to the
distribution of rainfall amounts is called Quantitative Precipitation Estimation (QPE), and that relating to
forecasting is called Quantitative Precipitation Forecasting (QPF). The Japan Meteorological Agency
(JMA) developed QPE and QPF products as well as QPE/QPF-induced products using radar data, rain
gauge data and numerical weather prediction (NWP) output. Figure 1 shows the relationships that link
these various data and products, including QPE and QPF.
Fig. 1 Various precipitation products derived from rain gauge and radar data
25
TECHNICAL REPORTS OF THE METEOROLOGICAL RESEARCH INSTITUTE No.76 2015
2. Radar/Rain gauge-Analyzed Precipitation
Radar/Rain gauge-Analyzed Precipitation (referred to here as “R/A”) is a QPE product of JMA. It shows
one-hour cumulative rainfall with a spatial resolution of 1 km, and is issued every 30 minutes. Figure 2
shows a sample.
Fig. 2 Sample of R/A product (06 UTC, 8 Sep. 2010)
2.1 Observation data used to produce R/A
Both rain gauge and radar data are used to produce R/A. Although rain gauges measure precipitation
amounts with satisfactory accuracy, they can observe only at a single point. Conversely, radars can observe
large areas at the same time with a higher spatial resolution than the rain gauge network, but may produce
readings different from those obtained with a ground-based rain gauge as they measure amounts of rain
overhead. Their accuracy is also not as reliable as that of rain gauges because they are remote sensing
instruments. For monitoring and prediction of sediment-related disasters, flooding and inundation, the rain
gauge network is too rough and radar observation lacks sufficient accuracy. For this reason, JMA produces
R/A by calibrating one-hour accumulated radar echo data with one-hour accumulated rain gauge
precipitation data. It collects data from 10,000 rain gauges operated by JMA, the Ministry of Land,
Infrastructure, Transport and Tourism (MLIT) and local governments every ten minutes or every hour (rain
gauges are located in every 7-km grid square on average) and data from 46 C-band radars operated by JMA
and MLIT with a spatial resolution of 1 km every five minutes. Each radar covers an area of 500 km × 500
km.
2.2 R/A algorithms
The procedure for producing R/A involves the following three steps:
1. Accumulation of radar intensity data
2. Calibration of radar data
3. Composition of calibrated radar data
This section briefly describes each process.
26
TECHNICAL REPORTS OF THE METEOROLOGICAL RESEARCH INSTITUTE No.76 2015
2.2.1 Accumulation of radar intensity data
First, echo intensity data obtained every five minutes are accumulated. If echoes move too fast, one-hour
accumulated echo intensities sometimes show an unnatural striped pattern (see the image on the left of Fig.
3). To avoid such unnatural patterns, accumulation must be conducted taking account of echo movements
(see the image on the right of Fig. 3). In this process, the observed echoes are divided into pieces and traced
every five minutes. Then, by summing up the echo intensities passing a grid, the one-hour accumulated
echo intensity of the grid is estimated. Quality checking of echo intensities is also conducted at this stage.
Fig. 3 Accumulation of radar intensity data
Left: one-hour accumulated echoes; right: as per the figure on the left, but with
consideration of echo movements
2.2.2 Calibration of radar data
To produce accurate QPE, calibration of one-hour accumulated radar data is performed to fit the
distribution of one-hour accumulated rain gauge data. Calibration is conducted in two steps. First, each
piece of radar data is calibrated to fit averaged rain gauge data within the relevant observation range. Then,
detailed calibration of radar data over land is conducted to fit rain gauge data on local scales.
2.2.2.1 Calibration over the whole radar observation range
Values of one-hour precipitation estimated from the accumulation of radar echo intensities in a certain grid
are generally different from observation values from a rain gauge in the grid. As rain gauge measurement is
more reliable, the accumulation of radar echo intensities is calibrated with rain gauge observations within
the radar observation range to meet the following two conditions:
(1) The average of the calibrated accumulation for radar echo intensities over a certain domain should
be equal to that of all other radars observing the same domain.
(2) The average of the calibrated accumulation for radar echo intensities over a certain grid should be
equal to the average of the rain gauge observations.
Figure 4 shows a sample of this calibration. The figure on the left shows one-hour precipitation estimated
27
TECHNICAL REPORTS OF THE METEOROLOGICAL RESEARCH INSTITUTE No.76 2015
from the accumulation of radar echo intensities; the central figure shows one-hour precipitation after
calibration to meet the two conditions outlined above; and the figure on the right shows the one-hour
precipitation observed by rain gauges. The original accumulation of radar echo intensities (left) in a certain
grid is less than the rain gauge observation in the same grid (right). Due to calibration, the central figure
shows more precipitation than that on the left. The figure on the right is closer to the central figure than the
left figure.
Fig. 4
Left: sample of one-hour precipitation estimated by accumulating echo
intensities; center: after calibration; right: from raingauge observations
2.2.2.2 Calibration over land
The calibrated echo intensities explained above are further calibrated to enable expression of more detailed
patterns of precipitation on local scales (Makihara, 2000). For example, the calibrated accumulation of echo
intensities for a certain grid g derived using the method described in 2.2.2.1 is calibrated again using data
from rain gauges within about 40 km of that grid. A calibration factor for grid g is calculated with weighted
interpolation of the calibration factors of the surrounding grids that contain rain gauges within 40 km of the
grid. Here, the calibration factor for the grid is defined as the ratio of rain gauge observation values to the
calibrated accumulation of radar echo intensities in the grid using the method outlined in 2.2.2.1. The
following factors are taken into account to calculate the weight of interpolation:
(1) Distances between grid g and rain gauges
(2) Differences between echo intensity for grid g and those for grids containing rain gauges
(3) Beam attenuation rate for precipitation
(4) Uniformity of rain gauge distribution
Multiplying the calibrated echo intensities by the calibration factor as determined above gives the estimated
precipitation for grid g.
Figure 5 shows a sample of this calibration. The figure on the left shows calibrated accumulation of radar
28
TECHNICAL REPORTS OF THE METEOROLOGICAL RESEARCH INSTITUTE No.76 2015
echo intensities calculated using the method outlined in 2.2.2.2, and that on the right shows one-hour rain
gauge data (in the same way as the image on the right of Fig. 4). The figure on the left matches the rain
gauge data better than the central image in Fig. 4.
Fig. 5
Left: sample of one-hour precipitation after calibration over land; right: the
corresponding raingauge observations (as per the image on the right of Fig. 4)
2.2.3 Composition of calibrated radar data
After the above calibration, a composite precipitation map is produced using the calibrated accumulation of
echo intensities calculated using the method outlined in 2.2.2.2 from 46 radars located around the country
by transforming the coordination from zenithal projection into latitude-longitude grids with equidistant
cylindrical projection. If two or more radars observe the same grid, the greater value is selected. Figure 6
shows calibrated echo intensities covering each region and a composite precipitation map of the country.
Fig. 6
Radar data covering each region and a composite precipitation map
29
TECHNICAL REPORTS OF THE METEOROLOGICAL RESEARCH INSTITUTE No.76 2015
2.3 Accuracy of R/A
To assess the accuracy of R/A, experimental R/A data for verification excluding rain gauge data at about
200 observing points were prepared, and were compared with the excluded rain gauge data. Rain gauge
observation values were compared with R/A values for nine grids (a central grid and the eight grids
surrounding it) considering location errors equivalent to the dimensions of one grid (i.e., 1 km) stemming
from wind-related advection of raindrops before their arrival at ground level, and/or errors resulting from
coordinate transform.
Figure 7 shows a scatter plot comparing hourly R/A values and corresponding rain gauge measurements
taken over a period of four months during the warm season (from August to November of 2009). Only the
best R/A values out of the nine grids are plotted. The figure shows close agreement between R/A values
and rain gauge measurements.
120
R/A (mm)
Fig. 7 Scatter plot of R/A and rain gauge data
80
with a regression line (red)
(R/A = 0.96 × Raingauge)
40
40
80
120
Rain gauge (mm)
3. Very-short-range Forecasting of Precipitation
Very-short-range Forecasting of Precipitation (referred to here as “VSRF”) is a QPF product of JMA. It
provides hourly precipitation forecasting up to six hours ahead with a spatial resolution of 1 km. VSRF is
calculated by merging the forecast precipitation with values from JMA’s mesoscale model (MSM) and the
extrapolated composite echo intensity. Figure 8 shows a sample of VSRF. An outline of the procedures for
producing VSRF is given below.
30
TECHNICAL REPORTS OF THE METEOROLOGICAL RESEARCH INSTITUTE No.76 2015
Observation
09 UTC
10 UTC
12 UTC
15 UTC
VSRF
10 UTC (FT = 1 hour) 12 UTC (FT = 3 hours) 15 UTC (FT = 6 hours)
Fig. 8 Sample of VSRF (initial time: 09 UTC, 6 Sep. 2007)
3.1 VSRF algorithms
Generally, extrapolation is the best method of precipitation forecasting for a time frame within a few hours
from the present. However, a numerical model gives better performance gradually over time. JMA
therefore conducts VSRF by both using extrapolation and merging model output. The procedure for
producing VSRF consists of two parts:
1. The extrapolation method
2. The merging method
3.1.1 Extrapolation method
3.1.1.1 Movement vectors
First, the area over Japan is divided into 50-km grid squares. Then, the movement vectors of precipitation
systems are estimated for every 50-km grid using a pattern matching method, which indicates the systems’
direction and speed of movement. In order to avoid any adverse influence from orographic effects on this
estimation1, time subtractions of R/A are used. Thirty candidates for movement vectors in the grid with the
highest matching scores are obtained accordingly using the differences among R/A (t = 0 h), R/A (t = -1 h),
R/A (t = -2) and R/A (t = -3 h). Then, the most suitable candidate vector is selected in consideration of
time-space smoothness. Movement vectors gradually approach the speed of 700-hPa winds of the MSM as
the forecast time increases. Figure 9 shows a sample of a movement vector (left) and the one-hour
accumulated precipitation forecast with this movement vector (right).
1
Orographic effects in a grid cause precipitation systems to look static or appear to move more slowly than they
actually do.
31
TECHNICAL REPORTS OF THE METEOROLOGICAL RESEARCH INSTITUTE No.76 2015
Fig. 9 Sample of movement vectors and forecast one-hour accumulated precipitation
Left: initial echo intensity (shading) and movement vectors (arrows); right: forecast one-hour
accumulated precipitation. The block arrows show precipitation system direction of movement.
3.1.1.2 Orographic effects
Precipitation caused by orographic enhancement is sometimes seen to be stationary over the windward side
of mountains. The algorithm follows the concept of the seeder-feeder model (Browning & Hill, 1981).
Rainfall passing through a feeder cloud generated by orographic effects becomes enhanced due to water
droplets in the feeder cloud.
Precipitable water, which is estimated using data for temperature, relative humidity and wind from the
surface to 850 hPa in the MSM, is used to judge whether feeder clouds are generated. If so, precipitation is
enhanced depending on the amount of rainfall from the seeder cloud. Figure 10 shows orographic
enhancement of precipitation.
Fig. 10 Orographic enhancement (inside the circles of the figures to the left and center)
Left: forecast one-hour accumulated precipitation without orographic effects; center: as per the image
on the left, but with orographic effects; right: altitude map showing the square area from the figure on
the left. The block arrows show precipitation system direction of movement.
The dissipation of echo on the lee side of mountains is also considered. This occurs when the echo top is
low, the angle between the directions of mid- and low-level winds is small, and no echoes are present in the
dissipation area. Echo dissipation is clearer when echo intensity is stronger and the travel time from the
mountaintop to the dissipation area is longer. Echo dissipation is estimated statistically from 700-hPa winds,
900-hPa winds and the relative humidity of the MSM. Figure 11 shows a case of echo dissipation.
32
TECHNICAL REPORTS OF THE METEOROLOGICAL RESEARCH INSTITUTE No.76 2015
Fig. 11
Echo dissipation (inside the circles of the figures to the left and center)
Left: forecast one-hour accumulated precipitation without orographic effects; center: with orographic
effects; right: topographic map with altitude showing the square areas from the figures to the left and
center.
3.1.1.3 Accumulation of forecast intensity
The initial field used for VSRF is a composite echo intensity field obtained in the process of making R/A.
The echo intensity field is shifted along the movement vector with a time step of two or five minutes.
One-hour precipitation at a particular point is calculated as the sum of the echo intensities passing that point.
In the process, enhancement and dissipation of precipitation due to orographic effects are considered.
3.1.2 Merging of extrapolation method and MSM
The performance of the conventional extrapolation method is satisfactory up to three to four hours from the
initial time. For forecast times of more than six hours, the results of the MSM are considered superior to
those of the extrapolation method. It is expected that four- to six-hour forecasts can be improved by
merging the results of the extrapolation method and those of the MSM with a different blending ratio over
time. The blending ratio is estimated from the accuracy levels of the extrapolation method and the MSM
over the past few hours (Araki, 2000). VSRF is the output of this merging process, for which a sample is
shown in Figure 12. The precipitation in the red circle for VSRF is from an extrapolation method forecast,
and that in the blue circle is from the MSM. R/A more closely corresponds to VSRF than to extrapolation
method forecasting and the MSM due to the merging of the extrapolation method forecast and the MSM.
33
TECHNICAL REPORTS OF THE METEOROLOGICAL RESEARCH INSTITUTE No.76 2015
300 km
Fig. 12
(A)
(B)
(C)
(D)
Merging process
Forecasting with (A) the extrapolation method, (B) the MSM and (C) VSRF for 1530 UTC on 9 Oct.,
2010, and (D) R/A for the same time. The initial time of (A) and (C) is 1130 UTC (FT = 4), and that of
(B) is 0900 UTC (FT = 6.5). Precipitation in the red circle for VSRF originates from the extrapolation
method, and that in the blue circle originates from the MSM. The amount of precipitation depends on
the blending ratio.
CSI
3.2 Accuracy of VSRF
Critical Success Index (CSI) values for VSRF, the extrapolation method (EXT), the MSM and the
persistent forecast (PST) for averaged hourly precipitation from June to August 2010 are shown in Fig. 13.
Here, the region over Japan was divided into 20-km grid squares. The threshold of rainfall is 1 mm/hour.
The figure shows that VSRF exhibits superior performance over the whole forecast time.
CSI = A / (A + B + C) × 100
Forecast time
Fig. 13 CSI of VSRF, the extrapolation method (EXT), the MSM and the persistent forecast
(PST) verified from June to August 2010
4. Applications of QPE/QPF
Precipitation figures alone do not provide enough information for forecasters to monitor and forecast
sediment-related disasters because such events are closely linked to the amount of moisture in the soil.
JMA uses the Soil Water Index to monitor and forecast sediment-related disasters.
34
TECHNICAL REPORTS OF THE METEOROLOGICAL RESEARCH INSTITUTE No.76 2015
Precipitation figures alone also provide insufficient information for forecasters to monitor and forecast
flood disasters because such events are closely linked to the amount of water outflow to rivers as well as
the time lag of water as it moves along river channels. JMA uses the Runoff Index to monitor and forecast
flood disasters.
4.1 Soil Water Index
The Soil Water Index (referred to here as the “SWI”) is calculated up to six hours ahead with a spatial
resolution of 5 km showing the risk of sediment-related disasters (debris flow, slope failure, etc.) caused by
heavy rain. Figure 14 shows a sample of the SWI.
Fig. 14
Soil Water Index distribution chart
The risk of sediment-related disasters caused by heavy rain becomes higher when the amount of moisture
in soil increases. Such disasters may sometimes be caused by rainfall from several days before.
The amount of moisture in the soil is indexed using the tank model method to indicate how much rainwater
is contained in soil based on rainfall analysis (see Fig. 15). R/A and VSRF are used as input for the tank
model.
35
TECHNICAL REPORTS OF THE METEOROLOGICAL RESEARCH INSTITUTE No.76 2015
Fig. 15 Outline of tank model
Left: Condition in which rainfall runs out through soil; right: The total reserved amount in each
tank is used to form the Soil Water Index.
Sediment-related disasters frequently occur in areas with high SWI values. Figure 16 shows a
time-sequence representation of the SWI in a grid where a sediment-related disaster actually occurred. Its
timing approximately coincided with the peak SWI value.
Fig. 16
Time-sequence representation of SWI and rainfall amounts in a grid where a
sediment-related disaster occurred. The red line shows the SWI, the brown line shows
24-hour cumulative rainfall, and the bars show 1-hour cumulative rainfall.
Since May 2010, the SWI has been used by forecasters at JMA's meteorological observatories when issuing
heavy rain warnings/advisories to call attention to the risk of sediment disasters.
4.2 Runoff Index
The Runoff Index (referred to here as the “RI”) is calculated up to six hours ahead with a spatial resolution
of 5 km showing the risk of flooding for individual rivers in the country. The amount of rainfall is not
directly linked to the risk of flooding for the following two reasons:
36
TECHNICAL REPORTS OF THE METEOROLOGICAL RESEARCH INSTITUTE No.76 2015
1.
There is a time difference between the occurrence of rainfall and increased water levels in rivers.
2.
It takes time for water to run down river channels.
Accordingly, when monitoring and forecasting flood risk, the above two effects should also be carefully
considered in addition to accurate QPE/QPF (see Fig. 17).
Fig. 17
Three effects to be considered in evaluating flood risk
In the RI, the tank model is used to estimate outflow, and includes the processes of water flowing down the
slopes of the basin (covering an area of about 5 km × 5 km) to the river, and then down the river channel.
The RI is calculated targeting rivers with a length of 15 km or more. R/A and VSRF are used as inputs for
the tank model. Figure 18 shows a sample of the RI.
Fig. 18
Sample of the RI shown in 5-km grids
Floods frequently occur in areas with high RI values. Figure 19 shows a time series representation of the RI
and water levels in a grid where actual flooding occurred. The time series corresponds closely to the water
level of the river.
37
TECHNICAL REPORTS OF THE METEOROLOGICAL RESEARCH INSTITUTE No.76 2015
Fig. 19
Time series of the RI and water levels for a grid in which flooding occurred.
The red line shows the water level, and the blue line shows the RI.
Since May 2010, the RI has been used by forecasters at JMA’s meteorological observatories when issuing
flood warnings/advisories to call attention to the risk of flooding.
References
Araki, K., 2000: Six-hour forecasts of precipitation. Reports of the Numerical Prediction Division, 47, 36 –
41 (in Japanese).
Browning, K. A., F. F. Hill, 1981: Orographic Rain. Weather, 35, 326 – 329.
Makihara, Y., 2000: Algorithms for precipitation nowcasting focused on detailed analysis using radar and
raingauge data, Study on the Objective Forecasting Techniques, Technical Reports of the Meteorological
Research Institute, 39, 63 – 111.
38
TECHNICAL REPORTS OF THE METEOROLOGICAL RESEARCH INSTITUTE No.76 2015
C-5. GRIB2 templates for JMA Radar/Rain gauge-Analyzed Precipitation data1
FM 92 GRIB (Gridded Binary) is a standard data format for storing grid data, defined by WMO
(World Meteorological Organization). It is a container format made from eight kinds of sections to
hold various types of data structure, by selecting templates for grid definition (section 3), product
definition (section 4), and data representation (section 5). Each template is identified by 16 bit numbers
and is called like DRT (Data Representation Template) 5.200 for example.
The JMA Radar/Rain gauge-Analyzed Precipitation data is stored in GRIB format using two
uncommon templates: PDT (Product Definition Template) 4.50008 (R/A product metadata) and DRT
5.200 (run-length encoding). PDT 4.50008 is JMA’s local extension, not to be described in the WMO
Manual on Codes2. DRT 5.200 is an agreed international standard, but the Manual does not contain a
description of the compression algorithm for historical reason. Documentation for those templates has
been provided in Japanese language only (JMA, 2006).
An English version of the documentation was prepared for the task team activity, and is included in
this section for future reference.
1
2
E. Toyoda
https://www.wmo.int/pages/prog/www/WMOCodes.html
39
TECHNICAL REPORTS OF THE METEOROLOGICAL RESEARCH INSTITUTE No.76 2015
GRIB2 templates for JMA Radar/Rain gaugeAnalyzed Precipitation data: PDT 4.50008 and DRT 5.200 June 27, 2012 (rev5) TOYODA Eizi Japan Meteorological Agency Introduction Radar/Rain gaugeAnalyzed Precipitation (hereafter called R/A) data of Japan Meteorological Agency (JMA) is grid data of precipitation. It is given in standard WMO Code FM92 GRIB Edition 2, but it includes templates not described in WMO Manual on Codes. This document supplements WMO Manual to decode that dataset. PDT 4.50008 Product definition template (PDT) 4.50008 is locally modified version of PDT 4.8 defined by JMA. This template is identical to standard PDT 4.8 (average, accumulation and/or extreme values or other statisticallyprocessed values at a horizontal level or in a horizontal layer in a continuous or noncontinuous time interval) until octet 58, and the rest is additional fields for qualitycontrol purpose. Octet Type Contents Actual Value 10 Code table 4.1 Parameter category 1 (Humidity) 11 Code table 4.2 Parameter number 200 [Note 1] 12 Code table 4.3 Type of generating process 0 (analysis) 13 Local code Background generating process identifier 150 (very short range forecast) 14 Local code Analysis or forecast generating process identifier 255 (missing) 1516 Integer Hours after reference time of data cutoff 0 17 Minutes after reference time of data cutoff 0 Integer 40
TECHNICAL REPORTS OF THE METEOROLOGICAL RESEARCH INSTITUTE No.76 2015
18 Code table 4.4 Indicator of unit of time range 0 (minutes) 1922 Integer Forecast time in units defined by octet 18 variable 23 Code table 4.5 Type of first fixed surface 1 (surface) 24 Integer Scale factor of first fixed surface 255 (missing) 2528 Integer Scaled value of first fixed surface 232 − 1 (missing) 29 Code table 4.5 Type of second fixed surface 255 (missing) 30 Integer Scale factor of second fixed suraface 255 (missing) 3134 Integer Scaled value of second fixed surface 232 − 1 (missing) 3536 Integer Year — end of overall time interval variable 37 Integer Month — end of overall time interval variable 38 Integer Day — end of overall time interval variable 39 Integer Hour — end of overall time interval variable 40 Integer Minute — end of overall time interval variable 41 Integer Second — end of overall time interval variable 42 Integer Number of time range specifications used 1 in statistical process 4346 Integer Total number of data values missing in statistical process 0 47 Code table 4.10 Statistical process 1 (Accumulation) 48 Code table 4.11 Type of time increment between successive fields used in statistical process 2 (Same reference time, forecast time incremented) 49 Code table 4.4 Unit of time for time range over which statistical processing is done 0 (minutes) 5053 Integer Length of the time range over which statistical processing is done 60 54 Unit of time for time increment between the successive fields used 0 Time increment between successive 0 (continuous) Code table 4.4 5558 Integer 41
TECHNICAL REPORTS OF THE METEOROLOGICAL RESEARCH INSTITUTE No.76 2015
fields 5966 Twobit fields Radar status block 1 [Note 2] 6774 Twobit fields Radar status block 2 [Note 2] 7582 Flag table Rain gauge availability [Note 2] Notes: [1] parameter number 200 is used for onehour precipitation (water equivalent) [mm] with RLE packing scheme (DRT 5.200). Theoretically it should be 52 (Total precipitation rate [kg.m2.s1]), since GRIB regulation 92.6.2 discourages use of parameter names not orthogonal to other parts of PDT/DRT. Unfortunately the parameter has tradition much longer than the regulation, thus it cannot be changed for compatibility reasons. [2] octets 5982 describe availability and operation status of data sources. Officially the template only describes this blocks as “defined by data producing centre”. Details are given below for informational purpose, but Japan’s National Focal Point for Codes and Data Representation Matters to WMO (not me) may not be aware of recent changes and hence cannot be responsible to different practices. Radar status block 1 (informational) Block 1 describes operation status of data sources, mostly radar sites operated by JMA. Place names in capital letters are registered to WMO Publication No.9 Volume A, and number (starting from 47) is station index. Bits Type Description 12 R 47415 SAPPORO/KENASHIYAMA 34 R 47419 KUSHIRO/KOMBUMORI 56 R 47432 HAKODATE/YOKOTSUDAKE 78 R 47590 SENDAI 910 R 47582 AKITA 1112 R 47572 NIIGATA/YAHIKOYAMA 1314 R 47695 TOKYO/KASHIWA 1516 R 47611 NAGANO/KURUMAYAMA 1718 R 47659 SHIZUOKA/MAKINOHARA 42
TECHNICAL REPORTS OF THE METEOROLOGICAL RESEARCH INSTITUTE No.76 2015
1920 R 47705 FUKUI/TOJIMBO 2122 R 47636 NAGOYA 2324 R 47773 OSAKA/TAKAYASUYAMA 2526 R 47791 MATSUE/MISAKAYAMA 2728 R 47792 HIROSHIMA/HAIGAMINE 2930 R 47899 MUROTOMISAKI 3132 R 47806 FUKUOKA/SEFURISAN 3334 R 47869 TANEGASHIMA/NAKATANE 3536 R 47909 NAZE/FUNCHATOGE 3738 R 47937 NAHA/ITOKAZU 3940 R 47920 ISHIGAKIJIMA/OMOTODAKE 4142 R 47909 NAZE/FUNCHATOGE, in special operation 4344 R 47937 NAHA/ITOKAZU, in special operation 4546 B Gauges in AMeDAS network used 4748 B Other raders used 4950 B Other rain gauges used 5160 reserved 6162 M Modelling data 63 bit OOM is used in forecast 64 bit MSM is used in forecast Notes: (1) This table is taken from documentation dated November 2006. Later changes may exist. (2) Bits are counted as in BUFR. Bit 64 is the most significant bit of the first octet of the block. Bit 1 is the least significant bit of the last octet of the block. Each twobit pair represents operation status of data source (radar or gauge). Upper Lower Type R bit bit Type M 43
Type B TECHNICAL REPORTS OF THE METEOROLOGICAL RESEARCH INSTITUTE No.76 2015
(#2) (#1) 0 0 No data (bulletin missing) Not used Unused 0 1 Observation done, echo presents Latest run used Used 1 0 Observation done, echo absent Secondlatest run used reserved 1 1 No operation reserved reserved Radar status block 2 (informational) Block 2 covers radar sites not operated by JMA. Each twobit pair is operation status encoded in the same way as in block 1. Bits Description 12 Pinneshiri [Pinne Yama*] 34 Otobe Dake* 56 Muri Yama 78 Hako Dake* 910 Monomi Yama* 1112 Shirataka Yama* 1314 Nishi Dake 1516 Hōdatsu Zan* 1718 Yakushi Dake* 1920 Hijiri Kōgen 2122 Akagi San* 2324 Mitsutōge Yama 2526 Ōgusu Yama 2728 Takasuzu Yama* 2930 Gozaisho Yama* 44
TECHNICAL REPORTS OF THE METEOROLOGICAL RESEARCH INSTITUTE No.76 2015
3132 Jatōge 3334 Miyama 3536 Jōgamoriyama 3738 Rakansan [Osorakan Zan*] 3940 Ōwasan 4142 Myōjin San* 4344 Takashiro Yama 4546 Shakadake [Shakagadake*] 4748 Kunimi Yama* 4950 Happongi Yama (Gotō Shi) 5152 Yae Dake* 5364 reserved Notes: (1) This table is translated from documentation dated November 2006. Later changes may exist. (2) Name of radar sites may have different spelling, as they are not registered to WMO. Names marked with asterisk (*) are found in “Gazetteer of Japan” (2007, http://www.gsi.go.jp/ENGLISH/pape_e300284.html). Flag table for rain gauge availability Availability of each data source (mostly rain gauges in a prefecture) is indicated by a bit each. Bit Data source 1 gauges in AMeDAS network 2 gauges operated by Water and Disaster Management Bureau, MLIT (Ministry of Land, Infrastructure, Transport and Tourism) 3 gauges operated by Road Bureau, MLIT 417 reserved 18 gauges in Hokkaido (hereafter proper name is prefecture of Japan) 19 gauges in Aomori 45
TECHNICAL REPORTS OF THE METEOROLOGICAL RESEARCH INSTITUTE No.76 2015
20 gauges in Akita 21 gauges in Iwate 22 gauges in Miyagi 23 gauges in Yamagata 24 gauges in Fukushima 25 gauges in Ibaraki 26 gauges in Tochigi 27 gauges in Gunma 28 gauges in Saitama 29 gauges in Tokyo 30 gauges in Chiba 31 gauges in Kanagawa 32 gauges in Nagano 33 gauges in Yamanashi 34 gauges in Shizuoka 35 gauges in Aichi 36 gauges in Gifu 37 gauges in Mie 38 gauges in Niigata 39 gauges in Toyama 40 gauges in Ishikawa 41 gauges in Fukui 42 gauges in Shiga 43 gauges in Kyoto 44 gauges in Osaka 45 gauges in Hyogo 46
TECHNICAL REPORTS OF THE METEOROLOGICAL RESEARCH INSTITUTE No.76 2015
46 gauges in Nara 47 gauges in Wakayama 48 gauges in Okayama 49 gauges in Hiroshima 50 gauges in Shimane 51 gauges in Tottori 52 gauges in Tokushima 53 gauges in Kagawa 54 gauges in Ehime 55 gauges in Kochi 56 gauges in Yamaguchi 57 gauges in Fukuoka 58 gauges in Oita 59 gauges in Nagasaki 60 gauges in Saga 61 gauges in Kumamoto 62 gauges in Miyazaki 63 gauges in Kagoshima 64 gauges in Okinawa Note: translated from documentation dated November 2006. Later changes may exist. DRT 5.200: Runlength packing Data representation template (DRT) 5.200 is an international standard registered in WMO Manual on Codes. The structure of data section (section 7) is, unfortunately, not described enough to implement software. Data Representation Section (Sec5) Structure Taken from WMO Manual, with modification of words for ease of understanding. 47
TECHNICAL REPORTS OF THE METEOROLOGICAL RESEARCH INSTITUTE No.76 2015
Octet Type Contents 12 Integer Number of bits used for each packed value in the run length packing with level values (only 8 has been used
at the time of writing) 1314 Integer MV Maximum value within the levels that is actually used in this GRIB message 1516 Integer MVL Maximum value of level (predefined) 17 Integer Decimal scale factor of representative value of each level 18 ... 19+2*(MVL1) Integer[MVL] List of scaled representative values of each level from 1 to MVL Data Section (Sec7) Structure Octet Type Contents 14 Integer Length of the section 5 Integer Number of the section (7) rest (described below) Packed grid data Run length encoding (RLE) is a technique that compresses data into a series of pair of repeated element and repetition count. There are lots of specific encodings of the name in the information technology industry. Microsoft DIB (bitmap) format is famous one, but is differnt from JMA’s. Firstly, in lexical (smallscale) viewpoint, packed grid data is considered as a sequence of bytes. The size of byte is given at octet 12 of data representation section. It may not be eight, but as far as I know, all implementations uses 8 bits per byte (hence it’s same as octet). Switching to syntax (largescale) viewpoint, Packed grid data is a sequence of sets, each of which represents a consecutive grid points with the same value. A set consists of a data byte (value equals to or less than MV) and an optional repetition count sequence (hereafter called RCS) that is a sequence of digits, each of which is bytes with value more than MV. The structure in BNF is as follows: 48
TECHNICAL REPORTS OF THE METEOROLOGICAL RESEARCH INSTITUTE No.76 2015
packed_grid_data := *(set) set := data_byte rcs data_byte := <any byte whose value is MV or less> rcs := *(digit) digit := <any byte whose value is more than MV>. RCS describes number of consecutive grid points in the set. The number is decremented by one, and then expressed in positional notation with base B = 255 MV (note: each digit may take value one of B possibilities between MV + 1 and 255) and digits are sorted in littleendian order. Thus the number of consecutive grid points R is given as follows: N
R = 1 + ∑ B(i−1)[ai − (MV + 1)], i = 1
where N is the number of bytes in repetition count sequence and ai is ith byte in the sequence. When RCS is missing in a set, that means R = 1. Value of the “data byte” is different from that of original data described by the parameter. The byte value is called level, which is an index to the list of “representative value” at the end of data representation section. Each value in the table is scaled by the decimal scale factor (octet 17 of DRS). The original data Y is given by a similar formula to regulation 92.9.4: Y ∙ 10D = X = table[L] , where D is the decimal scale factor, X scaled value, L level, and table[L] is Lth (1starting) entry in the table. The idea of level is something like Beaufort’s scale giving approximate value of wind speed. “Maximum value of level” MVL in Section 5 is the number of these levels, which is fixed number 98 for current R/A. Note that MV is often less than MVL (MV cannot be more than MVL). Note that the “level zero” is defined to mean missing value, hence the list of levels in DRS does not include an entry for zero. As far as I know, JMA never used the standard bitmap (GRIB2 Section 6) with run length packed data. Bitmap octets cannot be shorter than oneeighth of grid point counts, but this run length packing can be as short as a single set if almost entire field is zero. A compact algorithm can decode this data structure, as shown in Appendix. 49
TECHNICAL REPORTS OF THE METEOROLOGICAL RESEARCH INSTITUTE No.76 2015
Appendix: decoding algorithm Following code in C is only for clarification of algorithm. There is no warranty. It assumes that a byte in RLE has eight bits, and also C type “char” has exactly eight bits. Bitmap processing is to be done after decode() function, although JMA doesn’t use bitmap with runlength packing. #include <stdlib.h> #include <math.h> unsigned get_uint2(unsigned char *p) { return (p[0] << 8) | p[1]; } unsigned long get_uint4(unsigned char *p) { return (p[0] << 24) | (p[1] << 16) | (p[2] << 8) | p[3]; } int decode(const unsigned char *drs, /* SECTION 5 */ const unsigned char *ds, /* SECTION 7 */ double *buf, /* RESULT */ unsigned long buflen) { unsigned long i, ib, npixel, iend, nrepeat, mv, ir; double scale_factor, decimal_factor, xlated; scale_factor = (drs[16] & 0x80) ? (drs[16] & 0x7F) : drs[16]; decimal_factor = pow(10.0, scale_factor); if (drs[11] != 8) { return 1; } /* BYTE SIZE IS NOT 8 */ npixel = get_uint4(drs + 5); if (buflen < npixel) { return 1; } /* OVERRUN */ iend = get_uint4(ds) 1; mv = get_uint2(drs + 12); ib = npixel 1; nrepeat = 0; for (i = iend; i >= 5; i++) { if (ds[i] > mv) { nrepeat *= (255 mv); nrepeat += (ds[i] mv 1); } else { if (ib < ++nrepeat) { return 1; } /* OVERRUN */ if (ds[i] == 0) { xlated = 1.0; /* MISSING VALUE */ } else { xlated = get_uint2(drs + 17 + 2 * (ds[i] 1)) * decimal_factor; } for (ir = 0; ir < nrepeat; ir++) { buf[ib] = xlated; } nrepeat = 0; } } if (ib > 0) { return 1; } /* UNDERRUN */ return 0; } 50
TECHNICAL REPORTS OF THE METEOROLOGICAL RESEARCH INSTITUTE No.76 2015
C-6. Radar / Rain gauge-Analyzed Precipitation Dataset by JMA1
For the task team, the Radar / Rain gauge-Analyzed Precipitation dataset was provided by JMA in
GRIB2 format. It gives the most reliable and finest precipitation analysis fields and is to be used with
the atmospheric transfer models for computing rain wash. Details of the data set including data
configuration and format are described in a pdf document file (the following pages) and shared along
with the dataset as the contribution of JMA among the Task Team members.
1
T. Fujita and N. Nemoto
51
TECHNICAL REPORTS OF THE METEOROLOGICAL RESEARCH INSTITUTE No.76 2015
Radar / Rain gauge-Analyzed Precipitation Dataset by JMA
This document describes basic information needed to handle the Radar / Rain
gauge-Analyzed Precipitation Dataset (RA) by the Japan Meteorological Agency
(JMA), which is provided to the WMO Technical Task Team on Meteorological
Analyses for Fukushima Daiichi Nuclear Power Plant Accident. Since the concept
and overview of the data are mostly given in Nagata (2011)1, the data description
given below is rather limited: the file format, data area, and so on.
1. File names of the Radar / Rain gauge-Analyzed Precipitation dataset
The generic file names of the RA dataset are specified as follows:
Z__C_RJTD_yyyyMMddhhmmss_SRF_GPV_Ggis1km_Prr60lv_ANAL_grib2.bin
where two consecutive underscores are given between the first Z and C, while a
single underscore is used in other places. The specific character string
‘yyyyMMddhhmmss’ should properly stand for the year in four digits, month, day,
hour, minute, and second in two digits in Coordinated Universal Time (UTC) at
observation, while the observation time shows the end of accumulation period. For
example, the one hour accumulated analyzed rainfall amount data from 1000
UTC to 1100 UTC on March 12, 2011 is stored in:
Z__C_RJTD_20110312110000_SRF_GPV_Ggis1km_Prr60lv_ANAL_grib2.bin
Note that the minutes are 00 or 30 since the data is given every thirty minutes,
and the seconds are always assumed to be 00.
2. Grid alignment and the number of grids
The horizontal resolution of the data is 45 seconds in longitude and 30 seconds in
latitude. The entire area streches from 118 degree to 150 degree in East, and from
20 degree to 48 degree in North (Fig. 1), in a way that each tiny region of 45
seconds by 30 seconds is arranged within the entire region without any overlap
nor gap, which means tiny regions of total 2560 by 3360 are defined in the area.
1
<http://www.jma.go.jp/jma/jma-eng/jma-center/rsmc-hp-pub-eg/techrev/text13-2.pdf>
52
TECHNICAL REPORTS OF THE METEOROLOGICAL RESEARCH INSTITUTE No.76 2015
3. File format
The data is encoded and formatted in the form of FM92 GRIB Edition 2 (WMO,
2011) 2 with specific extensions for this usage. The sizes of the data files vary
from 100 kB to 500 kB or more depending on the meteorological condition at the
observation time. Users should refer to the Appendix for more detail in addition to
WMO (2011).
Discrete level values of precipitation intensity are compressed in a run length
encoding, and set into the sixth octet and after in the seventh section. Note that
the maximum value of the data in one file, which naturally differs file by file, is
referred to as the standard value for the run length compression of the data in the
file (MV, octets 13-14 in the fifth section), and that once the RA dataset is
processed by the program mentioned in the next section, the compressed data is
re-encoded in the simple compression and the run length rule is not applied
anymore.
4. Data Handling Program
A data conversion program conv_jma_grib2 is prepared by JMA for the users’
convenience. The program is originally designed to convert the JMA
Meso-analysis data, but also usable to convert the RA dataset. Users should refer
to the User’s Manual (JMA, 2012) on the conv_jma_grib2 program for the
details.
APPENDIX GRIB2 Format for the Radar / Rain gauge-Analyzed precipitation
The GRIB2 files for the Radar / Rain gauge-Analyzed precipitation (R/A) employ
a template of local use 4.50008 in section 4. It is almost identical to the template
4.8 with n = 1 (octet 42), but the following records are additionally placed:
( 1-58
same as the template 4.8 with n = 1)
59-66
Flags on radar operations PART1
67-74
Flags on radar operations PART2
75-82
Flags on rain gauge operations
2
<ftp://ftp.wmo.int/Documents/MediaPublic/Publications/CodesManual_WMO_no_306/WMO306_V
ol_I.2_2011_en.pdf>
53
TECHNICAL REPORTS OF THE METEOROLOGICAL RESEARCH INSTITUTE No.76 2015
The flags above indicate which radar or rain gauge sites are in operation to
analyze the precipitation intensity, however, the details are not shown here
because the information is longish and considered unimportant for the task teams’
work. Toyoda (2012) provides full details on the extensions defined by JMA.
Discrete level values of precipitation intensity (lv), parameter category 0
(moisture) and number 200 (local use) specified in section 4, are stored in section 7
with the run length packing, as section 5 describes that the template 5.200 is used.
The level values should be interpreted to precipitation intensity with a table
stored in section 5 (List of MVL scaled representative values of each level from
lv=1 to MVL). lv= 0 means no observation (missing).
REFERENCES
JMA, 2012: conv_jma_grib2 — a tool to convert GRIB2 provided for UNSCEAR by
JMA — Users’ Manual by the Japan Meteorological Agency, 7 p.
Nagata, K., 2011: Quantitative Precipitation Estimation and Quantitative
Precipitation Forecasting by the Japan Meteorological Agency. , RSMC Tokyo Typhoon Center Technical Review No.13, 37-50.
Toyoda, E., 2012: GRIB2 templates for JMA Radar/Rain gauge-Analyzed
Precipitation data: PDT 4.50008 and DRT 5.200, a document submitted to
WMO Inter-Programme Expert Team on Data Representations and Codes.
http://goo.gl/Y6JMh
WMO, 2011: Manual on Codes – International Codes, Part B -Binary Codes. WMO
Publication No.306 Volume I.2, Geneva, Switzerland.
54
TECHNICAL REPORTS OF THE METEOROLOGICAL RESEARCH INSTITUTE No.76 2015
Fig. 1
Area of the RA dataset.
55
TECHNICAL REPORTS OF THE METEOROLOGICAL RESEARCH INSTITUTE No.76 2015
C-7. File converter tool1
Following an agreement reached by the task team, JMA offered the Radar/Rain Gauge analyzed
precipitation (R/A) fields (see C-4) and the 4D-VAR mesoscale analysis (MA) fields (see C-3 and C-8)
in the GRIB2 format, bit-oriented data exchange format standardized by the World Meteorological
Organization (WMO) Commission for Basic Systems (CBS). However, a horizontal coordinate such as
the Lambert conformal conic projection, the terrain following hybrid vertical coordinate, and the run
length encoding (RLE) used in the provided datasets might not be familiar to some members of the task
team. Moreover, decoding data described in the GRIB2 often requires special technics and knowledge.
In order to help members’ work, JMA also provided a converter tool (called “conv_jma_grib2”) to
process the offered data. Its functions are schematically displayed in Fig.C-7-1. The “User Manual” of
the tool distributed to the task team members is shown from the following page, which describes details
of its functions, usages (compiling and running) and some examples in use. The tool was written fully
in C programing language from scratch, and scripts to generate compiling environment depending on
various users’ system was attached, which helped the tool available on many systems. Only one small
bug was fixed just after it was released to the members, but no further defects have been reported.
Fig. C-7-1. A schematic figure showing functions of the converter tool provided by JMA.
1
T. Hara
56
TECHNICAL REPORTS OF THE METEOROLOGICAL RESEARCH INSTITUTE No.76 2015
conv jma grib2
— a tool to convert GRIB2 provided for UNSCEAR by JMA —
Users’ Manual
by the Japan Meteorological Agency
1
Introduction: what does the tool do?
The Japan Meteorological Agency (JMA) has provided the operational mesoscale analysis (MA) in
the GRIB2 format to members of the task team. MA employs the Lambert conformal conic projection
as a horizontal coordinate, but it has been revealed that the projection might not be familiar to some
people. In addition, a terrain following hybrid coordinate adopted by MA could be another factor to
hamper members’ work.
Furthermore, while the GRIB2 format is regulated by the WMO and established as a common
format to exchange meteorological data, it might not an easy task to decode and process them.
Considering the situation, JMA has decided to provide a tool to convert horizontal and vertical
coordinates as well as the data format. The tool provides functions
• to convert the GRIB2 format to the FORTRAN sequential format which is much more familiar
and can be visualized by the GrADS, a popular tool in the meteorological society.
• to re-project data in the GRIB2 to other projection.
• to convert the terrain following hybrid vertical coordinate to the isobaric coordinate with arbitrary pressure planes.
The tool is applicable for the following GRIB2 files provided to the UNSCEAR task team.
• jma_ma_met_hybrid-coordinate_201103DDHH00.grib2.bin
(MA for the atmosphere)
• jma_ma_land-surface_201103DDHH00.grib2.bin
(MA for the land surface)
• jma_ma_ocean_sst_201103DDHH00.grib2.bin
(MA for the sea surface temperature)
• Z__C_RJTD_201103DDHHMN00_SRF_GPV_Ggis1km_Prr60lv_ANAL_grib2.bin
(Radar/Raingauge analyzed precipitation)
All rights associated to conv jma grib2 are reserved by JMA.
57
TECHNICAL REPORTS OF THE METEOROLOGICAL RESEARCH INSTITUTE No.76 2015
2
Setup
The source codes described in C can be complied as the following.
$ tar xvzf conv_jma_grib2-1.00.tar.gz
$ cd conv_jma_grib2-1.00
$ ./configure
$ make
After the compilation finishes successfully, the executable file conv jma grib2 is generated in the
current directory. You can copy the executable to another directory you like.
The configure script automatically determines endian of your computer and the executable built
is compatible to your computer.
Note that makedepend (a tool to generate dependencies automatically) is used in the compilation.
Even if makedepend is not installed in your computer, the codes are compiled successfully using the
prescribed dependencies in src/.depend.default as long as no modifications are added into the
codes. If you are going to add some modifications but makedepend is not installed, you might need to
update the dependencies by hand, which makedepend automatically does. config.log generated after
running configure tells you whether makedepend is installed in your computer and used in compiling
them.
3
Basic Usage
As the first practice, just type as follows with a GRIB2 file provided by JMA.
$ conv_jma_grib2 grib2_file
You obtain a converted file in the FORTRAN sequential format with a GrADS ctl file. The converted file is put with a file name combined the original GRIB2 file name (including a directory path)
and “.dat” and “.ctl”, that is, if your GRIB2 file is named as /home/john/sample.grib2, file names
of the converted ones are /home/john/sample.grib2.ctl and /home/john/sample.grib2.dat. If -o
output file is added to the option line, the output file name can be altered to output file.
You can see what elements are stored by looking at the ctl file. This operation just converts file
formats and no coordinate transformations are done. By opening the ctl file with GrADS, you can draw
elements stored in the file. In the case of converting GRIB2 files of the Radar/Raingauge-Analyzed
Precipitation (R/A), converted files contain precipitation intensity (parameter category:1, number:8),
while discritized levels of precipitation intensity (parameter category:1, number:200) is stored in the
original GRIB2 files. It is also the case when you convert the original GRIB2 to the GRIB2 again
with -g option.
Note that converted FORTRAN sequential files are described in the big endian even if the byte
order of your computer is the little endian. While the GrADS can recognize the endian because the
endian is specified in a “OPTION” line in the ctl file, take care of that when you try to read the file by
your own programs (FORTRAN compilers usually have a “big endian” mode, with which read/write
statement in FORTRAN read/write sequential files in the big endian even on little-endian machines).
Furthermore, the first point of the GRIB2 is at the northwest edge (j increases from north to south),
however, converted files in the FORTRAN sequential format have the first point at the southwest edge
(j increases from south to north). That is why no “yrev” option is placed in the OPTION line in ctl
files.
By default, ctl files for GrADS assume a linear grid even if the Lambert projection is employed.
The generated ctl file should be like the following:
58
TECHNICAL REPORTS OF THE METEOROLOGICAL RESEARCH INSTITUTE No.76 2015
#pdef 719 575 LCCR 30.000 140.000 487.977067 168.019156 30.000 60.000 140.000 5000.000 5000.000
#xdef 963 linear 107.000000 0.051922
#ydef 668 linear 19.000000 0.044966
xdef 719 linear 1.000000 1.000000
ydef 575 linear 1.000000 1.000000
Although the GrADS ignores lines starting with #, parameters related to the Lambert projection is
written down in a pdef statement. In this case, the numbers of grids specified by xdef and ydef is
real grid numbers. You can draw this file with GrADS but map drawn is not correct.
If -c option is specified, the parameters in the ctl files will be
pdef 719 575 LCCR 30.000 140.000 487.977067 168.019156 30.000 60.000 140.000 5000.000 5000.000
xdef 963 linear 107.000000 0.051922
ydef 668 linear 19.000000 0.044966
#xdef 719 linear 1.000000 1.000000
#ydef 575 linear 1.000000 1.000000
This time, the GrADS interprets the pdef statement, and draw figures interpolating the Lambert
projected grids to linear Latitude/Longitude coordinate. Real grid numbers are appeared in the pdef
statement, but numbers specified by xdef and ydef are not related to the real grid numbers (they are
adjusted so that the entire domain can be drawn).
4
Coordinate transform
This tool has a function to transform horizontal and vertical coordinates.
All options explained in the Section 3 are also available when options for a horizontal and/or
vertical coordinate transform are specified.
Of course, the vertical transform is valid only for the atmospheric analysis (not for land, sst, and
R/A analysis).
4.1
Horizontal transform
If you are going to change a horizontal coordinate of the provided GRIB2 data, you should create
a configuration file describing parameters of the destination projection. The configuration file is put
as an option in the command line with -h like
$ conv_jma_grib2 -h config_h.txt grib2_file
4.1.1
Converting to the Latitude/Longitude coordinate
When converting data in the GRIB2 to those on the Latitude/Longitude coordinate, an example of
the configuration file content, saved as config sample/config h ll.txt, should be like the following:
proj
nx =
ny =
dx =
dy =
xlat
xlon
xi =
xj =
= LL
201
201
0.05
0.05
= 40.0
= 130.0
1.0
1.0
59
TECHNICAL REPORTS OF THE METEOROLOGICAL RESEARCH INSTITUTE No.76 2015
• proj must be LL (Latitude/Longitude)
• nx, ny: the numbers of grids of x- and y-direction.
• dx, dy: grid spacing of x- and y- direction. (unit: degree)
• xlat, xlon, xi, xj: (xi, xj) on the coordinate corresponds to the point identified by xlat
and xlon. In the coordinate the configuration file assumes, a point of (1, 1) is located at the
northwest edge and xj increases from north to south (the coordinate value of the first point is
1, not 0).
When a coordinate you want to convert to is the Latitude/Longitude, it is easy and understandable to set the latitude and longitude of the first point (i.e. the most northwestern point) to
xlat and xlon, and xi = xj = 1.0.
4.1.2
Converting to the Lambert Coordinate
When you are going to convert the JMA GRIB2 data (ex. Radar/Raingauge Analyzed Precipitation) to those on the Lambert coordinate, a configuration file on parameters for the target
coordinate is required. An example of what should be described in the configuration, saved as
config sample/config h lm.txt, is as follows.
proj = LMN
nx = 719
ny = 575
dx = 5000.0
dy = 5000.0
xlat = 30.0
xlon = 140.0
xi = 488.0
xj = 408.0
slat1 = 30.0
slat2 = 60.0
slon = 140.0
The format of the configuration file is similar to that for converting to the Latitude/Longitude coordinate, mentioned in the previous subsection. This time, proj must be LMN (Lambert North). In
addition to parameters used also for the Latitude/Longitude coordinate, two standard latitude and
a standard longitude must be set to slat1, slat2 and slon in degree. Along the standard latitudes
and longitude, no expansion or shrink occurs in the projection from the Earth sphere to the plane. It
is strongly recommended that when you would like to use the Lambert projection, slat1 = 30, slat2
= 60 and slon = 140. In the case of the Lambert projection, dx and dy mean grid spacings at the
standard latitude and longitude at the points identified by slat1, slat2 and slon. (Parameters in
the example shown above is used in the JMA meso analysis).
Wind components u and v in the GRIB2 depict x- and y- direction winds on the Lambert projection, respectively (not zonal and meridional winds). When the Lambert coordinate is converted to the
Latitude/Longitude one, u and v are rotated so that the rotated winds u0 and v 0 can be interpreted
as zonal and meridional winds. The details of the rotation are described in Appendix A.
Note that conversion of the original MA GRIB2 described in the Lambert projection to another
Lambert projection with different parameters (ex. smaller region) is also possible.
The original domain is expected to cover the entire domain of the converted one. If the tool finds
a point on the target coordinate locating out of the original domain, it abnormally halts with an error
message by default. However, adding -d to the command line option allows you to include points
60
TECHNICAL REPORTS OF THE METEOROLOGICAL RESEARCH INSTITUTE No.76 2015
which are not covered by the original coordinate. MISSING (undef in GrADS) are stored into these
points.
For almost elements in the GRIB2, the tool calculated values on the target coordinate by the linear
interpolation of values on four adjacent points on the original coordinate. There are two exceptions.
1. In converting KIND (surface kind such as land, sea, land covered by snow, sea covered by ice)
stored in the land surface analysis, the tool uses a value on the nearest point selected from the
four adjacent points (because a fractional “KIND” obtained by the linear interpolation as the
other elements is meaningless.)
2. In converting Radar/Raingauge Analyzed precipitation originally on the Latitude/Longitude
coordinate to other coordinate, three options for the interpolation are available. The following
characters should be placed in the command line after -r.
• m: averaged values over grids on the original projection which are covered by the grid on
the target projection are adopted.
• x: maximum values over grids on the original projection which are covered by the grid on
the target projection are adopted.
• n: values on the nearest grids on the original projection is adopted.
4.2
Vertical transform
When you are going to transform the original terrain following hybrid coordinate of MA to the
isobaric coordinate, the configuration file describing a list of pressures of the isobaric planes is required
like the following, saved as config sample/config v.txt.
pout = 1000.0, 950.0, 925.0, 850.0, 700.0, 500.0, 300.0, 250.0, 200.0, 100.0
Each value in the list is separated by a comma, and the unit of pressure is hPa. No line breaks
should be inserted. Pressures in the list should be in descending order. Arbitrary pressure (but note
that the top of MA is located around 40hPa) can be specified as long as the number of pressures in
the list is less than 100.
With the configuration file describing a list of pressures, you can run the tool like
$ conv_jma_grib2 -v config_v.txt grib2_file
If surface pressure of one point on one isobaric plane is less than that of the isobaric plane, it means
that the point is located underground. Because extrapolated (physically meaningless) values are stored
to underground points by default, you should determine validness of each point by comparing surface
pressure and that of a isobaric plane. If -u is added in the command line, values on underground
points are set to MISSING (undef) instead of the extrapolated values.
When converting to the isobaric coordinate, temperature is stored instead of potential temperature
in the original GRIB2.
Note that you would like to transform horizontal and vertical coordinate simultaneously, both -h
config h and -h config v should be placed in the command line. If the both are requested, the
vertical coordinate is transformed before the horizontal one.
61
TECHNICAL REPORTS OF THE METEOROLOGICAL RESEARCH INSTITUTE No.76 2015
5
Other Command line options
-l
If -l is specified in the command line, a file containing values of latitudes and longitudes of all
points in the domain is generated in the GrADS format with a ctl file.
-p
If -p is specified in the command line, records in the GRIB2 are printed. After printing them, the
tool exits. No files are generated besides the printed information.
6
Quick reference
conv_jma_grib2 grib2_file [-h config_h_file] [-v config_v_file] [-o output_file]
[-g] [-p] [-d] [-r m|x|n] [-l] [-c] [-u]
-g: output in GRIB2 format
-p: only print records in grib2_file
-d: allow out of domain in coordinate conversion
-c: use pdef in GrADS ctl files
-u: set MISSING to values located underground
-r: RA interpolation option
m: mean
x: max
n: nearest
-l: output lat and lon in GrADS format
The identical explanation can be obtained by just executing the tool without any arguments.
One or more options can be specfied in general.
62
TECHNICAL REPORTS OF THE METEOROLOGICAL RESEARCH INSTITUTE No.76 2015
7
Examples
1. Just convert the GRIB2 file format to the GrADS one.
$ conv_jma_grib2 /home/john/jma_ma_met_XXXX.grib2.bin
The tool generates jma_ma_met_XXXX.grib2.bin.dat and jma_ma_met_XXXX.grib2.bin.ctl
in a directory /home/john.
2. Just convert the GRIB2 file format to the GrADS one, but a file name of outputs is specified.
$ conv_jma_grib2 /home/john/jma_ma_met_XXXX.grib2.bin -o after
Files named after.dat and after.ctl in the current directory.
3. The original GRIB2 files for R/A depict precipitation intensity with discrete integer level values.
The following operation produces a GRIB2 file again, but the discrete level values are interpreted
to real-number values using the conversion table in the original GRIB2 files. The generated
GRIB2 files do not employ any local-use templates, while the original ones use some of them.
$ conv_jma_grib2 /home/john/Z__C_RJTD_XXXX_Prr60lv_ANAL_grib2.bin -g
A GRIB2 file containing real-number precipitation intensity is created with a name
/home/john/Z__C_RJTD_XXXX_Prr60lv_ANAL_grib2.bin.grib2.bin.
4. Convert a horizontal coordinate following a configuration file
$ conv_jma_grib2 /home/john/jma_ma_met_XXXX.grib2.bin -h config_h.txt
where config_h.txt should be prepared in advance.
The tool generates jma_ma_met_XXXX.grib2.bin.dat and jma_ma_met_XXXX.grib2.bin.ctl
in a directory /home/john.
$ conv_jma_grib2 /home/john/jma_ma_met_XXXX.grib2.bin -h config_h.txt -d
By adding -d in the command line, points which the original data do not contain is fulfilled by
undef instead that the tool abnormally aborts.
$ conv_jma_grib2 /home/john/jma_ma_met_XXXX.grib2.bin -h config_h.txt -g
this operation generates a GRIB2 file jma_ma_met_XXXX.grib2.bin.grib2.bin instead of the
file in the GrADS format.
$ conv_jma_grib2 Z__C_RJTD_XXXX_Prr60lv_ANAL_grib2.bin -h config_h.txt -r n
Transform a coordinate of R/A following a configuration file config h.txt. In interpolating,
values on the nearest grids on the original projection is adopted.
5. Convert a vertical coordinate following a configuration file
63
TECHNICAL REPORTS OF THE METEOROLOGICAL RESEARCH INSTITUTE No.76 2015
$ conv_jma_grib2 /home/john/jma_ma_met_XXXX.grib2.bin -v config_v.txt
A rule to name files are the same as former examples.
$ conv_jma_grib2 /home/john/jma_ma_met_XXXX.grib2.bin -v config_v.txt -u
Values located underground in the generated file is set to undef.
6. Convert horizontal and vertical coordinate simultaneously
A
$ conv_jma_grib2 jma_ma_met_XXXX.grib2.bin -h config_h.txt -v config_v.txt
Lambert conformal conic projection
Coordinates x and y on the projected rectangular plane are given by:
(x − x0 )DX = ρ(φ) sin[α(λ − λ)] − ρ(φ0 ) sin[α(λ0 − λ)],
(y − y0 )DY = ρ(φ) cos[α(λ − λ)] − ρ(φ0 ) cos[α(λ0 − λ)]
where
R cos φ1 U (φ)α
, (R = 6371000 m: Radius of the Earth)
αU (φ1 )α
ln(cos φ1 ) − ln(cos φ2 )
α=
ln U (φ1 ) − ln U (φ2 )
(
)
φ
◦
,
U (φ) = tan 45 −
2
DX , DY : dx, dy,
ρ(φ) =
φ1 , φ2 : slat1, slat2,
λ : slon,
φ0 , λ0 : xlat, xlon,
x0 , y0 : xi, xj.
The symbols used above (dx, dy, slat1, slat2, slon, xlat, xlon, xi and xj) are explained in Section
4.1.2.
When you would like to convert x- and y- direction winds on the Lambert projection to zonal
and meridional winds, you should rotate the wind vectors by the following angle θ (θ > 0: clockwise
rotation)
θ = α(λ − λ),
where λ is the longitude of the point. Under the usual and recommended condition (slat1 = 30◦ ,
slat1 = 60◦ and slon = 140◦ ), α ' 0.715.
64
TECHNICAL REPORTS OF THE METEOROLOGICAL RESEARCH INSTITUTE No.76 2015
C-8. JMA Meso-scale 4D-VAR analysis1
JMA operates a data assimilation system for Meso-scale Analysis to initialize MSM (Section
C-2-1).
As of March 2011, the Meso-scale Analysis adopted a 4D-VAR data assimilation system,
which employs JMA-NHM as a time integration operator, named the “JMA Nonhydrostatic
model”-based Variational Analysis Data Assimilation (JNoVA; Honda et al. 2005, Honda and Sawada,
2008, 2009).
The analysis of 4D-VAR is obtained by minimizing a cost function in an iterative process.
JNoVA adopts the incremental approach (Courtier et al. 1994) to reduce the computational cost for
operational use.
In the incremental approach, a low-resolution model is used in the iterative process
called the “inner loop” to obtain an analysis increment while a high-resolution model is used to obtain
an analysis.
The minimization process is carried out as follows (ordinal numbers correspond to those
in Fig. C-8-1):
1.
Initialized with the previous Meso-scale Analysis, run the high-resolution (5km) forecast model
within the data assimilation window (0 to 3-hours) to obtain the first guess.
2.
Perform quality-control of observations (see Section 2.3 for details) and calculate deviations of
the observations from the first guess.
3.
Execute the JNoVA to assimilate the quality-controlled observations on a low-resolution (15km)
space.
This step is iterated to minimize the cost function until pre-defined criteria is satisfied.
At the end, analysis increments at the beginning of the data assimilation window are obtained.
4.
Add the analysis increments (on the low-resolution space) to the (high-resolution) first guess at
the beginning of the data assimilation window through an interpolation process, and make an
initial condition for the next step.
5.
With the initial condition made in the previous step, run the high-resolution (5km) forecast model
within the data assimilation window to obtain an analysis at the end of the data assimilation
window.
Fig. C-8-1. Schematic procedure of the Meso-scale Analysis (an example of 03UTC analysis).
1
Y. Honda
65
TECHNICAL REPORTS OF THE METEOROLOGICAL RESEARCH INSTITUTE No.76 2015
Table C-8-1. Specification of MSM, NLM and ADM used in JNoVA.
MSM
NLM
ADM
Resolution
5km, 50layers
15km, 40layers
15km, 40layers
Horizontal
Flux form fourth-order
Flux form fourth-order
Flux form fourth-order
advection
with advection correction
with advection correction
Solver of
HE-VI
HE-VI
HE-VI
Considered
Considered
Not considered
Moist physics
3-ice bulk microphysics
Large scale condensation
Large scale condensation
Convection
Modified Kain-Fritsch
Modified Kain-Fritsch
None
Turbulence
Mellor-Yamada
Deardorff
Deardorff
Louis (land)
Louis (land)
and Kondo (sea)
and Kondo (sea)
pressure equation
Targeted moisture
diffusion
-Nakanishi-Niino level 3
Surface flux
Beljaards and Holtslag
Ground
Four-layer thermal
Four-layer thermal
Four-layer thermal
temperature
diffusion
diffusion
diffusion
Radiation
Considered
Considered
Not considered
In JNoVA, a simplified nonlinear version of the JMA-NHM (NLM) is used in the inner loop to
provide trajectories at every iteration instead of the tangent linear model (TLM) of the NLM due to
discontinuity and nonlinearlity of the JMA-NHM. In addition, the adjoint model (ADM) of the NLM
is used to provide gradient information of the cost function.
The specification of these inner models,
NLM and ADM, as well as MSM is briefly listed in Table C-8-1.
JNoVA is capable of assimilating variety of observational data from conventional data to satellite
data.
The observation used in Meso-scale Analysis as of March 2011 is listed in Table C-2-2.
One
of the unique characteristics of Meso-scale Analysis is the direct assimilation of precipitation, which is
crucial for reproducing the realistic precipitation in the analysis.
In April 2009, JNoVA was introduced in Meso-scale Analysis by replacing a previous 4D-Var
system. Before its introduction, twin experiments were conducted under almost the same conditions as
the operational system in summer (2006/7/16 – 8/31) and in winter (2007/12/23 – 2008/1/23) to
compare the performance of JNoVA with that of a previous 4D-Var based on a limited-area hydrostatic
spectral model.
The quantitative precipitation forecast (QPF) of JNoVA is better than that of the
previous 4D-Var for all thresholds according to the equitable threat score (ETS) of three-hourly
accumulated precipitation forecasts (Fig. C-8-2).
Upper-air verification reveals that the analysis of
JNoVA is better than that of the previous 4D-Var, although the impact on the forecast is quite limited
(not shown).
From surface verification, it is found that the root mean square errors (RMSEs) of the
surface temperature in summer and the surface wind in winter are reduced, and that the scores of other
66
TECHNICAL REPORTS OF THE METEOROLOGICAL RESEARCH INSTITUTE No.76 2015
Fig. C-8-2. Equitable threat scores of three-hourly accumulated precipitation forecasts in summer (right) and
winter (left). The red and green lines show the results of JNoVA (Test) and the previous 4D-Var (CTRL),
respectively. The horizontal axis is the threshold value of the rainfall amount.
surface variables are neutral (not shown).
In the case of Typhoon Wukong (T0610), its typhoon track
forecast as well as precipitation forecast was improved by JNoVA (Fig. C-8-3).
More figures are
found in Honda and Sawada (2009).
Further detailed information on Meso-scale Analysis and JNoVA can be found in Section 2.6 of
JMA (2013).
Fig. C-8-3. Three-hourly accumulated precipitation of 24-hour forecasts from 17 Aug. 2006 at an initial time of
15 UTC. From the left, RA, the forecast of JNoVA and that of the previous 4D-Var are shown
67
TECHNICAL REPORTS OF THE METEOROLOGICAL RESEARCH INSTITUTE No.76 2015
C-9. Meteorological Field1
Before the hydrogen explosions of Fukushima Daiichi nuclear power plant, two weak low
pressure troughs accompanying a low pressure system passed over the Japanese Islands between 9 and
11 March 2011, bringing light rain over wide areas of eastern Japan (not shown). On 12 March, a high
pressure system covered the main island of Japan, and moved to the Pacific Ocean about 1000 km east
of the island on 13 March; however it continued to cover eastern Japan. The wind direction was from
the south below a height of 1 km and from the west above the height in the afternoon of 12 March, the
time of the hydrogen explosion of No.1 reactor (Fig. C-9-1a). During the daytime of 14 March, the
time of the hydrogen explosion of No.3 reactor, south-southwesterly (westerly) winds dominated
below (above) a height of 1 km (Fig. C-9-1b).
Between 12 and 15 March, a weak low pressure system (hereafter Low A) formed north of
Taiwan and moved eastward off the southern coast of the main island of Japan (Fig. C-9-2). After 15
March the system moved toward the northeast while developing rapidly. Light rain was observed over
eastern Japan from the afternoon of 15 March to the morning of 17 March, while less rain was
observed there until the morning of 15 March (Fig. C-9-4). In particular, rain was observed in the
Fukushima prefecture during the night from 1700 JST 15 to 0400 JST 16 March (e.g., Fig. C-9-5), a
time corresponding with significant emissions. Weak precipitation intensity was observed over most
areas of the Fukushima prefecture, and the precipitation systems had low vertical structures (Fig.
C-9-6).
North-northeasterly low-level winds dominated during the morning of 15 March. In particular,
the wind speed exceeded 10 m s-1 over south areas of the Ibaraki prefecture at the time of the container
burst of No. 2 reactor. In the afternoon, the wind direction rotated clockwise and gradually changed to
south over the Fukushima prefecture (Fig. C-9-7). This wind change was caused by another low
pressure system (Low B) that formed over the Kanto Plain, east of Low A (Fig. C-9-3). Chino et al.
(2011) estimated that the maximum I-131 emissions occurred between 0900-1500 JST (0000-0600
UTC), 15 March. During that period the winds had the eastward component (cold color) below a
height of 1 km and westerly winds (warm color) dominated above the height (Fig. C-9-1c). The
low-level easterly component was brought from the circulation of Low A located over the ocean
southeast of Ibaraki prefecture (Fig. C-9-2). After 1500JST southeast winds appeared associated with
Low B around a height of 1 km and lasted until 0200JST next day (Figs. C-9-1c and 1d).
Between 18 and 19 March, a high pressure system covers widely the Japanese Islands
(middle-row panels in Fig. C-9-2), and winds were generally from the west. Then, a low pressure
system passed over the main island of Japan from 20 and 22 March (bottom panels in Fig. C-9-2),
bringing moderate rain over the Kanto area (bottom panels in Fig. C-9-4).
1
T. Kato
68
TECHNICAL REPORTS OF THE METEOROLOGICAL RESEARCH INSTITUTE No.76 2015
Fig. C-9-1. Time series of horizontal winds (arrows) and zonal wind speed (color shade) below a height of 5
km observed by a JMA wind profiler at Mito (See its location in Fig.C-9-7). (a) From 1210 JST to 2400 JST,
March 12. (b) From 0910 JST to 2100 JST, March 14. (c) From 0410 JST to 1600 JST, March 15. (d) From
1610 JST, March 15 to 0400 JST, March 16. Pink arrows show the times of hydrogen explosion of No. 1
reactor for (a) and No.3 reactor for (b) and that of container burst of No.2 reactor for (c). Full and half barbs
denote 5 m s-1 and 2.5 m s-1, respectively, and pennants denote 25 m s-1.
69
TECHNICAL REPORTS OF THE METEOROLOGICAL RESEARCH INSTITUTE No.76 2015
Fig. C-9-2.
Surface weather charts at 00UTC (09 JST) from 12 to 23 March, 2011.
Fig. C-9-3.
Surface weather charts at 12UTC (21 JST) 15 March 2011.
70
TECHNICAL REPORTS OF THE METEOROLOGICAL RESEARCH INSTITUTE No.76 2015
Fig. C-9-4. Horizontal distributions of 24-hour accumulated precipitation amounts and observed surface winds
at 0000 UTC (0900 JST) between 13 and 24, March 2011. Red cross on the left-top panel shows the location
of Iidate.
Fig. C-9-5. Time series of hourly accumulated precipitation amounts (bar) and total amount (line) at Iidate
(See its location in the left-top panel of Fig.C-9-4) between 0600 JST 15 and 0600 JST 16, March 2011.
71
TECHNICAL REPORTS OF THE METEOROLOGICAL RESEARCH INSTITUTE No.76 2015
(a)
(b)
Fig. C-9-6. (a) Horizontal distribution of precipitation intensity estimated by JMA radar at 2000 JST 15 March
2011, and (b) vertical cross section of red line in (a).
Fig. C-9-7. Horizontal winds at about a 540 m height above the model surface (stream lines), their speed (color
shade) and sea level pressure (pink contours) depicted from mesoscale analysis of JMA between 2100 UTC,
14 (0600 JST, 15) and 1200 UTC (2100 JST), 15 March 2011. Black crosses show the location of Mito.
72
TECHNICAL REPORTS OF THE METEOROLOGICAL RESEARCH INSTITUTE No.76 2015
D. ATDM experiments
D-1. Design of the Task Team Experiment1
The ATDMs used by the WMO Task Team members included MLDP0 (Modèle Lagrangien de
Dispersion de Particules d’ordre 0 – Canada; D’Amours et al., 2010), HYSPLIT (Hybrid SingleParticle Lagrangian Integrated Trajectory Model - United States; Draxler and Hess, 1997), NAME
(Numerical Atmospheric-dispersion Modelling Environment - United Kingdom; Jones et al. 2007),
RATM (Regional Atmospheric Transport Model – Japan; Shimbori et al., 2010), and FLEXPART
(Lagrangian Particle Dispersion Model – Austria; Stohl et al., 2005). All ATDMs were of a class of
models called Lagrangian Particle Dispersion Models (LPDMs). The transport and dispersion of
individual pollutant particles or gases are simulated in a computational framework that follows the
position of the individual element by its mean motion from the wind fields and a turbulent component
to represent the dispersion.
These models are all run in off-line mode, meaning that the
meteorological fields needed as input to the ATDM have to be made available before the runs are
conducted.
There were four global meteorological analyses data sets (Canada, United States, European Center
for Medium-Range Weather Forecasts, UK Met Office) and two regional high-resolution analyses
(Japan) available for use by the ATDMs. These data sets are briefly described in Table D-1-1.
Table D-1-1. Summary of the meteorological analyses fields available for the ATDM calculations.
Meteorological Center’s Product
CMC’s Global Environmental Multiscale
system
NOAA’s Global Data Assimilation System
The European Centre for Medium-Range
Weather Forecasts
UKMET’s operational global Unified Model
Acronym
GEM
Space
0.30o
Time
6h
Vertical
Sigma
GDAS
ECMWF
3h
3h
Hybrid sigma
Hybrid sigma
3h
Height levels
3h
30 min
Hybrid height
levels
Surface
JMA’s mesoscale analyses fields
MESO
0.50o
0.125o
and 0.2o
0.23o by
0.35o
5 km
JMA’s radar-rain gauge-analyzed precipitation
RAP
1 km
MetUM
Each participating modeling center used its own dispersion model with one or more of the
meteorological data sets, resulting in 18 different combinations of dispersion models and
meteorological input data for the initial analysis provided to UNSCEAR (Table D-1-2) using their
preliminary source term.
Subsequently, JMA revised its dispersion model and two additional
simulations were available for the task team summary (Draxler et al., 2015) that used the Terada
(2012) source term.
1
R. Draxler
73 TECHNICAL REPORTS OF THE METEOROLOGICAL RESEARCH INSTITUTE No.76 2015
Table D-1-2. ATDM-Meteorology simulations completed (C) by each participating ATDM model
(rows) with different meteorological data (columns) and also the ATDM simulations enhanced with
the RAP data (R).
Data / Model
CMC-MLDP0
JMA-RATM
NOAA-HYSPLIT
UKMET-NAME
ZAMGFLEXPART
CMC NOAA
C
C,R
ECMWF MetUM
C,R
C
C,R
C,R
C
JMA
C
C,R
C,R
C,R
One critical aspect for the quantitative predictions of air concentration and deposition is the wet
and dry scavenging that occurs along the particle’s transport pathway. Since following a large
number of radionuclides could be computationally prohibitive, only three generic species were
tracked as surrogates for all of the radionuclides: a gas with no wet or dry scavenging (noble gas), a
gas with a relatively large dry deposition velocity and wet removal to represent gaseous
131
I, and a
particle with wet removal and a small dry deposition velocity to represent all the remaining
radionuclide particles.
There can be considerable variability in scavenging coefficients and
deposition processes. Each ATDM had its own unique treatment of these processes which are
described in more detail in Chapter F.
The ATDMs were all run “off-line” meaning that space and time varying meteorological data
fields for the computational period must be available. The period of 11 – 31 March 2011 was
determined to be the time window of greatest interest. Given the uncertainties in the emissions and
the temporal frequency of meteorological analyses, the release periods were divided into three-hour
duration segments. The emission rate is assumed to be a constant for each three-hour period. A
separate 72 hour duration ATDM calculation was made for each radionuclide release period which
was sufficiently long to permit particles to exit the regional sampling domain. After testing the
ATDM calculations with several different particle number release rates and considering the regional
nature and resolution of the concentration grid, the emissions were represented by the release of
100,000 particles per hour with a total mass of one unit per hour. Because of the uncertainty in the
actual value of the time varying release height, particles were uniformly released from ground-level to
100 m.
The ATDM calculations were started every three hours from 11 March 0000 UTC through 31
March 2100 UTC, resulting in 168 independent calculations.
All ATDMs used a predefined
concentration/deposition grid configuration of 601 (west to east) and 401 (south to north) grid cells on
a regular latitude-longitude grid at 0.05 degrees resolution (about 5 km) centred at 38N and 140E (Fig.
D-1-1). The output was configured to provide 3-hour averages for air concentrations and 3-hour
74 TECHNICAL REPORTS OF THE METEOROLOGICAL RESEARCH INSTITUTE No.76 2015
deposition totals. Air concentration and deposition at any one point in space and time are computed
by adding together the contribution of the each of the release period calculations (within that 72 hour
window) contributing to desired sampling period.
Fig. D-1-1. The air concentration and deposition grid (blue) and mesoscale analysis data grid (red).
Because of the fact that emissions were not finalized at the beginning of the TT study, and the
undetermined number of radionuclides that might be required, all ATDM computations were done
using a unit source emission rate. The calculation for each emission period provides the dispersion
and deposition factors from the release point for that emission period to all downwind grid locations,
defining what fraction of the emissions are transferred to each location for every output time period.
The set of calculations for all emission times can be defined as the Transfer Coefficient Matrix (TCM).
When quantitative results are required, the actual air concentrations and depositions are computed in a
simple post-processing step by assigning the TCM computational surrogate to a specific radionuclide,
multiplying the TCM by the appropriate time-varying emission rates and radioactive decay constant.
The emissions that were provided had been decay-corrected to 0600 UTC 11 March. Therefore in the
post-processing computation of air concentration and deposition, individual radionuclide decay rates
are applied starting from the normalization time. Using this methodology, results for multiple
75 TECHNICAL REPORTS OF THE METEOROLOGICAL RESEARCH INSTITUTE No.76 2015
emission scenarios can easily be obtained without rerunning any of the ATDMs.
A detailed
description of this approach is given by Draxler and Rolph (2012). The TCM concept is a specific
operational realization of the source receptor matrix concept and similar to the backtracking
computations to create Source Receptor Sensitivity Fields (Wotawa et. al., 2002).
76 TECHNICAL REPORTS OF THE METEOROLOGICAL RESEARCH INSTITUTE No.76 2015
D-2. Reverse estimation of amounts of 131I and 137Cs discharged into the atmosphere1
During the Fukushima Daiichi Nuclear Power Plant (FDNPP) accident, an urgent task was to assess
the radiological dose to the public resulting from the atmospheric release of radionuclides. This
assessment was done by using both environmental monitoring data and computer simulations based on
atmospheric dispersion modeling. However, source terms (e.g., the release rates and durations of
radionuclides) essential to computer simulations of atmospheric dispersion were not available,
although stack monitors or a severe accident analysis were expected to provide them. The Japan
Atomic Energy Agency (JAEA), in cooperation with the Nuclear Safety Commission of Japan (NSC),
has attempted to estimate the source terms of iodine and cesium discharged from FDNPP into the
atmosphere by a reverse estimation method. In this method, the source terms are estimated by coupling
environmental monitoring data with atmospheric dispersion simulations under the assumption of a unit
release rate (1 Bq h–1). We estimated the release rates and total amounts of
131
I and
137
Cs discharged
from FDNPP from 12 March to 1 May 2011.
D-2-1. Reverse estimation method
The release rates of radionuclides (Bq h–1) are calculated by dividing measured atmospheric activity
concentrations of each radionuclide (131I and
137
Cs) by simulated ones at each sampling point as
follows:
Qi = M i Ci ,
(D-2-1)
where Qi is the release rate (Bq h–1) of radionuclide i into the atmosphere, Mi is the measured
atmospheric activity concentration (Bq m–3) of radionuclide i, and Ci is the dilution factor (h m–3) of
radionuclide i, which is equal to the activity concentration simulated under the assumption of a unit
release rate (1 Bq h–1). Peak values from a time series of continuous measurement data were adopted
for both the measured and calculated values used in Eq. (D-2-1). If concentration data for the source
term estimation were available from two or more different measurement sites at the same time, only
the highest value was used in the release rate calculation.
When atmospheric activity concentration data were not available, the release rates were estimated
by comparing measured air dose rates due to radionuclides in plumes and/or on the ground surface
with simulated rates derived from the simulations with a unit release rate, by assuming the
radionuclide composition (iodine, cesium, etc.).
Total release amounts were estimated by time integration of the release rates as follows:
[
]
S i = ∑ Qi , j × T j ,
(D-2-2)
where Si is the total released amount (Bq) of radionuclide i, Qi,j is the release rate (Bq h–1) of
radionuclide i at time j, and Tj (h) is the duration of the period when the release rate Qi,j was estimated
to continue. When no monitoring data were available at time j, release rates obtained before or after
time j were temporally interpolated or extrapolated.
1
H. Terada and M. Chino
77
TECHNICAL REPORTS OF THE METEOROLOGICAL RESEARCH INSTITUTE No.76 2015
D-2-2. Environmental monitoring data
Environmental monitoring data of atmospheric activity concentrations of iodine and cesium
(hereafter, dust sampling data) were mainly used for the source term estimation. We assumed that
gaseous and particulate iodine were sampled according to the NSC’s guidelines for environmental
radiation monitoring (NSC, 2010), which recommends the use of dust samplers with charcoal
cartridges for gaseous iodine. The data used in the estimation are available on the web sites of the
Ministry of Education, Culture, Sports, Science and Technology (MEXT) (MEXT, 2011a), the
Ministry of Economy, Trade and Industry (METI) (METI, 2011), the Japan Chemical Analysis Center
(JCAC) (JCAC, 2011), and JAEA (Furuta et al., 2011). These data were collected in eastern Japan,
mainly Fukushima Prefecture. Air dose rate monitoring data from MEXT (MEXT, 2011b) and
Fukushima Prefecture (Fukushima Prefecture, 2011a, 2011b) indicated that the atmospheric release of
radionuclides in the daytime of 15 March resulted in a large amount of ground deposition and, thus,
high dose rates in the sector to the northwest of FDNPP. However, because no dust monitoring data
were available in the daytime of 15 March, the release rates of
131
I and
137
Cs at that time were
estimated by comparing measured air dose rate patterns due to ground shine with simulated patterns
after the plume had moved away from this region. Similarly, the release amount on the afternoon of 12
March was also estimated from ground shine. The measurement data used for source term estimation
are described in detail by Chino et al. (2011), Katata et al. (2012a, 2012b), and Terada et al. (2012).
D-2-3. Atmospheric dispersion simulation
The System for Prediction of Environmental Emergency Dose Information (SPEEDI) (MEXT,
2007), which is operated by the Nuclear Safety Technology Center of Japan, and the Worldwide
version of SPEEDI (WSPEEDI-II) (Terada et al., 2008) developed by JAEA, were used for calculating
atmospheric activity concentrations and air dose rates. The NSC provided the simulation results from
SPEEDI to JAEA for the purpose of this source term estimation. Atmospheric dispersions of
radionuclides were simulated by successive uses of the PHYSIC meteorological prediction model and
the PRWDA21 atmospheric dispersion model in SPEEDI, and MM5 and GEARN in WSPEEDI-II.
These models are described in detail by Nagai et al. (1999) and Terada and Chino (2008).
D-2-4. Results
Figure D-2-1 shows the estimated temporal variation in release rates of 131I and 137Cs (Terada et al.,
2012) from 05:00 Japan Standard Time (JST = UTC + 9 h) on 12 March to 00:00 JST on 6 April 2011.
Chino et al. (2011), Katata et al. (2012a, 2012b), and Terada et al. (2012) have described the source
term estimation results in detail. Here, the estimation results are only outlined.
On the morning of 12 March, leakage of radionuclides from the Unit 1 primary containment vessel
(PCV-U1) was detected, but the level of leakage was lower than that at later stages of the accident. At
15:36 JST on the afternoon of 12 March, a hydrogen explosion at Unit 1 increased the release rates of
radionuclides. Between 15:30 and 16:00 JST, the estimated release rates were 3.0 × 10¹⁵ and 3.0 × 10¹⁴
Bq h–1 for 131I and 137Cs, respectively.
78
TECHNICAL REPORTS OF THE METEOROLOGICAL RESEARCH INSTITUTE No.76 2015
Venting operations were conducted to decrease the internal pressure of PCV-U3 at 09:24 and 12:30
JST on 13 March and at 05:20 JST on 14 March. However, the simulated plume mainly flowed toward
the ocean on these days. In spite of these venting operations, a hydrogen explosion occurred at Unit 3
at 11:01 JST on 14 March. Because we had no sampling data from that time, we assumed that the
release amounts were the same as those after the hydrogen explosion at Unit 1.
During the night of 14 March, dry venting was attempted at Unit 2. Though it is not clear whether
the venting succeeded, the plume flowed south to south-southwest during this period. The observed air
dose rates at Fukushima Daini Nuclear Power Plant (11.4 km to the south of FDNPP) and Kitaibaraki
(80 km to the south) and atmospheric activity concentrations of 131I and 137Cs at JAEA-Tokai (100 km
to the south) were high. By our source term estimation, the release rates of 3.5 × 10¹⁴ to 1.3 × 10¹⁵ Bq
h–1 for 131I and of 4.0 × 10¹³ to 1.3 × 10¹⁴ Bq h–1 for 137Cs were estimated for the night of 14 March.
Between 07:00 and 12:00 JST on 15 March, the internal pressure of PCV-U2 decreased. This
decrease corresponded to an extreme increase in the air dose rate to 1.5 × 10⁴ µGy h–1, observed at the
main gate from 07:00 to 10:00, which was clearly due to an increase in the release rate. The release
rate from 07:00 to 10:00 was estimated to be 3.0 × 10¹⁵ for
131
I and 3.0 × 10¹⁴ Bq h–1 for
137
Cs. After
this major release on the morning of 15 March, the internal pressure of PCV-U2 continued to
decrease during the afternoon. The plume discharged during the afternoon of 15 March was carried
directly toward Iitate village and Fukushima City by southeasterly winds, and a large amount of wet
deposition occurred northwest of FDNPP. From 13:00 to 17:00 JST on 15 March, the estimated release
rates of 131I and 137Cs increased again, to 4.0 × 10¹⁵ and 4.0 × 10¹⁴ Bq h–1, respectively.
From 16 March to the early morning of 20 March, the plume was carried primarily toward the
Pacific Ocean by westerly and northwesterly winds; consequently, too few monitoring data were
available for estimating the source terms. Instead, we estimated the source terms during this period by
temporal interpolation of those estimated during the period when observation data were available.
Beginning on 20 March, the direction of the plume again became landward. By this time, a
systematic environmental monitoring had been established to measure atmospheric activity
concentrations in Fukushima Prefecture. From 20 to 24 March, the estimated release rates of
131
I and
137
Cs were in the range of 1.4 × 10¹⁴ to 7.1 × 10¹⁴ Bq h–1 and 1.1 × 10¹² to 3.5 × 10¹³ Bq h–1,
respectively.
After 25 March, the estimated release rates gradually decreased, although a temporary increase to
the rate on 20 March occurred on 30 March. Subsequently, the release rates decreased continuously,
and from the beginning of April estimation of the source terms by the reverse estimation method was
difficult because no clear increases in atmospheric activity concentrations and the air dose rates were
detected.
Using Eq. (D2-2), we estimated the total amounts of
131
I and
137
Cs discharged into the atmosphere
from 05:00 JST on 12 March to 00:00 JST on 1 May to be approximately 1.2 × 10¹⁷ and 8.8 × 10¹⁵ Bq,
respectively.
79
TECHNICAL REPORTS OF THE METEOROLOGICAL RESEARCH INSTITUTE No.76 2015
D-2-5. Future Tasks
The uncertainty of the estimated release rates is mainly due to that of the atmospheric dispersion
calculations and the limited temporal and spatial coverage of the monitoring data. By comparing
available observations and simulated results, we made the following simplified adjustments in the
source term estimation.
-
When there was a slight discrepancy in plume location between the simulation and the
observations, the simulated plume distribution was rotated to reduce the discrepancy.
-
When small differences were seen in plume arrival times between the simulation and the
observations, the peak concentration values in the continuous measurement time series were used
together with the simulated results for the release rate calculation.
Even after these adjustments, the error of the estimated release rates was at least a factor of 5. To
estimate the total amounts of the radionuclides discharged into the atmosphere, the release rates were
interpolated or extrapolated when no dust sampling data were available. The uncertainty due to this
procedure cannot be assessed by using the presently available data. To estimate the temporal variation
of release more accurately, further investigation of environmental data and technical evaluation by
specialists of the reactor analysis and environmental fields are required.
Fig. D-2-1. Estimated temporal variations of the release rates of 131I and 137Cs from 05:00 JST on 12 March to
00:00 JST on 6 April 2011.
80
TECHNICAL REPORTS OF THE METEOROLOGICAL RESEARCH INSTITUTE No.76 2015
D-3. Verification Methods1
The TT concluded that the most robust overall metric would be to evaluate the ATDM’s
performance by comparing the model predicted patterns of 137Cs deposition to the available deposition
measurements. The accumulated
137
Cs deposition field has the advantage of the availability of
measurements over a wide region. However, one disadvantage is that the bulk of the deposition
occurred during only a few time periods. There are also no deposition measurements over water,
effectively excluding all episodes with westerly winds from the analysis. In addition to deposition,
there is considerable interest in how well the ATDM-meteorology combinations can represent the air
concentration data. However, in terms of radionuclide specific measurements, air concentration data
were available at only a few locations. Air dose rate measurements could not be used for the TT
analysis.
To perform a quantitative analysis of the ATDM-meteorology combinations, the TT used the 137Cs
deposition first reported by the Japanese Ministry of Education and Science and Technology (MEXT,
2011c). The ground-level results were merged with the observations by the U.S. Department of
Energy’s (USDOE, 2011) fixed-wing aircraft (C-12) from 2 April 2011 to 9 May 2011. The collected
aircraft and ground based data points were averaged onto a grid (0.05 degree resolution) that was
identical to the one used in the ATDM calculations. The aircraft based sampling covered 374 grid
points and blending in the additional ground based MEXT data resulted in a total of 543 grid points
for model verification. Note that the final deposition product shown in Fig. D-3-1 captures the
heaviest deposition in the Fukushima prefecture, but does not include any of the deposition to the
southwest.
Fig. D-3-1. Averaged MEXT surface deposition and U.S. DOE aircraft based deposition measurements of 137Cs
and the location of the Toki-Mura air sampling site.
1
R. Draxler
81 TECHNICAL REPORTS OF THE METEOROLOGICAL RESEARCH INSTITUTE No.76 2015
After the accident at the Fukushima Daiichi Nuclear Power Plant, radiation was monitored at the
Nuclear Fuel Cycle Engineering Laboratories, Japan Atomic Energy Agency (JAEA) at their TokaiMura location (see Fig. D-3-1). Furuta et al. (2011) provides the monitoring results of dose rates, air
concentrations, and deposition until 31 May 2011. The TT used the time series of
137
Cs and
131
I
(aerosol and gas) air concentrations for the ATDM-meteorology evaluations for the 11-31 March
period.
Procedures for evaluating ATDM calculations have a long history but the problem eludes simple
solutions because the variability in atmospheric motions and processes cannot be deterministically
represented in any model resulting in the inevitable mismatches between paired in space and time
predicted and measured concentrations.
The ATDM-meteorology evaluation protocol used here
follows the procedure described by Draxler (2006), including a ranking method that gives equal
weight to the normalized (0 to 1) sum of the correlation coefficient (R), the fractional bias (FB), the
figure-of-merit in space (FMS), and the Kolmogorov-Smirnov parameter (KSP), such that the total
model rank would range from 0 to 4 (from worst to best),
Rank = R2 + 1-|FB/2| + FMS/100 + (1-KSP/100).
(D-3-1)
The correlation coefficient (R), also referred to as the Pearson’s Correlation Coefficient (PCC), is
used to represent the scatter among paired measured (M) and predicted (P) values:
R=
(M M )(P P )
(M M ) (P P )
i
i
,
i
2
2
(D-3-2)
i
where the summation is taken over the number of samples and the over-bar represents a mean value.
A normalized measure of bias is the fractional bias (FB). Positive values indicate over-prediction and
FB ranges in value from –2 to +2 and it is defined by:
FB = 2
(PM )
.
( P+M )
(D-3-3)
The normalized mean square error (NMSE) is defined as:
NMSE =
1
1
M P N
M
Pi .
2
i
(D-3-4)
The NMSE provides information on the deviations and not on the overestimation or
underestimation. This parameter is very sensitive to differences between measured and predicted
values. Perfect model results would have a NMSE value of zero. A similar metric is the root mean
square error (RMSE), which is the square root of NMSE without normalization by (M-P).
82 TECHNICAL REPORTS OF THE METEOROLOGICAL RESEARCH INSTITUTE No.76 2015
The spatial distribution of the calculation relative to the measurements can be determined from the
Figure of Merit in Space (FMS), which is defined as the percentage of overlap between measured and
predicted areas. Rather than trying to contour sparse measurement data, the FMS is calculated as the
intersection over the union of predicted (p) and measured (m) concentrations in terms of the number
(N) of samplers with concentrations greater than a pre-defined threshold (zero):
FMS = 100
NP NM
.
NP NM
(D-3-5)
Differences between the distribution of unpaired measured and predicted values is represented by
the Kolmogorov-Smirnov parameter, which is defined as the maximum difference between two
cumulative distributions when Mk = Pk, where
KSP = Max | D(M k ) D(Pk ) | ,
(D-3-6)
and D is the cumulative distribution of the measured and predicted concentrations over the range of k
values such that D is the probability that the concentration will not exceed Mk or Pk. It is a measure of
how well the model reproduces the measured concentration distribution regardless of when or where
it occurred. The maximum difference between any two distributions cannot be more than 100%.
83 TECHNICAL REPORTS OF THE METEOROLOGICAL RESEARCH INSTITUTE No.76 2015
D-4. The NOAA ARL Website1
As part of the evaluation process, the unit-source dispersion and deposition calculations from all
the TT members were posted on a web page (http://ready.arl.noaa.gov/READY_fdnppwmo.php)
hosted by the U.S. National Oceanic and Atmospheric Administration (Fig. D-4-1). The web interface
provided a way for the TT members to evaluate their results, compare them to those of the other
members, and permit the UNSCEAR emission group to test various emission scenarios and compare
the results to measured deposition and air concentration data.
Fig. D-4-1. The home page for the WMO Fukushima meteorological evaluation results.
The web site provided access to all the ATDM-Meteorology combinations that were created
during the Task Team’s effort, various ensemble combinations of different members, as well as the
results of additional calculations that were conducted by various members after the conclusion of the
TT activities. The web site is still open to accept additional ATDM model results as long as they
match the computational protocols. Upon selecting an ATDM-meteorology combination for analysis,
a second web page is opened that permits the selection of a default source term (Fig. D-4-2). The
available source terms may change from time to time, but the JAEA-Terada source term is the final
one used by UNSCEAR. Various new source terms are under consideration.
G. Rolph (NOAA) and R. Draxler
1
84
TECHNICAL REPORTS OF THE METEOROLOGICAL RESEARCH INSTITUTE No.76 2015
Fig. D-4-2. The source-term selection page.
Selection of any one source term just pre-populates the next page with 3-hourly values for
and gaseous and particulate
131
137
Cs,
I (Fig. D-4-3). The web user may change the value of any of the pre-
populated values to determine the effect on the final results. Although the source terms are defined
for each 3-hour emission period, which corresponds to one ATDM simulation, the rate is given in
Becquerels per hour. The emission entry page also permits the definition of any new species; the
identification field is arbitrary, but the half-life and species type (noble gas, depositing gas, or
particle) defines the subsequent calculation. The source term for each three-hour period is multiplied
by the ATDM calculation for that time period and the air concentration and deposition grids from all
ATDM simulations are added together for the same period to obtain the final values. Unless other
species are requested to be included, the calculations will only be done for
requires another pass through all the data files.
85
137
Cs. Each species
TECHNICAL REPORTS OF THE METEOROLOGICAL RESEARCH INSTITUTE No.76 2015
Fig. D-4-3. Source term entry page.
Pressing the continue button opens the verification selection page (Fig. D-4-4) where the air
concentration or deposition measurements used for verification may be selected.
Only two air
concentration locations with measurement data are available for selection (Tokai-Mura and Takasaki),
although other locations can be entered to extract model predictions at those locations. The default
deposition is the one used for the WMO Task Team effort, the combination of DOE airborne and
MEXT ground based measurements. However, recently added were the results of the MEXT airborne
survey of May 2012, which includes results from all the prefectures, not just Fukushima.
86
TECHNICAL REPORTS OF THE METEOROLOGICAL RESEARCH INSTITUTE No.76 2015
Fig. D-4-4. Verification selection page.
When the calculations have been completed, the model results page opens (not shown), which
shows icons of the time series and scatter diagrams as well as text summaries of the statistical results.
The deposition results have some text links rather than icons. Creating a deposition map requires a
second step, where the time period as well as the contour intervals must be selected. Various output
formats are available.
87
TECHNICAL REPORTS OF THE METEOROLOGICAL RESEARCH INSTITUTE No.76 2015
D-5. Task team final report and follow-up1
D-5-1. Task team final report and WMO technical publication
The final report of the Task Team was as uploaded as ANNEX III of the third meeting report on the
website
of
WMO’s
CBS-DPFS/ERA
related
Meetings
page
Reports/documents/WMO_fnpp_final_AnnexIII_4Feb2013_REVISED_17June2013.pdf),
and
(http://www.wmo.int/pages/prog/www/CBSpublished as WMO technical publication No. 1120 (Draxler et al. 2013a). The UNSCEAR (Fischer
2012) and JMAEA source terms (Section D-2) were used for verification. In Section 10 of the above
mentioned reports, an ensemble analysis and discussion on ATDM uncertainty based on UNSCEAR
source term is included. In addition, a more complete discussion of the ensemble analyses has been
published by Solazzo and Galmarini (2015).
D-5-2. Presentations at the 93rd meeting of AMS and EMS and related publications
The 93rd American Meteorological Society annual meeting was held in Austin, Texas from January
6 to 10, 2013. A "Special Symposium on the Transport and Diffusion of Contaminants from the
Fukushima
Dai-Ichi
Nuclear
Power
Plant:
Present
Status
and
Future
Directions”;
https://ams.confex.com/ams/93Annual/webprogram/FUKUSHIMASYMP.html) was organized there,
and presentations were made on various topics such as an overview of the effects on the human body ,
emission source estimation, observations, limited model analysis, global ocean model analysis, and
international cooperation. Draxler et al. (2013b) reported on the WMO Task Team results and Saito et
al. (2013) presented JMA’s contribution to the WMO Task Team activities. The presentations of the
symposium are summarized by Kondo et al., 2013. Wotawa et al. (2013) also reported on some of the
task Team’s ATDM comparative experiments at the European Meteorological Society’s annual meeting.
Five papers relating to the Task Team activities have been published in the Fukushima nuclear
accident special issue of the Journal of Environmental Radioactivity (Draxler et al., 2015; Arnold et al.,
2015; Saito et al., 2015; Leadbetter et al., 2015; Solazzo and Galmarini, 2015).
D-5-3. UNSCEAR 60th General session and its final report
The 60th General Assembly of UNSCEAR was held in Vienna from May 27 to 31, 2013
(http://www.unscear.org/unscear/en/about_us/sessions.html).
UNSCEAR
website
The meeting report is available from the
(http://daccess-ods.un.org/TMP/9420922.3985672.html).
An
UNSCEAR
evaluation report on the Fukushima Daiichi nuclear power plant accident (UNSCEAR, 2014) was
published separately in April 2014 as ANNEX A.
From the task team final report, the results of the
calculation of the NOAA ATDM and meteorological conditions were included in Appendix B.
1
K. Saito and R. Draxler
88
TECHNICAL REPORTS OF THE METEOROLOGICAL RESEARCH INSTITUTE No.76 2015
E. JMA-RATM1
E-1. Original and Preliminary RATM
E-1-1. Description of RATM
The JMA-RATM (Japan Meteorological Agency Regional Atmospheric Transport Model, called
the ‘RATM’ in this chapter) is a mesoscale tracer transport model, which can be driven by the
JMA-MESO analysis GPVs (grid point values). The model takes a Lagrangian scheme (Iwasaki et al.,
1998; Seino et al., 2004) with many computational particles that follow advection, horizontal and
vertical diffusion, gravitational settling, wet scavenging and dry deposition processes. The RATM was
originally developed at JMA for photochemical oxidant predictions (Takano et al., 2007) and
volcanic-ash fall forecasts (Shimbori et al., 2009). In this section, we describe the original version of
RATM (Shimbori et al., 2010) and a preliminary version of RATM to simulate radionuclides for the
WMO technical Task Team (Saito et al., 2015). Flowchart of the RATM calculation for radionuclides
is shown in Fig. E-1-1. Specifications of each version of the RATM are summarized in Table E-1-1.
Initial condition
Unit release at FDNPP
Meteorological fields
Time evolution
MESO analyses
JMA-RATM
Precipitation data
MESO or RAP data
Multiplier
Outputs
Emission rate and
decay factor
Calculation for the air concentration and
surface deposition
Fig. E-1-1. Flowchart of the JMA-RATM calculation for radionuclides.
a. Advection
We write the position
,
for each computational particle at time
,
. The time
evolution after the time step ∆ is given by
∆
∆
∆
(E-1-1a)
∆
∆
∆
(E-1-1b)
∆
∆
with the mean wind velocity
2
∆ Γ
,
,
(E-1-1c)
∆
. On the right-hand sides of above equations, the
second and third terms represent advection and diffusion, respectively. The forth term of Eq. (E-1-1c)
represents gravitational settling.
1
T. Shimbori and K. Saito
89
TECHNICAL REPORTS OF THE METEOROLOGICAL RESEARCH INSTITUTE No.76 2015
Original
for JMA Volcanic Ash
Fall Forecast1
Version
Model type
Input meteorological field
Number of particles
Time step
Horizontal
Advection
Vertical
Horizontal diffusion
Vertical diffusion
Gravitational settling2
(grain-size distribution)
Wet
scavenging2
Table E-1-1. Specifications of JMA-RATM.
Preliminary
Revised
for WMO Task Team
Three-hourly outputs of MESO analysis GPVs
100,000/3 h
Not adjusted
Washout3
(below-cloud)
Vpar: Kitada (1994) with
MESO forecast (liquid
rain)
Rainout
(in-cloud)
Vpar: N/A
300,000/3 h
10 min.
5 min.
Forward difference with spherical triangle
Spatially-average and terrain-following at lowest model level
Gifford (1982, 1984)
Louis et al. (1982)
Ngas: N/A
Dgas: N/A
Lpar: Stokes’ law with Cunningham correction (log-normal with Dm=1 μm, σD=1.0)
Ngas: N/A
Ngas: N/A
Dgas: N/A
Ngas: N/A
Dgas: N/A
Lpar: Kitada (1994) with
Dgas: N/A
Lpar: same as left except
MESO analysis (liquid
Lpar: same as left except using MESO analysis
application height below
rain) or RAP data below
(liquid rain, solid snow and graupel)
1500 m a.s.l.
3000 m a.s.l.
Ngas: N/A
Dgas: Hertel et al. (1995)
Lpar: N/A
Ngas: N/A
Dgas: Vd=0.01 m s-1 (Draxler and Rolph, 2012)
Lpar: Vd=0.001 m s-1 (Draxler and Rolph, 2012)
Reflection on the ground
N/A
Iwasaki et al. (1998)
Radioactive decay
N/A
Half-lifetime
Output grid size
5 km
Takigawa et al. (2013),
References
Shimbori et al. (2010)
Draxler et al. (2013a), Saito et al. (2015)
Saito et al. (2015),
SCJ (2014)
1
As of March 2011. JMA-RATM for volcanic ash was replaced on March 2013 (Shimbori et al., 2014).
2
The abbreviations Ngas, Dgas, Lpar and Vpar mean noble gas, depositing gas, light aerosol and volcanic-ash particle, respectively.
3
Below-scavenging coefficients Λw are listed in Table E-3-4.
Dry-deposition2
Test
Lagrangian description
Hourly outputs of MESO
forecast GPVs
100,000/10 min.
3 min.
Vpar: Suzuki (1983)
(log-normal with
Dm=0.25 mm, σD=1.0)
for SCJ Working Group
Ngas: N/A
Dgas: same as left
Lpar: Hertel et al. (1995)
Vpar: Vd=0.3 m s-1
(Shao, 2000)
90
Saito et al. (2015)
TECHNICAL REPORTS OF THE METEOROLOGICAL RESEARCH INSTITUTE No.76 2015
b. Horizontal diffusion
Under the assumption of horizontally homogeneous turbulence, the
– and
-components of
subgrid-scale turbulent velocity in Eqs. (E-1-1a) and (E-1-1b) are given by Uliasz (1990):
Δ
Δ
1
Δ
Γ
(E-1-2a)
Δ
Δ
1
Δ
Γ
(E-1-2b)
with the initial conditions
0
Γ and
0
Γ. The
and
are the magnitudes of
turbulent horizontal velocities at the emission point and Γ is a normal random number with mean 0
and variance 1.
is the Lagrangian autocorrelation function of the turbulent velocity represented by
(E-1-3)
⁄
with Lagrangian time scale
.
and
are the standard deviations of
and
, respectively,
given by
(E-1-4)
with the horizontal diffusion coefficient
for
≫
. Substituting Eqs. (E-1-3) and (E-1-4) into
(E-1-2a) and (E-1-2b), to the first order in Δ , we obtain the Langevin equation. Then the horizontal
diffusion scheme represented by Eqs. (E-1-2a) and (E-1-2b) is the analogue of Brownian motion
(Gifford, 1982, 1984).
For the three parameters in Eqs. (E-1-2a), (E-1-2b) - (E-1-4), we set as
5.0
10 s and
5.864
10 m s
0.253ms
,
according to Kawai (2002).
c. Vertical diffusion
The vertical diffusion coefficient in the third term on the right-hand side of Eq. (E-1-1c) are
determined by Louis et al. (1982):
∂
∂
where
(E-1-5)
v
is the mixing length in an analogy to the mean free path in molecular diffusion,
mean horizontal wind velocity, and
v
is the
representing atmospheric stability is a function of flux
91
TECHNICAL REPORTS OF THE METEOROLOGICAL RESEARCH INSTITUTE No.76 2015
Richardson number
given by the level 2 scheme of Mellor and Yamada (1974, 1982). The mixing
length takes the form (Blackadar, 1962)
z
(E-1-6)
⁄
1
where
is the Kármán constant (≈0.4),
is height from ground surface and
is maximum mixing
length [m] given by Holtslag and Boville (1993):
30
70 exp 1
,
1000
100 ,
1000 m
(E-1-7)
1000 m
is set to 50 m2 s-1 according to Yamazawa et al. (1998).
The upper limit of
The above-mentioned schemes of advection and diffusion are used in original RATM and are also
applied to radionuclides in the preliminary and revised RATM.
d. Gravitational settling
For dealing with light particles (Lpar) of radionuclides, i.e. radioactive matter or other
accumulation-mode aerosol particles carrying some radioactive matter (e.g.
137
Cs), gravitational
settling follows Stokes’ law with a slip correction and the terminal velocity is given by (e.g., Sportisse,
2007)
1
18
,
where
(E-1-8)
⁄
is the Cunningham correction factor
1
exp
with the Knudsen number
,
1.257,
0.400,
≡ 2 ⁄ . The viscosity
1.100
and the mean free path
(E-1-9)
of air are
calculated by
⁄
(E-1-10)
⁄
(E-1-11)
92
TECHNICAL REPORTS OF THE METEOROLOGICAL RESEARCH INSTITUTE No.76 2015
where
the air pressure,
a
the air temperature,
the Sutherland constant of air (=117 K) and
0.0662 m are the standard values for the reference atmosphere (
18.2 Pas,
1013.25hPa). The distribution of particle size
293.15K,
mean diameter
1μm and standard deviation
is assumed to be log-normal with
1.0 (upper cutoff: 20 μm). The particle
-3
is 1 g cm for all particle sizes.
density
Note that if a computational particle moves under the model surface by the vertical motion, it is
numerically reflected to the mirror symmetric point above the surface.
e. Wet scavenging
(1) Washout (below-cloud scavenging)
Because the original RATM was not applied in predicting the dispersion and deposition of
radionuclides, the wet scavenging schemes needed to be modified for this application. For Lpar, based
on the original treatment of wet scavenging, only washout processes (below-cloud scavenging) are
considered. The below-cloud scavenging rate by rain (liquid water) is given by Kitada (1994) (red
solid line of Fig. E-1-2):
(E-1-12)
Λ
2.98
where
10 s
,
(E-1-13)
0.75
is the precipitation intensity [mm h-1].
(2) Rainout (in-cloud scavenging)
On the other hand, wet deposition for a depositing gas (Dgas, e.g.
131
I) is considered only as a
rainout process (in-cloud scavenging). The in-cloud scavenging rate for Dgas is given by Hertel et al.
(1995):
Λ
where
1
1
⁄
(E-1-14)
h
the liquid water content,
-1
-1
the Henry constant (=0.08 M atm-1; Sect. F-1),
ideal-gas constant (=0.082 atm M K ), and
the
the height over which in-cloud scavenging takes
place.
Wet scavenging is applied to Lpar or Dgas under the height of about 3000 m a.s.l. in the original
and preliminary RATM (Shimbori et al. 2010). In the case of in-cloud scavenging for Dgas, however,
we have not been able to calibrate the RATM results. Therefore the Sect. E-3 results are devoted to
Lpar (137Cs and particulate 131I) verification.
93
TECHNICAL REPORTS OF THE METEOROLOGICAL RESEARCH INSTITUTE No.76 2015
Fig. E-1-2.
Below-cloud
scavenging
coefficients for rain
(red solid line) and
snow and graupel (blue
dotted line) used in
JMA-RATM.
After
Saito et al. (2015).
f. Dry deposition
Dry deposition is simply computed from the following deposition rate (e.g., Iwasaki et al., 1998):
(E-1-15)
Λ
where
is the dry-deposition velocity and
is the depth of surface layer. The value of
is set
to 0.001 m s-1 for Lpar and 0.01 m s-1 for Dgas (Sportisse, 2007; Draxler and Rolph, 2012), and
is
set to 100 m for both tracer types.
E-1-2. Use of MESO GPVs and RAP data
In Fig. E-1-1, the motion of computational particles in RATM is calculated in the same coordinate
system as the MESO analysis (Lambert conformal mapping in the horizontal and a terrain-following
hybrid in the vertical). The three-hourly 5-km MESO GPV data used to drive the RATM are
momentum, potential temperature, pressure, density, accumulated precipitation and mixing ratio of
cloud water. In the advection and diffusion steps, the mean wind velocities at each computational
particle are calculated from the time-space interpolation of the density and momentum GPVs. To
calculate the settling velocity, the temperature and pressure GPVs are used. For the wet scavenging
process, the precipitation intensity is computed from the average of the three-hour accumulated
precipitation GPVs.
for the in-cloud scavenging computation can be defined by the GPVs of
mixing ratio of cloud water. However, due to limitations in the treatment of ice-phase deposition in the
original RATM, only liquid rain was considered in the WMO Task Team calculation. Subsequently,
we used the total precipitation in the SCJ (Science Council of Japan) Working Group calculations.
When using the RAP data, instead of the three-hourly accumulated precipitation by MESO GPVs,
the RAP intensity at each MESO grid point (5-km resolution) is calculated from the spatial average of
the surrounding 25-grid cells of RAP (1-km resolution) every 30 min. As noted above, because the
original version of RATM cannot treat ice-phase deposition and RAP data do not distinguish solid and
liquid precipitations, all RAP data were considered to be liquid rain in the calculation.
94
TECHNICAL REPORTS OF THE METEOROLOGICAL RESEARCH INSTITUTE No.76 2015
E-2. Revision of RATM2
As previously mentioned in Sect. B-3-2, the JMA-MESO analysis is produced by a three-hour
forecast of the 5-km outer-loop of JMA-NHM (Saito et al., 2006, 2007, 2012) of JNoVA (Honda et al.,
2005; Honda and Sawada, 2008). The stored values in the analysis field are not averaged in the
assimilation window but are the instantaneous values predicted by the outer-loop model at the analysis
time (the end of each three-hour assimilation window). Because the instantaneous vertical motion is
affected by gravity waves and short-lived convection, a simple time interpolation of
updrafts/downdrafts between the three-hourly analysis fields may yield an overestimation of the
vertical advection of the air parcel, even if the magnitude of updrafts/downdrafts is small.
To compensate for the lack of temporal resolution, in the revised version of JMA-RATM, the
vertical advection (the second term on the right-hand side of Eq. (E-1-1c)) is calculated using a
spatially-averaged (nine-grid cells) value of the MESO vertical velocity and assumed to be
terrain-following (
∗
40m
0) at the lowest model level. Figure E-2-1 compares the 24-h
Lpar accumulated deposition for unit release (1 Bq/h) from 0000 UTC to 0300 UTC 14 March 2011.
The upper-right panel shows the result where vertical motion of the particles is computed using the
original MESO vertical velocity. Compared to the case without vertical advection (upper-left panel),
the deposition over the sea off the east coast of Japan is reduced. The lower-left panel provides the
result when the nine-grid cell averaged updraft/downdraft was applied to compute the vertical
advection. The difference from the upper-right panel is not large but the deposition is slightly
increased near the FDNPP (Fukushima Daiichi Nuclear Power Plant) site and slightly decreased at
distant areas. In these simulations, Lpar emitted from the FDNPP site were first lifted up by the lowest
level’s small updraft in MESO GPVs. The lower-right panel is the result of when the lowest level
vertical motion was assumed to be terrain following (i.e., the lowest level updraft/downdraft becomes
zero over sea while the remaining vertical motion over land is just due to the terrain slope and the
horizontal wind speed). The deposition off the east coast of Japan is increased.
In the preliminary version of RATM, wet scavenging was assumed to occur below about 3000 m in
height, the same as in the original RATM (Table E-1-1), but deposition over Miyagi prefecture, to the
north of Fukushima, was overestimated compared with the aircraft monitoring by the MEXT (Sect.
D-3). In the revised RATM, this overestimation was reduced by limiting the level of wet scavenging to
levels below about 1500 m (see Sect. E-3).
Some improper treatments of horizontal and vertical interpolations of the kinematic fields were
found in the preliminary version of RATM. These computational bugs were corrected in the revised
version. Also the number of computational particles was increased from 100,000/3 h to 300,000/3 h,
but the impact was almost negligible (see Sect. E-3).
For the model intercomparison of the SCJ Working Group, we further modified RATM as noted
previously: the time step was changed from 10 min. to 5 min. and in addition to rain, the precipitation
2
The description is based on Sect. 3 of Saito et al. (2015).
95
TECHNICAL REPORTS OF THE METEOROLOGICAL RESEARCH INSTITUTE No.76 2015
intensity of snow and graupel in the MESO GPVs was used. For these calculations, the below-cloud
scavenging coefficients of Lpar in Eq. (E-1-12) for snow and graupel are assumed (blue dotted line of
Fig. E-1-2)
2.98
10 s
with reference to the
,
(E-2-1)
0.30
value of UKMET-NAME (Table F-2-1). The impacts of the modifications are
shown in next section.
Fig. E-2-1. 24-h Lpar accumulated deposition by the JMA-RATM for unit release (1 Bq/h) at 0000-0300
UTC 14 March 2011. JMA-MESO GPV is used for precipitation. Upper left: without vertical advection.
Upper right: vertical motion is computed by updraft/downdraft. Lower left: spatially-average is applied.
Lower right: spatially-average and terrain-following at the lowest level. Star symbols indicate the
location of FDNPP. These deposition maps are created by the drawing tool of the NOAA ARL website
(Sect. D-4). After Saito et al. (2015).
96
TECHNICAL REPORTS OF THE METEOROLOGICAL RESEARCH INSTITUTE No.76 2015
E-3. Experiments with RATM3
E-3-1. Comparison with preliminary and revised RATM for the WMO Task Team
a. Experimental setting
According to the computational design described in Sect. D-1, JMA-RATM simulations were
conducted by the WMO Task Team for the computational period of 1800 UTC 11 March through
2400 UTC 31 March, in three-hourly emission period increments using a unit source rate (1 Bq/h) for
each discrete emission time segment. Emissions were uniformly distributed from the ground surface to
100 m a.g.l., and the concentration or deposition at any grid cell in the domain was given by the sum
of the contribution from all the RATM emission segments after multiplying the resulting unit
concentrations by the emission rate for each segment (Sect. D-1). The air concentration and deposition
output fields were configured to use a regular latitude-longitude grid (601 by 401 grid cells) with the
output averaged at three-hourly intervals at 0.05° (5 km) horizontal resolution and 100 m vertical
resolution. In the post-processing step, the results from each of the 168 RATM simulations were
multiplied by the actual emission rate at the release time of the simulation and decay constant for each
radionuclide thereby permitting the RATM dispersion and deposition factors to be applied to multiple
radionuclides. The estimated emission rates ‘JAEA’ (red solid line in Fig. 2 of Draxler et al. (2015)),
originally derived by Chino et al. (2011) and later modified by Terada et al. (2012, in Sect. D-2) were
used for the WMO Task Team simulations.
Figure E-3-1 compares 137Cs accumulated deposition for 11 March to 3 April 2011 estimated using
different computational methodologies. Here, rain in MESO GPVs was used for the calculations
shown in the left panels while RAP data were used for those shown in the right panels. In the
preliminary RATM (upper figures), deposition over Miyagi prefecture (north of Fukushima) and
southern part of the Kanto Plain (west of Tokyo) was overestimated compared with observation as
mentioned in the previous section E-2. In the revised RATM (lower figures), this overestimation was
ameliorated. When RAP data is used for precipitation, an area with high deposition in the northwest of
FDNPP becomes more distinctly reproduced (right figures), but the overestimation of deposition in the
southern part of the Kanto Plain is also enhanced, even in the revised RATM.
b. Verifications against observation
The
137
Cs dispersion and deposition were verified against the observed time series of near ground
level air concentrations at JAEA-Tokai (see Sect. D-2) and the deposition measurements taken by
aerial and ground based sampling (Fig. D-3-1 in Sect. D-3). One of the characteristic features of the
deposition pattern is the densely contaminated area extending to northwest from FDNPP. This area is
bent to the south, east of Ou mountain range, and forms an inverse L-shaped pattern shown by the
yellow shaded region in Fig. D-3-1. On the other hand, deposition in Miyagi prefecture, north of
Fukushima, is relatively small.
3
The description is based on Sects. 4 and 5 of Saito et al. (2015).
97
TECHNICAL REPORTS OF THE METEOROLOGICAL RESEARCH INSTITUTE No.76 2015
Fig. E-3-1. 137Cs accumulated deposition for 11 March-3 April 2011 using the JAEA source. Upper left:
preliminary RATM with MESO precipitation. Upper right: preliminary RATM with RAP precipitation.
Lower: same as in upper panels but results by the revised RATM. After Saito et al. (2015).
The statistics of correlation coefficient (
1 ), fractional bias (
1
2
FB
2 ),
figure-of-merit in space (FMS % ), Kolmogorov-Smirnov parameter (KSP % ) mentioned in Sect.
D-3 and the following two additional statistics used in Draxler et al. (2013a) were applied to the
results of the preliminary and revised RATM.
i)
Factor of two percentage (FA2 % ), the percentage of calculations within a factor of two of the
measured value.
ii)
Factor of exceedance ( 50%
50%), the factor of the number of over-predictions in
FOEX
the pairs of predicted and measured values.
A ranking method was defined by giving equal weight to the normalized expressions of these
statistics (Draxler et al., 2013a),
METRIC1 ≡ Rank
METRIC2
1
1
FB
2
FB
2
FA2
100
FMS
100
1
1
KSP
100
98
KSP
100
(E-3-1a)
(E-3-1b)
TECHNICAL REPORTS OF THE METEOROLOGICAL RESEARCH INSTITUTE No.76 2015
METRIC3
METRIC4
METRIC1
1
1
FB
2
FMS
100
1
FOEX
50
FA2
100
1
1
KSP
100
FOEX
50
1
(E-3-1c)
2⁄100
METRIC3
1
FOEX
50
FB
2
FMS
100
KSP
100
(E-3-1d)
whose value would range from 0 to 4 (METRIC1 and 2), 5 (METRIC3), 6 (METRIC4) (from worst to
best). Eq. (E-3-1a) is same as the Rank defined in Sect. D-3.
Two sets of calculations were examined, one where the precipitation was given by the MESO GPVs
and the other using the RAP data. Table E-3-1 shows the verification statistics by RATM for
137
Cs
deposition. Performance of the revised RATM (Rev. MESO) was significantly improved compared
with the preliminary RATM (Pre. MESO) for all rank metrics. The most improvement was obtained in
, which increased from 0.45 in the preliminary version to 0.70 in the revised version. The use of RAP
data for precipitation further improved the correlation coefficient to 0.84, while rank metrics became
slightly worse due to the deterioration of FB and FOEX. These tendencies in the statistics in the use
of RAP data can be understood by the area with high deposition in the northwest of FDNPP and the
overestimation of deposition in the west of the Kanto Plain in right panels of Fig. E-3-1; in the aircraft
monitoring by MEXT (Fig. 4 of Draxler et al. (2013a)), little or no deposition was observed in the
western part of the Kanto Plain.
Table E-3-2 and Fig. E-3-2 show the time evolution and the corresponding statistics for
137
Cs
concentration at the JAEA-Tokai observation site. Performance of the revised RATM using MESO
precipitation was slightly improved in terms of the rank metrics, while the revision did not improve
the metrics when the RAP data were used for precipitation. The reason for this deterioration in metrics
in the use of RAP data is not obvious, but a similar tendency was also found in the other Task Team’s
model simulations (Chap. F). Arnold et al. (2015) inferred that the discrepancy of transport patterns by
NWP (numerical weather prediction) analyses and the locations of the precipitation may result in a
wrong description of the total wet scavenging. The quality of the RAP data itself is also arguable.
Table E-3-1. Statistical metrics for comparison of JMA-RATM simulations with observed deposition pattern of
137
Cs using the JAEA source. Bold values indicate best score for each simulation. Reproduced from Saito et al.
(2015).
FA2
FOEX
FMS
KSP METRIC METRIC METRIC METRIC
RATM
R
FB
(%)
(%)
(%)
(%)
1
2
3
4
Pre.
0.45
3.09
2.60
4.08
4.59
-0.02
51.01
-0.46 100.00
10
MESO
Pre.
0.77
0.54
41.99
9.67 100.00
11
3.22
2.63
4.02
4.44
RAP
Rev.
0.70
-0.04
37.94
-0.83
99.63
10
3.37
2.75
4.35
4.73
MESO
Rev.
0.56
35.73
9.12
99.08
13
3.28
2.65
4.10
4.46
0.84
RAP
99
TECHNICAL REPORTS OF THE METEOROLOGICAL RESEARCH INSTITUTE No.76 2015
Table E-3-2. Statistical metrics for comparison of JMA-RATM simulations with observed concentration time
series of 137Cs at JAEA-Tokai using the JAEA source. Bold values indicate best score for each simulation.
Reproduced from Saito et al. (2015).
FA2
FOEX FMS
KSP METRIC METRIC METRIC METRIC
RATM
R
FB
(%)
(%)
(%)
(%)
1
2
3
4
Pre.
0.51
-0.82
2.22
1.63
2.79
3.01
21.43 -21.43 80.00
43
MESO
Pre.
-1.66
4.76
-45.24 57.50
64
1.46
0.93
1.55
1.60
0.59
RAP
Rev.
0.39
14.29 -19.05 77.50
-0.40
43
2.30
1.67
2.92
3.06
MESO
Rev.
0.07
-1.68
9.52
-42.86 62.50
67
1.12
0.59
1.26
1.36
RAP
Fig. E-3-2. Same layout as in Fig. E-3-1 but time evolution of 137Cs (logarithmic in the ordinate) at
JAEA-Tokai for the period 13-31 March 2011. Black lines indicate observation. Red lines show results
by the JMA-RATM with the JAEA source estimation. After Saito et al. (2015).
100
TECHNICAL REPORTS OF THE METEOROLOGICAL RESEARCH INSTITUTE No.76 2015
Table E-3-3. Statistical metrics for comparison of JMA-RATM simulations with observed concentration time
series of particulate 131I at JAEA-Tokai using the JAEA source. Bold values indicate best score for each
simulation. Reproduced from Draxler et al. (2013a).
FA2
FOEX FMS
KSP METRIC METRIC METRIC METRIC
RATM
R
FB
(%)
(%)
(%)
(%)
1
2
3
4
Pre.
0.47
-0.96
14.29 -30.95 78.05
43
2.09
1.45
2.47
2.62
MESO
Pre.
-1.71
0.00
-45.24 60.98
60
1.60
0.99
1.70
1.70
0.67
RAP
Rev.
0.14
-0.54
16.67 -23.81 75.61
40
2.11
1.52
2.63
2.80
MESO
Rev.
0.02
-1.60
4.76
-42.86 60.98
65
1.16
0.60
1.30
1.35
RAP
Although the bright band is not likely critical in this experiment, radar echoes are scanned around the
level of 1 km a.g.l. and solid waters are over-detected in the radar reflectivity. A lower limit of
intensity around 0.4 mm h-1 is set in RAP, which means that very weak precipitation is not included.
As mentioned in Sect. E-1-1, all RAP precipitation was considered to be liquid rain in the wet
scavenging calculation in RATM, and this assumption also may yield some errors in the air
concentration time evolution. Another possibility is that dispersion of radionuclides to the position of
the JAEA site is somewhat uncertain. As suggested in Fig. C-9-7, the southward advection of
radionuclides from FDNPP on 15 March 2011 was sensitive to small changes in the wind direction.
Therefore, given the inherent limitations in the accuracy of wind direction in meteorological analyses,
it may be unrealistic to expect that an RATM can precisely reproduce the time evolution of downwind
air concentrations at JAEA-Tokai. In addition, the statistical results may also be affected by remaining
uncertainties in the radionuclides release rate estimates which may never be finalized.
Table E-3-3 shows the verification statistics for particulate
131
I concentration at the JAEA-Tokai
observation site. Similar tendency of the RATM results were confirmed for another type of
radionuclides.
c. Sensitivity experiments to RATM parameters
In the revision of RATM, we tested some of the parameters with the greatest uncertainty to
determine their impacts on the RATM calculations of the accumulated deposition patterns of
137
Cs
from 1800 UTC 11 March to 2100 UTC 03 April 2011. A list of values of parameters used in the
experiments and corresponding figures are given in Table E-3-4.
(1) Release height
In the WMO Task Teams’ experiments, emissions of radionuclides were assumed to be distributed
uniformly from the ground to 100 m a.g.l. But this release height may change depending on the
atmospheric conditions and situation of the emission. The upper-left panel of Fig. E-3-3 shows the
137
Cs accumulated deposition when a lower release height of 30 m is applied. No significant difference
was obtained in the dense deposited area compared with the case of the original release height of 100
m (lower-left panel of Fig. E-3-1). A small difference can be seen in the regions with weak deposition
101
TECHNICAL REPORTS OF THE METEOROLOGICAL RESEARCH INSTITUTE No.76 2015
over southern part of the Kanto plain, where the simulated deposition becomes slightly smaller by
using the lower release height. This change corresponds to the observed deposition pattern (see Fig. 4
of Draxler et al. (2013a)), and small hotspot northeast of Tokyo is vaguely simulated in this
experiment.
(2) Number of computational particles
The upper-right panel of Fig. E-3-3 shows the result when a smaller number of computational
particles of 100,000/3 h were employed. Virtually the same result was obtained in the deposition
patterns.
(3) Wet scavenging coefficient and application height
Wet scavenging is an important process for the deposition of radionuclides. The middle-left panel of
Fig. E-3-3 indicates that when the wet scavenging process is not included in the simulation, the
deposition becomes much less compared with the original calculation (lower-left panel of Fig. E-3-1).
This result shows that the area with high deposition to the northwest of FDNPP was strongly affected
by wet scavenging. However the treatments of scavenging caused by rain and/or snow have many
ambiguities. The original version of RATM considered wet scavenging below 3000 m with the
scavenging coefficient of Eqs. (E-1-12) and (E-1-13). The middle-right panel of Fig. E-3-3 shows the
sensitivity of the results to changes in the below-cloud scavenging coefficient. Here, the scavenging
coefficients of Eq. (E-1-13) is replaced by
8.40
10 s
,
0.79, the values used in
UKMET-NAME (Table F-2-1). When a lager value is applied, deposition of
137
Cs over west of the
Kanto Plain is enhanced.
The lower-left panel of Fig. E-3-3 shows the result with the original scavenging application height
of 3000 m. A distinct difference from the original simulation is seen over Miyagi prefecture, where
overestimation of unobserved deposition is predicted. This result may suggest that the wet scavenging
should be confined in lower levels in the case of the FDNPP accident.
(4) Dry deposition application height
Sensitivities to dry deposition surface-layer height and number of computational particles were also
examined. Using a lower dry deposition surface layer height
40m (the lowest model layer) had
little impact on the deposition pattern (the lower-right panel of Fig. E-3-3).
102
TECHNICAL REPORTS OF THE METEOROLOGICAL RESEARCH INSTITUTE No.76 2015
Table E-3-4. List of values of parameters used in the JMA-RATM experiments and corresponding figures.
Number
Scav.
Dry-dep.
Below-cloud scav. coeff.
Release
Time
of comp.
appl.
appl.
Source height
step
Figures
particles
height
height
by rain
by snow
(m a.g.l.)
(min.)
(per 3 h)
(m a.s.l.) (m a.g.l.)
A=2.98x10⁻⁵,
low.-left of
JAEA
0-100
300,000
10
N/A
<1500
<100
B=0.75
Fig. E-3-1
A=2.98x10⁻⁵,
upp.-left of
JAEA
0-30
300,000
10
N/A
<1500
<100
B=0.75
Fig. E-3-3
-5
A=2.98x10 ,
upp.-right of
JAEA
0-100
100,000
10
N/A
<1500
<100
B=0.75
Fig. E-3-3
mid.-left of
JAEA
0-100
300,000
10
N/A
N/A
N/A
<100
Fig. E-3-3
A=8.40x10⁻⁵,
mid.-right of
JAEA
0-100
300,000
10
N/A
<1500
<100
B=0.79
Fig. E-3-3
A=2.98x10⁻⁵,
low.-left of
JAEA
0-100
300,000
10
N/A
<3000
<100
B=0.75
Fig. E-3-3
A=2.98x10⁻⁵,
low.-right of
JAEA
0-100
300,000
10
N/A
<1500
<40
B=0.75
Fig. E-3-3
A=2.98x10⁻⁵,
low.-left of
JAEA2
0-100
300,000
10
N/A
<1500
<100
B=0.75
Fig. E-3-4
A=2.98x10⁻⁵, A=2.98x10⁻⁵,
low.-right of
JAEA2
0-100
300,000
5
<1500
<100
B=0.75
B=0.30
Fig. E-3-4
103
TECHNICAL REPORTS OF THE METEOROLOGICAL RESEARCH INSTITUTE No.76 2015
Fig. E-3-3. Same as in the lower-left panel of Fig. E-3-1, but following settings are different: Upper left:
for the case with the release height 0-30 m a.g.l. Upper right: for the case with the number of
computational particles 100,000/3 h. Middle left: for the case without wet scavenging. Middle right: for
the case with the below-cloud scavenging coefficients of A=8.40x10⁻⁵ s-1 and B=0.79. Lower left: for the
case with wet scavenging application height below about 3000 m a.s.l. Lower right: for the case with dry
deposition application height less than 40 m. After Saito et al. (2015).
104
TECHNICAL REPORTS OF THE METEOROLOGICAL RESEARCH INSTITUTE No.76 2015
E-3-2. Results of revised RATM for the SCJ Working Group
The SCJ (2014) reviewed the modeling capability of the transport, dispersion and deposition of
radioactive materials released to the environment as a result of the FDNPP accident. The primary
purpose of this initiative was to assess the uncertainties in the simulation results through model
intercomparisons (Sect. G-6). In participating in these model intercomparisons, we used the revised
release rate ‘JAEA2’ by Kobayashi et al. (2013) and further modified RATM as mentioned at the end
of Sect. E-2.
Fig. E-3-4. Upper: distribution of 137Cs deposition by JMA-RATM in the SCJ model intercomparison.
Lower left: Same as in the lower-left panel of Fig. E-3-1 (below-cloud scavenging is applied only to
rain) but for the case that the release rate is given by JAEA2. Lower right: same as in the upper panel but
an enlarged view for the same domain as in the lower-left panel of Fig. E-3-1. After Saito et al. (2015).
105
TECHNICAL REPORTS OF THE METEOROLOGICAL RESEARCH INSTITUTE No.76 2015
Figure E-3-4 shows the 137Cs deposition distribution obtained by the SCJ experiment. As seen in its
enlarged view (lower-right panel), the area with high deposition northwest of FDNPP is more
enhanced relative to the previous RATM results and linked with the hotspot at Naka-dori valley,
producing an inverse L-shaped pattern. Because the JAEA2 release rate is somewhat larger than that
of JAEA (Fig. 4 of Kobayashi et al. (2013)), the enhancement of deposition was partly caused by the
change of the release rate, while the modification of treatment of the wet scavenging (use of solid
waters in MESO GPVs) likely contributed to modifying the shape of the area with high deposition. It
is noteworthy that in this experiment, a small hotspot in Chiba prefecture (northeast of Tokyo, see Fig.
4 of Draxler et al. (2013a)) is better simulated compared with the previous RATM simulation (the
lower-left panel of Fig. E-3-1).
To differentiate the impact of changes to the emission rate and model, we conducted additional
experiments. The lower-left panel of Fig. E-3-4 is for the case when only the release rate is changed to
JAEA2 source term and with application of below-cloud scavenging only to rain (the same model that
in the lower-left panel of Fig. E-3-1). As indicated by these figures, both changes contribute to
enhance the inverse L-shaped area with high deposition, but the change of the source term has a larger
effect than inclusion of snow in the below-cloud scavenging in terms of the deposition distribution
over the Kanto Plain.
E-3-3. Test version of RATM for in-cloud scavenging and future research
Another experiment with in-cloud scavenging for Lpar was conducted to test its impact. In this
experiment, the three-dimensional distribution of cloud water analyzed by JNoVA was used to define
cloud area and liquid water content. In an analogous form to Eq. (E-1-14), the in-cloud scavenging
rate for Lpar is also given by Hertel et al. (1995):
Λ
0.9
(E-3-2)
h
Fig. E-3-5.
Same as in the
lower-right panel of
Fig. E-3-4 but for a test
version of JMA-RATM
that
in-cloud
scavenging for Lpar is
considered. After Saito
et al. (2015).
106
TECHNICAL REPORTS OF THE METEOROLOGICAL RESEARCH INSTITUTE No.76 2015
Figure E-3-5 shows the result when in-cloud scavenging of Eq. (E-3-2) is considered. A very large
difference is seen in the north of Kanto Plain. An area with high deposition extends from the eastern
part of Fukushima prefecture to west-southwest, resembling the observed hotspot in the northern
Kanto Plain (Fig. 4 of Draxler et al. (2013a)). Although the simulated area with high deposition has a
small (20-30 km) southward positional lag, this result suggests importance of considering in-cloud
scavenging for Lpar.
In the WMO Task Team and the SCJ Working Group experiments, we used three-hourly MESO
analysis as the meteorological field with linear interpolation in time and space to obtain input data for
RATM at every 5 or 10 min. time step. The time interval of the meteorological field may not be
sufficient to properly treat the upward motion of the radionuclides and to characterize their finer
spatiotemporal scale transport due to changes of the wind speed and direction. To obtain more
temporally resolved meteorological fields, additional mesoscale model simulations are needed. On the
progress of this subject, Sekiyama et al. (2015) conducted the RATM experiments (the same version
for SCJ Working Group) using the one-hourly 15 km, 3 km and 500 m NHM-LETKF GPVs (see Sect.
G-4).
Use of a lower below-cloud scavenging application height yielded slightly better results in the
revised version in some respects, but the same effect could be obtained by reducing the scavenging
coefficient itself or changing the source emissions. The results of the additional test of an in-cloud
scavenging scheme for Lpar suggested the importance of its consideration for future model
improvements. More sophisticated method should be developed for in-cloud scavenging so that the
three-dimensional distribution of rain and snow in the MESO analysis can be used more effectively. In
addition, changes of the assumed grain-size distribution and particle density will also have an effect on
the surface deposition. These points are all subjects for future research.
107
TECHNICAL REPORTS OF THE METEOROLOGICAL RESEARCH INSTITUTE No.76 2015
F. ATDM simulations by TT members
F-1. The NOAA ATDM experiments1
The calculation of the transport and dispersion from the source was done using the Hybrid SingleParticle Lagrangian Integrated Trajectory (HYSPLIT – Draxler and Hess, 1998) model. A detailed
description of the computational aspects of the model can be found in Draxler and Hess (1997) and its
configuration is reviewed in the User's Guide (Draxler, 1999).
The special extract of the NOAA GDAS meteorological data archive used for the HYSPLIT
ATDM calculations was available on the native hybrid sigma levels. Approximately 15 levels occur
below 850 hPa with the remainder extending up to approximately 10 hPa. The three dimensional
fields included the horizontal winds, temperature, and humidity. When using the GDAS data for
calculations, vertical velocities were computed in HYSPLIT by integrating the divergence. The other
fields used in the calculations include the surface heat and momentum fluxes for the computation of
vertical mixing, the boundary layer depth, and the precipitation rate.
The ECMWF data fields had a comparable number of data fields and vertical resolution to the
GDAS but included the vertical velocity field.
When using the JMA mesoscale analysis, a minimum amount of pre-processing was applied to the
data which contained pressure, potential temperature, horizontal winds, moisture, and vertical velocity.
The 3D pressure fields was used directly to map the data at each level to the HYSPLIT vertical sigma
coordinate, potential temperature was converted to ambient temperature, and the vertical velocities
were remapped to a terrain following coordinate system consistent with the HYSPLIT computational
framework. A vertical velocity correction,
σ (u ∂η/∂x + v ∂η/∂y)
(F-1-1)
was applied at all levels based upon the slope of the terrain surface (η) and decreasing with height (σ).
With respect to the wet deposition, HYSPLIT calculations used the precipitation fields without
adjustment: the MESO analysis 3-hour accumulated precipitation and calculations with the RAP used
the precipitation at the grid point nearest in space (~ 1 km) and time (~ 30 min) to each particle at
each integration time step.
In HYSPLIT, scavenging is parameterized through removal constants β (s-1), where the deposition
D over time step Δt for each particle of mass M is
D = M {1-exp[-Δt (βdry+βgas+βinc+βbel ) ] }.
(F-1-2)
The particle mass is reduced by D each time step. The time constant for within-cloud removal for
particulate pollutants is
βinc = S P ΔZp-1,
(F-1-3)
R. Draxler
1
108 TECHNICAL REPORTS OF THE METEOROLOGICAL RESEARCH INSTITUTE No.76 2015
where S is the ratio of the pollutant's concentration in water to its concentration in air (4x10⁴), ΔZp is
the depth of the pollutant layer, and the precipitation rate P is the value predicted by the
meteorological model used in the calculation. Below-cloud removal is defined directly as a rate
constant (βbel = 5x10⁻⁶), independent of the precipitation rate. The wet deposition of gases depends
upon their solubility and for inert non-reactive gases it is a function of the Henry's Law constant (H Molar atm-1), the ratio of the pollutant's equilibrium concentration in water to that in air. Therefore,
the gaseous wet removal time constant is
βgas = H R T P ΔZp-1,
(F-1-4)
where R is the universal gas constant (0.082 atm M-1 K-1), T is temperature, and the wet removal of
gases is applied at all levels from the ground to the top of the cloud-layer. The dry deposition
calculation is limited to particles within the surface layer (ΔZs is usually about 75 m), and the time
constant is
βdry = Vd ΔZs-1.
(F-1-5)
One critical aspect for quantitative predictions of air concentration is the wet and dry scavenging
that occurs along the transport pathway. Three generic species were tracked as surrogates for the
radionuclides: a gas with no wet or dry scavenging, a gas with a relatively large dry deposition
velocity (0.01 m/s) and wet removal (Henry's constant = 0.08) to represent gaseous I131, and a particle
with a small deposition velocity (0.001 m/s). There can be considerable variability in scavenging
coefficients and the wet scavenging coefficients used in these calculations are lower than the original
model default values (Draxler and Hess, 1997) but these lower values are consistent with the results
from more recent deposition studies using the HYSPLIT scavenging parameterizations.
109 TECHNICAL REPORTS OF THE METEOROLOGICAL RESEARCH INSTITUTE No.76 2015
F-2. The Met Office ATDM Experiments1
NAME (Numerical Atmospheric-dispersion Modelling Environment) is the UK Met Office’s
Lagrangian particle dispersion model and it is used to model the atmospheric transport and dispersion
of a range of gases and particles (Maryon et al., 1999 and Jones et al. 2007). It was originally
developed to model the transport of radioactive material following the Chernobyl accident but now has
a wide range of applications including simulating releases of hazardous materials (chemical, biological,
radiological and nuclear) (Leadbetter et al 2013, Draxler et al 2012, Becker et al 2007, Ryall and
Maryon 1998), modelling the transport of ash clouds from volcanic eruptions (Webster 2012),
modelling the airborne transmission of diseases (Burgin 2012), forecasting air quality, analyzing air
pollution episodes and identifying source locations and source strengths.
In NAME, large numbers of model particles are released into the model atmosphere, where each
particle represents a certain mass of the material (gases or aerosols) being released. These particles are
advected within the model atmosphere by input three-dimensional winds from numerical weather
prediction models and turbulent dispersion is simulated by random walk techniques; particle velocities
are correlated in time at short ranges while the more simple Wiener process is applied for longer range
problems. Gravitational settling of particles and loss processes, such as wet and dry deposition,
radioactive decay, cloud gamma (Bedwell 2011) and chemical transformations, are calculated when
required.
NAME is typically run using NWP data from the Met Office or ECMWF but can be configured to
use data in GRIB format from any model provided a suitable variable set is available. In addition,
NAME can use radar rainfall observations in place of NWP rainfall estimates. NAME can use both
limited area and global deterministic data as well as ensemble data (through an in-built ensemble
framework). These NWP data sets can be nested both in space and time.
For the WMO Task Team work NAME was run with Met Office, ECMWF and JMA Mesoscale
NWP with and without JMA Radar Rainfall observations sample deposition results for
137
CS are
shown in Figure F-2-1. In order to use the JMA Mesoscale data it was necessary to pre-process the
data to reformat it into a coordinate system supported by NAME and also to generate a number of
additional fields required by NAME: converting potential temperature to temperature, converting
accumulated rainfall to mean rates, estimating cloud cover, boundary layer depth and the estimation of
surface fluxes of heat and momentum. Surface roughness was also absent and values from ECMWF
were used in their place.
Dry deposition is modelled in NAME using the concept of the deposition velocity, vd (Webster and
Thomson, 2011). The flux of pollutant to the ground, F, is proportional to the concentration, C, of
pollutant and is given by
F vd C
1
M. C. Hort and S. J. Leadbetter
(F-2-1)
110
TECHNICAL REPORTS OF THE METEOROLOGICAL RESEARCH INSTITUTE No.76 2015
where vd
is the constant of proportionality. The deposition velocity can either be specified by the
user, which was the case for all the calculations discussed in this report, or is calculated using a
resistance analogy
vd
1
R a Rb R c ,
(F-2-2)
where Ra is the aerodynamic resistance, Rb is the laminar layer resistance and Rc is the surface
resistance. The aerodynamic resistance represents the efficiency with which material is transported to
the ground by turbulence and is independent of the material. The laminar layer resistance is used to
specify the resistance to transport by diffusion across the thin quasi-laminar layer adjacent to the
surface. Different parameterizations for Rb are used for gases and particles. The surface resistance
characterizes the resistance to capture by the surface and is dependent on both the pollutant and the
underlying surface. For particles, the surface resistance is taken to be zero. For gases, a fixed surface
resistance can be specified by the user or, for a selection of gases, a complex land use dependent
surface resistance parameterization can be invoked.
The removal of material from the atmosphere by wet deposition is based on the depletion equation
dC
C
dt
(F-2-3)
where C is the air concentration and Λ is the scavenging coefficient. The scavenging coefficient is
given by
Ar B
(F-2-4)
where r is the rainfall rate (in mm hr-1) and A and B are coefficients which vary for different types of
precipitation (i.e., large-scale/convective and rain/snow) and for different wet deposition processes
(i.e., rainout, washout and the seeder-feeder process) (see Table F-2-1) (Maryon et al., 1999). Within
NAME, wet deposition due to convective and large-scale precipitation are computed separately and
summed to give total wet deposition. Material located above the cloud top is not subject to wet
deposition. Enhanced wet deposition (due to the seeder-feeder process) is applied to material close to
the ground in regions of elevated orography.
111
TECHNICAL REPORTS OF THE METEOROLOGICAL RESEARCH INSTITUTE No.76 2015
Table F-2-1. Scavenging coefficients used in NAME
Orographic
enhancement
(seeder-feeder)
Below-cloud
(washout)
In-cloud
(rainout)
Rain
Large-Scale
A = 3.36 x 10⁻⁴
B = 0.79
Convective
A = 3.36 x 10⁻⁴
B = 0.79
Snow/Ice
Large-Scale
A = 1.0 x 10⁻³
B = 0.79
Convective
A = 1.0 x 10⁻³
B = 0.79
A = 8.4 x 10⁻⁵
B = 0.79
A = 8.4 x 10⁻⁵
B = 0.79
A = 8.4 x 10⁻⁵
B = 0.79
A = 3.36 x 10⁻⁴
B = 0.79
A = 8.0 x 10⁻⁵
B = 0.305
A = 8.0 x 10⁻⁵
B = 0.305
A = 8.0 x 10⁻⁵
B = 0.305
A = 3.36 x 10B = 0.79
Fig. F-2-1. Deposition maps from NAME using 4 different meteorological data sets. UK (UKMET),
European Centre (ECMWF), JMA Mesoscale (MESO) and JAM Mesoscale plus radar rainfall
(MESO-R).
112
TECHNICAL REPORTS OF THE METEOROLOGICAL RESEARCH INSTITUTE No.76 2015
F-3. Impact of different meteorological input on ATM with FLEXPART 1
F-3-1. Introduction and data
The work focuses on the influence of different meteorological input data (from JMA, ECMWF
and NCEP), especially with regard to precipitation, on atmospheric transport modeling (ATM)
simulations of aerosol-bound radionuclides with the Lagrangian particle dispersion model
FLEXPART, version 8.23 (Stohl et al. 1998, 2005). Precipitation is known to be the most decisive
factor for ground-level contamination (e.g. Clark and Smith, 1988) due to the efficiency of wet
deposition processes (below-cloud and in-cloud scavenging). High resolution total precipitation fields
from the operational Japanese Mesoscale analysis (~ 5 km horizontal resolution) and a radar-rain
gauge analysis product (~ 1 km horizontal resolution) supplied by the JMA (JMA, 2012; Saito et al.,
2015) offered a unique opportunity to assess the influence of spatially highly resolved precipitation
input data in ATM for the particular case of the Fukushima Dai-ichi accident. In a pragmatic, yet
limited, approach the latter fields were used to replace precipitation in the global or regional ECMWF
(~0.125°
native
resolution)
and
global
NCEP
(~0.5°
native
resolution)
data
http://www.ecmwf.int/research/ifsdocs/CY37r2/index.html
and
http://www.emc.ncep.noaa.gov/GFS/doc.php) bearing in mind that there may be inconsistencies
(see
between the wind and precipitation fields. However, as precipitation is often not well modeled by
NWP models but of high importance for deposition it was felt that it was important to investigate the
impact of this potential off-line method for improving the precipitation fields used in ATM. The
publicly available gridded 137Cs deposition map (USDOE, United States Department of Energy, 2011;
MEXT, 2011c) for land in area surrounding the Fukushima NPP and
137Cs
air concentration
measurements from the International Monitoring System (IMS) of CTBTO were used for verification.
For this study the 137Cs source term by Terada et al. (2012) was used.
F-3-2. Atmospheric transport modeling
FLEXPART version 8.23 (which differentiates between in-cloud and below-cloud scavenging)
includes a disadvantage that needs to be tackled. This disadvantage consists of the fact that clouds are
diagnosed according to the exceedance of 80% relative humidity and that values are interpolated
spatially and temporally using nearest neighbor interpolation. Thus, a particle may encounter
precipitation, where no cloud is present, which leads to zero wet deposition for this grid point, a
problem which is especially relevant for convective clouds/precipitation. A fix to this problem was
proposed by Seibert et al. (2012) and tested within this evaluation. It includes a stepwise reduction of
the relative humidity threshold (from 90% down to 25%) for diagnosing clouds if precipitation is
present. Cloud base and height are interpolated from surrounding grid points in time and in space. If
no clouds can be found there and precipitation is present the previous bulk parameterization for in
cloud and below cloud scavenging is used.
1 C. Maurer, D. Arnold and G. Wotawa
113
TECHNICAL REPORTS OF THE METEOROLOGICAL RESEARCH INSTITUTE No.76 2015
In line with Draxler and Heffter (1981) and as described in Draxler et al (2013a), independent
forward runs with a unit source emission rate for 3 hourly release periods were performed every 3
hours to yield the source-receptor sensitivities for each release segment. These runs were finally scaled
by the source strength in the corresponding release segment and summed up to give the actual
modeled values at each time step and grid point. Following Draxler (2006) the statistical parameters
correlation (R), fractional bias (FB), figure-of-merit in space (FMS) and the Klomogorov-Smirnov
parameter (KSP) were used individually and in combination in a single measure called RANK
(ranging from 0, worst, to 4, best) to quantitatively assess the model performance of the local runs.
F-3-3. Results
A summary of results can be found in Table F-3-1.
a. NCEP-0.5° versus ECMWF-0.5°
The differences between NCEP-0.5° and ECMWF-0.5° (abbreviated in Table F-3-1 as NC-0.5
and EC-0.5) are worth mentioning. Maxima for the EC-0.5 driven run are around five times larger
than for NC-0.5. The overall deposition is larger for EC-0.5 and the measured maximum with
depositions over 500 kBqm-2 to the Northwest of the power plant is clearly better represented using
ECMWF input data (Fig. F-3-1). All statistical scores mentioned above (Table F-3-1) as well as a
scatter diagram (not shown) confirm the view that the ECMWF run ranks better than the NCEP run.
Fig. F-3-1.: Total accumulated deposition running FLEXPART with ECMWF (left) and NCEP (right) data both
at 0.5° horizontal resolution. From Arnold et al. (2015), Fig.3.
b. ECMWF-0.2/0.1° versus ECMWF-0.5°
Increasing the horizontal resolution in the ECMWF fields used in the dispersion simulations from
0.5° to 0.2° (runs EC-0.2 and EC-0.5° in Table F-3-1) leads to the expected increase in structure and a
more realistic appearance (Fig. F-3-2). The lower resolution input results in a smoother deposition
field and larger area covered with smaller values in the plume axis northwest of Fukushima. Another
important outcome is the increased deposition on the slope of the mountain district of Northern Japan
as well west of the Kanto plain. This increase is carried forward if the resolution in the ECMWF field
114
TECHNICAL REPORTS OF THE METEOROLOGICAL RESEARCH INSTITUTE No.76 2015
gets enhanced to 0.1° (Fig. F-3-2). Performance metrics showed some slight improvements with the
increase in horizontal resolution from 0.5° to 0.2°. However, using 0.1° input data lessens the Rank,
which fits many experiences for model-to-point comparisons, where with increasing resolution of the
meteorological input small dislocations between modeled patterns and measurements increasingly
deteriorate statistical scores. Nevertheless it is advisable to use input data of 0.2° instead of 0.5° for
ATM applications.
Fig. F-3-2.: Total accumulated deposition running FLEXPART with ECMWF at 0.5° (left), 0.2° (right) and 0.1°
(center) horizontal resolution. Partly from Arnold et al. (2015), Fig.5.
c. ECMWF-0.2° versus ECMWF-0.2° with inserted JMA products
When replacing model precipitation with the radar-rain gauge analysis data in the 0.2°-ECMWF
fields (ECRA-0.2 run in Table F-3-1) scores worsen slightly, whereas they improve when ingesting
the Mesoscale precipitation analysis (ECME-0.2 run in Table F-3-1). In the first case the continuous
maxima northwest of the NPP changes to a two-maxima pattern (Fig. F-3-3), in the second case the
area with the greatest deposition extends a bit further north, thereby matching better the measurements.
The regions with lower deposition to the south-west are also better represented. Maximum values turn
out to be larger in both cases compared to plain ECMWF input data. The ingestion procedure was also
applied to NCEP data, but resulted in a general worsening of results for both kinds of
JMA-precipitation data (see results for NCME-0.5 and NCRA-0.5 in Table F-3-1). In this case the
115
TECHNICAL REPORTS OF THE METEOROLOGICAL RESEARCH INSTITUTE No.76 2015
elongated maximum to the northwest of the NPP is not reproduced. The results indicate an
inconsistency between NCEP wind fields and observed precipitation, which in turn hints at a weaker
performance of NCEP wind fields compared to those from ECMWF.
When the above described fix for wet deposition is applied to the FLEXPART source code,
modeled depositions tend to worsen for plain ECMWF input data (regardless of the resolution) by
2-3% (see Table F-3-1). For example, the main deposition area becomes overestimated by the
EC-0.2MC run, deposition onshore and inland towards the south also exceed the observations.
Contrariwise, the runs with the ingested JMA-products (ECME-0.2MC and ECRA-0.2MC) show
ranks improved by 2.3 and 5% respectively, mainly due to enhanced scavenging to the northwest of
the NPP. It looks as if the consistency between precipitation fields and other meteorological input data,
which is questionable in case of the ingestion of JMA precipitation products, is more important for the
currently applied deposition scheme in FLEXPART version 8.23. This becomes understandable when
one bears in mind that wet deposition for a grid point is only activated in this scheme if a cloud is
diagnosed from relative humidity. With independent precipitation data the scheme is even more
problematic than with dependent one.
Fig. F-3-3.: Deposition patterns obtained with the quick fix for the wet deposition scheme in FLEXPART for the
EC-0.2MC (upper left), the ECME-0.2MC (right) and the ECRA-0.2MC (center) runs.
116
TECHNICAL REPORTS OF THE METEOROLOGICAL RESEARCH INSTITUTE No.76 2015
Table F-3-1.: Statistical scores for the individual FLEXPART runs with different meteorological input data. MC
label indicates the wet deposition FLEXPART quick fix was implemented. From Arnold et al. (2015), Fig.8 and
Table 2.
Fig. F-3-4.: Total global deposition on the 31st of March at 21 UTC for NCEP driven run (left) and ECMWF
driven run (right). From Arnold et al. (2015), Fig.10.
d. Hemispheric run
Finally two hemispheric runs were evaluated with releases being tracked until the 31st of March.
The runs were driven by global 0.5°-ECMWF data with a 0.2° nest (ECME-0.2 data) over Japan and
137Cs
depositions (Fig. F-3-4, however not comparable to
any measurements) as well as ambient air concentrations (Fig. F-3-5) are generally higher
using NCEP data as input. The plume arrival time and the two maxima pattern are quite well
reproduced by FLEXPART at the IMS stations USP78 and USP79 (both located in the
Central Pacific) both for ECMWF and NCEP input data. However, for ECMWF input the
simulated concentrations are clearly underestimated, reaching up to a difference of two orders
of magnitude. Overall uncertainties in patterns and magnitudes grow with increasing distance
to the release location.
by global 0.5°-NCEP data. Modeled
117
TECHNICAL REPORTS OF THE METEOROLOGICAL RESEARCH INSTITUTE No.76 2015
Fig. F-3-5: Time series of 137Cs concentration at the USP78 IMS station. Measurements (blue) compared to
modeled (red) concentrations with NCEP (left) and ECMWF (right) data. From Arnold et al. (2015), Fig.11.
F-3-4. Summary
The local model performance is clearly superior for 0.5° ECMWF fields compared to 0.5° NCEP
fields given the Fukushima accident and the specific source term due to a systematic underestimation
in NCEP results. Increasing the resolution from 0.5° to 0.2° for the ECMWF data seems beneficial.
Inserting the Japanese Mesoscale precipitation analysis in 0.2°-ECMWF fields yielded the best result,
especially when a wet deposition fix was applied. For the radar-gauge product things are different.
They lead to a worsening in deposition when no fix is applied and to a bettering if it is applied, since
the fix makes the model more robust to inconsistencies between wind and precipitation fields.
Hemispheric runs yield more realistic concentration amplitudes (see Arnold et al. (2015) for more
results) if driven by NCEP data.
118
TECHNICAL REPORTS OF THE METEOROLOGICAL RESEARCH INSTITUTE No.76 2015
F-4. The CMC ATDM experiments1
MLDP0 (Modèle Lagrangien de Dispersion de Particules d’ordre 0) is a Lagrangian particle
dispersion model of zeroth order designed for long-range dispersion problems occurring at regional and
global scales and is described in details in D’Amours and Malo (2004) and D’Amours et al. (2010).
Dispersion is estimated by calculating the trajectories of a very large number of air particles (also called
parcels or fluid elements). Large scale transport is described by calculating the displacement due to the
synoptic component of the wind field and diffusion through discretized stochastic differential equations
to account for the unresolved turbulent motions. Vertical mixing caused by turbulence is handled
through a random displacement equation (RDE) based on a diffusion coefficient Kz. The calculation of
the diffusion coefficient combines two formulations following Delage (1997), for the surface layer, and
O’Brien (1970), for the above layers, in order to produce a vertical profile of Kz consistent with the
depth of the ABL (due to the reflection condition at the top of the ABL). This coefficient is calculated
in terms of a mixing length, stability function, and vertical wind shear. Lateral mixing (horizontal
diffusion) is modelled according to a first order Langevin Stochastic Equation for the unresolved
components of the horizontal wind (mesoscale fluctuations).
MLDP0 is an off-line model that uses the full 3-D meteorological fields provided by a numerical
weather prediction (NWP) system, i.e. fields of wind, moisture, temperature and geopotential heights
must be provided to the model. These are normally obtained from the GEM model forecasts and
objective analysis systems in either global, regional or high resolution configuration.
In MLDP0 a computational particle (or parcel) is assumed to represent the ensemble average of a large
number of “real” air constituents (aerosols or gases). At the emission, it is assigned a mass which
depends on the total quantity of material emitted and the total number of particles. The effect of
radioactive decay, wet scavenging, dry deposition and gravitational settling can be simulated by
calculating the amount of material removed from the carrier particle, when it travels in regions of the
atmosphere where such processes are active.
Dry deposition occurs when a particle is subjected to a reflection at the ground surface. It is
modelled in terms of a dry deposition velocity vd and an absorption probability P. The absorption
probability is calculated according to Wilson et al. (1989) as
P= 1− R ,
R=
1− a
1 +a ,
1/ 2
π
a=
2
vd
,
σw
(F-4-1)
1
A. Malo and R. Servranckx
119
TECHNICAL REPORTS OF THE METEOROLOGICAL RESEARCH INSTITUTE No.76 2015
where R is the reflection probability and σ w is the standard deviation of the vertical turbulent wind
component. Since a particle represents the mean of an ensemble of particles, the fraction of the mass
removed by dry deposition is equal to P. The deposition rate is calculated by assuming that a particle
contributes to the total surface deposition flux in proportion to the tracer material it carries when it is
found in a layer adjacent to the ground surface. Dry deposition increment dmd for particle p over a
model time step dt can be expressed as
dmd = P m p = ( 1 R) m p ,
(F-4-2)
where mp is the particle mass. The new particle mass m'p is then adjusted accordingly
m'p = R m p .
(F-4-3)
Wet deposition is treated with a simple scheme and will occur when a particle is presumed to be in
a cloud (in-cloud scavenging) and is modelled in terms of a wet scavenging rate.
Below-cloud
scavenging is not considered yet in the operational version of MLDP0. The tracer removal rate is
proportional to the local cloud fraction fc and the particle mass mp. Wet deposition increment dmw for
particle p over a model time step dt and updated particle mass are calculated using the following
relationships
dmw = m p 1 exp( sw f c dt) ,
(F-4-4)
m'p = m p exp( sw f c dt) ,
(F-4-5)
where sw is the wet scavenging rate (s-1).
Local cloud fraction is parameterized according to
Pudykiewicz (1989) as a function of relative humidity following
fc =
U Ut
, if U U t ,
Us Ut
(F-4-6)
where fc is the cloud fraction, U is the relative humidity, Ut is the threshold value of the relative humidity
above which the subgrid scale condensation occurs (75% is the default value in MLDP0), Us is the
relative humidity for the saturation state (100%). Local cloud fraction can be estimated in both hindcast
and forecast modes, using analysed and forecast NWP meteorological fields.
Gravitational settling in the trajectory calculations is computed according to Stokes’ law for fine
particles. By default, MLDP0 is run neglecting gravitational settling effects. However, this optional
removal process can be included accounting together for a particle size distribution and density of a
particle. This process represents an important removal mechanism in atmospheric transport modelling
and can modify significantly modelled airborne concentrations and total ground deposition at short scale
(near the source) as well as at very long range. This impact is related especially to the particle size
120
TECHNICAL REPORTS OF THE METEOROLOGICAL RESEARCH INSTITUTE No.76 2015
distribution used in the modelling. In order to properly model this physical process, it is therefore
necessary to have a good knowledge of particle size distribution, something that is rarely known or
available.
In MLDP0, tracer concentrations at a given time and location are obtained by assuming that
particles carry a certain amount of tracer material. The concentrations are then obtained by calculating
the average residence time of the particles, during a given time period, within a given sampling volume,
and weighting it according to the material amount carried by the particle. Concentrations can be
estimated more accurately close to the source with a Lagrangian model as compared to an Eulerian
model. It is important to note that in MLDP0, all concentrations are averaged in space and time. The
concentrations are averaged in the vertical layers and in the horizontal (surrounding grid points
weighting algorithm) for smoothing effects and artificial noise attenuation as well as over the output
time period/step/resolution specified by the modeller. For example, concentration outputs at 3-h time
steps would correspond to average values over that 3-h period.
Three generic species were modelled as surrogates for the radionuclides: a gas with no wet or dry
scavenging to mimic noble gases (such as 133Xe), a gas with a relatively large dry deposition velocity (1
cm/s) and wet removal rate (3×10⁻⁴ s-1) to represent a depositing gas (such as gaseous 131I), and a particle
with a small dry deposition velocity (0.1 cm/s) and wet scavenging rate (3×10⁻⁵ s-1) to represent light
particles (such as 137Cs or particulate 131I). Details are shown in Table F-4-1.
Table F-4-1. Different physical removal processes accounted in MLDP0 simulations (Draxler et al., 2013a).
Type
Species
Name
vd
[cm/s]
sw
[s-1]
Dry
Deposition
Wet
Scavenging
Radioactive
Decay
Gravitational
Settling
Surrogate for
Gas
Ngas
0
0
No
No
No
No
Noble gases
(Kr, Xe, Rn)
Lpar
0.1
3×10⁻⁵
Yes
Yes
No
No
Dgas
1
3×10⁻⁴
Yes
Yes
No
No
Particle,
light
Gas,
depositing
121
137
Cs, 131I
131
I
TECHNICAL REPORTS OF THE METEOROLOGICAL RESEARCH INSTITUTE No.76 2015
F-5. Results of ATDM simulations 1
F-5-1. ATDM simulations using UNSCEAR source term
The ATDM simulation results from the task team are summarized in WMO (2012b) and Draxler et al.
(2013a). The experiments were conducted according to the experimental design protocol described in
D-1.
Figure F-5-1 shows a sample of the calculated 137Cs deposition patterns from NOAA-HYSPLIT (top)
and UKMET-NAME (bottom) using the UNSCEAR source term. Here, the left panels show the
predicted deposition patterns using the ECMWF meteorology, while the right panels show the model
results using the JMA MESO meteorology. The UKMET results tend to be smoother than the NOAA
calculation which is especially striking for the calculations using the finer resolution MESO data.
Fig. F-5-1. Upper: Calculated 137Cs deposition using NOAA-HYSPLIT ATDM with ECMWF data (left) and
with the JMA-MESO analysis (right). Bottom: UKMET-NAME ATDM with ECMWF data (Left) and with
the JMA-MESO analysis (right). Reproduced from Draxler et al. (2013a).
1
K. Saito, R. Draxler, T. Shimbori, M. Hort, G. Wotawa, A. Malo and R. Servranckx
122
TECHNICAL REPORTS OF THE METEOROLOGICAL RESEARCH INSTITUTE No.76 2015
An example of the computed 137Cs deposition pattern for the ensemble mean of ten selected members
(Draxler et al., 2013a) from all task tem ATDMs is shown in Fig. F-5-2. The computed high deposition
region shows a comparable downwind direction to the measurements (Fig. D-3-1), including the turn
to the southwest, less transport to the north, and a much smoother pattern, more consistent with the
measurements.
Detailed verification results for the case using UNSCEAR source term is given in Draxler et al.
(2013a).
Fig. F-5-2. Calculated 137Cs deposition using the mean of ten selected ATDM-meteorology combinations.
After Draxler et al. (2013a).
F-5-2. Verification results using JAEA source term
The results of ATDM simulations and their verifications have been published in WMO (2012b) and
Draxler et al. (2013a). In this subsection, verification results using JAEA source term are briefly
summarized from the above publications.
Table F-5-1 shows ATDM verification results for 137Cs deposition using JAEA source term. In this
table, JMA (PRE) shows the results from the preliminary JMA-RATM simulations before the
modifications described in Section E-2 were applied. METRIC1 is the total model rank defined by the
Eq. (D-3-1). Here, the value of METRIC1 is positive and becomes 4.0 for a perfect case. For
137
Cs
deposition, NOAA-HYSPLIT using GDAS showed the best score for METRIC1. ZAMG-FLEXPART
and, NOAA-HYSPLIT using ECMWF analysis and, UKMET-NAME using JMA-MESO also scored
a relatively high performance. In NOAA-HYSPLIT, the use of JMA MESO analysis did not improve
123
TECHNICAL REPORTS OF THE METEOROLOGICAL RESEARCH INSTITUTE No.76 2015
the METRIC1, while the results of CMC-MLDP0 and UKMET-NAME were improved by the use of
JMA MESO.
Table F-5-2 shows ATDM verification results for air concentrations at JAEA. Including the best
score by CMC and the second best by JMA-RATM, all the top five ranked models used the JMA Meso
analysis for their computations.
Replacing the JMA Mesoscale analysis precipitation fields with JMA precipitation observation
analysis (MESO-R) did not improve the ATM calculations of deposition and even deteriorated the
scores for air concentration. The reason for this is not clear. It should be noted that the air concentration
verification was for a single location (JAEA) thus it does not reflect the horizontal distribution of
radionuclides. The southward advection of radionuclides from Fukushima Daiichi NPP on March 15th
was sensitive to small changes in the wind direction. As for deposition, ZAMG-FLXPART using
ECMWF analysis slightly improved its score when the precipitation analysis was used. Saito et al.
(2015) suggested the following reasons that the precipitation analysis did not improve the performance
of ATM calculations:
The discrepancy of the transport patterns created using numerical weather prediction (NWP)
analyses and the locations of the actual precipitation may result in a wrong description of the total wet
scavenging. The quality of the RAP data itself is also arguable. Although the bright band (shown in Fig.
B-3-2) is not likely critical in this experiment, radar echoes are scanned around the level of 1 km AGL
and solid waters are over-detected in the radar reflectivity. A lower detection limit of around 0.4 mm h1
applies to the RAP, which means that very weak precipitation is not included. In case of JMA-RATM,
all RAP precipitation was considered to be liquid rain in the wet scavenging calculation (see Section E2), and this assumption also may yield some errors in the time evolution.
124
TECHNICAL REPORTS OF THE METEOROLOGICAL RESEARCH INSTITUTE No.76 2015
Table F-5-1. ATDM verification results for 137Cs deposition using JAEA source term. First to fifth values
of METRIC1 are indicated by bold type. In analysis, ‘-R’ means that JMA precipitation analysis is used.
Reproduced from Draxler et al. (2013a).
Organization
CMC
CMC
JMA (PRE)
JMA (PRE)
NOAA
NOAA
NOAA
NOAA
NOAA
NOAA
UKMET
UKMET
UKMET
UKMET
ZAMG
ZAMG
ZAMG
ZAMG
Analysis
GEM
MESO
MESO
MESO-R
0.45
0.77
-0.02
0.54
100.00
100.00
-0.46
9.67
51.01
41.99
10.00
11.00
3.09
3.22
GDAS-R
0.68
-0.57
100.00
-16.48
31.86
23.00
3.65
2.94
MESO-R
0.48
0.43
100.00
-4.14
35.54
16.00
2.85
GDAS
MESO
R
0.76
0.76
0.87
0.55
FB
-0.32
-0.44
-0.08
0.38
FMS
100.00
100.00
100.00
11.69
-4.33
8.01
-8.01
%FA2
48.99
45.12
48.25
41.07
KSP
19.00
6.00
6.00
15.00
3.22
3.30
2.97
ECMWF
0.83
-0.30
100.00
-12.06
46.96
10.00
0.55
-0.74
100.00
-20.35
21.92
33.00
3.45
2.60
UM
0.44
0.24
100.00
30.48
42.36
30.00
2.77
ECMWF
0.80
0.11
100.00
19.06
54.70
25.00
3.34
MESO
0.76
0.04
100.00
5.80
45.12
11.00
MESO-R
0.66
0.03
100.00
6.35
34.62
9.00
3.45
3.33
GDAS
0.66
-0.59
100.00
-6.17
45.12
10.00
3.05
GDAS-R
0.66
-0.84
100.00
-16.85
28.36
20.00
2.82
ECMWF
0.78
-0.08
100.00
9.85
59.67
15.00
ECMWF-R
0.83
0.13
100.00
5.99
52.12
6.00
3.41
Analysis
R
FB
131
FMS
FOEX
%FA2
KSP
GEM
MESO
0.07
0.23
-1.37
-0.09
73.17
80.49
-30.95
-4.76
7.14
16.67
53.00
34.00
JMA (PRE)
JMA (PRE)
NOAA
NOAA
NOAA
NOAA
NOAA
NOAA
UKMET
UKMET
UKMET
MESO
0.51
-0.82
80.00
-21.43
21.43
43.00
MESO-R
GDAS
GDAS-R
MESO
MESO-R
ECMWF
ECMWF-R
UM
ECMWF
MESO
0.59
0.10
0.10
0.15
0.15
0.27
0.27
0.06
0.13
0.24
-1.66
-1.37
-1.38
-1.63
-1.63
-1.33
-1.35
-1.42
-0.93
-0.50
57.50
60.00
60.00
62.50
60.00
62.50
62.50
65.85
68.29
80.00
-45.24
-42.86
-42.86
-40.48
-40.48
-35.71
-35.71
-30.95
-28.57
-28.57
4.76
7.14
7.14
11.90
9.52
11.90
16.67
19.05
21.43
16.67
64.00
69.00
67.00
67.00
67.00
60.00
60.00
53.00
53.00
52.00
UKMET
MESO-R
0.24
-0.53
80.00
-30.95
16.67
52.00
ZAMG
GDAS
0.17
-0.37
57.50
-35.71
14.29
57.00
ZAMG
ZAMG
ZAMG
GDAS-R
0.18
ECMWF
0.12
ECMWF-R 0.08
-0.43
-0.54
-0.55
57.50
52.50
42.50
-35.71
-35.71
-35.71
14.29
11.90
7.14
55.00
60.00
69.00
125
3.57
I air concentrations at JAEA. Reproduced from
CMC
CMC
METRIC1
ECMWF-R
Table F-5-2. Same as in Table F-5-1, but for particulate
Draxler et al. (2013a).
Organization
FOEX
100.00
METRIC1
1.52
2.47
2.22
1.46
1.24
1.25
1.16
1.14
1.43
1.43
1.42
1.70
2.09
2.07
1.85
1.84
1.67
1.46
TECHNICAL REPORTS OF THE METEOROLOGICAL RESEARCH INSTITUTE No.76 2015
G. Relevant modeling at MRI and JMA
G-1. Numerical Atmospheric Transport and Dispersion Models1
Numerical atmospheric transport dispersion and deposition models (ATDMs) are capable of
simulating air and ground surface contamination with radioactive materials from nuclear accidents.
Given the time and place of emission sources, ATDMs calculate the advection, diffusion, and dry and
wet deposition processes of radioactive materials. Many ATDMs are driven by meteorological
parameters provided by numerical weather prediction (NWP) models. They range from
high-resolution limited-area models to low-resolution global models, depending on their purposes and
the available computational resources.
Although predictions by ATDMs are very informative, they have some uncertainty, which results
from limited information about emission sources and incomplete model representation of transport and
deposition processes, in addition to the uncertainty of NWP products. In general, the products of
ATDMs should not be used for quantitative comparison with some threshold densities of radioactive
materials for evacuation, but they are suitable for assessing the worst case scenario.
Although ATDMs were not used for mitigating risks of radiation exposure in the case of the
accident at the Fukushima Dai-ichi Nuclear Power Plant (Iwasaki, 2013), a working group of the
Meteorological Society of Japan has pointed out some ways in which numerical predictions of the
atmospheric dispersion of accidentally released radioactive materials can be utilized (WGMSJ, 2014).
In particular, ATDMs may be useful along with monitoring data in the following environmental
emergencies:
(i) Radioactive materials floating near the ground surface:
People become internally exposed to floating radioactive materials through inhalation. For example,
radioactive iodine tends to concentrate in the thyroid gland, where it may cause thyroid cancer.
ATDMs are expected to provide information about contaminated air near the ground surface.
(ii) Radioactive materials deposited on the ground:
Airborne radioactive materials contaminate the ground surface through dry and wet deposition. Wet
deposition, in which falling raindrops gather radioactive materials between the clouds and the ground,
can cause severe radioactive contamination of the ground even far away from the emission source.
Unfortunately, the performance of ATDMs in simulating wet deposition processes is not satisfactory
because of NWP errors in predicting precipitation, together with the errors arising from the ATDM
itself, degrade the quality of wet deposition predictions. However, ATDMs can be used to estimate the
vertically integrated amount of airborne radioactive materials, which is the maximum potential wet
deposition.
1
T. Iwasaki
126
TECHNICAL REPORTS OF THE METEOROLOGICAL RESEARCH INSTITUTE No.76 2015
G-2. WMO emergency response activities and operational atmospheric transport
modelling at JMA1
G-2-1. Introduction
The Japan Meteorological Agency (JMA) was designated by the World Meteorological
Organization (WMO) as a Regional Specialized Meteorological Centre (RSMC) for Atmospheric
Transport Modelling (ATM) for radiological Environmental Emergency Response (EER). RSMCsATM are responsible for providing ATM products in response to requests by the International Atomic
Energy Agency (IAEA) and members of WMO. This section briefly describes the WMO EER service
and the operational atmospheric transport model used by JMA.
Table G-2-1. List of current WMO RSMCs-ATM for radiological EER.
Organization
(country)
Start
year
RSMC Tokyo
Japan Meteorological Agency 1997
(Japan)
RSMC Beijing
Chinese Meteorological
Administration (China)
WMO Regional Association
WMO Regional Association II (Asia)
1997
RSMC Obninsk
Roshydromet* (Russia)
1997
RSMC Montréal
Canadian Meteorological
Center (Canada)
1989
RSMC
Washington
National Environmental
Prediction Center (USA)
1993
WMO Regional Associations III and
IV (South, Central, and North
America, and the Caribbean)
RSMC Melbourne Bureau of Meteorology
(Australia)
1995
WMO Regional Association V
(South-West Pacific)
RSMC Exeter
UK Met Office (UK)
1989
RSMC Toulouse
Meteo France (France)
1989
WMO Regional Associations I and VI
(Africa and Europe)
* The Russian Federal Service for Hydrometeorology and Environmental Monitoring
G-2-2. WMO RSMCs-ATM
After the Chernobyl nuclear power plant accident in April 1986, the Commission for Basic Systems
(CBS) of WMO held a series of discussions and decided to launch an ATM EER service to meet the
broad interest in the atmospheric dispersion of toxic radiological materials. The national
meteorological and hydrological services of the United Kingdom, France, and Canada started their
ATM services in 1989. Table G-2-1 lists the current RSMCs-ATM. JMA was designated an RSMC at
the 49th session of the WMO executive council in 1997 and initiated its service on 1 July 1997. Two
other RSMCs (Beijing and Obninsk) in Regional Association (RA) II (Asia) also began operation
then. The German Weather Service (Deutscher Wetterdienst) has been contributing by acting as the
WMO Regional Telecommunications Hub (RTH) for EER. In this role, it receives nuclear and
radiological emergency messages from IAEA and disseminates early warning messages through the
WMO Global Telecommunication System (GTS).
Each RSMC is responsible for providing forecasts within its region of responsibility (see Table G2-1). RSMSs provide their ATM products not only to IAEA but also to WMO members within their
1
M. Sakamoto
127
TECHNICAL REPORTS OF THE METEOROLOGICAL RESEARCH INSTITUTE No.76 2015
region of responsibility. For example, if a WMO member in RA II asks for support, RMSCs Tokyo,
Beijing, and Obninsk serve this request. If RSMC Tokyo receives a request from a WMO member in
RA V (South-West Pacific), which is adjacent to RA II and includes part of Southeast Asia, RSMC
Tokyo replies to the member and forwards the request to RSMC Melbourne, the responsible center of
RA V, which services the request.
More than one RSMC is allocated to each RA so that RSMCs can compare and evaluate the
accuracy of their products before presenting a concise statement of ATM forecast results and the
meteorological situation within the region. In the case of RA V, where there is only one center,
RSMCs Montréal and Washington provide services in support of RSMC Melbourne.
G-2-3. International coordination by the CBS expert team
CBS formed an expert team to organize emergency responses and related activities, and the team is
currently called the Expert Team on Emergency Response Activities. This team, which is composed of
representatives from the RSMCs, RTH, WMO, and IAEA secretariats and other related international
organizations, meets once every two years to discuss issues regarding ATM services at related WMO
centers.
The team reports to the CBS Open Programme Area Group on Data-Processing and Forecasting
System, which then conveys the contribution through CBS to the WMO Executive Council and the
World Meteorological Congress. For instance, the issues and activities discussed at the team meeting
in Vienna in 2011 were contributed to CBS-15 in Jakarta in 2012 and the 65th Executive Council
meeting in 2013.
G-2-4. Standard EER products
The standard set of EER products, as defined in Appendix II-7 of the Manual on the Global Dataprocessing and Forecasting System (WMO, 2010), consists of seven charts (Fig. G-2-1) and a joint
statement on weather and atmospheric dispersion forecasts within the region.
(a) Trajectory chart (Fig. G-2-1 (a))
Trajectories of three tracers released at 500, 1500, and 3000 m above the surface are shown in the
chart. The tracers are released at the start release time of radioactive material and move with the wind
stream, without considering disturbance by atmospheric diffusion and viscosity. The forecast extends
to 72 hours after the forecast initial time. Changes in the height of each tracer with time are shown
below the map in the figure.
(b) Time-integrated concentration charts (Fig. G-2-2 (b))
The 24 hour time-integration concentration of the radioactive material by 24, 48, and 72 hours after
the forecast initial time are presented in three charts. The distributions shown in Fig. G-2-2 (b) is the
average from the surface to an altitude of 500 m. The unit of radioactivity in the charts is Bq s / m3,
and indicates the number of radiological decays in the 24 hour period per cubic meter of atmosphere.
(c) Total deposition charts (Fig. G-2-3 (c))
The distribution of radioactive materials that have accumulated through dry and wet deposition
processes on the surface from the initial release time is shown in three charts, for 24, 48, and 72 hours
after the forecast initial time. The unit of deposition is Bq / m2, which is the number of radiological
decays per second per square meter of surface.
(d) Joint Statement
A concise consensual plain text description of weather conditions and the atmospheric dispersion
forecast of the radioactive material is prepared by the RMSCs within each region. For example,
RSMCs Tokyo, Beijing, and Obninsk prepare this statement whenever documentation for RA II is
needed. The statement basically includes a synopsis of the current situation and the forecast of
meteorological conditions in the area of concern, along with the transport modelling results, including
the differences and similarities among the models.
The impact of an accident depends not only on the amount of radioactive material released but also
on the types of radionuclides and on the exposure pathway. The products produced by the WMO
RSMCs consist only of weather forecast and atmospheric transport information; they do not address
the consequences of the release of toxic materials in the region. Therefore, expertise in nuclear science
and in biology, including knowledge of the characteristics of nuclear decay and the impact of radiation
exposure on the bodies of humans and animals, is needed to interpret any impacts from the products.
128
TECHNICAL REPORTS OF THE METEOROLOGICAL RESEARCH INSTITUTE No.76 2015
WMO RSMCs present their ATM products to IAEA and the registered organizations of WMO
member states. The ATM results should be analyzed by specialized international organizations such as
IAEA and WHO, and by relevant national governmental organizations of the influenced member
states.
(a)
(b)
(c)
Fig. G-2-1. Examples of the standard EER products: (a) trajectory chart and time–height diagram for the three
tracers, (b) time-integrated concentration chart, (c) total deposition chart.
129
TECHNICAL REPORTS OF THE METEOROLOGICAL RESEARCH INSTITUTE No.76 2015
G-2-5. JMA’s ATM for EER
The atmospheric transport model for EER by JMA uses a Lagrangian approach in which many
tracer particles are released at the time and location of the pollutant emissions and the model simulates
the displacement of the tracers. The tracers move by advection and diffusion, and they may descend
and settle onto the surface through dry or wet deposition. Table G-2-2 shows the specifications of the
atmospheric transport model. The effects of advection, diffusion and deposition are simulated by using
3-hourly grid point values from JMA’s operational global numerical weather prediction. Tracer
particles are also removed by nuclear decay. Iwasaki et al. (1998) described the development of the
ATM and the results of an international comparison experiment, and Sakamoto (2013) gave a detailed
description of the model.
Lagrangian ATMs have the advantage that they conserve the total amount of released tracers. There
is neither a fictitious loss nor a gain if the treatment of deposition and of radiological decay is
appropriate. Almost all RSMCs2 use Lagrangian atmospheric transport models.
Table G-2-2. Specifications of the ATM for the radiological EER at RSMC Tokyo.
Type of ATM
Lagrangian
Vertical diffusion scheme
Louis et al. (1982)
Dry deposition scheme
Kitada et al. (1986)
Wet deposition scheme
Kitada (1994)
Number of tracer particles
100,000
Horizontal grid cell size for
concentration and deposition
1° × 1°
Weather forecast system
JMA’s Operational Global Forecast (TL959L60 Global Spectral
Model)*
Grid point data used in the ATM
Lower Resolution (TL319L40) Grid Point Data prepared for
ATM. The ATM uses gridded wind velocity, precipitation,
specific humidity, temperature, surface pressure, and horizontal
pressure gradient data.
* When the start release time is earlier than the forecast initial time, the operational global analysis data are also
used as for the period before the forecast initial time.
G-2-6. A case study of a wildfire event
To demonstrate the performance of JMA’s ATM for EER, a case study of a wildfire event, during
which the distributions of the tracers were optically observed by a satellite imager, is presented in this
subsection.
According to the fire and smoke products produced by the Office of Satellite and Product
Operations of the U.S. National Environmental Satellite, Data, and Information Service (NESDIS), on
28 April 2011 wildfires were started by lightning around the Okefenokee National Wildlife Refuge
(ONWR) in Georgia, USA. The fires continued for months, and smoke was clearly observed,
especially during the period from 19 to 23 June. Visible and infrared images acquired by the MODIS
instrument on the AQUA satellite were published on the NESDIS website. Although there were other
wildfires during the same period, the large wildfires around ONWR produced the most smoke.
In the visible image acquired by the AVHRR sensor on NOAA-18 at 17:00 UTC on 23 June (Fig.
G-2-2a), a broad thick band of clouds covers parts of the central and eastern United States and
southern Canada, but there is little cloud cover over the western Atlantic Ocean at around 30°N. In the
2
The only exception is the ATM of RSMC Toulouse, which uses an Eulerian approach.
130
TECHNICAL REPORTS OF THE METEOROLOGICAL RESEARCH INSTITUTE No.76 2015
differential infrared image acquired at the same time (Fig. G-2-2b), the broad gray area spreading over
the Atlantic from the U.S. east coast was identified as smoke released by the ONWR wildfires.
Because emittance of infrared (IR) radiation of smoke is heavily dependent on the wavelengths, a
differential IR image is used to reveal the presence of the smoke.
Figure G-2-3 shows the result of the ATM forecast, in which tracers are uniformly released from the
surface in the ONWR from 00:00 UTC on 15 June to 00:00 UTC on 23 June 2011. To simulate the
broad distribution for the long forecast period, the number of the tracers was set to be two million. The
distribution of the total column amount of tracers at 00:00 UTC on 23 June in the forecast results,
presented using a log-scale in Fig. G-2-3, generally corresponds to the area of smoke shown in Fig. G2-2b. Few tracers are below the thick cloud area seen in Fig. G-2-2a because the considerable amount
of precipitation predicted by the global forecast washed out the tracers. In fact, NESDIS reported that
there was no smoke identified north of Virginia because of heavy rain. A thick area of tracers also
extends from the northeastern Labrador-Ungava Peninsula to the north Atlantic. JMA’s global
analyses of geopotential height at 500 hPa and wind distribution at 700 hPa at 00:00 UTC on 23 June
2011 (Fig. G-2-4) show a cutoff low pressure system around Newfoundland. The tracers over the
Labrador-Ungava Peninsula followed the counterclockwise air circulation around this low, and their
distribution corresponds well to the smoke distribution in Fig. G-2-2b. The tracers were relatively high
because of upwelling flow around the low.
a
b
Fig. G-2-2. Images acquired by NOAA-18 / AVHRR at 17:00 UTC on 23 June 2011: (a) visible image, (b)
differential infrared image.
131
TECHNICAL REPORTS OF THE METEOROLOGICAL RESEARCH INSTITUTE No.76 2015
Fig. G-2-3. Distribution of the total column amount of tracers in the ATM forecast for 00:00 UTC on 23 June
2011.
Fig. G-2-4. Analysis of the geopotential height at the 500 hPa level (contour interval, 50 m), and wind barbs at
700 hPa at 00:00 UTC on 23 June 2011.
132
TECHNICAL REPORTS OF THE METEOROLOGICAL RESEARCH INSTITUTE No.76 2015
G-3. NHM-Chem: Sensitivity of Cs deposition to the size and hygroscopicity of
Cs-bearing aerosols 1
G-3-1. Abstract
The emission, transport, and deposition of 137Cs released by the Fukushima Daiichi Nuclear Power
Plant (FDNPP) accident were simulated with consideration of the microphysical properties (i.e. size
and hygroscopicity) of the Cs-bearing aerosols (carrier aerosols of radioactive Cs). The sensitivity of
the simulated deposition of
137
Cs to the size and hygroscopicity of the carrier aerosols was assessed
and compared with the sensitivity to meteorological fields simulated using different dynamics and
physics modules. Two types of Cs-bearing aerosols were considered in the simulation, supermicron
water-insoluble and submicron water-soluble particles, in accordance with previously published
observational evidence (Adachi et al., 2013 and Kaneyasu et al., 2012). Even though the same
transport model was used, the simulated depositions were very different when meteorological models
with different dynamics and physics modules were used. The sensitivity of
137
Cs deposition to the
carrier aerosol size and hygroscopicity, in which the proportion of water-insoluble aerosol emission
ranged from 10% to 90%, during the early stage ranged from March. 11-12 to Mar. 12-20, was found
to be lower but still as important as the sensitivity to meteorological fields simulated using different
dynamics and physics modules. To better understand the environmental behavior of the radioactive Cs
discharged from the FDNPP, knowledge of the carrier aerosol microphysical properties is as important
as the accuracy of the meteorological simulation and the emission scenario.
G-3-2. Introduction
Three months after the FDNPP accident, Chino et al. (2011) estimated the emission amounts of
radioactive
137
Cs and
131
I associated with the accident by using a reverse estimation method in which
both the environment monitoring data and an atmospheric dispersion simulation were used (see
section D-2). Since then, many modeling studies have been conducted to assess the emission,
dispersion, and deposition amounts of radionuclides associated with the accident (Morino et al. 2011;
Yasunari et al., 2011; Schöppner et al. 2011; Takemura et al., 2011; Sugiyama et al., 2012; Stohl et al.,
2012; Terada et al., 2012; Katata et al., 2012a, 2012b; Morino et al., 2013; Adachi et al., 2013; Hu et
al., 2014; Katata et al., 2015; Sekiyama et al., 2015).
Because
numerical
models
use
uncertain
parameters
and
rough
assumptions,
model
inter-comparison and intra-comparison (or sensitivity) studies are essential to assess the uncertainties
of numerical simulations. In fact, previous model inter-comparison studies have shown that simulation
results vary substantially among models (Draxler et al., 2013a; Katata et al., 2015; SCJ, 2014).
Although model inter-comparison studies can show how the simulation results of models using
different dynamics, physics, and chemistry modules and emission scenarios differ overall, the reasons
for the differences cannot be easily identified. In contrast, model intra-comparison (or sensitivity)
1
M. Kajino
133
TECHNICAL REPORTS OF THE METEOROLOGICAL RESEARCH INSTITUTE No.76 2015
studies can identify the modules or parameters that are responsible for different results, but under
limited conditions that the simulations are performed only by a single model.
Morino et al. (2013) investigated the sensitivity of radioactive Cs dispersion and deposition to the
wet-scavenging modules and emission scenarios. Like most previous studies, for the meteorological
field they used the output of only one meteorology model. In this study, we used several different
meteorology models and simulation techniques to evaluate sensitivity of the transport model results to
different meteorological simulations as well.
Another important aspect of this study is that we examined the sensitivity of the simulated
deposition to the microphysical properties of Cs-carrying aerosols for the first time. Adachi et al.
(2013) reported that in the early stage of the accident, the carrier aerosols of radioactive Cs were
spherical, water-insoluble particles (hereafter, Cs-balls), and they predicted that the atmospheric
behavior of these aerosols would be different from that of the submicron water-soluble particles
described by Kaneyasu et al. (2012). Washout (or below-cloud scavenging) of aerosol particles (i.e., of
both types described in this paragraph) is not usually efficient because of their small inertia and slow
Brownian motion. In contrast, the submicron water-soluble particles are efficiently scavenged via
rainout (or in-cloud scavenging) because the Kelvin (curvature) effect is enough small. Washout is
probably the dominant scavenging process of water-insoluble aerosols, because very high
supersaturation conditions are needed for rainout of water-insoluble aerosols to occur.
The purpose of this study was to assess the sensitivities described above in order to evaluate the
uncertainties of the simulated deposition of
137
Cs caused by aerosol microphysical properties (i.e.,
aerosol size and hygroscopicity) and to compare it to the uncertainty caused by the use of different
meteorological simulations.
G-3-3. NHM-Chem
NHM-Chem is a chemical transport model, offline- or online-coupled with Japan Meteorological
Agency’s non-hydrostatic model (JMA-NHM; Saito et al., 2007). NHM is a numerical weather
prediction model of JMA. An Eulerian regional chemical transport model, Regional Air Quality
Model 2 (RAQM2) (Kajino et al., 2012a), is used to simulate emission, transport, and deposition of
trace gases and aerosols. RAQM2 implements a triple-moment modal aerosol microphysics module
that assumes a log-normal size distribution of aerosol populations. This model describes the nature of
aerosol dynamical processes, such as nucleation, condensation, coagulation, hygroscopic growth, dry
deposition, grid-scale rainout (cloud condensation and ice nuclei activation and subsequent
mixed-phase cloud microphysical processes) and washout (coagulation between aerosols and settling
hydrometeors) processes, and sub-grid-scale convection and scavenging processes. In the study, the
offline-coupled NHM-Chem was used in order to use different meteorological models alternatively,
such as the Weather Research and Forecasting (WRF) model (Skamarock et al., 2008) to drive
RAQM2.
134
TECHNICAL REPORTS OF THE METEOROLOGICAL RESEARCH INSTITUTE No.76 2015
G-3-4. Simulation settings
In this study, meteorology simulations were performed with NHM and WRF with two different
cloud microphysics modules, Morrison et al. (2009) and Lim and Hong (2010), referred to as
WRF-MORR and WRF-WDM6, respectively. The two WRF simulations were used so that the
sensitivity to just the cloud microphysical process (grid-scale) could be assessed, because wet
deposition of 137Cs over Japan dominated over dry deposition in this study.
NHM, WRF, and RAQM2 shared the same domain, which consisted of 215 × 259 grid cells with a
3 km horizontal resolution; this model domain is slightly larger than the area shown in Fig. G-3-1.
There were 50 vertical layers up to 50 hPa in NHM, 28 layers up to 100 hPa in WRF, and 20 layers up
to 10 km in RAQM2. JMA Meso-Regional Objective Analysis data sets (3 hourly, 5 km × 5 km) were
used for the initial and boundary conditions of NHM and WRF. The same analysis data sets were used
for the spectral nudging in NHM and for the grid nudging in WRF.
The radionuclide transport version of NHM-Chem was developed for simulations of nuclear power
plant accidents such as the FDNPP accident (Adachi et al., 2013; Sekiyama et al., 2015). This version
of NHM-Chem uses an aerosol dynamics module that is simplified from that described by Kajino et al.
(2012a) because aerosol hygroscopicity and the particle size distribution are assumed to be constant
during transport. The nature of the aerosol dynamics such as dry deposition and grid-scale
rainout/washout processes are thus described on the basis of the prescribed size distribution and
hygroscopicity. Details of the dry and wet deposition processes are described by Kajino et al. (2012a;
their sections 2.2.7 and 2.2.8). Even aerosols that are completely water-insoluble (i.e., hygroscopicity
κ = 0) can act as cloud condensation nuclei under highly supersaturated conditions. Although
water-insoluble aerosols can coagulate with cloud droplets within a cloud (this is also rainout process),
for simplicity, in this study we did not consider rainout of Cs-balls and only washout in their wet
deposition modeling. Sub-grid scale convection and scavenging processes were not considered. The
fog deposition process of Katata et al., (2015) was considered.
We used the emission scenario for 137Cs discharged from the FDNPP from Terada et al. (2012), and
considered Cs-bearing aerosols to be of two types. Supermicron water-insoluble particles (Cs-balls)
had a lognormal size distribution, number equivalent geometric mean dry diameter D g,n,dry = 2.3 μm,
geometric standard deviation σ g = 1.3, particle density ρ p = 2.0 g/cm3, and κ = 0 (Adachi et al., 2013),
and submicron water-soluble particles (Kaneyasu et al., 2012) had a lognormal size distribution,
D g,n,dry = 0.1 μm, σ g = 1.6, ρ p = 1.83 g/cm3, and κ = 0.4.
For the sensitivity studies, taking into consideration the findings of Adachi et al. (2013), we allowed
the proportion of early-stage emissions consisting of Cs-balls during the early stage to range from 10%
to 90%, and the ending date of the early stage to range from 12 to 20 March 2011.
The analysis period was from 00:00 UTC on 11 March to 00:00 UTC on 1 April, with a spin-up
period of 3 days. Thus, the entire simulation period was from 8 March to 1 April 2011.
135
TECHNICAL REPORTS OF THE METEOROLOGICAL RESEARCH INSTITUTE No.76 2015
Fig. G-3-1. Cumulative precipitation (mm) from 11 March to 1 April: (a) Radar/rain gauge-analyzed
precipitation (RAP) data and precipitation simulated by (b) NHM, (c) WRF-MORR, and (d) WRF-WDM6.
Fig. G-3-2. Scattergrams of simulated and observed (RAP) cumulative precipitation: (a–c) from 11 March to 1
April and (d–f) in the afternoon of 15 March. Simulations were by (a, d) NHM, (b, e) WRF-MORR, and (c,
f) WRF-WDM6. The plotted data are for all grids for which both observation and simulation data were
available. Although the data are plotted on a log-log scale, the statistics R, mean bias (MB), and the
observation average (Obs. Ave.) were calculated on a linear-linear basis.
136
TECHNICAL REPORTS OF THE METEOROLOGICAL RESEARCH INSTITUTE No.76 2015
G-3-5. Results and discussion
We compared observed and simulated cumulative precipitation from 11 March to 1 April among the
three meteorology models (Figs. G-3-1 and G-3-2). For observed data, we used JMA’s radar/rain
gauge-analyzed precipitation (RAP) data, which were interpolated to the 3 km resolution grid. We also
compared observed and simulated cumulative precipitation on the afternoon of 15 March (Fig. G-3-2,
lower panels), when substantial deposition occurred on land (e.g., Morino et al., 2013). All three
simulations overestimated precipitation over the ocean by a factor of more than 10 (data points above
the 10:1 simulation:observation line in Fig. G-3-2), and the two WRF simulations also underestimated
precipitation in the southwestern part of the domain by a factor of more than 10 (data points below the
1:10 simulation:observation line in Fig G-3-2). Our focus was on land regions where the
137
Cs
2
deposition was large (>10 kBq/m ) (see Fig. G-3-3), and we did not expect the large discrepancies
between the simulated and observed precipitation over the ocean to substantially affect the modeling
of 137Cs deposition in land areas.
The differences due to the different cloud microphysics modules were notable. The simulated
precipitation spatial distribution patterns of the two WRFs were similar and different from the NHM
pattern, whereas the precipitation amounts in WRF-MORR were fairly close to those in NHM, and
those in WRF-WDM6 were much larger than the amounts in the other two simulations (Fig. G-3-2).
WRF-WDM6 overestimated precipitation substantially over high-altitude regions (corresponding to
locations where the simulated precipitation was >600 mm; Fig. G-3-1d). In the afternoon of 15 March,
the overestimation of WRF-WDM6 was substantial; the mean bias (MB) was 4.1 mm and the
observation average was 2.36 mm. Judging from the values of the correlation coefficient (R), the
performance of NHM was best among the three meteorological simulations (R = 0.86, MB = 0.35 mm).
The MB of WRF-MORR was smallest (MB = 0.24 mm), but owing to the square shape of the plotted
data, R was 0.67.
Comparison of cumulative
137
Cs deposition amounts between aircraft observations (Torii et al.,
2012) and simulations by NHM, WRF-MORR, and WRF-WDM6 (Fig. G-3-3), performed under the
assumption that 100% of 137Cs was carried by water soluble particles, showed that NHM simulated too
much deposition in northern areas (Yamagata, Miyagi, and Iwate prefectures). This deposition was
caused by rainout of ice phase precipitation (snow and graupel). For accurate simulation of rainout
of
137
Cs, the vertical distribution of the
137
Cs and the hydrometeor mixing ratio must be accurately
predicted. However, because no observations of the vertical profiles of 137Cs are available for the time
period of this study, the reason for this overestimation is impossible to identify.
WRF-MORR also simulated too much deposition in Yamagata and Miyagi prefectures, but
WRF-WDM6 simulated less deposition in this area. The two WRF simulations reasonably reproduced
depositions in the highest deposition areas (>1000 kBq/m2), but depositions in those areas were
underestimated by NHM. The two WRF simulations also reasonably reproduced the higher
depositions in the mountainous regions of Tochigi and Gunma prefectures, but they overestimated
depositions in the southern area (Tokyo, Kanagawa, Shizuoka, and Chiba prefectures). The NHM
137
TECHNICAL REPORTS OF THE METEOROLOGICAL RESEARCH INSTITUTE No.76 2015
Fig. G-3-3. Cumulative 137Cs deposition amounts (kBq/m2) in (a) aircraft observations and (b) NHM, (c)
WRF-MORR, and (d) WRF-WDM6 simulations. Simulated depositions are shown only for land areas to
facilitate visual comparison with the observed deposition.
simulation underestimated deposition in all of these areas (i.e., in Tochigi and Gunma prefectures as
well as in Tokyo, Kanagawa, Ibaraki, and Chiba prefectures). It is notable that, even though the
transport model was the same, the simulated depositions varied substantially among the different
meteorological simulations.
Figure G-3-4 shows depositions of water-soluble and water-insoluble particles simulated by using
the three meteorological fields on both land and ocean areas. We compared the simulated depositions
with aircraft observation data (Fig. G-3-3a) interpolated to the 3 km resolution grids of the models in
Fig. G-3-5. Note that following Morino et al. (2013) and Katata et al. (2015), R and MB were
calculated only when the observed values were larger than 10 kBq/m2.
138
TECHNICAL REPORTS OF THE METEOROLOGICAL RESEARCH INSTITUTE No.76 2015
Fig. G-3-4. Cumulative depositions (kBq/m2) simulated using the meteorological fields of (a, d) NHM, (b, e)
WRF-MORR, and (c, f) WRF-WDM6 under the assumption that 100% of Cs was carried by (a–c) water
soluble or (d–f) water insoluble particles.
Fig. G-3-5. Scattergrams of cumulative deposition between the (a, d) NHM, (b, e) WRF-MORR, and (c, f)
WRF-WDM6 simulations and aircraft observations. The simulations were performed under the assumption
that 100% of Cs was carried by (a–c) water soluble or (d–f) water insoluble particles. Although the data are
plotted on a log-log scale, the statistics R and mean bias (MB) were calculated on a linear-linear basis.
139
TECHNICAL REPORTS OF THE METEOROLOGICAL RESEARCH INSTITUTE No.76 2015
The simulated results were substantially different between Cs-bearing particles assumed to be 100%
water soluble or water insoluble, because rainout of the Cs-balls was not considered to occur (compare
upper and lower panels in Figs. G-3-4 and G-3-5), whereas the dry deposition velocity of Cs-balls was
approximately four times that of the water-soluble submicron aerosols. It is interesting that although
the simulation of precipitation by NHM/WRF-WDM6 was good/poor, the simulation of deposition by
NHM/WRF-WDM6 was poor/good.
Adachi et al. (2013) detected Cs-balls only in samples collected during the early stage of the
accident (14–15 March), but they reported that radioactive Cs was carried by water-soluble aerosols
later (20–22 March). Kaneyasu et al. (2012), who analyzed samples collected from 28 April to May 12
and during 12–26 May (i.e., after the later sampling period of Adachi et al., 2013), also reported the
radioactive Cs to be carried by water-soluble aerosols. Therefore, the assumption of 100%
water-insoluble or water-soluble particles (Figs. G-3-4 and G-3-5) was not realistic; rather, reality
must lie somewhere in between. Therefore, under the assumption that Cs-balls, as indicated by Adachi
et al. (2013), were emitted only in the early stage of the accident, we used the following settings to test
the sensitivity to aerosol microphysical properties:
1. We set the proportion of Cs-ball emissions to values from 10% to 90% during the early stage.
2. We started the early stage on 11 March but varied its ending date between 12 and 20 March
2011 (i.e., before the later sampling of Adachi et al., 2013).
We next compared cumulative depositions simulated using the meteorological fields calculated by
NHM and the two WRF simulations between two extreme cases: 10% Cs-ball emission until 12 March
and 90% Cs-ball emission until March 20 (Fig. G-3-6). The statistics (MB, root mean square error
(RMSE) and R) of these comparisons are presented in Table G-3-1, together with the statistics for the
three meteorological simulations when emissions were assumed to consist of 100% water-soluble
submicron particles.
It is notable that even when the transport model settings and aerosol properties were the same, the
fractional bias (MB divided by the observation average) ranged from 0.25 to 0.74, differing by
approximately threefold, among the three different meteorological simulations. This difference is
marked, because it means, for example, that the emission amount estimated by an inverse model from
the deposition amount could vary threefold, depending on the meteorological model used. The ranges
of MB, RMSE and R in the sensitivity to aerosol properties test results were smaller than their ranges
in the sensitivity to meteorology test results (Table G-3-1), but the differences were similarly marked.
The fractional bias range differed by approximately twofold between WRF-MORR and WRF-WDM6
(0.35–0.74 and 0.38–0.66, respectively). Therefore, the sensitivity of
137
Cs deposition to aerosol
microphysical properties was as important as its sensitivity to the meteorological simulation used.
140
TECHNICAL REPORTS OF THE METEOROLOGICAL RESEARCH INSTITUTE No.76 2015
Fig. G-3-6. Simulated cumulative depositions (kBq/m2) using the meteorological fields calculated by (a, b)
NHM, (c, d) WRF-MORR, and (e, f) WRF-WDM6 between the two extreme aerosol microphysical
assumptions: (a, c, e) 10% Cs-ball emission from 11 to 12 March and (b, d, f) 90% Cs-ball emission from 11
to 20 March.
Table G-3-1. Ranges of the statistics between observed and simulated cumulative depositions between the two
extreme sensitivity tests (10% or 90% Cs-balls and 12 or 20 March as the ending date of the early stage) with
each meteorological simulation (first to third row). The bottom row shows the same statistics among the
meteorological simulations when no Cs-balls were assumed.
Sensitivity to
MB 1
(min:max)
RMSE1
(min:max)
R1
(min:max)
Obs.
Ave.
(kBq/m2)
(kBq/m2)
(-)
(kBq/m2)
274.3 : 295.0
0.39 : 0.55
88.2
NHM
10-90%
Mar.12 - 20
251.1 : 272.5
0.53 : 0.59
88.2
WRF-MORR
10-90%
Mar.12 - 20
225.9 : 244.2
0.65 : 0.70
88.2
WRF-WDM6
10-90%
Mar.12 - 20
88.2
NHM, WRF-MORR,
WDM6
Aerosol
-68.5 : -65.5
properties
Aerosol
-57.2 : -22.8
properties
Aerosol
-54.6 : -30.2
properties
Meteorology
-66.0 : -23.2
simulations
1
linear-linear statistics
233.0 : 274.9
0.54 : 0.66
141
Simulation settings
Meteorological
simulation
Cs-ball fraction
0%
Ending date of
early stage
-
TECHNICAL REPORTS OF THE METEOROLOGICAL RESEARCH INSTITUTE No.76 2015
G-3-6. Summary
We simulated the emission, transport, and deposition of 137Cs released due to the FDNPP accident.
The sensitivity of the simulated depositions of radioactive Cs to the size and hygroscopicity of the
carrier aerosols was assessed and compared with the sensitivity to the meteorological simulation.
Two types of Cs-bearing aerosols, water-insoluble supermicron particles (Cs-balls) and
water-soluble submicron particles were considered in the simulation. The simulated depositions of the
two aerosols were significantly different because rainout was not considered to occur with Cs-balls,
and the dry deposition velocities of Cs-balls were approximately four times those of the water-soluble
particles.
Even when the transport model was used with exactly the same settings, the simulated depositions
were very different among the different meteorological simulations: The fractional bias (MB divided
by observation average) ranged from 0.25 to 0.74, an approximately threefold difference. The
sensitivity of
137
Cs deposition to particle size and hygroscopicity (determined by adjusting the
proportion of water-insoluble Cs emission between 10% and 90% and the ending date of the early
stage between 12 and 20 March 2011) was smaller but just as important as the sensitivity to the
meteorological simulation (in which 100% of Cs was assumed to be water soluble, as in previous
studies). To better understand the environmental behavior of radioactive Cs discharged from the
FDNPP, knowledge of the aerosol microphysical properties is as important as the accuracy of the
meteorological simulations and emission scenarios.
In future work, several new wet deposition modules and emission scenarios, together with new
meteorological simulations (for example, NHM-LETKF as in Sekiyama et al., 2015), will be added to
the current sensitivity analysis study to provide a more robust uncertainty estimation of the numerical
simulation techniques. It would also be interesting to estimate the sensitivity to the modeling approach
(Lagrangian or Eulerian), because the both approaches have been used in FDNPP accident simulation
studies.
142
TECHNICAL REPORTS OF THE METEOROLOGICAL RESEARCH INSTITUTE No.76 2015
G-4. NHM-Chem-LETKF 1
G-4-1. Introduction
Generally, it is difficult to tell how high a model’s resolution needs to be to simulate the
atmospheric transport and deposition of radionuclides. Japan has a complex topography, and
Fukushima is well known as a mountainous region. Although the Fukushima Daiichi Nuclear Power
Plant (FDNPP) is located on the Pacific Ocean coastal plain, the Abukuma Mountains (up to 1000 m
in elevation) are located just behind the FDNPP. Beyond the Abukuma range, Fukushima City is
located in a long narrow basin, called the Naka-dori Valley, about 70 km from the FDNPP, and Mt.
Azuma, a 2000-m peak, rises just behind the city. This topography is well depicted by a grid with a
500-m horizontal resolution (Fig. G-4-1c). In contrast, it is difficult to recognize these features on a
grid with a 15-km horizontal resolution (Fig. G-4-1a). Most regional models used to simulate radiation
from the Fukushima nuclear accident have used a 3-km horizontal resolution (Fig. G-4-1b) (e.g.,
Chino et al., 2011; Sugiyama et al., 2012; Morino et al., 2013; Adachi et al., 2013; Hu et al., 2014),
but it is not clear that a horizontal resolution of 3 km allows the advection and deposition of
radionuclides from the FDNPP accident to be properly reproduced. Furthermore, global simulation
models of the FDNPP accident (e.g., Yasunari et al., 2011; Takemura et al., 2011; Schöppner et al.,
2011; Stohl et al., 2012) commonly have had horizontal resolutions much lower than 15 km, too low
to depict Fukushima’s complex topography in detail.
In this study, we investigated whether models using a 3-km grid (the typical regional model
resolution) or a 15-km grid (representative of the global model resolution) are suitable for simulating
the radioactive pollution from the FDNPP accident by comparing simulation results obtained with
such models with those obtained with a very high resolution model (500-m grid). We performed tests
with both Eulerian and Lagrangian chemistry transport models, but both models were driven by the
same meteorological analyses. However, we encountered difficulties in obtaining meteorological
analyses with an arbitrary horizontal resolution; an interpolated, extrapolated, or nudged
meteorological analysis is likely to be a mixture of different resolution analyses. Therefore, we
conducted our own data assimilation to obtain analysis data with an arbitrary resolution, independent
of any model or analysis with another resolution.
1
T. T. Sekiyama and M. Kunii
143
TECHNICAL REPORTS OF THE METEOROLOGICAL RESEARCH INSTITUTE No.76 2015
Fig. G-4-1. Fukushima topography depicted at three different scales: (a) 15-km grid, (b) 3-km grid, and (c)
500-m grid. The cross mark indicates the location of FDNPP. The Abukuma Mountains are up to about 1000
m high, and Fukushima City is located in a narrow basin 70 m above sea level (asl). The highest of the
several peaks of Mt. Azuma is 2035 m asl.
G-4-2. Model Description
Before performing the radionuclide transport calculations, we prepared meteorological analyses
with three different horizontal resolutions by using a flow-dependent data assimilation system
assembled and validated by Kunii (2013). This data assimilation system consists of the Japan
Meteorological Agency’s nonhydrostatic model (JMA-NHM; Saito et al., 2006, 2007) and a local
ensemble transform Kalman filter (LETKF; Hunt et al., 2007) called NHM-LETKF. The system
calculated all of the necessary meteorological variables, which were stored after every 10 minutes of
simulation time and used subsequently to drive the radionuclide transport models. In this study, the
horizontal resolutions were set to 15 km, 3 km, and 500 m. A one-way nested data assimilation
scheme was implemented, in which the first guess of a lower resolution model was used for the
boundary conditions for the integration with a finer resolution model (cf. Kunii, 2013). Each nested
inner model ran independently of the outer coarse-resolution model except for the boundary conditions.
Operationally, JMA-NHM is initialized by the JMA non-hydrostatic model four-dimensional
variational data assimilation system (JNoVA, Honda et al., 2005; see also section C-8). Most regional
simulation models used in Japan and some models used by the World Meteorological Organization
Task team for the FDNPP accident use JNoVA grid-point-value (GPV) data as initial/boundary
conditions or pseudo-observations (e.g., Chino et al., 2011; Morino et al., 2013; Adachi et al., 2013;
Draxler et al., 2013a; Saito et al., 2015). In contrast, we calculated our meteorological analyses using
our own data assimilation system (NHM-LETKF) instead of JNoVA GPV data.
The 15-km-grid analysis was calculated by the outermost NHM-LETKF; its domain covered East
Asia and it consisted of 20 ensemble members. The initial and boundary conditions of the
NHM-LETKF cycle were obtained from the JMA operational global prediction system. The
covariance localization parameters were set to 150 km in the horizontal, 0.2 natural-logarithmic
144
TECHNICAL REPORTS OF THE METEOROLOGICAL RESEARCH INSTITUTE No.76 2015
pressure-coordinate in the vertical, and 3 hours in time. As observation data for assimilation, we used
JMA’s operational dataset, which is integrated and quality-controlled for JNoVA mesoscale weather
prediction, as described by Kunii (2013). The JNoVA dataset contains observations acquired by
radiosondes, weather observatories, pilot balloons, wind profilers, aircraft, ships, buoys, and satellites,
but satellite radiances and radar precipitation analyses were not assimilated in this study. Instead, we
assimilated additional surface wind observations acquired by JMA’s Automated Meteorological Data
Acquisition System (AMeDAS) and Tokyo Electric Power Company’s (TEPCO) monitoring posts.
The TEPCO monitoring posts are located at FDNPP and at Fukushima Dai-ni Nuclear Power Plant,
which is 12 km south of FDNPP.
The 3-km-grid analysis was calculated by the first nested NHM-LETKF, the domain of which
covered eastern Japan. The lateral boundary conditions were supplied by the output of the outer
(15-km-grid) NHM-LETKF cycle. This NHM-LETKF was implemented with almost the same
configuration of JMA-NHM as the 15-km simulation, but the convective parameterization scheme was
not activated. We used the same observation data (i.e., JNoVA, AMeDAS, and TEPCO datasets) as in
the 15-km data assimilation. Next, the 500-m grid analysis was calculated by the second nested
NHM-LETKF, the domain of which domain mostly covered most of Fukushima Prefecture. The
lateral boundary conditions were supplied from the outputs of the 3-km NHM-LETKF cycle. Basically,
The same configuration of the 500-m-grid JMA-NHM s were was basically implemented the same in
the 500-m grid spacing JMA-NHM as that of the 3-km simulation. Again, the same observation data
were assimilated during the second nested NHM-LETKF cycle.
We conducted Eulerian simulations with NHM-Chem. NHM-Chem is a meteorology model
(JMA-NHM; Saito et al., 2007) coupled offline with a chemical transport model (Regional Air Quality
Model 2; RAQM2) that was developed by Kajino et al. (2012a). The details of RAQM2 are described
in Chapter G-3. The meteorological analyses were taken into RAQM2 every 10 minutes and linearly
interpolated within that 10 minute interval. RAQM2 and NHM-LETKF shared the same model
domains and horizontal grid resolutions, but their vertical resolutions were converted from
NHM-LETKF’s original number of layers to RAQM2’s 20 layers. The combined system is called
NHM-Chem-LETKF. We used the
137
Cs emission scenario from FDNPP estimated by the Japan
Atomic Energy Agency (JAEA) (cf. Chino et al., 2011). For comparison, we also conducted
Lagrangian simulations using the JMA operational Regional Atmospheric Transport Model
(JMA-RATM), which was developed by Shimbori et al. (2009, 2010). The details of JMA-RATM are
described in Chapter E. The meteorological analyses were taken into JMA-RATM every 1 hour. After
the model calculations, the hourly concentration and deposition outputs were multiplied by the JAEA
hourly 137Cs emission rate.
145
TECHNICAL REPORTS OF THE METEOROLOGICAL RESEARCH INSTITUTE No.76 2015
G-4-3. Results and discussion
We focus here on the simulation of
137
Cs on 15 March 2011 (UTC) because we were interested in
the radioactive plumes that moved landward. The standard experiment with the JAEA emission
scenario performed by Morino et al. (2013) showed that most of the 137Cs deposition on land (mainly
in Fukushima Prefecture) occurred from 15 to 16 March (Japanese Standard Time; JST). This period
accounted for 72% of the total amount deposited on land from 10 March to 20 April 2011. We found
large differences among the analyses in the horizontal winds in the planetary boundary layer (PBL)
(Fig. G-4-2). The 15-km analysis (Fig. G-4-2a) did not represent the northerly winds along the
Naka-dori Valley around Fukushima City because the 15-km-grid model could not represent the
Abukuma Mountains or the Naka-dori Valley. In the 3-km (Fig. G-4-2b) and 500-m (Fig. G-4-2c)
analyses, the wind fields were roughly the same, but only the 500-m analysis reproduced the fine wind
structure over the mountains and valleys.
Fig. G-4-2. Lowest model level (20 m above ground level) wind direction and speed (10-minute mean) in the
northern Abukuma Mountain area, Fukushima Prefecture, at 15:00 UTC on 15 March 2011, simulated by (a)
the 15-km-grid JMA-NHM, (b) the 3-km-grid JMA-NHM, and (c) the 500-m-grid JMA-NHM. The cross
mark indicates the location of FDNPP, the diamond indicates the location of the AMeDAS Souma
observatory, and the square indicates the location of the AMeDAS Fukushima City observatory.
146
TECHNICAL REPORTS OF THE METEOROLOGICAL RESEARCH INSTITUTE No.76 2015
Fig. G-4-3. Surface 137Cs concentrations averaged from 00:00 UTC on 15 March to 00:00 UTC on 16 March
2011 as simulated by the Eulerian model (RAQM2) using the (a) 15-km, (b) 3-km, and (c) 500-m
meteorological analysis, and by the Lagrangian model (JMA-RATM) using (d) 15-km, (e) 3-km, and (f)
500-m meteorological analysis.
According to the TEPCO monitoring post data, the wind in the vicinity of FDNPP gradually
changed in a clockwise direction from northerly to southeasterly between 06:00 JST (21:00 UTC the
day before) and 12:00 JST (03:00 UTC) on 15 March 2011. The wind continued southeasterly for
more than 10 hours, blowing inland from the coastal FDNPP site. During that time, the radioactive
plume would have been carried across Fukushima and neighboring prefectures. In the Eulerian
simulation results, the 137Cs distributions showed good agreement between the 3-km (Fig. G-4-3b) and
500-m (Fig. G-4-3c) simulations. The
137
Cs plume crossed over the Abukuma Mountains but was
mostly blocked by Mt. Azuma and other mountains west of the Naka-dori Valley. However, the 15-km
Eulerian simulation (Fig. G-4-3a) could not represent this blockage of the
137
Cs plume, which spread
broadly through the Naka-dori Valley as far as Yamagata Prefecture in this simulation. Thus, as
expected from the PBL wind errors, the behavior of the plume in the 15-km simulation was unnatural.
The results of the Lagrangian simulations were similar. The behavior of the plume in the Lagrangian
15-km simulation (Fig. G-4-3d) was completely different from that in the 3-km (Fig. G-4-3e) and
500-m (Fig. G-4-3f) Lagrangian simulations. Similar to the Eulerian simulations, the 3-km and 500-m
grid Lagrangian simulations showed good agreement, and both successfully reproduced the blockage
of the
137
Cs plume along the Naka-dori Valley. In addition, the 15-km Lagrangian (Fig. G-4-3d) and
147
TECHNICAL REPORTS OF THE METEOROLOGICAL RESEARCH INSTITUTE No.76 2015
Eulerian (Fig. G-4-3a) simulations showed very similar
137
Cs distributions, although the simulated
concentrations were quantitatively different.
In both the 15-km transport model results (Fig. G-4-4a and G-4-4d) for the total one-day
accumulated deposition of
137
Cs on 15 March 2011 UTC, a highly polluted area extended broadly
beyond Mt. Azuma and other mountains, across the Naka-dori Valley, and as far as Yamagata and
Niigata prefectures. This distribution is similar to the surface concentration distribution (Fig. G-4-3a
and G-4-3d). In addition, the most polluted area was not located near FDNPP but in the vicinity of the
inland border between Fukushima and Yamagata prefectures. This unrealistic distribution was caused
by wet deposition of the
137
Cs-137 plume after it passed the mountains beyond the Naka-dori Valley
and extended into a heavy precipitation area. Such hot-spot pollution was not detected by the JAEA
aerial observations. In contrast, both the 3-km (Fig. G-4-4b and G-4-4e) and 500-m (Fig. G-4-4c and
G-4-4f) models showed that the heavily polluted area was mostly limited to eastern Fukushima
Prefecture near FDNPP, consistent with the JAEA aerial observations.
G-4-4. Conclusion
A large difference was found in the PBL wind field between the 15-km resolution meteorological
analysis and the analyses with 3 km and 500 m resolutions. The 15-km analysis could not reproduce
Fukushima’s mountainous topography in detail. Consequently, it failed to depict the complex wind
structure over mountains and valleys. This error in the wind field caused large differences in the
radionuclide transport and deposition simulation. In the real world, the 137Cs plume from FDNPP, after
crossing over the Abukuma Mountains, was apparently mostly blocked by Mt. Azuma and other
mountains along the Naka-dori Valley. However, the 15-km grid simulations could not represent this
blockage of the plume, which spread out unnaturally across the Naka-dori Valley. In contrast, the
3-km and 500-m simulations successfully reproduced the
137
Cs plume blockage along the Naka-dori
Valley, and the two simulations produced highly similar distributions of
137
Cs surface concentrations
and deposition. The behaviors simulated by the Eulerian and Lagrangian models were the same
qualitatively, but the two models yielded quantitatively different results even when they were driven
by the same meteorological analysis. More detailed information about these simulations is available in
Sekiyama et al. (2015).
148
TECHNICAL REPORTS OF THE METEOROLOGICAL RESEARCH INSTITUTE No.76 2015
Fig. G-4-4. Total deposition of Cs-137 accumulated from 00:00 UTC 15 March to 00:00 UTC 16 March 2011
simulated by the Eulerian model RAQM2 with (a) 15-km grid meteorological analysis, (b) 3-km grid
meteorological analysis, and (c) 500-m grid analysis. The same as simulated by the RAQM2, but simulated
by the Lagrangian model JMA-RATM with (d) 15-km grid analysis, (e) 3-km grid analysis, and (f) 500-m
grid analysis.
149
TECHNICAL REPORTS OF THE METEOROLOGICAL RESEARCH INSTITUTE No.76 2015
G-5. Emission source estimation by an inverse model 1
G-5-1. Introduction
Results of tracer transport simulations of radionuclides vary substantially depending on the source
term conditions. Although more than four years have passed since the accident at the Fukushima Daiichi Nuclear Power Plant (FDNPP), robust source term estimates have still not been obtained.
Chino et al. (2011) and Terada et al. (2012) used a reverse method in which they compared
radionuclide observational data with regional tracer transport model (SPEEDI) simulation results to
obtain emission time series of
the
137
Cs and
131
I. Chino et al. (2011) reported a preliminary estimate for
137
Cs total emission amount from the FDNPP from 11 March to 6 April 2011 of 13.0 PBq and
suggested that the maximum emissions occurred on 14 and 15 March. They also reported that large
emission events occurred on 21–22 and 30–31 March. The Japan Atomic Energy Agency (JAEA)
revised this estimate of the total release amount of 137Cs for the period from 11 March to 19 April to 8.8
PBq (Terada et al., 2012). An important limitation of these analyses was that only data from Japanese
land observation sites were used; therefore, they could not constrain radionuclide plumes transported
over the Pacific Ocean.
Stohl et al. (2012) carried out a Bayesian synthesis inversion in which the results of a tagged global
tracer transport model (FLEXPART) were used with observation data obtained mainly by the global
radionuclide monitoring network operated by the preparatory commission for the Comprehensive
Nuclear Test Ban Treaty Organization (CTBTO). They estimated the total 137Cs emission amount from
11 March to 20 April to be 36.6 PBq, which is larger than the estimate reported by Terada et al. (2012)
by a factor of 4. Their analysis included assessments of the radionuclide plumes that were transported
over the Pacific Ocean because they used observation data from a wide area of the Northern Hemisphere
and a global transport model. However, Stohl et al. (2012) used a Lagrangian transport model, which
simulated the transport, diffusion, and deposition of large numbers of tracer particles released at the
accident site. Although Lagrangian models are able to precisely calculate transport processes, they
cannot estimate diffusion processes, such as turbulent, cumulus, and planetary boundary layer diffusion,
or deposition processes (wet or dry) in detail, even though diffusion and deposition are the most
important processes affecting the long-range transport of aerosol tracers. As a result, diffusion and
deposition amounts might be affected.
In this section, we present a new estimate of the 137Cs source term obtained by a Bayesian synthesis
inversion method that coupled global observation network data with a global semi-Lagrangian aerosol
transport model.
G-5-2. Analysis Method
The analysis method used tagged simulation results from the global semi-Lagrangian aerosol model
MASINGAR (Tanaka and Chiba, 2005) with a TL319 horizontal resolution (approximately 60 km).
Tagged tracers (137Cs) from the lowest model layer (surface to 50 m) were released every 3 hours at a
1
T. Maki
150
TECHNICAL REPORTS OF THE METEOROLOGICAL RESEARCH INSTITUTE No.76 2015
rate of 1 Tg/h. It was assumed that the released
137
Cs was attached to hydrophilic aerosols with an
effective radius of 0.7 µm and was removed by dry and wet deposition. One of the merits of a tagged
tracer simulation is that once 137Cs source term emission time series are obtained, the 137Cs atmospheric
concentrations and depositions can be determined simply by calculating the linear combination of the
source term estimations and the tagged tracer simulation results, without re-calculation of the aerosol
model. As a result, we could construct a near-real-time prediction system by combining a properly
distributed observation network and the operational tagged tracer transport model system (an emission
prediction scenario is required when using such a system operationally). We used daily mean observation
data of 51 global sites (CTBTO, Hoffmann et al., 2000; RING OF FIVE, Masson et al., 2011; University
of California, Smith et al., 2014; Academia Sinica, Hsu et al., 2012; and Meteorological Research
Institute, Igarashi et al., 2009) (Fig,. G-5-1) and an analysis period of 40 days, from 11 March to 19
April. We tested two prior emission estimates. The first prior estimate was the JAEA posterior emission
(Terada et al., 2012). For the second, we used the Norwegian Institute for Air Research prior emission
(not posterior; Stohl et al., 2012) because our observational data were similar to theirs. The observational
error, which included the spatial representation error, was set to 20%. The prior flux uncertainty is treated
as a tuning parameter which shows the ratio between the observation and prior flux uncertainty, and
several sensitivity tests were conducted by changing the prior emission flux uncertainties from 10% to
5000%.
G-5-3. Results and discussion
We selected the source term estimate of Stohl et al. (2012) as our prior emission estimate by
comparing the mismatch between the observation data and the estimated concentrations. On the basis
of the sensitivity test results, we set the prior flux uncertainty to 100%. The total 137Cs emission amount
from the FDNPP for the period from 11 March to 19 April was 19.4 PBq, and the estimated uncertainty
was 3.0 PBq. In the present inverse analysis, the emission height level had only a small effect on the
estimated time series of the source term. The maximum 137Cs emission, which occurred on 15 March,
was larger than the prior estimate emission estimate. Our results suggest that emission events occurred
during 18–22 March and 28–30 March (Fig. G-5-2); however, the emission amount during 28–30 March
was smaller than the estimates of Chino et al. (2011) and Terada et al. (2012).
In our analysis, which used tagged tracer simulation results, global observation data, and an inverse
model, we obtained a total flux that was intermediate between the fluxes estimated by Stohl et al. (2012)
and Terada et al. (2012) and consistent with other analysis results (Table G-5-1). We evaluated the
atmospheric 137Cs concentrations and deposition amounts by combining our estimate of total flux with
the tagged simulation results.
However, to evaluate the results of our analysis several issues need to be addressed. One of the most
important is that we used only one model, and the bias of the model transport could directly affect the
estimated source term. For robust source term estimation, we should compile tagged model simulation
results obtained with multiple models using the same experimental settings and compare their estimated
151
TECHNICAL REPORTS OF THE METEOROLOGICAL RESEARCH INSTITUTE No.76 2015
source terms. Another issue is the relatively coarse horizontal resolution of the model. To obtain a finer
horizontal and temporal resolution, we should use a regional chemical transport model and collect hourly
observation data. In addition, the available observation data for the Pacific Ocean are insufficient;
therefore, to improve the analysis we should make use of marine deposition observation data.
Fig. G-5-1. Locations of the observation data collection sites used in this study. Red, green, and blue circles
show CTBTO, RING OF FIVE, and other observation sites, respectively.
Fig. G-5-2. Estimated time series of 137Cs emission from the FDNPP. The blue and orange lines show the
source term time series obtained by Terada et al. (2012) and Stohl et al. (2012), respectively. The thick red
and thick purple lines show the inversed posterior 137Cs emission time series obtained by using emissions
data of Terada and Stohl, respectively, as our prior emission estimate.
152
TECHNICAL REPORTS OF THE METEOROLOGICAL RESEARCH INSTITUTE No.76 2015
Table G-5-1. Recent 137Cs source term estimations for the FDNPP accident.
Author
This study
JAEA (Terada et al., 2012)
Stohl et al. (2012)
Winiarek et al. (2014)
MEXT (2011d) and Chino et
al. (2011)
MELCOR analysis (Gauntt et
al. (2001))
IRSN
(Institut
de
radioprotection et de sûreté
nucléaire)
ZAMG (Zentralanstalt für
Meteorologie
und
Geodynamik)
Total Flux
19.4 PBq (±3.0 PBq)
8.8 PBq
36.6 PBq (207–537)
10–15 PBq
14–17 PBq
16 PBq
Remarks
(11 March–19 April)
(10 March–19 April)
(10 March–20 April)
(11 March–26 March)
From obs. and numerical
model analysis
From Stohl et al. (2012)
30 PBq
From Stohl et al. (2012)
67 PBq
From Stohl et al. (2012)
153
TECHNICAL REPORTS OF THE METEOROLOGICAL RESEARCH INSTITUTE No.76 2015
G-6. Science Council of Japan atmospheric transport model intercomparison 1
G-6-1. Introduction
In this section, we describe the model intercomparison project of the Science Council of Japan (SCJ)
and the contributions of the Meteorological Research Institute (MRI) to the intercomparison. SCJ
launched a working group for model intercomparison under the Subcommittee of Investigation on the
Environmental Contamination Caused by the Nuclear Accident in the Sectional Committee on Nuclear
Accident, Committee on Comprehensive Synthetic Engineering, in July 2012. The objective of the SCJ
working group was to assess the uncertainties in the results of experiments simulating the transport of
radioactive materials from the Fukushima Daiichi Nuclear Power Plant accident by comparing existing
model results.
The chair of the working group, Prof. Teruyuki Nakajima of the University of Tokyo, invited
individuals from several research institutions and universities who had conducted research on the
transport of radionuclides to be members. In October 2012, the working group issued a call for
participation in the SCJ intercomparison, including to the World Meteorological Organization (WMO)
Task Team. The members of the Task Team discussed the matter and decided that the Task Team would
not participate as a whole team, but that the decision as to whether to participate would be left to
individual members. Following this decision, the Japan Meteorological Agency (JMA) chose to
participate; thus, JMA’s Task Team and researchers in MRI participated in the SCJ intercomparison.
G-6-2. Brief description of the model intercomparison
The SCJ model intercomparison consisted of four parts: regional atmospheric transport, global-scale
atmospheric transport, oceanic transport of radionuclides, and emission source estimation by inversion
methods. The contributing groups were asked to provide their best simulation results as of spring 2013.
Because the objective of the intercomparison was to evaluate the characteristics and accuracies of the
currently available simulated results, uniform conditions were not imposed. Therefore, there were large
differences in model setup (e.g., grid resolution and integration time interval) and the data
(meteorological field data and emission scenarios) used to constrain each simulation. However, this noconstraint policy made it difficult to investigate the causes of the differences in the simulation results.
In total, 9 regional atmospheric models, 6 global atmospheric models, and 11 oceanic models were
included in the SCJ model intercomparison. In this section, the contributions of JMA to the
intercomparison of regional and global-scale atmospheric transport models are presented. JMA also
contributed to the SCJ intercomparison by using an inverse model to estimate the emission flux by an
inversion method; these results are described in section G-5 of this technical report.
1
T.Y. Tanaka
154
TECHNICAL REPORTS OF THE METEOROLOGICAL RESEARCH INSTITUTE No.76 2015
G-6-3. Regional atmospheric transport model intercomparison
For the regional atmospheric transport intercomparison, nine contributing groups provided nine sets
of simulated results (Takigawa et al., 2013). The contributing groups were the Centre d’Enseignement
et de Recherche en Environnement Atmosphérique (Winiarek et al., 2014), the Central Research
Institute of Electric Power Industry (Hayami et al., 2012), the Institut de radioprotection et de sûreté
nucléaire (Korsakissok et al., 2013), the Japan Atomic Energy Agency (JAEA) (Terada et al., 2008), the
Japan Agency for Marine-Earth Science and Technology (JAMSTEC), JMA (Saito et al., 2014), MRI
(Kajino et al., 2012a, 2012b; Adachi et al., 2013; Sekiyama et al., 2015), the National Institute for
Environmental Studies (Morino et al., 2011, 2013), and Seoul National University (Park et al., 2013).
MRI contributed results obtained with the regional chemistry transport models NHM-Chem (Kajino
et al., 2012a, 2012b; Sekiyama et al., 2013, 2015) and JMA-RATM (Saito et al., 2014) to the
intercomparison of regional transport. Detailed descriptions of NHM-Chem and its results are given in
sections G-3 and G-4 of this technical report. The version of JMA-RATM used for the SCJ regional
atmospheric model intercomparison was slightly modified from the WMO Task Team version. The main
differences were (1) the radionuclide emission scenario was changed to “JAEA2” (Kobayashi et al.,
2013), (2) the time step of the integration was shortened to 5 minutes, and (3) snow and hail as well as
rain from the meso-analysis of accumulated precipitation were used. JMA-RATM and its results are
described in detail in section E of this technical report. The horizontal distribution of the
accumulated 137Cs deposition during March 2011 simulated by JMA-RATM is shown in Fig. G-6-1a.
The regional atmospheric model intercomparison results showed that the land area deposition was 27
± 10% of total emissions. However, MEXT aircraft observations on 31 May 2012 showed on-land
deposition to be 2.7 PBq (Torii et al., 2012). This observed value and the total emissions estimated by
inverse analysis (17.8 ± 8.9 PBq; section G-5) lead to a land area deposition of 18 ± 7% of total emissions,
but to a value of 20 ± 6% if a total emission of 14.6 ± 3.5 PBq, which is within two standard deviations
of the mean, is used. These differences in the land area deposition percentage are due to model
simulation errors, and errors in the total emission estimate and in the estimate of the land-deposited
amount from aircraft observations.
G-6-4. Global atmospheric transport model intercomparison
The intercomparison of global-scale transport models included 5 global transport models, 1 largescale regional transport model, and 12 simulated results. Four of the five global models, SPRINTARS
(Takemura et al., 2011), EMAC (Christoudias and Lelieveld, 2013), Model of Aerosol Species IN the
Global AtmospheRe (MASINGAR)-1 (Tanaka et al., 2003), and MASINGAR mk-2 (Tanaka et al.,
2012), are global aerosol models that are coupled online with general circulation models. The remaining
models are the TM5 global transport model (Huijnen et al., 2010) and the MRI Passive-tracers Model
for radionuclides (MRI-PM/r) regional transport model (Kajino et al., 2012a, 2012b; Adachi et al., 2013),
which are off-line models that use assimilated meteorological fields or meteorological fields previously
calculated by another model. All of the participating models in the SCJ intercomparison were grid point
155
TECHNICAL REPORTS OF THE METEOROLOGICAL RESEARCH INSTITUTE No.76 2015
Eulerian or semi-Lagrangian advection models.
MRI contributed three models to the global atmospheric transport model intercomparison:
MASINGAR-1 (Tanaka et al., 2003), MASINGAR mk-2 (Tanaka et al., 2012) and MRI-PM/r. The
simulated results of two versions of MASINGAR were submitted for the intercomparison.
MASINGAR-1 was coupled with an atmospheric general circulation model (AGCM) called MRI/JMA
98, which has been used as JMA’s operational dust forecasting model since January 2004 (Tanaka et al.,
2003). The model resolutions were set to a T106 Gaussian horizontal grid (approximately 1.125° ×
1.125°) and 30 vertical layers from the surface to a height of 0.4 hPa. A newer version of this aerosol
model, called MASINGAR mk-2, was coupled with an AGCM called MRI-AGCM3, which is a
component of MRI’s earth system model MRI-ESM1 (Yukimoto et al., 2011, 2012). MASINGAR mk2 was also used as the global aerosol model for the CMIP5 climate change experiment. For the
intercomparison, the model resolutions were set to a TL319 horizontal grid (approximately 0.5625° ×
0.5625°) and 40 vertical layers from the ground surface to a height of 0.4 hPa. In this intercomparison
experiment, the horizontal wind fields were assimilated from six-hourly 1.25° ×1.25° JMA Climate Data
Assimilation System (JCDAS) global reanalysis data (Onogi et al., 2007) using a Newtonian relaxation
nudging technique. The JCDAS reanalysis was also used for sea-surface temperature data. The
released
137
Cs was assumed to be readily attached to ambient aerosols with a unimodal lognormal
distribution (mode radius, 0.07 μm; dispersion, 2.0) (Tanaka et al., 2012). For the intercomparison,
the 137Cs results simulated with the source terms of JAEA (Terada et al. 2012) and Stohl et al. (2012)
were submitted. For the 133Xe experiment, the inversely estimated source term of Stohl et al. (2012) was
used.
MRI-PM/r is a large-scale regional off-line chemistry transport model. The regional domain used was
107°E–252°E and 3°N–61°N with 234 × 120 grids (Mercator map projection), which corresponded to a
horizontal resolution of approximately 60 km × 60 km. The vertical coordinates were terrain-following
with 13 vertical layers up to 10 hPa. The Advanced Research Weather Research and Forecasting model
(WRF; Skamarock et al., 2008) was used to simulate the meteorological field. The U.S. National Centers
for Environmental Prediction six-hourly, 1° × 1° final operational global analysis dataset ds083.2
(http://rda.ucar.edu/datasets/ds083.2/) was used for the initial and boundary conditions of WRF and also
for the analysis nudging method. The aerosol module used a category approach to represent the
interaction between radionuclides and environmental species (Kajino and Kondo, 2011). The aerosol
particles were grouped into six categories: primary hot particles (PRI), Aitken mode (ATK),
accumulation mode (ACM), dust particles (DU), sea-salt particles (SS), and pollen (POL). The aerosol
chemical and dynamical processes, such as nucleation, condensation, coagulation and deposition, were
calculated by a modal moment dynamics approach (Kajino and Kondo, 2011; Kajino, 2011; Kajino et
al. 2012a, 2012b). The emission inventory of environmental species with anthropogenic, biogenic, and
biomass burning origins was the same as that used by Kajino and Kondo (2011). Five percent of the Cs
was assumed to form radioactive primary particles (PRI), and the remaining 95% was assumed to
condense onto pre-existing particles of the other five types with the mass fluxes proportional to the
156
TECHNICAL REPORTS OF THE METEOROLOGICAL RESEARCH INSTITUTE No.76 2015
surface area concentrations of each aerosol category. A revised version of the JAEA inventory (Terada
et al., 2012) was used for the emissions of 134Cs and 137Cs.
The simulated horizontal distributions of the accumulated 137Cs deposition through the end of March
2011 obtained with the MRI global-scale models are shown in Fig. G-6-1b–f. All of the simulated results
show the 137Cs deposited over a wide area of the Northern Hemisphere, with the highest concentrations
in the Northwest Pacific region. The global-scale model intercomparison results indicate that the global
wet deposition accounted for 93 ± 5% of the total 137Cs deposition. The JMA-RATM results (Fig. G-61a), however, showed that 46% of 137Cs was removed by wet deposition in the simulation region, and
the regional atmospheric model intercomparison results showed that 68 ± 20% of 137Cs was removed by
wet deposition over the simulation regions. The cause of these differences between the global and
regional simulations was mainly the different simulation regions, because dry deposition was dominant
in the vicinity of the power plant where concentrations of
137
Cs were high. However, another non-
negligible cause was differences among the models in the treatment of dry and wet deposition and in the
meteorological fields used.
G-6-5. Summary
The SCJ intercomparison of regional and global atmospheric transport model simulation results
showed that the models were capable of depicting the main features of the observed radioactive material
distributions. Quantitative comparisons of the simulation results, however, revealed large uncertainties,
especially in the amount of wet deposition. The skill of the models depends on the performance of the
dynamic frameworks, chemical transportation processes, dry and wet deposition processes and other
elements. Therefore, the models can be significantly improved through collaboration among the
different modeling communities. The full report of the SCJ model intercomparison project was
published by the Sectional Committee on Nuclear Accident, Committee on Comprehensive Synthetic
Engineering, of SCJ on 2 September 2014 (SCJ, 2014).
157
TECHNICAL REPORTS OF THE METEOROLOGICAL RESEARCH INSTITUTE No.76 2015
Fig. G-6-1. Horizontal distributions of the accumulated 137Cs deposition from 11 to 31 March 2011
by (a) JMA-RATM, (b) NHM-Chem, (c) MASINGAR-1 using the JAEA source term, (d)
MASINGAR-1 using the Stohl et al. (2012) source term, (e) MASINGAR mk-2 using the JAEA
source term, and (f) MASINGAR mk-2 using the Stohl et al. (2012) source term. Units are Bq m–
2
.
158
TECHNICAL REPORTS OF THE METEOROLOGICAL RESEARCH INSTITUTE No.76 2015
H. References
Adachi, K., M. Kajino, Y. Zaizen, and Y. Igarashi, 2013: Emission of spherical cesium-bearing
particles from an early stage of the Fukushima nuclear accident. Nature Scientific Reports, 3,
2554, doi:10.1038/srep02554.
Araki, K., 2000: Six-hour forecasts of precipitation. Reports of the Numerical Prediction Division, 47,
36–41. (in Japanese)
Arnold, D., C. Maurer, G. Wotawa, R. Draxler, K. Saito, and P. Seibert, 2015: Influence of the
meteorological input on the atmospheric transport modelling with FLEXPART of radionuclides
from the Fukushima Daiichi nuclear accident. J. Environ. Radioact., 139, 212–225.
Becker, A., G. Wotawa, L-E De Geer, P. Seibert, R. Draxler, C. Sloan, R. D’Amours, M. Hort, H.
Glaab, P. Heinrich, Y. Grillon, V. Shershakov, K. Katayama, Y. Zhang, P. Stewart, M. Hirtl, M.
Jane, and P. Chen, 2007: Global backtracking of anthropogenic radionuclides by means of a
receptor oriented ensemble dispersion modelling system in support of Nuclear-Test-Ban Treaty
verification. Atmos. Environ., 41, 4520–4534.
Bedwell, P., J. Wellings, S. M. Haywood, A. R. Jones, and M. C. Hort, 2011: Cloud gamma modelling
in the UK Met Office’s NAME III model. AGU Chapman Conference.
Blackadar, A. K., 1962: The vertical distribution of wind and turbulent exchange in a neutral
atmosphere. J. Geophys. Res., 67, 3095–3102.
Browning, K. A., and F. F. Hill, 1981: Orographic Rain. Weather, 35, 326–329.
Burgin, L. E., J. Gloster, C. Sanders, P. S. Mellor, S. Gubbins, and S. Carpenter, 2012: Investigating
incursions of bluetongue virus using a model of long-distance culicoides biting midge dispersal.
Transboundary and Emerging Diseases, doi:10.1111/j.1865-1682.2012.01345.x.
Chino, M., H. Nakayama, H. Nagai, H. Terada, G. Katata, and H. Yamazawa, 2011: Preliminary
estimation of release amounts of
131
I and
137
Cs accidentally discharged from the Fukushima
Daiichi Nuclear Power Plant into the atmosphere. J. Nucl. Sci. Technol., 48, 1129–1134.
Christoudias, T., and J. Lelieveld, 2013: Modelling the global atmospheric transport and deposition of
radionuclides from the Fukushima Dai-ichi nuclear accident. Atmos. Chem. Phys., 13,
1425–1438.
Clark, M. J., and F. B. Smith, 1988: Wet and dry deposition of Chernobyl releases. Nature, 332,
245–249.
Courtier, P., J.-N. Thépaut, and A. Hollingsworth, 1994: A strategy for operational implementation of
4D-Var, using an incremental approach. Q. J. Roy. Met. Soc., 120. 1367–1387.
D’Amours, R., and A. Malo, 2004: A zeroth order Lagrangian particle dispersion model MLDP0.
Internal publication, Canadian Meteorological Centre, Environmental Emergency Response
Section,
Dorval,
QC,
Canada,
19
pp.
(available
online
at http://eer.cmc.ec.gc.ca/publications/DAmours.Malo.2004.CMC-EER.MLDP0.pdf)
D'Amours, R., A. Malo, R. Servranckx, D. Bensimon, S. Trudel, and J.-P. Gauthier, 2010: Application
of the atmospheric Lagrangian particle dispersion model MLDP0 to the 2008 eruptions of Okmok
159
TECHNICAL REPORTS OF THE METEOROLOGICAL RESEARCH INSTITUTE No.76 2015
and Kasatochi volcanoes. J. Geophys. Res., 115, D00L11, 11 pp, doi:10.1029/2009JD013602.
Delage, Y., 1997: Parameterising sub-grid scale vertical transport in atmospheric models under
statically stable conditions. Bound.-Layer Meteor., 82, 23–48.
Draxler, R. R., 1999: HYSPLIT_4 User's Guide. NOAA Tech. Memo, ERL ARL-230, Air Resources
Laboratory,
Silver
Spring,
MD,
35
pp.
(available
online
at
http://www.arl.noaa.gov/documents/reports/hysplit_user_guide.pdf)
Draxler, R. R., 2006: The Use of global and mesoscale meteorological model data to predict the
transport and dispersion of tracer plumes over Washington, D.C. Wea. Forecasting, 21, 383–394.
Draxler, R., and J. L. Heffter, 1981: Workbook for estimating the climatology of regional-continental
scale atmospheric dispersion over the United States. NOAA Tech. Memo. ERL ARL-96. NOAA,
Air Resour. Lab. Silver Spring, Md.
Draxler, R. R., and G. D. Hess, 1997: Description of the HYSPLIT_4 modeling system. NOAA Tech.
Memo. ERL ARL-224, Air Resources Laboratory, Silver Spring, MD, 24 pp., NTIS PB98-116593.
Draxler, R. R., and G. D. Hess, 1998: An overview of the HYSPLIT_4 modelling system for
trajectories, dispersion, and deposition. Aust. Meteor. Mag., 47, 295–308.
Draxler, R. R., and G. D. Rolph, 2012: Evaluation of the Transfer Coefficient Matrix (TCM) approach
to model the atmospheric radionuclide air concentrations from Fukushima. J. Geophys. Res., 117,
10 pp, doi:10.1029/2011JD017205.
Draxler, R., D. Arnold, S. Galmarini, M. Hort, A. Jones, S. Leadbetter, A. Malo, C. Maurer, G. Rolph,
K. Saito, R. Servranckx, T. Shimbori, E. Solazzo, and G. Wotawa, 2013a: Evaluation of
meteorological analyses for the radionuclide dispersion and deposition from the Fukushima
Daiichi Nuclear Power Plant accident. WMO Technical Publication, 1120, 64 pp. (available
online at https://www.wmo.int/e-catalog/detail_en.php?PUB_ID=669)
Draxler, R., P. Chen, M. Hort, A. Malo, K. Saito, and G. Wotawa, 2013b: World Meteorological
Organization's evaluation of the radionuclide dispersion and deposition from the Fukushima
Daiichi Nuclear Power Plant accident. Proceeding, Special Symposium on the Transport and
Diffusion of Contaminants from the Fukushima Dai-Ichi Nuclear Power Plant. (available online
at https://ams.confex.com/ams/93Annual/webprogram/Paper215372.html)
Draxler, R., D. Arnold, M. Chino, S. Galmarini, M. Hort, A. Jones , S. Leadbetter, A. Malo, C. Maurer,
G. Rolph, K. Saito, R. Servranckx, T. Shimbori, E. Solazzo, and G. Wotawa, 2015: World
Meteorological Organization’s model simulations of the radionuclide dispersion and deposition
from the Fukushima Daiichi Nuclear Power Plant accident. J. Environ. Radioact., 139, 172–184.
Fischer, B., 2012: Radionuclide emissions for the Fukushima Daiichi accident prepared for the
UNSCEAR assessment. (private communication)
Fukushima
Prefecture,
2011a:
http://www.pref.fukushima.lg.jp/sec_file/monitoring/m-3/20-50km0312-0331.pdf (in Japanese)
Fukushima
Prefecture,
2011b:
http://www.pref.fukushima.lg.jp/sec_file/monitoring/m-1/7houbu0311-0331.pdf (in Japanese)
160
TECHNICAL REPORTS OF THE METEOROLOGICAL RESEARCH INSTITUTE No.76 2015
Furuta, S., S. Sumiya, H. Watanabe, M. Nakano, K. Imaizumi, M. Takeyasu, A. Nakada, H. Fujita, T.
Mizutani, M. Morisawa, Y. Kokubun, T. Kono, M. Nagaoka, H. Yokoyma, T. Hokama, T.
Isozaki, M. Nemota, Y. Hiyama, T. Onuma, C. Kato, and T. Kurachi, 2011: Results of the
Environmental Radiation Monitoring Following the Accident at the Fukushima Daiichi Nuclear
Power Plant - Interim Report (Ambient Radiation Dose Rate, Radioactivity Concentration in the
Air and Radioactivity Concentration in the Fallout), Radiation Protection Department, Nuclear
Fuel Cycle Engineering Laboratories, Tokai Research and Development Center, Japan Atomic
Energy Agency Tokai-mura, Naka-gun, Ibaraki-ken, JAEA-Review 2011-035, August, 89 pp. (in
Japanese,
available
online
at
http://jolissrch-inter.tokai-sc.jaea.go.jp/search/servlet/search?5031728)
Gauntt, R. O., R. K. Cole, C. M. Erickson, R. G. Gido, R. D. Gasser, S. B. Rodriguez, M. F. Young, S.
Ashbaugh, M. Leonard, and A. Hill, 2001: MELCOR Computer Code Manuals, Vol. 3:
Demonstration
Problems,
Version
1.8.5
May
2001,
Sandia
National
Laboratories,
SAND2001-0929P, Albuquerque, USA.
Gifford, F. A., 1982: Horizontal diffusion in the atmosphere: A Lagrangian-dynamical theory. Atmos.
Environ., 16, 505–512.
Gifford, F. A., 1984: The random force theory: Application to meso and large-scale atmospheric
diffusion. Bound.-Layer Meteor., 30, 159–174.
Hayami, H., A. Sato, M. Tsuzaki, and H. Shimadera, 2012: Atmospheric transport and deposition
modeling of radioactive materials released from the Fukushima Daiichi nuclear power plant.
CRIEPI report, V11054. (in Japanese)
Hertel, O., J. Christensen, E. H. Runge, W. A. H. Asman, R. Berkowicz, and M. F. Hovmand, 1995:
Development and testing of a new variable scale air pollution model—ACDEP. Atmos. Environ.,
29, 1267–1290.
Hoffmann, W., R. Kebeasy, and P. Firbas, 2000: Introduction to the verification regime of the
Comprehensive 5 Nuclear-Test-Ban Treaty. Phys. Earth Planet. Inter., 113, 5–9.
Holtslag, A. A. M., and B. A. Boville, 1993: Local versus nonlocal boundary-layer diffusion in a
global climate model. J. Climate, 6, 1825–1842.
Honda, Y., and K. Sawada, 2008: A new 4D-Var for mesoscale analysis at the Japan Meteorological
Agency. CAS/JSC WGNE Res. Act. Atmos. Ocea. Model., 38, 01.07–01.08.
Honda, Y., and K. Sawada, 2009: Upgrade of the operational mesoscale 4D-Var system at the Japan
Meteorological Agency. CAS/JSC WGNE Res. Act. Atmos. Ocea. Model., 39, 01.11–01.12.
Honda, Y., M. Nishijima, K. Koizumi, Y. Ohta, K. Tamiya, T. Kawabata, and T. Tsuyuki, 2005: A
pre-operational variational data assimilation system for a non-hydrostatic model at the Japan
Meteorological Agency: Formulation and preliminary results. Q. J. Roy. Meteorol. Soc., 131,
3465–3475.
Hsu, S.-C., C.-A. Huh, C.-Y. Chan, S.-H. Lin, F.-J. Lin, and S. C. Liu, 2012: Hemispheric dispersion
of radioactive plume laced with fission nuclides from the Fukushima nuclear event. Geophys. Res.
161
TECHNICAL REPORTS OF THE METEOROLOGICAL RESEARCH INSTITUTE No.76 2015
Lett., 39, L00G22, doi:10.1029/2011GL049986.
Hu, X., D. Li, H. Huang, S. Shen, and E. Bou-Zeid, 2014: Modeling and sensitivity analysis of
transport and deposition of radionuclides from the Fukushima Daiichi accident. Atmos. Chem. Phys.
Discuss., 14, 2113–2173.
Huijnen, V., J. Williams, M. van Weele, T. van Noije, M. Krol, F. Dentener, A. Segers, S. Houweling,
W. Peters, J. de Laat, F. Boersma, P. Bergamaschi, P. van Velthoven, P. Le Sager, H. Eskes, F.
Alkemade, R. Scheele, P. Nédélec, and H.-W. Pätz, 2010: The global chemistry transport model
TM5: description and evaluation of the tropospheric chemistry version 3.0. Geosci. Model Dev., 3,
445–473.
Hunt, B. R., E. J. Kostelich, and I. Szunyogh, 2007: Efficient data assimilation for spatiotemporal
chaos: A local ensemble transform Kalman filter. Physica D, 230, 112–126.
Igarashi, Y., Y. Inomata, M. Aoyama, K. Hirose, H. Takahashi, Y. Shinoda, N. Sugimoto, A. Shimizu,
and M. Chiba, 2009: Plausible change in Asian dust source suggested by atmospheric
anthropogenic radionuclides-observation of single wet deposition events during spring of 2007.
Atmos. Environ, 43, 2971–2980.
Ikuta, Y., and Y. Honda, 2011: Development of 1D+4DVAR data assimilation of radar reflectivity in
JNoVA. CAS/JSC WGNE Res. Activ. Atmos. Ocea. Model., 41, 01.09–01.10.
Ishikawa, Y., 2010: Data assimilation of GPS precipitable water vapor into the JMA mesoscale
numerical weather prediction model. CAS/JSC WGNE Res. Act. Atmos. Ocea. Model., 40, 01.13–
01.14.
Iwasaki, T., 2013: What happened from the accidental release of radioactive materials from the
Fukushima Dai-Ichi Nuclear Power Plant on 3.11 in 2011? Extended abstract, Special
Symposium on the Transport and Diffusion of Contaminants from the Fukushima Dai-Ichi
Nuclear Power Plant, 4 pp. AMS annual meeting on 5th of January at Austin. (available online at
https://ams.confex.com/ams/93Annual/webprogram/Manuscript/Paper220977/AMS-Extended%2
0Abstract.Iwasaki.2013.pdf)
Iwasaki, T., T. Maki, and K. Katayama, 1998: Tracer transport model at Japan Meteorological Agency
and its application to the ETEX data. Atmos. Environ., 32, 4285–4295.
JCAC, 2011: http://www.jcac.or.jp/site/senryo/taiki-kouka-back-list.html (in Japanese)
JMA, 2013: Outline of the operational numerical weather prediction at the Japan Meteorological
Agency
(March
2013),
188
pp.
(available
online
at
http://www.jma.go.jp/jma/jma-eng/jma-center/nwp/outline2013-nwp/pdf/outline2013_all.pdf)
JMA, 2014: Specifications of the JMA's NWP models and Ensemble Prediction Systems. (available
online at http://www.jma.go.jp/jma/jma-eng/jma-center/nwp/specifications_models.pdf)
Jones, A. R., D. J. Thomson, M. C. Hort, and B. Devenish, 2007: The U.K. Met Office’s
next-generation atmospheric dispersion model, NAME III. In C. Borrego and A.-L. Norman,
editors, Air Pollution and its Applications XVII. Proceedings of the 27th NATO/CCMS
International Technical Meeting on Air Pollution Modelling and its Application, Springer,
162
TECHNICAL REPORTS OF THE METEOROLOGICAL RESEARCH INSTITUTE No.76 2015
580–589.
Kajino, M., 2011: MADMS: Modal Aerosol Dynamics model for multiple Modes and fractal Shapes
in the free-molecular and near-continuum regimes. J. Aerosol Sci., 42, 224–248.
Kajino, M., and Y. Kondo, 2011: EMTACS: Development and regional-scale simulation of a size,
chemical, mixing type, and soot shape resolved atmospheric particle model. J. Geophys. Res., 116,
D02303, 28 pp, doi:10.1029/2010JD015030.
Kajino, M., M. Deushi, T. Maki, N. Oshima, Y. Inomata, K. Sato, T. Ohizumi, and H. Ueda, 2012a:
Modeling wet deposition and concentration of inorganics over Northeast Asia with MRI-PM/c.
Geosci. Model Dev., 5, 1363–1375.
Kajino. M, Y. Inomata, K. Sato, H. Ueda, Z. Han, J. An, G. Katata, M. Deushi, T. Maki, N. Oshima, J.
Kurokawa, T. Ohara, A. Takami, and S. Hatakeyama, 2012b: Development of the RAQM2
aerosol chemical transport model and predictions of the Northeast Asian aerosol mass, size,
chemistry, and mixing type. Atmos. Chem. Phys., 12, 11833–11856.
Kaneyasu, N., H. Ohashi, F. Suzuki, T. Okada, and F. Ikemori, 2012: Sulfate aerosol as a potential
transport medium of radiocesium from the Fukushima nuclear accident. Environ. Sci. Technol.,
46, 5720–5726.
Katata, G., M. Ota, H. Terada, M. Chino, and H. Nagai, 2012a. Atmospheric discharge and dispersion
of radionuclides during the Fukushima Dai-ichi Nuclear Power Plant accident. Part I: source term
estimation and local-scale atmospheric dispersion in early phase of the accident. J. Environ.
Radioact. 109, 103–113.
Katata, G., H. Terada, H. Nagai, and M. Chino, 2012b: Numerical reconstruction of high dose rate
zones due to the Fukushima Daiichi Nuclear Power Plant accident. J. Environ. Radioact., 111,
2–12.
Katata, G., M. Chino, T. Kobayashi, H. Terada, M. Ota, H. Nagai, M. Kajino, R. Draxler, M. C. Hort,
A. Malo, T. Torii, and Y. Sanada, 2015: Detailed source term estimation of the atmospheric
release for the Fukushima Daiichi Nuclear Power Station accident by coupling simulations of
atmospheric dispersion model with improved deposition scheme and oceanic dispersion model.
Atmos. Chem Phys., 15, 1029–1070.
Kawai, H., 2002: Forecast of sulfur dioxide flow from Miyake volcano with a high resolution regional
transport model. CAS/JSC WGNE Res. Act. Atmos. Ocea. Model., 32, 05.24–05.25.
Kitada, T., 1994: Modelling of transport, reaction and deposition of acid rain. Kishou Kenkyu Note,
182, 95–117. (in Japanese)
Kitada, T., G. R. Carmichael, and L. K. Peters 1986: Effects of dry deposition on the concentrationdistribution of atmospheric pollutants within land- and sea-breeze circulations. Atmos. Environ.,
20, 1999–2010.
Kobayashi T., H. Nagai, M. Chino, and H. Kawamura, 2013: Source term estimation of atmospheric
release due to the Fukushima Dai-ichi Nuclear Power Plant accident by atmospheric and oceanic
dispersion simulations. J. Nucl. Sci. Technol,, 50, 255–264.
163
TECHNICAL REPORTS OF THE METEOROLOGICAL RESEARCH INSTITUTE No.76 2015
Kondo, H., T. Satomura, T. Takemura, H. Yamazawa, and A. Watanabe, 2012: A report of the special
topic session “Current status and issues of numerical models for the transport of radioactive
substances” at the 2011 Autumn Meeting. Tenki, 59, 239–250. (in Japanese)
Kondo, H., T. Yamada, M. Chino, T. Iwasaki, G. Katata, T. Maki, K. Saito, H. Terada, and H. Tsuruta,
2013: Report of the Special Symposium on the Transport and Diffusion of Contaminants from the
Fukushima Dai-Ichi Nuclear Power Plant: Present Status and Future Directions. Tenki, 60,
723–729. (in Japanese)
Korsakissok, I., A. Mathieu, and D. Didier, 2013: Atmospheric dispersion and ground deposition
induced by the Fukushima Nuclear Power Plant accident: a local-scale simulation and sensitivity
study. Atmos. Environ., 70, 267–279.
Kunii, M., 2013: Mesoscale data assimilation for a local severe rainfall event with the NHM-LETKF
system. Wea. Forecasting, 29, 1093–1105.
Leadbetter, S, M. Hort, A, Jones, H. Webster, and R. Draxler, 2015: Sensitivity of the deposition of
Caesium-137 from Fukushima Dai-ichi nuclear power plant on the wet deposition
parameterisation in NAME. J. Environ. Radioact., 139, 200–211.
Lim, K.-S. S., and S.-Y. Hong, 2010: Development of an effective double-moment cloud microphysics
scheme with prognostic cloud condensation nuclei (CCN) for weather and climate models. Mon.
Wea. Rev., 138, 1587–1612.
Louis, J. F., M. Tiedtke, and J. F. Geleyn, 1982: A short history of the operational PBL
parameterization at ECMWF. Workshop on planetary boundary layer parameterization. ECMWF,
59–79.
Makihara, Y., 2000: Algorithms for precipitation nowcasting focused on detailed analysis using radar
and raingauge data, Study on the Objective Forecasting Techniques. Tech. Rep. MRI, 39, 63–111.
Maryon, R. H., D. B. Ryall, and A. L. Malcolm, 1999: The NAME 4 dispersion model: Science
documentation. Technical report, UK Meteorological Office. Turbulence Diffusion Note, 262.
Masson, O., A. Baeza, J. Bieringer, K. Brudecki, S. Bucci, M. Cappai, F. P. Carvalho, O. Connan, C.
Cosma, A. Dalheimer, D. Didier, G. Depuydt, L. E. De Geer, A. De Vismes, L. Gini, F. Groppi,
K. Gudnason, R. Gurriaran, D. Hainz, Ó. Halldórsson, D. Hammond, O. Hanley, K. Holeý, Zs.
Homoki, A. Ioannidou, K. Isajenko, M. Jankovic, C. Katzlberger, M. Kettunen, R. Kierepko, R.
Kontro, P. J. M. Kwakman, M. Lecomte, L. Leon Vintro, A.-P. Leppänen, B. Lind, G. Lujaniene,
P. Mc Ginnity, C. Mc Mahon, H. Malá, S. Manenti, M. Manolopoulou, A. Mattila, A. Mauring, J.
W. Mietelski, B. Møller, S. P. Nielsen, J. Nikolic, R. M. W. Overwater, S. E. Pálsson, C.
Papastefanou, I. Penev, M. K. Pham, P. P. Povinec, H. Ramebäck, M. C. Reis, W. Ringer, A.
Rodriguez, P. Rulík, P. R. J. Saey, V. Samsonov, C. Schlosser, G. Sgorbati, B. V. Silobritiene, C.
Söderström, R. Sogni, L. Solier, M. Sonck, G. Steinhauser, T. Steinkopff, P. Steinmann, S.
Stoulos, I. Sýkora, D. Todorovic, N. Tooloutalaie, L. Tositti, J. Tschiersch, A. Ugron, E. Vagena,
A. Vargas, H. Wershofen, and O. Zhukova, 2011: Tracking of airborne radionuclides from the
damaged Fukushima Dai-Ichi nuclear reactors by European networks. Environ. Sci. Technol., 45,
164
TECHNICAL REPORTS OF THE METEOROLOGICAL RESEARCH INSTITUTE No.76 2015
7670–7677.
Mellor, G. L., and T. Yamada, 1974: A hierarchy of turbulence closure models for planetary boundary
layers. J. Atmos. Sci., 31, 1791–1806.
Mellor, G. L., and T. Yamada, 1982: Development of a turbulence closure model for geophysical fluid
problems. Rev. Geophys. Space Phys., 20, 851–875.
METI, 2011: http://www.meti.go.jp/press/2011/06/20110603019/20110603019.html (in Japanese)
MEXT, 2007: SPEEDI System for Prediction of Environmental Emergency Dose Information,
Pamphlet of SPEEDI.
MEXT, 2011a: Monitoring information of environmental radioactivity level, Readings of dust
sampling, http://radioactivity.nsr.go.jp/en/list/200/list-1.html
MEXT, 2011b: Monitoring information of environmental radioactivity level, Readings of
Environmental
Radiation
Level
by
emergency
monitoring,
http://radioactivity.nsr.go.jp/en//list/207/list-1.html
MEXT, 2011c: Results of analyses of radionuclides (Cs-134 and Cs-137) in soil. (Retrieved from
http://www.mext.go.jp/b_menu/shingi/chousa/gijyutu/017/shiryo/__icsFiles/afieldfile/2011/09/02
/1310688_1.pdf)
MEXT, 2011d: Results of airborne monitoring by the Ministry of Education, Culture, Sports. Science
and Technology and the U.S. Department of Energy. Available online at
http://radioactivity.nsr.go.jp/ja/contents/4000/3710/24/1305820_20110506.pdf,
http://radioactivity.nsr.go.jp/ja/contents/5000/4858/24/1305819_0708.pdf,
http://radioactivity.nsr.go.jp/ja/contents/5000/4901/24/1910_1216.pdf
Morino, Y., T. Ohara, and M. Nishizawa, 2011: Atmospheric behavior, deposition, and budget of
radioactive materials from the Fukushima Daiichi nuclear power plant in March 2011. Geophys.
Res. Lett., 38, doi:10.1029/2011GL048689.
Morino, Y., T. Ohara, M. Watanabe, S. Hayashi, and M. Nishizawa, 2013: Episode analysis of
deposition of radiocesium form the Fukushima Daiichi Nuclear Power Plant accident. Environ.
Sci. Technol., 47, 2314–2322.
Morrison, H., G. Thompson, and V. Tatarskii, 2009: Impact of cloud microphysics on the
development of trailing stratiform precipitation in a simulated squall line: compassion of one- and
two-moment schemes. Mon. Wea. Rev., 137, 991–1007.
Nagai, H., M. Chino, and H. Yamazawa, 1999: Development of scheme for predicting atmospheric
dispersion of radionuclides during nuclear emergency by using atmospheric dynamic model. J. At.
Energy. Soc. Japan, 41, 777–785. (in Japanese with English abstract)
Nagata, K., 2011: Quantitative precipitation estimation and quantitative precipitation forecasting by
the Japan Meteorological Agency. RSMC Tokyo – Typhoon Center Technical Review, 13, 37–50.
(available
online
at
http://www.jma.go.jp/jma/jma-eng/jma-center/rsmc-hp-pub-eg/techrev/text13-2.pdf)
NSC, 2010: The guideline for environmental radiation monitoring. (in Japanese, available online at
165
TECHNICAL REPORTS OF THE METEOROLOGICAL RESEARCH INSTITUTE No.76 2015
http://www.bousai.ne.jp/vis/shiryou/pdf/kankyou_monitor_h2204.pdf)
O’Brien, J. J., 1970: A note on the vertical structure of the eddy exchange coefficient in the planetary
boundary layer. J. Atmos. Sci., 27, 1213–1215.
Onogi, K., J. Tsutsui, H. Koide, M. Sakamoto, S. Kobayashi, H. Hatsushika, T. Matsumoto, N.
Yamazaki, H. Kamahori, K. Takahashi, S. Kadokura, K. Wada, K. Kato, R. Oyama, T. Ose, N.
Mannoji, and R. Taira, 2007: The JRA-25 Reanalysis. J. Meteor. Soc. Japan, 85, 369–432.
Park, S.-U., A. Choe, and M.-S. Park, 2013: Atmospheric dispersion and deposition of radionuclides
(137Cs and
131
I) released from the Fukushima Dai-ichi Nuclear Power Plant. Comput. Water,
Energy, Environ. Eng., 2, 61–68.
Pudykiewicz, J., 1989: Simulation of the Chernobyl dispersion with a 3-D hemispheric tracer model.
Tellus B, 41, 391–412.
Ryall, D. B., and R. H. Maryon, 1998: Validation of the UK Met. Office’s name model against the
ETEX dataset. Atmos. Environ. 32, 4265–4276.
Saito, K., 2012: The Japan Meteorological Agency nonhydrostatic model and its applications to
operation and research. Atmospheric Model Applications, 85–110, doi:10.5772/35368.
Saito, K., T. Fujita, Y. Yamada, J. Ishida, Y. Kumagai, K. Aranami, S. Ohmori, R. Nagasawa, S.
Kumagai, C. Muroi, T. Kato, H. Eito, and Y. Yamazaki, 2006: The operational JMA
nonhydrostatic mesoscale model. Mon. Wea. Rev., 134, 1266–1298.
Saito, K., J. Ishida, K. Aranami, T. Hara, T. Segawa, M. Narita, and Y. Honda, 2007: Nonhydrostatic
atmospheric models and operational development at JMA. J. Meteor. Soc. Japan, 85B, 271–304.
Saito, K., T. Shimbori, and R. Draxler, 2013: JMA’s regional ATM calculations for the WMO
technical Task Team on meteorological analyses for Fukushima Daiichi Nuclear Power Plant
accident. Extended abstract, Special Symposium on the Transport and Diffusion of Contaminants
from the
Fukushima
Dai-Ichi
Nuclear
Power
Plant,
5
pp.
(available
online
at
https://ams.confex.com/ams/93Annual/webprogram/Manuscript/Paper219086/AMS_ExtAbs_JM
ARATM.pdf)
Saito, K., T. Shimbori, T. Hara, E. Toyoda, T. Kato, T. Fujita, K. Nagata, and Y. Honda, 2014: The
WMO Technical Task Team on meteorological analyses for Fukushima Daiichi Nuclear Power
Plant accident. Sokko-jiho (Japanese bulletin on operations at JMA), 81, 1–30. (in Japanese,
available online at http://www.jma.go.jp/jma//kishou/books/sokkou/81/vol81p001.pdf)
Saito, K, T. Shimbori, and R. Draxler, 2015: JMA's regional atmospheric transport model calculations
for the WMO technical task team on meteorological analyses for Fukushima Daiichi Nuclear
Power Plant accident. J. Environ. Radioact., 139, 185–199.
Sakamoto, M., 2013: Atmospheric Transport Model. Outline of the Operational Numerical Weather
Prediction
at
the
Japan
Meteorological
Agency,
95–98.
(available
online
at
http://www.jma.go.jp/jma/jma-eng/jma-center/nwp/outline2013-nwp/pdf/outline2013_03.pdf)
Schöppner, M., W. Plastino, P. P. Povinec, G. Wotawa, F. Bella, A. Budano, M. De Vincenzi, and F.
Ruggieri, 2011: Estimation of the time-dependent radioactive source-term from the Fukushima
166
TECHNICAL REPORTS OF THE METEOROLOGICAL RESEARCH INSTITUTE No.76 2015
nuclear power plant accident using atmospheric transport modelling. J. Environ. Radioact., 114,
10–14.
SCJ, 2014: A review of the model comparison of transportation and deposition of radioactive
materials released to the environment as a result of the Fukushima Daiichi Nuclear Power Plant
accident. Report of working group for model intercomparison, Subcommittee to Review the
Investigation on Environmental Contamination Caused by the Nuclear Accident, Committee on
Comprehensive Synthetic Engineering, Science Council of Japan. (available online at
http://www.scj.go.jp/ja/info/kohyo/pdf/kohyo-22-h140902-e1.pdf)
Seibert, P., D. Arnold, M. Gabriele, N. Arnold, K. Gufler, H. Kromp-Kolb, W. Kromp, P. Sutter, and
A. Wenisch, 2012: Severe accidents of nuclear power plants in Europe: possible consequences
and mapping of risk. 4th International Disaster and Risk Conference IDRC, Davos, 26-30 August.
(available
online
at
http://www.slideshare.net/GRFDavos/severe-accidents-of-nuclear-power-plants-in-europe-possib
le-consequences-and-mapping-of-risk)
Seino, N., H. Sasaki, J. Sato, and M. Chiba, 2004: High-resolution simulation of volcanic sulfur
dioxide dispersion over the Miyake Island. Atmos. Environ., 38, 7073–7081.
Sekiyama, T. T., M. Kajino, and M. Kunii, 2013: Ensemble simulation of the atmospheric
radionuclides discharged by the Fukushima nuclear accident. Geophys. Res. Abstracts, 15,
EGU2013-1695.
(available
online
at
http://meetingorganizer.copernicus.org/EGU2013/EGU2013-1695.pdf)
Sekiyama, T. T., M. Kunii, M. Kajino, and T. Shimbori, 2015: Horizontal resolution dependence of
atmospheric simulations of the Fukushima nuclear accident using 15-km, 3-km, and 500-m grid
models. J. Meteor. Soc. Japan, 93, 49–64.
Shao, Y., 2000: Physics and Modelling of Wind Erosion. Kluwer Academic Pub., Dordrecht, pp.
268–270.
Shimbori, T., Y. Aikawa, and N. Seino, 2009: Operational implementation of the tephra fall forecast
with the JMA mesoscale tracer transport model. CAS/JSC WGNE Res. Act. Atmos. Ocea. Model,
39, 05.29–05.30.
Shimbori, T., Y. Aikawa, K. Fukui, A. Hashimoto, N. Seino, and H. Yamasato, 2010: Quantitative
tephra fall prediction with the JMA mesoscale tracer transport model for volcanic ash: A case
study of the eruption at Asama volcano in 2009. Pap. Met. Geophys., 61, 13–29,
doi:10.2467/mripapers.61.13. (in Japanese with English abstract and figure captions)
Shimbori T., R. Kai, Yo. Hayashi, Yu. Hayashi, A. Sugai, Y. Hasegawa, A. Hashimoto, A. Takagi, T.
Yamamoto, and K. Fukui, 2014: Tephra fall predictions with the JMA regional atmospheric
transport model: A case study of the eruptions at Shinmoe-dake volcano in 2011. Pap. Met.
Geophys., 65, 75–107, doi:10.2467/mripapers.65.75. (in Japanese with English abstract and figure
captions)
Shoji, Y, 2009: A study of near real-time water vapor analysis using a nationwide dense GPS network
167
TECHNICAL REPORTS OF THE METEOROLOGICAL RESEARCH INSTITUTE No.76 2015
of Japan. J. Meteor. Soc. Japan, 87, 1–18.
Skamarock, W. C., J. B. Klemp, J. Dudhia, D. O. Jill, D. M. Barker, M. G. Duda, X. Y. Huang, W.
Wang, and J. G. Powers, 2008: A description of the advanced research WRF version 3. Tech.
Note, NCAR/TN-475+STR, 125 pp., Natl. Cent. For Atmos. Res., Boulder, Colo.
Smith, A. R., K. J. Thomas, E. B. Norman, D. L. Hurley, B. T. Lo, Y. D. Chan, P. V. Guillaumon, and
B. G. Harvey, 2014: Measurements of fission products from the Fukushima Daiichi incident in
San Francisco Bay Area air filters, automobile filters, rainwater, and food. J. Environ. Protect., 5,
207–221.
Solazzo, E., and S. Galmarini, 2015: The Fukushima-Cs137deposition case study: properties of the
Multi-Model ensemble. J. Environ. Radioact., 139, 226–233.
Sportisse, B., 2007: A review of parameterizations for modelling dry deposition and scavenging of
radionuclides. Atmos. Environ., 41, 2683–2698.
Stohl, A., M. Hittenberger, and G. Wotawa, 1998: Validation of the Lagrangian particle dispersion
model FLEXPART against large-scale tracer experiment data. Atmos. Environ. 32, 4245–4264.
Stohl, A., C. Forster, A. Frank, P. Seibert, and G. Wotawa, 2005, Technical note: The Lagrangian
particle dispersion model FLEXPART version 6.2. Atmos. Chem. Phys., 5, 2461–2474.
Stohl, A., P. Seibert, G. Wotawa, D. Arnold, J. F. Burkhart, S. Eckhardt, C. Tapia, A. Vargas, and T. J.
Yasunari, 2012: Xenon-133 and caesium-137 releases into the atmosphere from the Fukushima
Dai-ichi nuclear power plant: determination of the source term, atmospheric dispersion, and
deposition. Atmos. Chem. Phys., 12, 2313–2343.
Sugiyama, G., J. Nasstrom, B. Pobanz, K. Foster, M. Simpson, P. Vogt, F. Aluzzi, and S. Homann,
2012: Atmospheric dispersion modeling: challenges of the Fukushima Daiichi response. Health
Phys., 102, 493–508.
Suzuki, T., 1983: A theoretical model for dispersion of tephra: Arc Volcanism: Physics and Tectonics,
D. Shimozuru and I. Yokoyama, Eds., TERRAPUB, Tokyo, pp. 95–113.
Takano, I., Y. Aikawa, and S. Gotoh, 2007: Improvement of photochemical oxidant information by
applying transport model to oxidant forecast. CAS/JSC WGNE Res. Act. Atmos. Ocea. Model., 37,
05.35–05.36.
Takemura, T., H. Nakamura, M. Takigawa, H. Kondo, T. Satomura, T. Miyasaka, and T. Nakajima,
2011: A numerical simulation of global transport of atmospheric particles emitted from the
Fukushima Daiichi Nuclear Power Plant. SOLA, 7, 101–104.
Takigawa, M., H. Nagai, Y. Morino, T. T. Sekiyama, H. Hayami, T. Tanaka, T. Nakajima, and T.
Shibata, 2013: International intercomparison of atmospheric simulations of radionuclides.
Proceedings, the 54th Annual Meeting of Japan Society for Atmospheric Environment, 136 p. (in
Japanese)
Tanaka, T. Y., and M. Chiba, 2005: Global simulation of dust aerosol with a chemical transport Model,
MASINGAR. J. Meteor. Soc. Japan, 83A, 255–278.
Tanaka, T. Y., K. Orito, T. T. Sekiyama, K. Shibata, M. Chiba, and H. Tanaka, 2003: MASINGAR, a
168
TECHNICAL REPORTS OF THE METEOROLOGICAL RESEARCH INSTITUTE No.76 2015
global tropospheric aerosol chemical transport model coupled with MRI/JMA98 GCM: Model
description. Pap. Met. Geophys., 53, 119–138, doi:10.2467/mripapers.53.119.
Tanaka, T. Y., M. Kajino, T. Maki, T. T. Sekiyama, Y. Igarashi, M. Chiba, and M. Mikami, 2012:
Numerical simulation of atmospheric transport of radionuclides in Meteorological Research
Institute. Japan Geoscience Union Meeting 2012.
Terada, H., and M. Chino, 2008: Development of an atmospheric dispersion model for accidental
discharge of radionuclides with the function of simultaneous prediction for multiple domains and
its evaluation by application to the Chernobyl nuclear accident. J. Nucl. Sci. Technol., 45,
920–931.
Terada, H., H. Nagai, A. Furuno, T. Kakefuda, T. Harayama, and M. Chino, 2008: Development of
Worldwide Version of System for Prediction of Environmental Emergency Dose Information:
WSPEEDI 2nd version. Trans. At. Energy Soc. Japan, 7, 257–267. (in Japanese with English
abstract)
Terada, H., G. Katata, M. Chino, and H. Nagai, 2012: Atmospheric discharge and dispersion of
radionuclides during the Fukushima Dai-ichi Nuclear Power Plant accident. Part II: verification
of the source term and analysis of regional-scale atmospheric dispersion. J. Environ. Radioact.,
112, 141–154.
Torii, T., Y. Sanada, T. Sugita, A. Kondo, Y. Shikaze, M. Takahashi, M. Ishida, Y. Nishizawa, and Y.
Urabe, 2012: Investigation of radionuclide distribution using aircraft for surrounding
environmental survey from Fukushima Dai-ichi Nuclear Power Plant. JAEA-Technologoy
2012-036, Japan Atomic Energy Agency, 182 pp. (in Japanese with English abstract)
Uliasz, M., 1990: Development of the mesoscale dispersion modeling system using personal
computers. Part I: Models and computer implementation. Z. Meteor., 40, 110–120.
UNSCEAR, 2013: Report of the United Nations Scientific Committee on the Effects of Atomic
Radiation
to
the
General
Assembly.
17
pp.
(available
online
at
http://www.unscear.org/docs/reports/2013/13-85418_Report_2013_GA_Report.pdf)
UNSCEAR, 2014: Levels and effects of radiation exposure due to the nuclear accident after the 2011
great east-Japan earthquake and tsunami. UNSCEAR 2013 Report, Vol. 1, Scientific Annex A. 321
pp.
(available
online
at
http://www.unscear.org/docs/reports/2013/13-85418_Report_2013_Annex_A.pdf)
USDOE, 2011: US DOE/NNSA Response to 2011 Fukushima Incident, United States Department of
Energy. (available online at https://explore.data.gov/d/prrn-6s35)
Webster, H. N., and D. J. Thomson, 2011: Dry deposition modeling in a Lagrangian dispersion model.
Int. J. Environ. Pollut., 47, 1–9.
Webster, H. N., D. J. Thomson, B. T. Johnson, I. P. C. Heard, K. Turnbull, F. Marenco, N. I.
Kristiansen, J. Dorsey, A. Minikin, B. Weinzierl, U. Schumann, R. S. J. Sparks, S. C. Loughlin,
M. C. Hort, S. J. Leadbetter, B. J. Devenish, A. J. Manning, C. S. Witham, J. M. Haywood, and B.
W. Golding, 2012: Operational prediction of ash concentrations in the distal volcanic cloud from
169
TECHNICAL REPORTS OF THE METEOROLOGICAL RESEARCH INSTITUTE No.76 2015
the
2010
Eyjafjallajökull
eruption.
J.
Geophys.
Res.,
117,
D00U08,
17pp,
doi:10.1029/2011JD016790.
WGMSJ (Working Group on Emergency Response to Atmospheric Dispersion of Accidental Release
of Radioactive Materials, Meteorological Society of Japan), 2014: Utilization of numerical
prediction of atmospheric dispersion of accidentally released radioactive materials (in Japanese,
available online at http://www.metsoc.jp/default/wp-content/uploads/2014/12/teigen-201412.pdf)
Wilson, J. D., F. J. Ferrandino, and G. W. Thurtell, 1989: A relationship between deposition velocity
and trajectory reflection probability for use in stochastic Lagrangian dispersion models. Agric.
For. Meteor., 47, 139–154.
Winiarek, V., M. Bocquet, O. Saunier, and A. Mathieu, 2012: Estimation of errors in the inverse
modeling of accidental release of atmospheric pollutant: Application to the reconstruction of the
cesium-137 and iodine-131 source terms from the Fukushima Daiichi power plant. J. Geophys.
Res., 117, D05122, 16 pp, doi:10.1029/2011JD016932.
Winiarek, V., M. Bocquet, N. Duhanyan, Y. Roustan, O. Saunier, and A. Mathieu, 2014: Estimation of
the caesium-137 source term from the Fukushima Daiichi nuclear power plant using a consistent
joint assimilation of air concentration and deposition observations. Atmos. Environ., 82, 268–279.
WMO, 2010: Manual on the Global Data-processing and Forecasting System. WMO, 485.
WMO, 2011, Final report of the Meeting of the WMO Task Team on Meteorological Analyses for
Fukushima Daiichi Nuclear Power Plant Accident, Geneva, Switzerland, 30 November – 2
December
2011.
27
pp.
(available
online
at
http://www.wmo.int/pages/prog/www/CBS-Reports/documents/FinalRep_TT_FDnpp_v6.pdf)
WMO, 2012a, Final report of the Second Meeting of the WMO Technical Task Team on
Meteorological Analyses for Fukushima-Daiichi Nuclear Power Plant Accident, London, UK ,
1
–
3
May
2012.
13
pp.
(available
online
at
http://www.wmo.int/pages/prog/www/CBS-Reports/documents/FinalReport_TTMetAnalyFDnpp
.pdf)
WMO, 2012b, Final report of the Third Meeting of the WMO Technical Task Team on
Meteorological Analyses for Fukushima-Daiichi Nuclear Power Plant Accident,
Austria
,
3
–
5
December
2012.
76
pp.
(available
Vienna,
online
at
http://www.wmo.int/pages/prog/www/CBS-Reports/documents/FINAL-REPORT-Vienna-Dec20
12.pdf
and
http://www.wmo.int/pages/prog/www/CBS-Reports/documents/WMO_fnpp_final_AnnexIII_4Fe
b2013_REVISED_17June2013.pdf)
Wotawa, G., L.-E. De Geer, P. Denier, M. Kalinowski, H. Toivonen, R. D’Amours, F. Desiato, J.-P.
Issartel, M. Langer, P. Seibert, A. Frank, C. Sloan, and H. Yamazawa, 2002: Atmospheric
transport modeling in support of CTBT verification—overview and basic concepts. Atmos.
Environ., doi:10.1016/S1352-2310(03)00154-7.
Wotawa, G., R. Draxler, D. Arnold, S. Galmarini, M. Hort, A. Jones, S. Leadbetter, A. Malo, C.
170
TECHNICAL REPORTS OF THE METEOROLOGICAL RESEARCH INSTITUTE No.76 2015
Maurer, G. Rolph, K. Saito, R. Servranckx, T. Shimbori, and E. Solazzo, 2013: Transport and
deposition of radionuclides after the Fukushima nuclear accident: international model
inter-comparison in the framework of a WMO Task Team. Geophys. Res. Abstracts, 15,
EGU2013-3193.
(available
online
at
http://meetingorganizer.copernicus.org/EGU2013/EGU2013-3193.pdf)
Yamazawa, H., A. Furuno, and M. Chino, 1998: Evaluation of a long-range Lagrangian dispersion
model with ETEX. Atmos. Environ., 32, 4343–4349.
Yasunari, T. J., A. Stohl, R. S. Hayano, J. F. Burkhart, S. Eckhardt, and T. Yasunari, 2011:
Cesium-137 deposition and contamination of Japanese soils due to the Fukushima nuclear
accident. Proc. Natl. Acad. Sci., 108, 19530–19534.
Yukimoto, S., H. Yoshimura, M. Hosaka, T. Sakami, H. Tsujino, M. Hirabara, T. Y. Tanaka, M.
Deushi, A. Obata, H. Nakano, Y. Adachi, E. Shindo, S. Yabu, T. Ose, and A. Kitoh, 2011:
Meteorological Research Institute-Earth System Model Version 1 (MRI-ESM1) ―Model
Description―. Tech. Rep. MRI, 64, 88 pp, doi:10.11483/mritechrepo.64.
Yukimoto, S., Y. Adachi, M. Hosaka, T. Sakami, H. Yoshimura, M. Hirabara, T. Y. Tanaka, E.
Shindo, H. Tsujino, M. Deushi, R. Mizuta, S. Yabu, A. Obata, H. Nakano, T. Koshiro, T. Ose,
and A. Kitoh, 2012: A New Global Climate Model of the Meteorological Research Institute:
MRI-CGCM3 ―Model Description and Basic Performance―. J. Meterol. Soc. Japan, 90A,
23–64.
171
TECHNICAL REPORTS OF THE METEOROLOGICAL RESEARCH INSTITUTE No.76 2015
I. Appendix
I-1. Final report of the first meeting of WMO Task Team (Geneva, Switzerland, 30
November - 2 December 2011)
I-2. Final report of the second meeting of WMO Task Team (London, UK, 1 - 3 May
2012)
I-3. Final report of the third meeting of WMO Task Team (Vienna, Austria, 3 - 5
December 2012)
172
TECHNICAL REPORTS OF THE METEOROLOGICAL RESEARCH INSTITUTE No.76 2015
173
TECHNICAL REPORTS OF THE METEOROLOGICAL RESEARCH INSTITUTE No.76 2015
WORLD METEOROLOGICAL ORGANIZATION
COMMISSION FOR BASIC SYSTEMS
MEETING OF THE WMO TASK TEAM ON
METEOROLOGICAL ANALYSES FOR
FUKUSHIMA DAIICHI NUCLEAR POWER PLANT ACCIDENT
GENEVA, SWITZERLAND, 30 NOVEMBER – 2 DECEMBER 2011
FINAL REPORT
174
TECHNICAL REPORTS OF THE METEOROLOGICAL RESEARCH INSTITUTE No.76 2015
Kazuo Saito, Alice Soares, Roland Draxler, Matthew Hort, Geoff
Love, Peter Chen, Gerhard Wotawa
175
TECHNICAL REPORTS OF THE METEOROLOGICAL RESEARCH INSTITUTE No.76 2015
EXECUTIVE SUMMARY
The first meeting of WMO Technical Task Team (TT) on Meteorological Analyses for
Fukushima Daiichi NPP accident took place at the WMO Headquarters, in Geneva, Switzerland,
from 30 November to 2 December 2011. The TT’s work is to examine how the use of
meteorological analyses, and the introduction of additional meteorological observational data,
could improve the atmospheric transport, dispersion and deposition calculations as validated
against radiological monitoring data, which at a minimum should contribute to the requirements
which the United Nations Scientific Committee on the Effects of Atomic Radiation (UNSCEAR)
stated in its request for assistance from WMO. At the same time, this work should contribute to the
review and possible enhancements to the nuclear emergency response system, presently in place.
The TT reviewed and adopted its Terms of Reference, and reported on each of its terms,
including: (a) meteorological observational data, (b) meteorological NWP analyses data, (c) gaps in
the meteorological analyses, (d) meteorological conditions during the nuclear accident, (e)
evaluation of the observational data and analyses, (f) uncertainty of the atmospheric dispersion
and deposition calculations, (g) liaison with UNSCEAR, (h) proposal fro enhancements of the
WMO EER system. Mr Roland Draxler (RSMC Washington, USA) is named as the Chairperson of
the TT.
The TT agreed to focus its work on the period 11 March to 20 April 2011. It developed a
bibliography of relevant publications and presentations, stated its current point of view regarding
arrangements for sharing of information, and agreed a tentative work plan to the planned
completion of the final UNSCEAR study in 2013.
176
TECHNICAL REPORTS OF THE METEOROLOGICAL RESEARCH INSTITUTE No.76 2015
GENERAL SUMMARY OF THE WORK OF THE SESSION
1.
Opening
1.1
The first meeting of the Technical Task Team (TT) on Meteorological Analyses for
Fukushima Daiichi NPP Accident was opened by Dr Geoffrey Love, Director of the WMO Weather
and Disaster Risk Reduction Services Department, on behalf of the Secretary-General of WMO.
He expressed appreciation to the experts and their respective organizations for agreeing to
contribute to this important work. He noted that while the WMO Environmental Emergency
Response (EER) system responded well to the NPP accident during the response phase with realtime meteorological systems, including meteorological analyses and forecasts, and atmospheric
dispersion predictions, the current task is to examine how the use of meteorological analyses and
the introduction of additional meteorological observational data could improve the atmospheric
dispersion calculations as validated against radiological monitoring data. The work of the TT
should at a minimum contribute to the requirements which the United Nations Scientific Committee
on the Effects of Atomic Radiation (UNSCEAR) has stated in its request for assistance from WMO.
At the same time, this work should contribute to the review and possible enhancements to the EER
system, which was essentially designed following the Chernobyl nuclear accident of 25 years ago.
2.
Adopting of agenda and working arrangements
2.1
Mr Peter Chen of the Secretariat, introduced the Expanded Provisional Agenda, and
suggested to the meeting to consider who could act as Chairperson for the Task Team. Mr Roland
Draxler (USA), with the unanimous agreement of the participants, agreed to chair the TT and this
first meeting.
2.2
The meeting revised and adopted the agenda, which is found in Annex I.
2.3
The list of participants is found in Annex II. The meeting was informed that Mr René
Servranckx (Canada), Chairperson of the CBS Coordination Group for Nuclear Emergency
Response Activities, had notified the Secretariat that he was unable to attend this meeting.
3.
Introduction
3.1
The Secretariat provided background information related to the work of the TT, in particular
the request of UNSCEAR to participate in its study on the levels and effects of the radiation
released from the nuclear accident at the Fukushima Daiichi NPP.
3.2
This report adopted the acronym “ATM” to refer to “atmospheric transport, dispersion and
deposition modelling”, including the numerical simulation systems, and their outputs.
4.
Terms of Reference
4.1
The meeting reviewed and revised the TT’s draft Terms of Reference, which is found in
Annex III.
5.
Relevant period of interest
5.1
Although most of the known atmospheric emissions occurred in the last half of March 2011,
the meeting noted that it was difficult to predict the future evaluations that will be performed and
that the meteorological data requirements should cover a period from the time of the earthquake tsunami until the situation had stabilized, 11 March through 20 April, 2011.
5.2
Discharges into the ocean may have occurred over a different time period. Therefore
meteorological data may be required by the ocean modeling groups (marine dispersion experts) for
a longer period. Other UNSCEAR groups, such as those studying land contamination, may also
177
TECHNICAL REPORTS OF THE METEOROLOGICAL RESEARCH INSTITUTE No.76 2015
require data for longer periods. Clarification is needed from the relevant groups. At this point no
request was made to the Japan Meteorological Agency (JMA) or other meteorological services,
regarding data provision for a more extensive period.
6.
Response to the Terms of Reference (ToR)
(a)
Meteorological observational data
a.1
The meeting reviewed the meteorological observational data, including from surface, upperair radiosonde, upper-air wind profiler data, collected by JMA as summarized by K. Saito in Annex
IV and determined that all of the data are potentially useful in evaluating the meteorological
analyses, and any subsequent dispersion and deposition calculations using the analysis data, and
possibly for use by other groups involved in the UNSCEAR assessment. It was proposed that the
observational data be supplied in their native JMA binary format along with a description of this
format. The archive location is to be determined after consultation with UNSCEAR data working
group.
a.2
The meeting agreed that perhaps the most critical element in the deposition calculations
was getting the precipitation correct. In this aspect, JMA agreed to provide their Radar/Rain
Gauge analyzed precipitation fields available every 30 minutes at 1-km resolution (latitudelongitude, LL, grid), in GRIB2, as summarized by K. Saito in Annex IV.
(b)
Meteorological NWP Analyses Data
b.1
The meeting reviewed the meteorological NWP analysis data created by JMA as
summarized by K. Saito in Annex V and determined that:
•
•
The 4D-VAR mesoscale analysis, including surface, at 3-hour intervals and 5-km 50-hybrid
level resolution (Lambert Conformal, LM, projection), would be the most suitable for local
and regional scale atmospheric transport, dispersion and deposition modeling (ATM).
In addition hourly analysis data from the JMA nowcasting model (3D-Var) (LM projection /
5-km resolution / hourly / GRIB2 / U V T, including AWS data) would also be useful for
certain studies.
b.2
JMA has agreed to reprocess these data sets from their internal archive format to GRIB2.
The data will remain in the native Lambert Conformal horizontal coordinates on the original model
levels.
b.3
Initially these data would be provided to Task Team participants for evaluation purposes
and subsequently to UNSCEAR after consultation with their data working group. The archive
location is to be determined after consultation with UNSCEAR data working group.
b.4
Although other groups are also creating high resolution meteorological analyses, it is
uncertain whether these analyses can approach the level of observational data assimilated by the
JMA products. However, other mesoscale analyses could possibly be used in the assessment of
uncertainty limits to the critical meteorological fields and their inclusion into any future data archive
is encouraged.
b.5
With respect to the global analyses fields, i.e. JMA (Japan), Met Office (UK), NOAA (US),
CMC (Canada), and ECMWF (to be provided by ZAMG, Austria) agreed to make their model fields
available, initially from their respective centers, but potentially at a common repository after
consultation with UNSCEAR. See Annex V.
(c)
Gaps in the meteorological analyses
c.1
The meeting agreed that it was difficult to determine what is required to improve the
analyses used for the dispersion calculations prior to actually having evaluated these data in any
178
TECHNICAL REPORTS OF THE METEOROLOGICAL RESEARCH INSTITUTE No.76 2015
detail. However, one obvious problem emerged in the discussion that the long-range results were
very sensitive to precipitation fields and the dispersion model scavenging coefficients.
c.2
NOAA provides estimated precipitation fields derived from CMORPH, see:
(http://www.cpc.ncep.noaa.gov/products/janowiak/cmorph.shtml), and
ftp://ftp.cpc.ncep.noaa.gov/precip/global_CMORPH/30min_8km/
CMORPH is a technique for generating global precipitation analyses at very high spatial and
temporal resolutions (8-km horizontal resolution at hourly intervals) using precipitation estimates
that have been derived from low orbiter satellite microwave observations, but there are known
retrieval issues over land, problems with frozen precipitation and limitations in orbital coverage. Mr
Draxler agreed to investigate their availability and provide these data to the Task Team and
UNSCEAR.
c.3
The CMORPH data as well as similar global datasets could potentially be used by ATMs to
better represent the precipitation encountered by the plume for long range studies. However, the
value of these data has not been tested for atmospheric deposition applications, considering their
known limitations.
(d)
Meteorological conditions during the nuclear accident
d.1
The meeting reviewed a summary of the meteorological conditions in East Japan for the
March 11-26 (2011) period, provided by K. Saito (see Annex VI for an extended discussion). He
noted that the primary contribution to the Japan land areas may have occurred within two periods:
March 15-16 and March 20-23. The meeting discussed that a preliminary report to UNSCEAR
(May 2012) could incorporate an expanded discussion of these events building upon the material
already provided by JMA.
(e)
Evaluation of the observational data and analyses
e.1
The meeting discussed how the suitability of the existing meteorological analyses for ATM
calculations could be assessed. The meeting assumed that these calculations would primarily rely
upon the meteorological analyses produced by major weather centres rather than the
meteorological observations. The meeting decided that the best approach would be to compare
radiological plume calculations based upon the different analyses with each other and
meteorological and radiological observations. This can be achieved through comparison of
predicted and measured patterns or correlations which do not rely upon exact knowledge of the
radiological source term beyond what is already established.
e.2
The WMO Secretariat will arrange with CTBTO for radiological measurement data
availability and sharing under the framework of cooperation with UNSCEAR. In this context, the
task team members assume that radiological data obtained by UNSCEAR will be available to the
team for the support task as well as any scientific papers that result from these evaluations.
e.3
The meeting agreed that the mesoscale analysis provided by JMA (see b.1) would be used
to run their ATM calculations in addition to their existing simulations with global analyses (ECMWF,
NCEP, CMC, Met Office UK). Because wet deposition was recognized as a major source of
uncertainty, consideration will be given on how to best use the JMA high resolution precipitation
analysis (1-km, 30-min).
e.4
The chairperson presented to the meeting a possible framework for conducting the ATM
simulations independent of any emission assumptions. The computational scheme was based
upon creating multiple ATM runs for specific time intervals using a unit emission rate that can later
be multiplied with any time varying emission scenario without having to rerun the ATMs. The
meeting agreed to use this framework as a reference and produce output fields in accordance with
the scheme. Technical details are provided by the chairperson, included in Annex VII. Mr Draxler
179
TECHNICAL REPORTS OF THE METEOROLOGICAL RESEARCH INSTITUTE No.76 2015
also agreed to host a web page (see: http://ready-testbed.arl.noaa.gov/READY_fdnpp.php for a
prototype) that will include the modeling results from the other participants.
e.5
The meeting discussed possible ways to evaluate the different ATM results against the
measurements. It was agreed that the DATEM framework (http://www.arl.noaa.gov/DATEM.php )
created by NOAA would be the most efficient approach to perform this comparison. ZAMG agreed
to convert the radiological measurement data to the DATEM format, and NOAA agreed to
investigate how these measurement data could be incorporated into the computational framework.
(f)
Uncertainty of the atmospheric dispersion and deposition calculations
f.1
The meeting discussed the various uncertainties involved in the calculation of dispersion
and deposition. Although suitable meteorological analysis data sets have been identified, there will
always be some uncertainty regarding the meteorological parameters at any one point in space
and time because the data analysis fields are snapshots in time which are averaged over grid cells
with underlying complex terrain. Most of the time, the prevailing flow direction was offshore away
from the existing land-based monitoring network. The remaining significant releases with on-shore
flow were related to complex meteorological situations (see Section 6 (d)) with rapidly changing
wind direction and variable precipitation patterns. Model derived wet deposition calculations carry
large uncertainties and therefore observed precipitation fields need to be incorporated into the
calculations.
f.2
The meeting proposed the use of the results from the framework discussed in the previous
section to address uncertainties described above. The framework allows for the comparison of
multiple model results either with different meteorological analyses using the same ATM model or,
the same meteorological analysis using different ATMs. This would provide an estimate of the
range of possible air concentration and deposition values,
(g)
Liaison with UNSCEAR
g.1
The meeting noted that the proposed modeling framework did not require a precise
knowledge of the emissions and in fact could be used by UNSCEAR to optimize the emissions to
match the measurement data. However for certain model comparisons, it would be desirable to
have an estimate of the temporal variation of the emissions. The Task Team would rely upon
advice from UNSCEAR source term group to propose a scenario that can be used for
meteorological model evaluations.
g.2
As was already discussed in the previous section, the most appropriate way to evaluate
meteorological analyses in this case is to compare the ATM outputs based upon these analyses
with radiological measurement data. In that aspect, the Task Team would rely upon the
UNSCEAR data group to provide access to the appropriate measurement data.
g.3
The group agreed to provide UNSCEAR access to the model comparison framework and/or
to the individual ATM calculations.
g.4
The working arrangements between UNSCEAR Expert Group B and the WMO Task Team
will initially be coordinated through the chairpersons from each group. However, it is expected that
the groups would meet as needed to discuss technical issues, either through Telecon or Webex
meetings if possible.
(h)
Proposal for enhancements of the WMO EER system
h.1
The meeting agreed that the results of the Task Team are important in the consideration of
future EER products and services.
7.
Bibliography
180
TECHNICAL REPORTS OF THE METEOROLOGICAL RESEARCH INSTITUTE No.76 2015
Source Estimation
- Chino, M. et al., 2011. Preliminary Estimation of Release Amounts of 131 I and 137 Cs
Accidentally Discharged from the Fukushima Daiichi Nuclear Power Plant into the
Atmosphere. Journal of NUCLEAR SCIENCE and TECHNOLOGY, 48(7), pp.1129–1134.
- Stohl, A. et al., 2011. Xenon-133 and caesium-137 releases into the atmosphere from the
Fukushima Dai-ichi nuclear power plant: determination of the source term, atmospheric
dispersion and deposition. Atmos. Chem. Phys. D.
Radiological Observations
- Masson, O. et al., 2011. Tracking of Airborne Radionuclides from the Damaged Fukushima
Dai-Ichi Nuclear Reactors by European Networks. Environmental Science & Technology,
45(18), pp.7670–7677.
- Tagami, K. et al., 2011. Specific activity and activity ratios of radionuclides in soil collected
about 20km from the Fukushima Daiichi Nuclear Power Plant: Radionuclide release to the
south and southwest. Science of the Total Environment, 409(22), pp.4885–4888.
- Kinoshita, N. et al., 2011. Assessment of individual radionuclide distributions from the
Fukushima nuclear accident covering central-east Japan. Proceedings of the National
Academy of Sciences.
Dispersion and Deposition Modeling
- Yasunari, T. et al., 2011. Cesium-137 deposition and contamination of Japanese soils due
to the Fukushima nuclear accident. In Proceedings of the National Academy of Sciences.
Proceedings of the National Academy of Sciences.
Presentations
- EUROSAFE Forum 2011, Brussels, November 5th to 6th, 2012. http://www.eurosafeforum.org/eurosafe-forum-2011
- Presentations at the special session “Current status and subjects of the radionuclide
transport models” at the autumn meeting of the Meteorological Society of Japan (MSJ,
http://msj.visitors.jp/notification/pdf/A2011oral_20110909.pdf ), including:
•
•
•
•
•
•
•
•
8.
Tanaka, T. et al., Global transport model using MASINGAR.
Kajino, M. et al., MRI regional chemical transport model using NHM-Chem.
Maki, T. et al., Emission flux estimation by inverse model.
Tsuruta, H. et al., Regional Deposition of Radioactive Cs and I by the Accident of the
Fukushima Daiichi NPP.
Takemi, T. and H Ishikawa, High-Resolution modeling analyses of wind and diffusion
fields over Fukushima.
Kondo, H. et al., Transport and deposition analysis by AIST-MM.
Takigawa, M. et al., Deposition estimation using WRF/Chem.
Kato, M. et al., Transport and diffusion simulation using CReSS.
Arrangements for sharing information
8.1
The meeting noted that the creation of a central data repository for all meteorological and
ATM products considered by the Task Team is not currently feasible. The Task Team noted that
UNSCEAR would address the data repository issue in their data sharing plan.
8.2
With respect to the data, it is expected that all data collected and generated in this effort will
be shared between UNSCEAR and the Task Team.
8.3
The meeting noted that all results generated by the Task Team will become publicly
available, either through the web or scientific publications.
9.
Work plan and timetable
181
TECHNICAL REPORTS OF THE METEOROLOGICAL RESEARCH INSTITUTE No.76 2015
16 January 2012 - Task Team Meeting Report (Draxler and Secretariat)
30 January – 3 Feb 2012 – UNSCEAR work group meeting
Week of 6 February - TT teleconference (to revise work plan and timetable)
March 2012 – sample mesoscale analysis available from JMA (Saito)
April 2012 – TT to provide preliminary ATM results for the full period (11 March to 20 April 2011) to
NOAA (Draxler) in the model evaluation framework format.
23 April 2012 – TT meeting
14 May 2012 - Preliminary TT report to UNSCEAR on meteorological analyses and ATM results
21 May 2012 – 59th session UNSCEAR progress and preliminary report
June 2012 - meteorological data and NWP analyses from TT members will be ready for sharing
within TT
July 2012 – ZAMG (Wotawa) to provide available measurement data in DATEM format
October 2012 – TT to complete and provide ATM results using JMA meso-analyses within TT
November 2012 – NOAA (Draxler) to provide DATEM statistical results linked with model
evaluation framework
December 2012 – TT meeting
March 2013 – TT to provide draft final report on meteorological analyses and ATM results
April 2013 – Final TT report provided to UNSCEAR on meteorological analyses and ATM results
May 2013 – 60th session UNSCEAR report
10.
Closing
10.1 The first meeting of the Technical Task Team (TT) on Meteorological Analyses for
Fukushima Daiichi NPP Accident closed at 17:15 on Friday, 2 December 2011.
182
TECHNICAL REPORTS OF THE METEOROLOGICAL RESEARCH INSTITUTE No.76 2015
ANNEX I
Agenda
1.
Opening
2.
Adopting of agenda and working arrangements
3.
Introduction
4.
Terms of Reference
5.
Relevant period of interest
6.
Response to the Terms of Reference (ToR)
7.
Bibliography
8.
Arrangements for sharing information
9.
Work plan and timetable
10.
Closing
183
TECHNICAL REPORTS OF THE METEOROLOGICAL RESEARCH INSTITUTE No.76 2015
ANNEX II
List of Participants
Dr Gerhard WOTAWA
Zentralanstalt für Meteorologie und
Geodynamik (ZAMG)
Hohe Warte 38
A-1191 VIENNA
Austria
Tel:
Fax:
Email:
+(43 1) 36026 2007
+(43 1) 369 12 33
[email protected]
Dr Kazuo SAITO
Meteorological Research Institute
Japan Meteorological Agency (JMA)
1-1, Nagamine, Tsukuba
Ibaraki 305-0052
Japan
Tel:
Fax:
Email:
+(81 29) 853 8638
+(81 29) 853 8649
[email protected]
Dr Matthew HORT
Met Office UK
Fitzroy Road
Exeter EX13PB
Devon
United Kingdom
Tel:
Fax:
Email:
(+44 1392) 886 242
(+44 1392) 885 681
[email protected]
Mr Roland DRAXLER
Air Resources Laboratory
NOAA – Office of Oceanic and Atmospheric
Research
SSMC3, Room 3350
1315 East-West Highway
SILVER SPRING, Maryland (MD)
20910-6233
United States of America
Tel:
Fax:
Email:
+(1 301) 713 0295 ext 117
+(1 301) 713 0119
[email protected]
Mr Peter CHEN
Tel:
Fax:
Email:
+(41 22) 730 8231
+(41 22) 730 8128
[email protected]
Ms Alice SOARES
Tel:
Fax:
Email:
+(41 22) 730 8449
+(41 22) 730 8128
[email protected]
Dr Geoffrey LOVE
Tel:
Fax:
Email:
+(41 22) 730 8264
+(41 22) 730 8128
[email protected]
WMO Secretariat
7 bis avenue de la Paix
Case postale 2300
1211 GENEVE 2
Switzerland
184
TECHNICAL REPORTS OF THE METEOROLOGICAL RESEARCH INSTITUTE No.76 2015
TT-MA-NPP-Accident, Report, p. 9
ANNEX III
WMO Technical Task Team on Meteorological Analyses – Fukushima Daiichi NPP Accident
Terms of Reference
Membership and Chairperson
• Roland Draxler, Chairperson (RSMC Washington, USA)
• Matthew Hort (RSMC Exeter, UK)
• Gerhard Wotawa (RSMC Vienna, Austria)
• Kazuo Saito (Meteorological Research Institute, Japan Meteorological Agency, Japan)
• René Servranckx (Chairperson of CBS Coordination Group on Nuclear ERA, RSMC
Montreal, Canada)
Terms of work
(a)
Determine the relevant meteorological observational data sets and related information
required to support the meteorological analyses and identify their archive location and availability;
(b)
Determine which of the existing meteorological analyses are of sufficient spatial and
temporal detail that can be used to estimate the atmospheric transport, dispersion, and surface
deposition of radionuclides that were released from the nuclear accident and identify their archive
location and availability;
(c)
Identify gaps in the existing meteorological analyses that if addressed would make them
more suitable for estimating atmospheric transport, dispersion, and deposition and in coordination
with the WMO Secretariat, identify which members will provide updated analyses;
(d)
Based upon the observational data and analyses, prepare a report on the temporal and
spatial variations in atmospheric conditions during the nuclear accident;
(e)
Evaluate the suitability and quality of the observational data and meteorological analyses
for computing atmospheric transport, dispersion, and surface deposition by comparing the
computational results with radiological measurements;
(f)
Estimate the uncertainty in the atmospheric transport, dispersion and deposition (ATM)
computations by comparing the results from several different ATMs and using different
meteorological analyses;
(g)
Liaise and assist where possible with the UN Scientific Committee on the Effects of Atomic
Radiation (UNSCEAR), in their study on the levels and effects of exposure due to the Fukushima
Daiichi nuclear accident.
(h)
Propose possible enhancements to the WMO EER system, including additional products
and/or additional modes of operation with the relevant international organizations.
Duration and working arrangements
It is anticipated that the work of the Task Team would commence immediately, and span a period
of 12 -18 months. The Team will work mainly by e-correspondence, and meet face-to-face, as
needed. WMO Secretariat will facilitate the work of the team.
185
TECHNICAL REPORTS OF THE METEOROLOGICAL RESEARCH INSTITUTE No.76 2015
ANNEX IV
Table A4.1 - Meteorological observational data collected by JMA
Data name
AWS
(Fig. A4.1)
Number
of point
1300
Duration
Data amount
levels
Elements
10-minute:
hourly, daily
Total amount of data
10-minute: 18GB
(2003-2011)
hourly & daily: 22GB
(1976-2011)
Shorter time periods
are available
1
Precipitation amount (10-minute, hourly, daily),
daily maximum precipitation (10-minute, hourly)
1
16MB/month
1
2MB/month
25
temperature/relative
humidity: 8MB/month
wind direction/speed:
5MB/month
50KB/day
variable
temperature, wind speed/direction, sunshine
duration (10-minute),
Snow depth (hourly), snowfall depth (hourly, daily),
maximum snow depth (daily)
Kinds of precipitation phenomenon, start/end time
of the phenomenon, etc.
(written in Japanese)
altitude, temperature, relative humidity, wind
direction, wind speed and passing time at 25
standard level
temperature/relative humidity,
wind direction/speed
at significant level
800
300
Note of
precipitation
150
Radiosonde
(Fig. A4.2)
16
Wind profiler
(Fig. A4.2)
31
twice a day
every 10
minutes
1
variable
186
Wind direction, Wind speed, Vertical speed
Signal to noise ratio
TECHNICAL REPORTS OF THE METEOROLOGICAL RESEARCH INSTITUTE No.76 2015
Table A4.2 - Precipitation analysis of radar and raingauge observations
Data name
Domain size
Map
projection
Resolution
Duration
Radar /Rain gaugeAnalyzed
Precipitation
2560x3360
(SW:20N 118E,
NE:48N 150E)
LL
1km
(0.0125x0.
008333)
Twice
an hour
187
Data
amount
(Daily)
0.375MB
(18MB)
levels
Elements
SURF
RAIN
TECHNICAL REPORTS OF THE METEOROLOGICAL RESEARCH INSTITUTE No.76 2015
■
○
○
○
+
Manned Station and Special AWS
AWS (Precipitation, temperature, wind, and sunshine duration)
AWS (Precipitation, temperature and wind)
AWS (Precipitation)
AWS (Snow depth)
Fig. A4.1 - Left: Distribution of surface stations in Japan. Right: Enlarged view in East Japan.
188
TECHNICAL REPORTS OF THE METEOROLOGICAL RESEARCH INSTITUTE No.76 2015
Fig. A4.2 - Left: Upper observations in Japan. Right: Radar observations by JMA.
189
TECHNICAL REPORTS OF THE METEOROLOGICAL RESEARCH INSTITUTE No.76 2015
ANNEX V
Meteorological NWP Analysis Data
Table A5.1 - Regional Meteorological NWP analysis data created by JMA
Data name
Plane
Meso
analysis
Model
Num
of
layers
50
Meso
surface
analysis
Surface
1
Hourly
analysis
P
17
Method
Domain size
Map
projection
Resolutio
n
Output
interval
4DVAR
721x577
(SW:19.66N
117.74E,
NE:47.71N
156.16E)
LM
(Lambert
conformal)
5km
3 hourly
721x577
(SW:19.66N
117.74E,
NE:47.71N
156.16E)
LM
5km
3 hourly
15MB
(120MB)
SURF
721x577
(SW:19.66N
117.74E,
NE:47.71N
156.16E)
LM
5km
hourly
43MB
(1032MB)
SURF 1000 975 950
925 900 850 800 700
600 500 400 300 250
200 150 100
3DVAR
190
Data
amount
(Daily)
600MB
(4800MB)
Levels
Elements
z*-z hybrid
coordinate (lowest
level: 20m, model
top: 21.8km)
ZS SL FLAT
FLON PAIRF
DNSG2 RU RV
RW PT TIN(4
layers) QV QC
QR QCI QS QG
ETURB PRS
PSEA
TUGDG(4
layers) KINDG
SST KIND
TUGD(4 layers)
JFLG HRAIN
CLD TBB CVT
ETOP PARM
UVT
TECHNICAL REPORTS OF THE METEOROLOGICAL RESEARCH INSTITUTE No.76 2015
TT-MA-NPP-Accident, Report, p. 15
Table A5.2 - Global Meteorological NWP analysis data
Centre + Data
name
Plane
Num of
layers
Method
Domain
size
Map
projectio
n
LL
JMA, Global
analysis
(Global)
Hybrid
sigmapressure
60
up to 0.1
hPa
(16 input
for ATM)
4DVAR
TL959
(TL319
input for
ATM)
ECMWF,
Global
analysis
Hybrid
pressure
91
up to
0.01 hPa
4DVAR
T1279
LL (for
standard
products)
UK Met Office,
Global UM
analysis
Hybrid
height
above
ground
70
up to
80km
4DVAR
1024 x
769
LL
NOAA, Global
analysis
Hybrid
sigmapressure
56
3DVAR
720x361
LL
CMC, Global
analysis
Eta
58
4DVAR
801 x600
Hybrid
80
4DVAR
801 x600
Resolution
(Long-Lat
degrees)
0.1875
Output
interval
Data
amount
(Daily)
132MB
(input for
ATM)
Lowest 10 levels
Elements
SURF, 1000, 925,
850, 700, 600, 500,
400, 300, 250 hPa
(input for ATM)
U V T Z RH
OMG P(surface)
PHI(surface)
3 hourly
Depends
on area,
res and
field set
3 hourly
354 Mb
(12 Gb
un
compres
sed)
1012, 1009, 1005,
1000, 993, 986,
977, 966, 954, 940
hPa (w.r.t. reference
surface pressure of
1013.25 hPa)
SURF, 10.0, 36.7,
76.7, 130.0, 196.7,
276.7, 370.0, 476.7,
596.7 m agl
All standard 3-d
and 2-d fields
required by a
dispersion model
+ wide variety of
other fields.
3d: U, V, W, T,
Q, QCL, QCF, P
+ variety of 2d
fields
0.5
3 hourly
500 MB
Delta hPa: 4, 5, 7, 8,
9,10,11,12,14,16,18
UVTZQ
+ variety of 2-d
surface fields
LL
0.3
6 hourly
1.0 GB
(for 4
cycles)
1.0 .995 .985 .9733
.9606 .9477 .9316
.9151 .8973 .8780
U V T GZ P0 HU
HR ES WE +
variety of surface
fields
LL
0.3
6 hourly
1.6 GB
(for 4
cycles)
1.0 .995 .985 .974
.961 .947 .932 .916
.898 .879
U V T GZ P0 HU
HR ES WE +
variety of surface
fields
6 hourly
(0.5625 input
for ATM)
0.125 (for
standard
products).
Fields can be
requested at
lower res
0.3515625,
0.234375
191
TECHNICAL REPORTS OF THE METEOROLOGICAL RESEARCH INSTITUTE No.76 2015
ANNEX VI
Meteorological conditions in East Japan for the March 11-26, 2011
1) Synoptic weather pattern:
After the passage of a weak pressure trough over East Japan from 9th to 11th a high
pressure system moved eastward along the south coast of the main island of Japan from
11th to 13th. A weak low pressure system moved eastward off the south coast of the
main island from 13th to 15th, and moved toward the northeast while developing rapidly
after 15th. A low pressure system passed from 20th to 22nd over main island. (Fig. A6.1)
Fig. A6.1 - Surface weather chart at 0000 UTC (0900 JST) from 15 to 17
(upper) and from 21 to 23 (lower), March 2011.
2) Precipitation over east Japan:
Light rains were observed from 9th to 12th morning due to passage of a weak pressure
trough over East Japan. Light rains were also observed from 15th to 17th morning due to
a weak low pressure system which moved eastward off the south coast of the main.
Moderate rains were given in the Kanto area from 20th to 23rd by a low pressure system
which passed over the main island of Japan. (Fig. A6.2)
192
TECHNICAL REPORTS OF THE METEOROLOGICAL RESEARCH INSTITUTE No.76 2015
Fig. A6.2 – 24-hour accumulated precipitation amount and observed surface
winds at 0000 UTC (0900 JST) for 15-17 (upper) and for 21-23 (lower), March
2011.
3) 950 hPa winds on March 15 by the mesoscale analysis of JMA:
The 950 hPa winds were westerly until the morning of 15th, but changed to NN-Easterly
during the daytime of the 15th. After 1500 JST, the winds turned ES-Easterly, and then
changed to Northerly after 0000 JST on the 16th (Fig. A6.3).
193
TECHNICAL REPORTS OF THE METEOROLOGICAL RESEARCH INSTITUTE No.76 2015
Fig. A6.3 – 950hPa winds (arrows) and mean sea level pressure (colour
shade) by mesoscale analysis of JMA for 0000 UTC (0900 JST) – 1500
UTC (0000 JST), 15 March 2011.
4) Winds below 7 km observed at the wind profiler (Mito) nearest to the NPP during the
period March 12-20:
The wind direction was southerly below 1 km while westerly above 1 km in the afternoon
of March 12 when the hydrogen explosion occurred at the No. 1 reactor. Low level wind
was southwesterly during the morning of the 14th when the hydrogen explosion occurred
at the No. 3 reactor. Winds below 1 km were N-Easterly during the morning of the 15th
when the reactor container burst occurred at the No. 2 reactor (Fig. A6.4).
194
TECHNICAL REPORTS OF THE METEOROLOGICAL RESEARCH INSTITUTE No.76 2015
a)
b)
c)
Fig. A6.4 – Time series of winds below 7 km observed by a JMA wind
profiler at the nearest point (Mito). a) From 1200 JST to 2400 JST, March
14. b): From 0000 JST to 2400 JST, March 14. C) From 0000 JST to 2400
195
TECHNICAL REPORTS OF THE METEOROLOGICAL RESEARCH INSTITUTE No.76 2015
JST, 15 March. Horizontal wind direction (barbs) and vertical speed of
precipitation or air (colour shade).
5) Summary
The radionuclides were dispersed due to winds and other conditions, and this has been
monitored (Fig. A6.5) and confirmed by Ministry of Education and Science and
Technology (MEXT). The following two periods may have been the primary contributors
to the observed deposition pattern:
•
Southwestward transport by northeasterly low level winds from midnight
of the 14th to early morning of the 15th and northwestward transport that resulted
in the high density deposition pattern during the afternoon of the 15th
•
Northward transport in the afternoon of the 20th and southward transport
from midnight of the 21st to the early morning of the 22nd.
Modeling results by researchers in Japan generally support the above speculation (e.g.,
Yasunari et al., 2011; Kajino et al., 2011; Kondo et al., 2011; Takigawa et al., 2011; Kato
et al., 2011), but a high deposition area over the middle of the Fukushima prefecture has
not yet been well simulated.
196
TECHNICAL REPORTS OF THE METEOROLOGICAL RESEARCH INSTITUTE No.76 2015
Fig. A6.5 – Regional deposition map of 137Cs in surface soils observed
by aircraft monitoring by MEXT (from home page of the Ministry of
Education, Culture, Sports, Science and Technology (MEXT), Japan).
(http://radioactivity.mext.go.jp/ja/1910/2011/11/1910_111112.pdf).
197
TECHNICAL REPORTS OF THE METEOROLOGICAL RESEARCH INSTITUTE No.76 2015
ANNEX VII
Computational Framework for the Fukushima Daiichi NPP Accident Simulations
The basic approach to the dispersion-deposition calculations to create an ATM
calculation using a unit source rate (1/hr) for discreet emission time segments from the
beginning to the end of the computational period. The concentration or deposition at any
grid cell in the domain will be the sum of the contribution from each ATM emission
segment after multiplying the resulting unit concentrations by the actual emission rate for
each segment. Radioactive decay is also applied during this processing step.
•
•
•
Computational period: 0000Z 11 March 2011 through 0000Z 21 April 2011
Emission periods: 3-hour segments, 0000-0300; 0300-0600; ...
Concentration & Deposition: 3-hour average & total, 0000-0300; 0300-0600; ...
The computational period consists of 41 days, each day has 8 emission periods, and
therefore 328 independent simulations are required:
•
•
•
•
Simulation #1: Emissions 0000Z-0300Z 11 March; Output 0000Z 11 March
through 0000Z 21 April (328 output periods)
Simulation #2: Emissions 0300Z-0600Z 11 March; Output 0300Z 11 March
through 0000Z 21 April (327 output periods)
Simulation # ...
Simulation #328: Emissions 2100Z-0000Z 21 April; Output 2100Z 20 April
through 0000Z 21 April (1 output period)
Three generic species should be tracked as surrogates for the radionuclides: a gas with
no wet or dry scavenging, a gas with a relatively large dry deposition velocity and wet
removal, and a particle with a small dry deposition velocity and wet removal.
Table A7.1 Summary the computational species
Type
Name
Wet Removal
Gas
Ngas
No
Gas, depositing Dgas
Yes
Particle, light
Lpar
Yes
Dry Deposition
No
Yes
Yes
Surrogate for
Noble gases
I-131
Cs-137; I-131
The output concentration grid should be a regular spaced latitude-longitude grid where
the latitude and longitude grid spacing may be different if desired. Although multiple
output levels are possible, to limit the size of the output files, it is proposed that only the
data from two levels and three computational species be submitted for evaluation: a level
at height "0" m AGL defines the deposition, and a level at "100" represents the average
concentration from the ground to 100 m AGL. Two concentration grids are suggested,
one for regional simulations and one for global simulations:
Domain
Regional
Global
Center
Latitude
38N
0
Center
Longitude
140E
0
Latitude
Span
20
181
198
Longitude
Span
30
360
Spacing
Deg Lat
0.05
0.50
Spacing
Deg Lon
0.05
0.50
TECHNICAL REPORTS OF THE METEOROLOGICAL RESEARCH INSTITUTE No.76 2015
The file size issues can be significant. For example, a coarser resolution global
calculation using a 6-hour emission frequency and a one-degree concentration grid with
only one output data level resulted in a space requirement for all files of about 2 GB. For
the global grid defined above, one could expect a much larger (4x horizontal, 2x vertical,
2x temporal) space requirement of about 32 GB. The regional grid is expected to require
about 10 GB. Output files should be named according to the start of the release time:
{Base_Name}_${MM}${DD}${HH}.
The proposed concentration file format follows the convention used by the NOAA ATM
(HYSPLIT) and the resulting files would be compatible with all the current web based
post-processing routines as well as numerous graphics and other output file
manipulation programs available for Windows PC or Mac applications. Concentration
files may be written in either packed or unpacked format. Concentration file packing does
not write the same information in fewer bytes, but rather writes the same information
using twice as many bytes. The packed files are generally smaller because only
concentration values at the non-zero grid points are written to the output file by the
model. However this requires the grid point location to be written with the concentration,
hence the additional bytes. If most of the grid is expected to have non-zero
concentrations, then the unpacked format will save space. The output files should be
written as unformatted big-endian binary according to the following specification (a
sample program will be provided):
Record #1
•
•
•
•
CHAR*4 Meteorological MODEL Identification
INT*4 Meteorological file start (YEAR, MONTH, DAY, HOUR, FORECAST-HR)
INT*4 NUMBER of starting locations
INT*4 Concentration packing flag (0=no 1=yes)
Record #2 Loop to record: Number of starting locations
•
•
•
INT*4 Release starting time (YEAR, MONTH, DAY, HOUR)
REAL*4 Starting location and height (LATITUDE, LONGITUDE, METERS)
INT*4 Release starting time (MINUTES)
Record #3
•
•
•
INT*4 Number of (LATITUDE-POINTS, LONGITUDE-POINTS)
REAL*4 Grid spacing (DELTA-LATITUDE,DELTA-LONGITUDE)
REAL*4 Grid lower left corner (LATITUDE, LONGITUDE)
Record #4
•
•
INT*4 NUMBER of vertical levels in concentration grid
INT*4 HEIGHT of each level (meters above ground)
Record #5
•
•
INT*4 NUMBER of different pollutants in grid
CHAR*4 Identification STRING for each pollutant
199
TECHNICAL REPORTS OF THE METEOROLOGICAL RESEARCH INSTITUTE No.76 2015
Record #6 Loop to record: Number of output times
•
INT*4 Sample start (YEAR MONTH DAY HOUR MINUTE FORECAST)
Record #7 Loop to record: Number of output times
•
INT*4 Sample stop (YEAR MONTH DAY HOUR MINUTE FORECAST)
Record #8 Loop to record: Number levels, Number of pollutant types
•
•
CHAR*4 Pollutant type identification STRING
INT*4 Output LEVEL (meters) of this record
No Packing (all elements)
•
REAL*4 Concentration output ARRAY
Packing (only non-zero elements)
INT*4 Number of non-zero elements
•
•
•
•
INT*2 First (I) index value
INT*2 - Second (J) index value
REAL*4 - Concentration at (I,J)
... repeat the above three values: times the number of non-zero elements
200
TECHNICAL REPORTS OF THE METEOROLOGICAL RESEARCH INSTITUTE No.76 2015
WORLD METEOROLOGICAL ORGANIZATION
COMMISSION FOR BASIC SYSTEMS
MEETING OF THE WMO TASK TEAM ON
METEOROLOGICAL ANALYSES FOR
FUKUSHIMA DAIICHI NUCLEAR POWER PLANT ACCIDENT
LONDON, UK, 1-3 MAY 2012
FINAL REPORT
201
TECHNICAL REPORTS OF THE METEOROLOGICAL RESEARCH INSTITUTE No.76 2015
Olivier Isnard, Peter Bedwell, Gerhard Wotawa, Matt Hort, Florian Gering, Roland Draxler,
Peter Chen, Alain Malo, Kazuo Saito.
202
TECHNICAL REPORTS OF THE METEOROLOGICAL RESEARCH INSTITUTE No.76 2015
GENERAL SUMMARY OF THE WORK OF THE SESSION
1.
Opening
1.1
The second meeting of the WMO Technical Task Team (TT) on Meteorological
Analyses for Fukushima Daiichi NPP Accident was held at the offices of the Met Office
UK, at Gray’s Inn House, London, UK, and opened by the TT’s chairperson, Mr Roland
Draxler. Mr Draxler welcomed and expressed appreciation to all the participants. Mr
Peter Chen, the representative of the WMO Secretariat recalled that the current task is
to examine how the use of meteorological analyses and the introduction of additional
meteorological observational data could improve the atmospheric dispersion calculations
as validated against radiological monitoring data. The work of the TT will contribute to
the requirements which the United Nations Scientific Committee on the Effects of Atomic
Radiation (UNSCEAR) has stated in its request for assistance from WMO. In this
regard, two experts of the UNSCEAR Study were invited to participate at this meeting:
Mr Olivier Isnard of the French Institut de Radioprotection et de Sûreté Nucléaire (IRSN),
and Mr Florian Gering of the German Bundesamt für Strahlenschutz (BfS). As well,
UNSCEAR Study’s UK experts of the Health Protection Agency, who are working in the
UNSCEAR dose assessment group, were also invited to participate on one part of the
agenda.
2.
Adopting of agenda and working arrangements
2.1
Mr Draxler introduced the provisional agenda, which meeting adopted, and is
found in Annex I.
2.2
The list of participants is found in Annex II. The meeting was informed that Mr
René Servranckx (Canada), Chairperson of the CBS Coordination Group for Nuclear
Emergency Response Activities, had notified the Secretariat that he was unable to
attend this meeting. Instead, the work of RSMC Montréal contributing to the output of the
TT was represented by Mr Alain Malo.
2.3
Daily working arrangements were agreed by the meeting.
3.
Review of preliminary ATM runs for 11 – 31 March 2011
3.1
Mr Draxler provided a summary of the outcomes of the first meeting of the TT
(Geneva, Dec. 2011), and also a summary of the progress made on the preliminary ATM
runs for the period 11 – 31 March 2011, carried out by NOAA, JMA, Met Office UK,
CMC. ZAMG (Austria) will soon provide its computations. JMA provided a regional
ATM run using its high resolution mesoanalyses, while the other used their respective
global analyses.
3.2
As per agreement from the first TT meeting, all members implemented the
computational scheme for ATM simulations (Draxler, 2012). The meeting discussed
various issues around the configuration of the ATM runs, including the source term and
species, and the release height(s).
3.3
While waiting for the conclusion of the work of the UNSCEAR source term expert
sub-group, these ATM runs were based on a source sequence following Chino (2011).
Mr Isnard indicated that he was using a different source sequence, and agreed to
provide the TT with a 3-hourly sequence of emissions and release height.
203
TECHNICAL REPORTS OF THE METEOROLOGICAL RESEARCH INSTITUTE No.76 2015
3.4
The group discussed as to whether the published source term data were valid at
the time of release or at the time the fission reaction stopped. There was some
uncertainty about this matter as Mr Wotawa indicated that for all their source term
inversion calculations using measured data, the release amounts were decay corrected
back to the time of the earthquake. Mr Isnard and Mr Gering will check with the
UNSCEAR source term group and report back to the TT.
3.5
As for the release height, the different ATMs used different values for the
releases, while Mr Isnard had computed with time varying release heights. While the
TT agreed that it would be best to use a point release at a height of 100 metres above
ground level, there was interest to understand the sensitivity of the results to varying
release heights (to reflect explosive releases), and Mr Isnard agreed to also provide
these data to the TT so that they could conduct sensitivity tests.
3.6
Mr Isnard noted that not all events are equally important and that getting the
meteorological conditions correctly simulated on high emission days is critical in the
assessment.
3.7
The meeting agreed that at this time the ATM results should be computed at 3hourly intervals and at 5-km horizontal resolution. In addition to the graphical output
and text based time series, the UNSCEAR representatives expressed the desire to have
the ATM output also available in a binary format such as in NetCDF. Mr Draxler agreed
to provide this option through the web interface and make the converter available to the
TT members.
3.8
All ATM runs have accounted for wet deposition with NWP estimated rainfall rate,
but have not as yet used the JMA high resolution precipitation analyses (derived from
radar and raingauge data). These data will be available soon to TT members from a
WMO, and from a JMA ftp site.
3.9
Mr Saito presented the Cs-137 deposition results from the JMA ATM using their
mesoscale analyses, currently the only ATM to use these high-resolution data, which
showed considerably more spatial structure than any of the other ATM calculations that
used lower resolution global meteorological fields. He noted that the results are very
sensitive to the source term and slight adjustments to the release rate could have a
significant effect on the deposition pattern. The TT is awaiting the updated source term
information that will be provided by UNSCEAR Group-B.
3.10 The meeting discussed the JMA results using their mesoscale analyses which
suggested sensitivity of the ATM calculations to the vertical motion field. The JMA ATM
results for Cs-137 deposition are shown below for calculations without (top panel) and
with (bottom panel) vertical motion. Mr Saito noted that the observed pattern lies
somewhere between the two calculations.
204
TECHNICAL REPORTS OF THE METEOROLOGICAL RESEARCH INSTITUTE No.76 2015
205
TECHNICAL REPORTS OF THE METEOROLOGICAL RESEARCH INSTITUTE No.76 2015
3.11
The following table summarizes the ATM runs that have been carried out.
Preliminary ATM Calculations (11-31 March 2011)
Center
Meteorology
ATM
Release
Output
CMC
GEM 0.30d
30 levels
6-hourly
MLDP0
dt=5min
601x401 grid
0.05d x 100m
3-hr averaged
NOAA
GDAS 0.50d
56 levels
3-hourly
Meso Analysis
5-km
50 levels
3-hourly
Unified
0.35x0.23 deg
70 levels
3-hourly
ECMWF
0.2x0.2 deg
92 levels
3-hourly
HYSPLIT
dt=6min
1 unit/h
0-100 m
AGL
300K p/3h
1 unit/h
100 m AGL
300K p/3h
1 unit/h
0-100 m
ASL
100K p/3h
1 unit/h
0-100 m
AGL
300K p/3h
1 unit/h
0-100 m
AGL
300K p/3h
JMA
UKMet
ZAMG
Regional
dt=10min
NAME
dt=10min
FLEXPART
dt=variable
601x401 grid
0.05d x 100m
3-hr averaged
721x577 grid
0.05d x 100m
3-hr averaged
600x400
0.05d x 100m
3-hr averaged
3.12 The task team members agreed to provide a short technical document describing
their ATM calculations which will be posted on the web site linked to each ATM. Mr
Isnard and Mr Gering also agreed to provide to the TT members a short description of
their atmospheric transport and dispersion model ATMs.
4.
Evaluation of the sample JMA mesoscale meteorological analysis data files
4.1
Mr Saito presented the details of the JMA meso-analyses produced by a 4DVar
system (ref. JMA, also see report of first TT meeting), and provided to members the
entire dataset for the period 11 – 31 March 2011, at 3-hourly and 5-km horizontal
resolution, in Lambert conformal map projection, which he had brought on memory
sticks. The total dataset size is approximately 57 GB in GRIB2 format; a description of
the dataset is included with the dataset. These data will also be made available to the
larger UNSCEAR community from a WMO Internet accessible site, the exact URL is to
be determined and provided by WMO Secretariat.
4.2
The meeting welcomed the offer of Mr Saito to provide a software tool to convert
these files to latitude-longitude grid, while retaining the vertical hybrid terrain-following
grid and also with an option to convert these data to pressure-level surfaces. Mr Saito
indicated that this tool could be made available by the end of June 2012.
206
TECHNICAL REPORTS OF THE METEOROLOGICAL RESEARCH INSTITUTE No.76 2015
4.4
Mr Isnard and Mr Gering agreed that this JMA mesoanalyses dataset was
probably very suitable for use by their own ATM and dose calculation systems, and will
attempt to use it for their own ATM trials, compare their results with those produced by
TT members and communicate these results with the TT.
4.5
The meeting noted that the intent of the TT was to provide guidance to
UNSCEAR about the best meteorology to use for ATM calculations in their assessment.
The issue was no longer a question of which meteorological analyses was most suitable
to use, but how can the ATM models be optimized to work with the JMA data, whether
computing vertical motion, stability, mixing, or deposition. Several TT members noted
they will have to make changes to use these data which should provide valuable
feedback to UNSCEAR groups planning to use the mesoscale analyses.
5.
Status of verification data for ATM and meteorological evaluation
5.1
The meeting discussed the potential usefulness of CTBTO/IMS/RN data for
verification of ATM results. Mr Wotawa explained to the meeting regarding CTBTO’s
data policy for these data, through informal consultations with the CTBTO/PTS. Aside
from publishing actual data values, all other information generated from the use of such
data may be made openly available to the public. While these data would be very
useful for validating regional/global scale ATM results, there is only monitoring data from
one such RN station (Takasaki) in Japan, located approximately 220 km west-southwest
of Fukushima-Daiichi. The meeting agreed that they would not pursue this matter
further with respect to verification of ATM calculations over Japan, but it might be useful
for global calculations. Several TT members agreed to pursue this matter further,
outside and independently of the current WMO TT ToR.
5.2
Mr Isnard will investigate the availability of other air concentration measurements
at selected sites that could be used for verification.
5.3
Another approach is to use the deposition monitoring data that has been used to
show the complex deposition pattern around the accident site. Mr Gering described
sampling data from Japan, of 2000 data points, that are available from a high density of
soil sampling sites within 100-200 km of the NPP, and he agreed to provide these data
to the TT to evaluate the ATM outputs. Mr Draxler has already put in place a statistics
package to compute the overall performance and ranking of the ATM outputs compared
to measurement data which could then be added to the existing web interface and
distribute to TT members.
6.
Discussion on UNSCEAR requirements
6.1
Mr Peter Bedwell from the UK Health Protection Agency presented an overview
of the work HPA conducted for the World Health Organization’s assessment and the
requirements that the UNSCEAR dose assessment group-C would need from the
UNSCEAR dispersion modeling group-B. He noted that all the initial ATM calculations
for WHO showed large under-predictions of particulate air concentrations outside of
Japan with under-predictions increasing with distance. This was attributed to either
excessive wet scavenging or uncertainty in the source term. Several TT members have
reached similar conclusions using their own ATMs. This confirmed the TT focus on
integrating higher resolution precipitation analysis with the ATM calculations
207
TECHNICAL REPORTS OF THE METEOROLOGICAL RESEARCH INSTITUTE No.76 2015
6.2
Mr Bedwell reviewed some of the ATM technical requirements for UNSCEAR’s
dose calculations. Although he expressed a desire for higher spatial resolution, the TT's
configuration of 3-hourly and 5-km horizontal resolution was consistent with their
requirements.
6.3
The meeting discussed the relationship of the TT ToR with the UNSCEAR
requirements and clarified their respective roles. The WMO TT will be providing the
higher resolution meteorological fields for UNSCEAR ATM calculations and technical
guidance on how to use these analyses. WMO TT will not be doing any dose
calculations for UNSCEAR. However, the UNSCEAR dispersion modeling group may
access the TT ATM calculations to provide uncertainty estimates to their ATM
calculations within the existing evaluation framework.
7.
Review of the Terms of Reference of the WMO Task Team
The TT members reviewed and made one modification to its Terms of Reference, which
is found in Annex III.
8.
Revised Work plan and timetable
The TT reviewed and updated its work plan and time table as follows:
1 - 3 May 2012 – TT meeting, and meeting report
23 May 2012 - 59th session UNSCEAR progress and preliminary report (TT input
provided from TT meeting of Dec. 2011)
31 May 2012 - TT members provide ATM model configuration summary
31 May 2012 - Mr Gering agreed to investigate the provision of surface measurement
data; Mr Isnard agreed to investigate the provision of surface air concentration
measurement data.
June 2012 - JMA high-resolution precipitation analyses and the JMA mesoscale analysis
data converter be shared with TT members
June 2012 - TT discuss via email or teleconference the verification potential of
measurement data
Early July 2012 - (before UNSCEAR all-experts meeting) – teleconference on progress
of TT activities
July 2012 - NOAA (Draxler) to provide DATEM statistical results linked with model
evaluation framework
September 2012 - TT to complete and provide ATM results using JMA meso-analyses.
JMA to provide a comparison of the JMA mesoanalyses of precipitation with the JMA
high-resolution precipitation analyses
December 2012 - third TT meeting, drafting final TT report
208
TECHNICAL REPORTS OF THE METEOROLOGICAL RESEARCH INSTITUTE No.76 2015
May 2013 – 60th session UNSCEAR report
9.
Closing
The meeting was closed at 15:00, Thursday 3 May 2012.
Reference
• Chino, M., Nakayama, H., Nagai, H., Terada, H., Katata, G., Yamazawa, H., 2011.
Preliminary Estimation of Release Amounts of 131I and 137Cs Accidentally Discharged
from the Fukushima Daiichi Nuclear Power Plant into the Atmosphere. Journal of
NUCLEAR SCIENCE and TECHNOLOGY, 48(7), pp.1129–1134.
• Draxler, R. R., Rolph. G.D., 2012. Evaluation of the Transfer Coefficient Matrix
(TCM) approach to model the atmospheric radionuclide air concentrations from
Fukushima.
Journal of GEOPHYSICAL RESEARCH, 117 (D05107), 10pp,
http://www.agu.org/pubs/crossref/2012/2011JD017205.shtml
• JMA reference to mesoscale analyses and high resolution precipitation analyses
209
TECHNICAL REPORTS OF THE METEOROLOGICAL RESEARCH INSTITUTE No.76 2015
Annex I - Agenda
1.
Opening
2.
Adoption of Agenda, working arrangements
3.
Review of preliminary (11-31 March 2011) ATM runs
4.
Evaluation of the sample JMA mesoscale meteorological analysis data files
5.
Status of verification data for ATM and meteorological evaluation
6.
Presentation and discussion of UNSCEAR requirements
7.
Review of the Terms of Reference of the WMO Task Team
8.
Revised Work plan and timetable
9.
Closing
210
TECHNICAL REPORTS OF THE METEOROLOGICAL RESEARCH INSTITUTE No.76 2015
Annex II - List of Participants
Mr Gerhard WOTAWA
Zentralanstalt für Meteorologie und Geodynamik
(ZAMG)
Hohe Warte 38
A-1191 VIENNA
Austria
Tel:
Fax:
Email:
+(43 1) 36026 2007
+(43 1) 369 12 33
[email protected]
Mr Alain MALO
Canadian Meteorological Centre
Meteorological Service of Canada
Environment Canada
2121 Trans-Canada Highway
Dorval, Québec H9P 1J3
Canada
Tel:
Fax:
Email:
+(1 514) 421 4626
+(1 514) 421 4679
[email protected]
Mr Kazuo SAITO
Meteorological Research Institute
Japan Meteorological Agency (JMA)
1-1, Nagamine, Tsukuba
Ibaraki 305-0052
Japan
Tel:
Fax:
Email:
+(81 29) 853 8638
+(81 29) 853 8649
[email protected]
Mr Matthew HORT
Met Office UK
Fitzroy Road
Exeter EX13PB
Devon
United Kingdom
Tel:
Fax:
Email:
(+44 1392) 886 242
(+44 1392) 885 681
[email protected]
Mr Roland DRAXLER
Air Resources Laboratory
NOAA – Office of Oceanic and Atmospheric
Research
SSMC3, Room 3350
1315 East-West Highway
SILVER SPRING, Maryland (MD)
20910-6233
United States of America
Tel:
Fax:
Email:
+(1 301) 713 0295 ext 117
+(1 301) 713 0119
[email protected]
Tel:
Fax:
Email:
+33 (0)1 58 35 73 85
+33 (0)1 46 54 39 89
Tel:
Fax:
+49 (0)3018 333 2576
+49 (0)3018 10 333 2576
Mr Olivier ISNARD (France)
UNSCEAR Study Expert
Institut de Radioprotection et de Sûreté
Nucléaire
B.P. 17 – 92262 Fontenay-aux-Roses
Cedex, France
Mr Florian GERING
UNSCEAR Study Expert
211
[email protected]
TECHNICAL REPORTS OF THE METEOROLOGICAL RESEARCH INSTITUTE No.76 2015
Bundesamt für Strahlenschutz – SW 2.2
Ingolstädter Landstr. 1
D-85764 Oberschleißheim
Germany
Email:
[email protected]
Mr Peter BEDWELL (United Kingdom)
UNSCEAR Study Expert
Health Protection Agency
Chilton, Didcot
Oxfordshire OX11 0RQ, UK
Tel:
Fax:
Email:
+44 (0)1235 827437
+44 (0)1235 833891
[email protected]
Mr Peter CHEN
WMO Secretariat
7 bis avenue de la Paix
Case postale 2300
1211 GENEVE 2
Switzerland
Tel:
Fax:
Email:
+(41 22) 730 8231
+(41 22) 730 8128
[email protected]
212
TECHNICAL REPORTS OF THE METEOROLOGICAL RESEARCH INSTITUTE No.76 2015
ANNEX III - Terms of Reference
WMO Technical Task Team on Meteorological Analyses – Fukushima Daiichi NPP
Accident
Membership and Chairperson
• Roland Draxler, Chairperson (RSMC Washington, USA)
• Matthew Hort (RSMC Exeter, UK)
• Gerhard Wotawa (RSMC Vienna, Austria)
• Kazuo Saito (Meteorological Research Institute, Japan Meteorological Agency,
Japan)
• René Servranckx (Chairperson of CBS Coordination Group on Nuclear ERA,
RSMC Montreal, Canada)
Terms of work
(a)
Determine the relevant meteorological observational data sets and related
information required to support the meteorological analyses and identify their archive
location and availability;
(b)
Determine which of the existing meteorological analyses are of sufficient spatial
and temporal detail that can be used to estimate the atmospheric transport, dispersion,
and surface deposition of radionuclides that were released from the nuclear accident
and identify their archive location and availability;
(c)
Identify gaps in the existing meteorological analyses that if addressed would
make them more suitable for estimating atmospheric transport, dispersion, and
deposition and in coordination with the WMO Secretariat, identify which members will
provide updated analyses;
(d)
Based upon the observational data and analyses, prepare a report on the
temporal and spatial variations in atmospheric conditions during the nuclear accident;
(e)
Evaluate the suitability and quality of the observational data and meteorological
analyses for computing atmospheric transport, dispersion, and surface deposition by
comparing the computational results with radiological measurements;
(f)
Provide a number of atmospheric transport, dispersion and deposition (ATM)
outputs from several different ATMs using different meteorological analyses;
(g)
Liaise and assist where possible with the UN Scientific Committee on the Effects
of Atomic Radiation (UNSCEAR), in their study on the levels and effects of exposure due
to the Fukushima Daiichi nuclear accident.
(h)
Propose possible enhancements to the WMO EER system, including additional
products and/or additional modes of operation with the relevant international
organizations.
Duration and working arrangements
213
TECHNICAL REPORTS OF THE METEOROLOGICAL RESEARCH INSTITUTE No.76 2015
It is anticipated that the work of the Task Team spans a period of 12 -18 months from
December 2011. The Team will work mainly by e-correspondence, and meet face-toface, as needed.
WMO Secretariat will facilitate the work of the team.
(ToR updated, 3 May 2012)
214
TECHNICAL REPORTS OF THE METEOROLOGICAL RESEARCH INSTITUTE No.76 2015
WORLD METEOROLOGICAL ORGANIZATION
THIRD MEETING OF WMO TASK TEAM ON
METEOROLOGICAL
ANALYSES FOR FUKUSHIMA-DAIICHI NUCLEAR
POWER PLANT ACCIDENT
VIENNA, AUSTRIA, 3 – 5 DECEMBER 2012
FINAL REPORT
215
TECHNICAL REPORTS OF THE METEOROLOGICAL RESEARCH INSTITUTE No.76 2015
Dèlia Arnold, Gerhard Wotawa, Matthew Hort, Roland Draxler, Peter Chen,
Stefano Galmarini, Kazuo Saito, René Servranckx
216
TECHNICAL REPORTS OF THE METEOROLOGICAL RESEARCH INSTITUTE No.76 2015
EXECUTIVE SUMMARY
The WMO Task Team on Meteorological Analyses for Fukushima Daiichi NPP
Accident was formed in late 2011 to develop a series of meteorological analyses in
numerical form, using as much observational data and related information as available,
that will be suitable for estimating the atmospheric transport, dispersion and deposition
of radioactivity released from the Fukushima-Daiichi Nuclear Power Plant in 2011. This
is the report of the Task Team’s third and final meeting, whose members developed a
final record of its work and outputs.
Since the time of the Task Team’s second meeting, Mr Draxler engaged the
collaboration of the European Commission Joint Research Centre ENSEMBLE project to
assist in the evaluation of a set of 18 different “runs” of meteorological and atmospheric
dispersion and deposition calculations.
Mr Roland Draxler, the Chairperson of this Task Team, will use the final report
of the team to develop suitable condensed text as input to the study on the levels and
effects of the radioactivity released from the nuclear accident, being conducted by the
United Nations Scientific Committee on the Effects of Atomic Radiation (UNSCEAR).
The report also suggests possible improvements to the present nuclear
emergency response arrangements.
217
TECHNICAL REPORTS OF THE METEOROLOGICAL RESEARCH INSTITUTE No.76 2015
1
Opening
1.1
The third meeting of the WMO Technical Task Team (TT) on Meteorological
Analyses for Fukushima Daiichi NPP Accident was held at the offices of the
Zentralanstalt für Meteorologie und Geodynamik (ZAMG), Vienna, Austria, and opened
by the TT’s chairperson, Mr Roland Draxler. Mr Michael Straudinger, Director of ZAMG
and PR of Austria with WMO, welcomed the participants. He noted the importance of the
work of this Task Team and expected that there would be some important suggestions
for improving WMO’s nuclear emergency response procedures, supporting National
Meteorological Services.
Mr Draxler welcomed the participants and expressed appreciation to all the
participants for their efforts in this work and for participating at this crucial and final
meeting. Mr Peter Chen, on behalf of the WMO Secretariat, added appreciation for the
hard work of members over the last year, the outcome of which will meet the
requirements expressed by the United Nations Scientific Committee on the Effects of
Atomic Radiation (UNSCEAR). Mr Stefano Galmarini of the EC/JRC was invited to
participate at this meeting in relation to the EC/ENSEMBLE assessment tools that were
used to evaluate the atmospheric transport and dispersion runs carried out by the TT
members. The participants expressed their appreciation to ZAMG and Mr Gerhard
Wotawa for hosting the meeting and for having provided the local arrangements for the
meeting.
Mr Draxler recalled the history of this Task Team’s work, including the
development of its Terms of Reference at the first meeting (see first meeting report) and
agreement by Executive Council at its 64th session (2012), and leading up to this third
and final meeting. Mr Draxler also informed the meeting of his participation at, and
interactions with the UNSCEAR Expert Groups. In particular, he indicated that
UNSCEAR had decided in July 2012 that the dose estimation group would use an
ensemble output from the WMO TT as input to their dose calculations. This decision
was a change from an earlier understanding that the WMO was only to provide the best
meteorological analyses during the period 11 – 31 March 2011, to be applied in the
atmospheric transport and dispersion modeling of radionuclides released during the
nuclear power plant accident. The meeting noted that UNSCEAR finally established the
source term time series in mid-October 2012. It was also noted that UNSCEAR requires
a descriptive document on the atmospheric transport and dispersion/deposition results,
and meteorological aspects by 14 December 2012.
1.2
Adoption of agenda and working arrangements
Mr Draxler introduced the provisional agenda, which the meeting adopted, and
is found in Annex I. Daily working arrangements were decided.
1.3
The list of participants is found in Annex II.
2
Final Report of the Task Team
2.1
The TT members each provided a verbal summary of their respective
contributions to this work, and discussed numerous technical issues related to its tasks.
Mr Galmarini of EC/JRC provided a briefing on the ENSEMBLE assessment of the 18
ATM modelling results, including the various metrics used in the evaluation. He agreed
218
TECHNICAL REPORTS OF THE METEOROLOGICAL RESEARCH INSTITUTE No.76 2015
to provide suitable text to describe this assessment to be included in the final report of
the TT.
2.2
The meeting developed a report of the work of the TT, and agreed to undertake
final revisions by the end of January 2013. The version of TT report reached by
21 December 2012 is found in Annex III.
3
AMS Conference session on Fukushima accident
3.1
Mr Draxler recalled that American Meteorological Society (AMS) Committee on
Meteorological Aspects of Air Pollution, and the Meteorological Society of Japan (MSJ)
will jointly convene a one-day specialty symposium at the AMS 2013 Annual Meeting to
review the present status and identify the role of meteorology for the analysis of the
transport and dispersion of contaminants from the Fukushima nuclear power plant.
A special journal publication is planned.
3.2
Mr Draxler has submitted an abstract of his presentation on the work of this TT.
Mr Saito has submitted an abstract of his presentation of the JMA regional ATM for the
accident.
3.3
Mr Draxler considered the opinion of TT members regarding the submission of
an extended abstract to the planned AMS journal publication. Recalling the deadline for
this submission is 10 February 2013, the members were of the general opinion that little
time is available to deal with unresolved scientific questions prior to this deadline.
Mr Saito indicated that he intends to submit an extended abstract for the journal
publication.
3.4
The TT then considered alternative publication opportunities, including the
possibility to initiate collaboration with a suitable scientific journal (e.g. Atmospheric
Environment) to produce a special issue on meteorological aspects of the FukushimaDaiichi accident. Such a special issue could include topic areas such as: source term
estimation, dispersion and deposition estimation, use of high resolution precipitation
analyses, ensemble techniques, etc. Mr Draxler will contact a suitable journal office to
explore this possibility, including time-lines, and whether another similar development is
already underway. Mr Chen will explore with WMO Secretariat whether such a special
publication could be coordinated and developed through WMO. Upon favourable
responses, WMO could invite its Members to participate, including all the RSMCs for
ERA.
3.5
Mr Wotawa indicated that he plans to make a presentation on the TT’s work to
the annual meeting of the European Geophysical Union (Vienna, week of 8 April 2013).
4
Cooperation with the Science Council of Japan (SCJ) model evaluation
4.1
Mr Draxler and Mr Hort were contacted by Mr Teruyuki Nakajima, Chairperson
of the Working Group for model inter-comparison of the Science Council of Japan (SCJ),
who would like to review the modelling capability of the dispersion and deposition of
radioactive materials to the land and the ocean as a result of the Fukushima Daiichi
Nuclear Power Plant accident. The purpose of this initiative is to compare existing model
results in order to access the uncertainty in the results. Mr Draxler provided to
219
TECHNICAL REPORTS OF THE METEOROLOGICAL RESEARCH INSTITUTE No.76 2015
Mr Nakajima the NOAA Web page URL where the TT model results are posted. The
SCJ has subsequently contacted WMO informally regarding its interest, or the interest of
individual TT members to participate.
4.2
The TT decided not to participate as a group, while Mr Saito indicated that JMA
will participate in this model inter-comparison.
5
WMO EER System
5.1
RSMC-ENSEMBLE experiment
5.1.1
Mr Wotawa presented the results of the RSMC ENSEMBLE experiment that
was conducted earlier this year, which was based on a fictitious scenario of a NPP
accident in USA, on 18 April 2012, 0430 UTC. The results showed a wide range of
model results from 9 RSMCs. RSMC Washington is expected to provide its results
shortly.
5.1.2
Mr Wotawa agreed to provide the presentation and a summary of the evaluation
to Mr Servranckx (Chairperson of the CBS Expert Team on ERA). Mr Servranckx will
then communicate this information to the representatives of the RSMCs.
5.1.3
The TT considered the possibility of creating an ENSEMBLE session for the
Fukushima-Daiichi ATM results, to open the participation to other RSMCs and possibly
other ATM centres. Such a project could support the scientific work of contributors to
the possible special journal issue on the meteorological aspects of the FukushimaDaiichi accident (see agenda item 3).
5.2
Enhancement to the WMO EER system based on TT’s experience
5.2.1
The TT discussed the present arrangements, in particular the RSMC-ERA
system that serves both WMO Members, the IAEA, and other relevant International
Organizations. The Secretariat recalled that under IAEA’s Action Plan for Nuclear
Safety, established since the Fukushima accident, provides the IAEA/IEC with a broader
mandate to assess accident situations, and to predict possible impacts. This would be a
more favourable environment to undertake a joint review of IAEA requirements for
meteorological products and services for nuclear ERA.
5.2.2
The following suggestions could be pursued by the CBS Expert Team on ERA
(chaired by Mr Servranckx), and Secretariat:
• Explore if the formation of an interdisciplinary science forum would be
useful to advance the science to support operational ATM programmes
(nuclear, non-nuclear):
• Convene with IAEA, a users requirements conference (previous one was in
1993). This is already in the list of actions of the Expert Team on ERA;
• Discuss informally with IAEA about the concept for a new computational
framework (operational atmospheric dilution factors, and ensembles) for
ATM in ERA, which would provide additional capabilities to IAEA/IEC to
apply source information, and to interpret radiological measurements;
• WMO may wish to contact IAEA at the senior management level regarding
improved meteorological products and services.
220
TECHNICAL REPORTS OF THE METEOROLOGICAL RESEARCH INSTITUTE No.76 2015
6
Future status of the NOAA hosted web page with TT ATDM results
6.1
Mr Draxler offered to continue hosting the web page, and the TT members
gratefully accepted. This web page would be “re-branded” from the current “TT
Meteorological Analysis” site, to become a generic site with tools for incorporating ATM
results for the Fukushima accident, with the possibility for participating ATM centres to
update with improved simulations. In addition Mr Draxler agreed to send the Web php
file(s) to participating centres, in sequence, to update each centre’s information and
attributions (e.g. logo).
7
Closing
7,1
The meeting closed at 17:15, Wednesday, 5 December 2012
221
TECHNICAL REPORTS OF THE METEOROLOGICAL RESEARCH INSTITUTE No.76 2015
ANNEX I - AGENDA
WMO Task Team on Meteorological Analyis of Fukushima-Daiichi NPP Accident
3 – 5 December 2012, Vienna, Austria
1
Opening and adoption of the agenda
2
Final Report of the Task Team
3
AMS Conference session on Fukushima accident
4
Cooperation with the Science Council of Japan (SCJ) model evaluation
5
WMO EER System
5.1
Review and discuss the RSMC-ENSEMBLE experiment
5.2
Recommend enhancements to the WMO EER system
6
Future status of the NOAA hosted web page with TT ATDM results
7
Closing
222
TECHNICAL REPORTS OF THE METEOROLOGICAL RESEARCH INSTITUTE No.76 2015
ANNEX II – List of Participants
Mr Gerhard WOTAWA
Zentralanstalt für Meteorologie und
Geodynamik (ZAMG)
Hohe Warte 38
A-1191 VIENNA
Austria
Tel:
Fax:
Email:
+(43 1) 36026 2007
+(43 1) 369 12 33
[email protected]
Ms Dèlia ARNOLD
Zentralanstalt für Meteorologie und
Geodynamik (ZAMG)
Hohe Warte 38
A-1191 VIENNA
Austria
Tel:
Fax:
Email:
+(43 1) 36026 2007
+(43 1) 369 12 33
[email protected]
Mr Christian MAURER
Zentralanstalt für Meteorologie und
Geodynamik (ZAMG)
Hohe Warte 38
A-1191 VIENNA
Austria
Tel:
Fax:
Email:
+(43 1) 36026 2007
+(43 1) 369 12 33
[email protected]
Mr René SERVRANCKX
Canadian Meteorological Centre
Meteorological Service of Canada
Environment Canada
2121 Trans-Canada Highway
Dorval, Québec H9P 1J3
Canada
Tel:
Fax:
Email:
+(1 514) 421 4704
+(1 514) 421 4679
[email protected]
Mr Kazuo SAITO
Meteorological Research Institute
Japan Meteorological Agency (JMA)
1-1, Nagamine, Tsukuba
Ibaraki 305-0052
Japan
Tel:
Fax:
Email:
+(81 29) 853 8638
+(81 29) 853 8649
[email protected]
Mr Matthew HORT
Met Office UK
Fitzroy Road
Exeter EX13PB
Devon
United Kingdom
Tel:
Fax:
Email:
(+44 1392) 886 242
(+44 1392) 885 681
[email protected]
Mr Roland DRAXLER
Air Resources Laboratory
NOAA – Office of Oceanic and Atmospheric
Research
R/ARL – NCWCP – Rm 4205
Tel:
Fax:
Email:
+(1 301) 683 1372
+(1 301) 683 1370
[email protected]
223
TECHNICAL REPORTS OF THE METEOROLOGICAL RESEARCH INSTITUTE No.76 2015
5830 University Research Court
College Park, Maryland 20740
United States of America
Mr Peter CHEN
WMO Secretariat
7 bis avenue de la Paix
Case postale 2300
1211 GENEVE 2
Switzerland
Tel:
Fax:
Email:
+(41 22) 730 8231
+(41 22) 730 8128
[email protected]
Tel:
Fax:
Email:
+39 0332 785 382
+39 0332 785 466
[email protected]
Invited Expert:
Mr Stefano GALMARINI
EC Joint Research Centre
Via E. Fermi 1, TP 441
21020 Ispra
Italy
224
TECHNICAL REPORTS OF THE METEOROLOGICAL RESEARCH INSTITUTE No.76 2015
ANNEX III
The World Meteorological Organization’s Evaluation of Meteorological Analyses
for the Radionuclide Dispersion and Deposition from the Fukushima-Daiichi
Nuclear Power Plant Accident
Roland Draxler, Delia Arnold, Matthew Hort, Alain Malo, Stefano Galmarini, Kazuo Saito,
Efisio Solazzo, Andrew Jones, Susan Leadbetter, Christian Maurer, Glenn Rolph,
Toshiki Shimbori, Gerhard Wotawa, René Servranckx
http://www.wmo.int/pages/prog/www/CBS-Reports/DPFSERA-index.html
225
TECHNICAL REPORTS OF THE METEOROLOGICAL RESEARCH INSTITUTE No.76 2015
気象研究所技術報告一覧表
第1号
第2号
第3号
第4号
第5号
第6号
第7号
第8号
第9号
第 10 号
第 11 号
第 12 号
第 13 号
第 14 号
第 15 号
第 16 号
第 17 号
第 18 号
第 19 号
第 20 号
第 21 号
バックグラウンド大気汚染の測定法の開発(地球規模大気汚染特別研究班,1978)
Development of Monitoring Techniques for Global Background Air Pollution. (MRI Special Research Group on Global
Atmospheric Pollution, 1978)
主要活火山の地殻変動並びに地熱状態の調査研究(地震火山研究部,1979)
Investigation of Ground Movement and Geothermal State of Main Active Volcanoes in Japan. (Seismology and
Volcanology Research Division, 1979)
筑波研究学園都市に新設された気象観測用鉄塔施設(花房龍男, 藤谷徳之助, 伴野登, 魚津博,1979)
On the Meteorological Tower and Its Observational System at Tsukuba Science City. (T. Hanafusa, T. Fujitani, N. Banno,
and H. Uozu, 1979)
海底地震常時観測システムの開発(地震火山研究部,1980)
Permanent Ocean-Bottom Seismograph Observation System. (Seismology and Volcanology Research Division, 1980)
本州南方海域水温図-400m(又は 500m)深と 1,000m 深-(1934-1943 年及び 1954-1980 年)(海洋研究部,
1981)
Horizontal Distribution of Temperature in 400m (or 500m) and 1,000m Depth in Sea South of Honshu, Japan and Western
-North Pacific Ocean from 1934 to 1943 and from 1954 to 1980. (Oceanographical Research Division, 1981)
成層圏オゾンの破壊につながる大気成分及び紫外日射の観測(高層物理研究部,1982)
Observations of the Atmospheric Constituents Related to the Stratospheric ozon Depletion and the Ultraviolet Radiation.
(Upper Atmosphere Physics Research Division, 1982)
83 型強震計の開発(地震火山研究部,1983)
Strong-Motion Seismograph Model 83 for the Japan Meteorological Agency Network. (Seismology and Volcanology
Research Division, 1983)
大気中における雪片の融解現象に関する研究(物理気象研究部,1984)
The Study of Melting of Snowflakes in the Atmosphere. (Physical Meteorology Research Division, 1984)
御前崎南方沖における海底水圧観測(地震火山研究部・海洋研究部,1984)
Bottom Pressure Observation South off Omaezaki, Central Honsyu. (Seismology and Volcanology Research Division and
Oceanographical Research Division, 1984)
日本付近の低気圧の統計(予報研究部,1984)
Statistics on Cyclones around Japan. (Forecast Research Division, 1984)
局地風と大気汚染質の輸送に関する研究(応用気象研究部, 1984)
Observations and Numerical Experiments on Local Circulation and Medium-Range Transport of Air Pollutions.
(Applied Meteorology Research Division, 1984)
火山活動監視手法に関する研究(地震火山研究部,1984)
Investigation on the Techniques for Volcanic Activity Surveillance. (Seismology and Volcanology Research Division,
1984)
気象研究所大気大循環モデル-Ⅰ(MRI・GCM-Ⅰ)(予報研究部,1984)
A Description of the MRI Atmospheric General Circulation Model (The MRI・GCM-Ⅰ). (Forecast Research Division,
1984)
台風の構造の変化と移動に関する研究-台風 7916 の一生-(台風研究部,1985)
A Study on the Changes of the Three - Dimensional Structure and the Movement Speed of the Typhoon through its Life
Time. (Typhoon Research Division, 1985)
波浪推算モデル MRI と MRI-Ⅱの相互比較研究-計算結果図集-(海洋気象研究部,1985)
An Intercomparison Study between the Wave Models MRI and MRI - Ⅱ - A Compilation of Results -
(Oceanographical Research Division, 1985)
地震予知に関する実験的及び理論的研究(地震火山研究部,1985)
Study on Earthquake Prediction by Geophysical Method. (Seismology and Volcanology Research Division, 1985)
北半球地上月平均気温偏差図(予報研究部,1986)
Maps of Monthly Mean Surface Temperature Anomalies over the Northern Hemisphere for 1891-1981. (Forecast
Research Division, 1986)
中層大気の研究(高層物理研究部, 気象衛星研究部, 予報研究部, 地磁気観測所,1986)
Studies of the Middle Atmosphere. (Upper Atmosphere Physics Research Division, Meteorological Satellite Research
Division, Forecast Research Division, MRI and the Magnetic Observatory, 1986)
ドップラーレーダによる気象・海象の研究(気象衛星研究部・台風研究部・予報研究部・応用気象研究部・海
洋研究部,1986)
Studies on Meteorological and Sea Surface Phenomena by Doppler Radar. (Meteorological Satellite Research Division,
Typhoon Research Division, Forecast Research Division, Applied Meteorology Research Division, and Oceanographical
Research Division, 1986)
気象研究所対流圏大気大循環モデル(MRI・GCM-Ⅰ)による 12 年間分の積分(予報研究部,1986)
Mean Statistics of the Tropospheric MRI・GCM-Ⅰbased on 12-year Integration. (Forecast Research Division, 1986)
宇宙線中間子強度 1983-1986(高層物理研究部,1987)
Multi-Directional Cosmic Ray Meson Intensity 1983-1986. (Upper Atmosphere Physics Research Division, 1987)
226
TECHNICAL REPORTS OF THE METEOROLOGICAL RESEARCH INSTITUTE No.76 2015
第 22 号
第 23 号
第 24 号
第 25 号
第 26 号
第 27 号
第 28 号
第 29 号
第 30 号
第 31 号
第 32 号
第 33 号
第 34 号
第 35 号
第 36 号
第 37 号
第 38 号
第 39 号
第 40 号
第 41 号
第 42 号
第 43 号
静止気象衛星「ひまわり」画像の噴火噴煙データに基づく噴火活動の解析に関する研究(地震火山研究部,1987)
Study on Analysis of Volcanic Eruptions based on Eruption Cloud Image Data obtained by the Geostationary
Meteorological satellite (GMS). (Seismology and Volcanology Research Division, 1987)
オホーツク海海洋気候図(篠原吉雄, 四竃信行,1988)
Marine Climatological Atlas of the sea of Okhotsk. (Y. Shinohara and N. Shikama, 1988)
海洋大循環モデルを用いた風の応力異常に対する太平洋の応答実験(海洋研究部,1989)
Response Experiment of Pacific Ocean to Anomalous Wind Stress with Ocean General Circulation Model.
(Oceanographical Research Division, 1989)
太平洋における海洋諸要素の季節平均分布(海洋研究部,1989)
Seasonal Mean Distribution of Sea Properties in the Pacific. (Oceanographical Research Division, 1989)
地震前兆現象のデータベース(地震火山研究部, 1990)
Database of Earthquake Precursors. (Seismology and Volcanology Research Division, 1990)
沖縄地方における梅雨期の降水システムの特性(台風研究部,1991)
Characteristics of Precipitation Systems During the Baiu Season in the Okinawa Area. (Typhoon Research Division, 1991)
気象研究所・予報研究部で開発された非静水圧モデル(猪川元興・斉藤和雄,1991)
Description of a Nonhydrostatic Model Developed at the Forecast Research Department of the MRI. (M. Ikawa and K.
Saito, 1991)
雲の放射過程に関する総合的研究(気候研究部・物理気象研究部・応用気象研究部・気象衛星・観測システム
研究部・台風研究部,1992)
A Synthetic Study on Cloud-Radiation Processes. (Climate Research Department, Physical Meteorology Research
Department, Applied Meteorology Research Department, Meteorological Satellite and Observation System Research
Department, and Typhoon Research Department, 1992)
大気と海洋・地表とのエネルギー交換過程に関する研究(三上正男・遠藤昌宏・新野 宏・山崎孝治,1992)
Studies of Energy Exchange Processes between the Ocean-Ground Surface and Atmosphere. (M. Mikami, M. Endoh, H.
Niino, and K. Yamazaki, 1992)
降水日の出現頻度からみた日本の季節推移-30 年間の日降水量資料に基づく統計-(秋山孝子,1993)
Seasonal Transition in Japan, as Revealed by Appearance Frequency of Precipitating-Days. -Statistics of Daily
Precipitation Data During 30 Years-(T. Akiyama, 1993)
直下型地震予知に関する観測的研究(地震火山研究部,1994)
Observational Study on the Prediction of Disastrous Intraplate Earthquakes. (Seismology and Volcanology Research
Department, 1994)
各種気象観測機器による比較観測(気象衛星・観測システム研究部,1994)
Intercomparisons of Meteorological Observation Instruments. (Meteorological Satellite and Observation System Research
Department, 1994)
硫黄酸化物の長距離輸送モデルと東アジア地域への適用(応用気象研究部,1995)
The Long-Range Transport Model of Sulfur Oxides and Its Application to the East Asian Region. (Applied Meteorology
Research Department, 1995)
ウインドプロファイラーによる気象の観測法の研究(気象衛星・観測システム研究部,1995)
Studies on Wind Profiler Techniques for the Measurements of Winds. (Meteorological Satellite and Observation System
Research Department, 1995)
降水・落下塵中の人工放射性核種の分析法及びその地球化学的研究(地球化学研究部,1996)
Geochemical Studies and Analytical Methods of Anthropogenic Radionuclides in Fallout Samples. (Geochemical
Research Department, 1996)
大気と海洋の地球化学的研究(1995 年及び 1996 年)(地球化学研究部,1998)
Geochemical Study of the Atmosphere and Ocean in 1995 and 1996. (Geochemical Research Department, 1998)
鉛直2次元非線形問題(金久博忠,1999)
Vertically 2-dmensional Nonlinear Problem (H. Kanehisa, 1999)
客観的予報技術の研究(予報研究部,2000)
Study on the Objective Forecasting Techniques(Forecast Research Department, 2000)
南関東地域における応力場と地震活動予測に関する研究(地震火山研究部,2000)
Study on Stress Field and Forecast of Seismic Activity in the Kanto Region(Seismology and Volcanology Research
Department, 2000)
電量滴定法による海水中の全炭酸濃度の高精度分析および大気中の二酸化炭素と海水中の全炭酸の放射性炭素
同位体比の測定(石井雅男・吉川久幸・松枝秀和,2000)
Coulometric Precise Analysis of Total Inorganic Carbon in Seawater and Measurements of Radiocarbon for the Carbon
Dioxide in the Atmosphere and for the Total Inorganic Carbon in Seawater(I.Masao, H.Y.Inoue and H.Matsueda, 2000)
気象研究所/数値予報課統一非静力学モデル(斉藤和雄・加藤輝之・永戸久喜・室井ちあし,2001)
Documentation of the Meteorological Research Institute / Numerical Prediction Division Unified Nonhydrostatic Model
(Kazuo Saito, Teruyuki Kato, Hisaki Eito and Chiashi Muroi,2001)
大気および海水中のクロロフルオロカーボン類の精密測定と気象研究所クロロフルオロカーボン類標準ガスの
確立(時枝隆之・井上(吉川)久幸,2004)
Precise measurements of atmospheric and oceanic chlorofluorocarbons and MRI chlorofluorocarbons calibration scale
227
TECHNICAL REPORTS OF THE METEOROLOGICAL RESEARCH INSTITUTE No.76 2015
第 44 号
第 45 号
第 46 号
第 47 号
第 48 号
第 49 号
第 50 号
第 51 号
第 52 号
第 53 号
第 54 号
第 55 号
第 56 号
第 57 号
第 58 号
(Takayuki Tokieda and Hisayuki Y. Inoue,2004)
PostScript コードを生成する描画ツール"PLOTPS"マニュアル(加藤輝之,2004)
Documentation of "PLOTPS": Outputting Tools for PostScript Code (Teruyuki Kato,2004)
気象庁及び気象研究所における二酸化炭素の長期観測に使用された標準ガスのスケールとその安定性の再評価
に関する調査・研究(松枝秀和・須田一人・西岡佐喜子・平野礼朗・澤 庸介・坪井一寛・堤 之智・神谷ひ
とみ・根本和宏・長井秀樹・吉田雅司・岩野園城・山本 治・森下秀昭・鎌田匡俊・和田 晃,2004)
Re-evaluation for scale and stability of CO2 standard gases used as long-term observations at the Japan Meteorological
Agency and the Meteorological Research Institute (Hidekazu Matsueda, Kazuto Suda, Sakiko Nishioka, Toshirou Hirano,
Yousuke, Sawa, Kazuhiro Tuboi, Tsutumi, Hitomi Kamiya, Kazuhiro Nemoto, Hideki Nagai, Masashi Yoshida, Sonoki
Iwano, Osamu Yamamoto, Hideaki Morishita, Kamata, Akira Wada,2004)
地震発生過程の詳細なモデリングによる東海地震発生の推定精度向上に関する研究(地震火山研究部,2005)
A Study to Improve Accuracy of Forecasting the Tokai Earthquake by Modeling the Generation Processes (Seismology
and Volcanology Research Department, 2005)
気象研究所共用海洋モデル(MRI.COM)解説(海洋研究部,2005)
Meteorological Research Institute Community Ocean Model (MRI.COM) Manual (Oceanographical Research Department,
2005)
日本海降雪雲の降水機構と人工調節の可能性に関する研究(物理気象研究部・予報研究部,2005)
Study of Precipitation Mechanisms in Snow Clouds over the Sea of Japan and Feasibility of Their Modification by
Seeding (Physical Meteorology Research Department, Forecast Research Department, 2005)
2004 年日本上陸台風の概要と環境場(台風研究部, 2006)
Summary of Landfalling Typhoons in Japan, 2004 (Typhoon Research Department, 2006)
栄養塩測定用海水組成標準の 2003 年国際共同実験報告(青山道夫,2006)
2003 Intercomparison Exercise for Reference Material for Nutrients in Seawater in a Seawater Matrix (Michio Aoyama,
2006)
大気および海水中の超微量六フッ化硫黄(SF6)の測定手法の高度化と SF6 標準ガスの長期安定性の評価(時枝隆
之、石井雅男、斉藤 秀、緑川 貴, 2007)
Highly developed precise analysis of atmospheric and oceanic sulfur hexafluoride (SF6) and evaluation of SF6 standard
gas stability (Takayuki Tokieda, Masao Ishii, Shu Saito and Takashi Midorikawa, 2007)
地球温暖化による東北地方の気候変化に関する研究(仙台管区気象台, 環境・応用気象研究部, 2008)
Study of Climate Change over Tohoku District due to Global Warming (Sendai District Meteorological Observatory,
Atmospheric Environment and Applied Meteorology Research Department, 2008)
火山活動評価手法の開発研究(地震火山研究部, 2008)
Studies on Evaluation Method of Volcanic Activity (Seismology and Volcanology Research Department, 2008)
日本における活性炭冷却捕集およびガスクロ分離による気体計数システムによる 85Kr の測定システムの構築お
よび 1995 年から 2006 年の測定結果(青山道夫, 藤井憲治, 廣瀬勝己, 五十嵐康人, 磯貝啓介, 新田 済, Hartmut
Sartorius, Clemens Schlosser, Wolfgang Weiss, 2008)
Establishment of a cold charcoal trap-gas chromatography-gas counting system for 85Kr measurements in Japan and results
from 1995 to 2006 (Michio Aoyama, Kenji Fujii, Katsumi Hirose, Yasuhito Igarashi, Keisuke Isogai, Wataru Nitta,
Hartmut Sartorius, Clemens Schlosser, Wolfgang Weiss, 2008)
長期係留による 4 種類の流速計観測結果の比較(中野俊也, 石崎 廣, 四竈信行, 2008)
Comparison of Data from Four Current Meters Obtained by Long-Term Deep-Sea Moorings (Toshiya Nakano, Hiroshi
Ishizaki and Nobuyuki Shikama, 2008)
CMIP3 マルチモデルアンサンブル平均を利用した将来の海面水温・海氷分布の推定(水田 亮, 足立恭将, 行本
誠史, 楠 昌司, 2008)
Estimation of the Future Distribution of Sea Surface Temperature and Sea Ice Using the CMIP3 Multi-model Ensemble
Mean (Ryo Mizuta, Yukimasa Adachi, Seiji Yukimoto and Shoji Kusunoki, 2008)
閉流路中のフローセルを用いた分光光度法自動分析装置による海水の高精度 pHT 測定(斉藤 秀, 石井雅男, 緑
川 貴, 井上(吉川)久幸, 2008)
Precise Spectrophotometric Measurement of Seawater pHT with an Automated Apparatus using a Flow Cell in a Closed
Circuit(Shu Saito, Masao Ishii, Takashi Midorikawa and Hisayuki Y. Inoue, 2008)
栄養塩測定用海水組成標準の 2006 年国際共同実験報告(青山道夫,J. Barwell-Clarke, S. Becker, M. Blum, Braga E.S.,
S. C. Coverly, E. Czobik, I. Dahllöf, M. Dai, G. O Donnell, C. Engelke, Gwo-Ching Gong, Gi-Hoon Hong, D. J. Hydes,
Ming-Ming Jin, 葛西広海, R. Kerouel, 清本容子, M. Knockaert, N. Kress, K. A. Krogslund, 熊谷正光, S. Leterme,
Yarong Li, 増田真次, 宮尾 孝, T. Moutin, 村田昌彦, 永井直樹, G. Nausch, A. Nybakk, M. K. Ngirchechol, 小川浩史,
J. van Ooijen, 太田秀和, J. Pan, C. Payne, O. Pierre-Duplessix, M. Pujo-Pay, T. Raabe, 齊藤一浩, 佐藤憲一郎, C.
Schmidt, M. Schuett, T. M. Shammon, J. Sun, T. Tanhua, L. White, E.M.S. Woodward, P. Worsfold, P. Yeats, 芳村 毅, A.
Youénou, Jia-Zhong Zhang, 2008)
2006 Inter-laboratory Comparison Study for Reference Material for Nutrients in Seawater(M. Aoyama, J. Barwell-Clarke,
S. Becker, M. Blum, Braga E. S., S. C. Coverly, E. Czobik, I. Dahllöf, M. H. Dai, G. O. Donnell, C. Engelke, G. C. Gong,
Gi-Hoon Hong, D. J. Hydes, M. M. Jin, H. Kasai, R. Kerouel, Y. Kiyomono, M. Knockaert, N. Kress, K. A. Krogslund, M.
Kumagai, S. Leterme, Yarong Li, S. Masuda, T. Miyao, T. Moutin, A. Murata, N. Nagai, G. Nausch, M. K. Ngirchechol, A.
Nybakk, H. Ogawa, J. van Ooijen, H. Ota, J. M. Pan, C. Payne, O. Pierre-Duplessix, M. Pujo-Pay, T. Raabe, K. Saito, K.
Sato, C. Schmidt, M. Schuett, T. M. Shammon, J. Sun, T. Tanhua, L. White, E.M.S. Woodward, P. Worsfold, P. Yeats, T.
228
TECHNICAL REPORTS OF THE METEOROLOGICAL RESEARCH INSTITUTE No.76 2015
第 59 号
第 60 号
第 61 号
第 62 号
第 63 号
第 64 号
第 65 号
第 66 号
第 67 号
Yoshimura, A. Youénou, J. Z. Zhang, 2008)
気象研究所共用海洋モデル(MRI.COM)第 3 版解説(辻野博之, 本井達夫, 石川一郎, 平原幹俊, 中野英之, 山中吾
郎, 安田珠幾, 石崎廣(気象研究所海洋研究部), 2010)
Reference manual for the Meteorological Research Institute Community Ocean Model (MRI.COM) Version 3(Hiroyuki
Tsujino, Tatsuo Motoi, Ichiro Ishikawa, Mikitoshi Hirabara, Hideyuki Nakano, Goro Yamanaka, Tamaki Yasuda, and
Hiroshi Ishizaki (Oceanographic Research Department), 2010)
栄養塩測定用海水組成標準の 2008 年国際共同実験報告(青山道夫, Carol Anstey, Janet Barwell-Clarke, François
Baurand, Susan Becker, Marguerite Blum, Stephen C. Coverly, Edward Czobik, Florence D’amico, Ingela Dahllöf,
Minhan Dai, Judy Dobson, Magali Duval, Clemens Engelke, Gwo-Ching Gong, Olivier Grosso, 平山篤史, 井上博敬,
石田雄三, David J. Hydes, 葛西広海, Roger Kerouel, Marc Knockaert, Nurit Kress, Katherine A. Krogslund, 熊谷正光,
Sophie C. Leterme, Claire Mahaffey, 光田均, Pascal Morin, Thierry Moutin, Dominique Munaron, 村田昌彦, Günther
Nausch, 小川浩史, Jan van Ooijen, Jianming Pan, Georges Paradis, Chris Payne, Olivier Pierre-Duplessix, Gary Prove,
Patrick Raimbault, Malcolm Rose, 齊藤一浩, 斉藤宏明, 佐藤憲一郎, Cristopher Schmidt, Monika Schütt, Theresa M.
Shammon, Solveig Olafsdottir, Jun Sun, Toste Tanhua, Sieglinde Weigelt-Krenz, Linda White, E. Malcolm. S. Woodward,
Paul Worsfold, 芳村毅, Agnès Youénou, Jia-Zhong Zhang, 2010)
2008 Inter-laboratory Comparison Study of a Reference Material for Nutrients in Seawater(青山道夫, Carol Anstey, Janet
Barwell-Clarke, François Baurand, Susan Becker, Marguerite Blum, Stephen C. Coverly, Edward Czobik, Florence D’
amico, Ingela Dahllöf, Minhan Dai, Judy Dobson, Magali Duval, Clemens Engelke, Gwo-Ching Gong, Olivier Grosso, 平
山篤史, 井上博敬, 石田雄三, David J. Hydes, 葛西広海, Roger Kerouel, Marc Knockaert, Nurit Kress, Katherine A.
Krogslund, 熊谷正光, Sophie C. Leterme, Claire Mahaffey, 光田均, Pascal Morin, Thierry Moutin, Dominique Munaron,
村 田 昌 彦 , Günther Nausch, 小 川 浩 史 , Jan van Ooijen, Jianming Pan, Georges Paradis, Chris Payne, Olivier
Pierre-Duplessix, Gary Prove, Patrick Raimbault, Malcolm Rose, 齊藤一浩, 斉藤宏明, 佐藤憲一郎, Cristopher
Schmidt, Monika Schütt, Theresa M. Shammon, Solveig Olafsdottir, Jun Sun, Toste Tanhua, Sieglinde Weigelt-Krenz,
Linda White, E. Malcolm. S. Woodward, Paul Worsfold, 芳村毅, Agnès Youénou, Jia-Zhong Zhang, 2010)
強雨をもたらす線状降水帯の形成機構等の解明及び降水強度・移動速度の予測に関する研究(大阪管区気象台・
彦根地方気象台・京都地方気象台・奈良地方気象台・和歌山地方気象台・神戸海洋気象台・松江地方気象台・鳥取地
方気象台・舞鶴海洋気象台・広島地方気象台・徳島地方気象台・予報研究部, 2010)
Studies on formation process of line-shaped rainfall systems and predictability of rainfall intensity and moving speed
(Osaka District Meteorological Observatory, Hikone Local Meteorological Observatory, Kyoto Local Meteorological
Observatory, Nara Local Meteorological Observatory, Wakayama Local Meteorological Observatory, Kobe Marine
Observatory, Matsue Local Meteorological Observatory, Tottori Local Meteorological Observatory, Maizuru Marine
Observatory, Hiroshima Local Meteorological Observatory, Tokushima Local Meteorological Observatory AND Forecast
Research Department, 2010)
WWRP 北京オリンピック 2008 予報実証/研究開発プロジェクト(齊藤和雄, 國井勝, 原昌弘, 瀬古弘, 原旅人, 山
口宗彦, 三好建正, 黄偉健, 2010)
WWRP Beijing Olympics 2008 Forecast Demonstration/Research and Development Project (B08FDP/RDP)(Kazuo Saito,
Masaru Kunii, Masahiro Hara, Hiromu Seko, Tabito Hara, Munehiko Yamaguchi, Takemasa Miyoshi and Wai-kin Wong,
2010)
東海地震の予測精度向上及び東南海・南海地震の発生準備過程の研究(地震火山研究部, 2011)
Improvement in prediction accuracy for the Tokai earthquake and research of the preparation process of the Tonankai and
the Nankai earthquakes (Seismology and Volcanology Research Department, 2011)
気象研究所地球システムモデル第 1 版(MRI-ESM1)―モデルの記述―(行本誠史, 吉村裕正, 保坂征宏, 坂見
智法, 辻野博之, 平原幹俊, 田中泰宙, 出牛真, 小畑淳, 中野英之, 足立恭将, 新藤永樹, 籔将吉, 尾瀬智昭, 鬼頭
昭雄, 2011)
Meteorological Research Institute-Earth System Model Version 1 (MRI-ESM1) — Model Description — (Seiji Yukimoto,
Hiromasa Yoshimura, Masahiro Hosaka, Tomonori Sakami, Hiroyuki Tsujino, Mikitoshi Hirabara, Taichu Y. Tanaka,
Makoto Deushi, Atsushi Obata, Hideyuki Nakano, Yukimasa Adachi, Eiki Shindo, Shoukichi Yabu, Tomoaki Ose and Akio
Kitoh, 2011)
東南アジア地域の気象災害軽減国際共同研究(斉藤和雄, 黒田徹, 林修吾, 瀬古弘, 國井勝, 小司禎教, 上野充,
川畑拓矢, 余田成男, 大塚成徳, Nurjanna Joko Trilaksono, 許智揚, 古関俊也, Le Duc, Kieu Thi Xin, 黄偉健,
Krushna Chandra Gouda, 2011)
International Research for Prevention and Mitigation of Meteorological Disasters in Southeast Asia (Kazuo Saito, Tohru
Kuroda, Syugo Hayashi, Hiromu Seko, Masaru Kunii, Yoshinori Shoji, Mitsuru Ueno, Takuya Kawabata, Shigeo Yoden,
Shigenori Otsuka, Nurjanna Joko Trilaksono, Tieh-Yong Koh, Syunya Koseki, Le Duc, Kieu Thi Xin, Wai-Kin Wong and
Krushna Chandra Gouda, 2011)
太平洋における大気-海洋間二酸化炭素フラックス推定手法(杉本裕之, 平石直孝, 石井雅男, 緑川貴, 2012)
A method for estimating the sea-air CO2 flux in the Pacific Ocean (Hiroyuki Sugimoto, Naotaka Hiraishi, Masao Ishii and
Takashi Midorikawa, 2012)
太平洋における大気-海洋間二酸化炭素フラックス推定手法(坪井一寛, 松枝秀和, 澤庸介, 丹羽洋介, 中村雅
道, 久保池大輔, 岩坪昇平, 齊藤和幸, 花宮義和, 辻健太郎, 大森英裕, 西秀紘, 2012)
Development of a flask sampling and its high-precision measuring system for greenhouse gases observations using a cargo
aircraft C-130H (Kazuhiro Tsuboi, Hidekazu Matsueda, Yousuke Sawa, Yosuke Niwa Masamichi Nakamura, Daisuke
229
TECHNICAL REPORTS OF THE METEOROLOGICAL RESEARCH INSTITUTE No.76 2015
第 68 号
第 69 号
第 70 号
第 71 号
第 72 号
第 73 号
第 74 号
第 75 号
Kuboike, Shohei Iwatsubo, Kazuyuki Saito Yoshikazu Hanamiya, Kentaro Tsuji, Hidehiro Ohmori, Hidehiro Nishi, 2012)
国際シンポジウム 電子顕微鏡を用いたエアロゾル研究(五十嵐康人, Weijun Li, Peter.R.Buseck, 岡田菊雄, 張代
洲, 足立光司, 藤谷雄二, 嶋寺光, 五藤大輔, 三井千珠, 野島雅, 大島長, 松井仁志, 石元裕史, 松木篤, Pradeep
Khatri, 中山智喜, 向井将平, 大石乾詞, 間山憲仁, 坂本哲夫, 直江寛明, 財前祐二, 塩流水洋樹, 田中泰宙, 梶野
瑞王, 2013)
International Symposium on Aerosol Studies Explored by Electron Microscopy (Yasuhito Igarashi, Weijun Li, Peter. R.
Buseck, Kikuo Okada, Daizhou Zhang, Kouji Adachi, Yuji Fujitani, Hikari Shimadera, Daisuke Goto, Chizu Mitsui,
Masashi Nojima, Naga Oshima, Hitoshi Matsui, Hiroshi Ishimoto, Atsushi Matsuki, Pradeep Khatri, Tomoki Nakayama,
Shohei Mukai, Kenji Ohishi, Norihito Mayama, Tetsuo Sakamoto, Hiroaki Naoe, Yuji Zaizen, Hiroki Shiozuru, Taichu Y.
Tanaka and Mizuo Kajino, 2013)
マグマ活動の定量的把握技術の開発とそれに基づく火山活動度判定の高度化に関する研究(地震火山研究部,
2013)
Development of Quantitative Detection Techniques of Magma Activity and Improvement of Evaluation of Volcanic
Activity Level (Seismology and Volcanology Research Department, MRI, 2013)
平成 23 年(2011 年)東北地方太平洋沖地震による津波高の現地調査報告(林豊,前田憲二,対馬弘晃,岡田正
實,木村一洋,岩切一宏, 2013)
Reports on Field Surveys of Tsunami Heights from the 2011 off the Pacific Coast of Tohoku Earthquake (Yutaka Hayashi,
Kenji Maeda, Hiroaki Tsushima, Masami Okada, Kazuhiro Kimura and Kazuhiro Iwakiri, 2013)
気候研究のための気象研究所アンサンブル予測システムの概要とその応用(藪将吉,水田亮,吉村裕正,黒田
友二,向川均, 2014)
Meteorological Research Institute Ensemble Prediction System (MRI-EPS) for climate research - Outline and its
applications – (Shoukichi Yabu, Ryo Mizuta, Hiromasa Yoshimura, Yuhji Kuroda, and Hitoshi Mukougawa, 2014)
日本各地域の繰り返し相似地震発生状況に関する研究(地震火山研究部,地震火山部,気象大学校,札幌管区
気象台,仙台管区気象台,大阪管区気象台,福岡管区気象台,沖縄気象台, 2014)
Survey of moderate repeating earthquakes in Japan (Seismology and Volcanology Research Department of MRI,
Seismology and Volcanology Department, Meteorological College, Sapporo Regional Headquarters, Sendai Regional
Headquarters, Osaka Regional Headquarters, Fukuoka Regional Headquarters, and Okinawa Regional Headquarters, 2014)
気象研究所非静力学地域気候モデルによる日本付近の将来気候変化予測について(佐々木秀孝,村田昭彦,川
瀬宏明,花房瑞樹,野坂真也,大泉三津夫,水田亮,青栁曉典,志藤文武,石原幸司, 2015)
Projection of Future Climate Change around Japan by using MRI Non-hydrostatic Regional Climate Model (Hidetaka
Sasaki, Akihiko Murata, Hiroaki Kawase, Mizuki Hanafusa, Masaya Nosaka, Mitsuo Oh’izumi, Ryou Mizuta, Toshinori
Aoyagi, Fumitake Shido, and Koji Ishihara, 2015)
新型自己浮上式海底水圧計の開発(平田賢治, 山崎明, 対馬弘晃, 2015)
Development of a new pop-up ocean-bottom pressure gauge (Kenji Hirata, Akira Yamazaki, and Hiroaki Tsushima, 2015)
2012年・2013年に日本に接近・上陸した台風の概要と特性(北畠尚子, 小山亮, 嶋田宇大, 櫻木智明, 沢田雅洋,
2015)
Summary and Characteristics of Approaching and Landfalling Tropical Cyclones in Japan in 2012 and 2013 (Naoko
Kitabatake, Ryo Oyama, Udai Shimada, Tomoaki Sakuragi and Masahiro Sawada, 2015)
230
1 9 4 6(昭和2 1)年
設 立
所
長 :永 田
雅
研究総務官 :蒲 地 政 文
研究調整官 :竹 内 義 明
予
報
研
究
部
気
候
研
究
部
台
風
研
究
部
環 境 ・ 応 用 気 象 研 究 部
気象衛星・観測システム研究部
地 震 津 波 研 究 部
火
山
研
究
部
海 洋 ・ 地 球 化 学 研 究 部
気
象
研
究
部
部
部
部
部
部
部
部
所
長
長
長
長
長
長
長
長
技
:
:
:
:
:
:
:
:
術
理 博 齊 藤 和 雄
理 博 尾 瀬 智 昭
高 野
功
理 博 高 藪
出
理 博 角 村
悟
理 博 前 田 憲 二
理 博 山 里
平
理 博 倉賀野
連
報
告
編集委員長:尾 瀬 智 昭
編集委員 : 益
出
高
事 務 局 : 斉
子
渉
石 井 正 好
沢 田 雅 洋
牛
真
泉
敏 治
木 村 一 洋
木 朗 充
中 野 英 之
藤 貞 夫
小 野 景 子
気 象 研 究 所 技 術 報 告 は , 1978( 昭 和 53) 年 の 初 刊 以 来 ,気 象 研 究 所 が 必 要 の 都 度 発 行 す る 刊 行 物 で あ り ,
気 象 研 究 所 の 研 究 計 画 に 基づ き 実 施 し た 研 究 に 関 す る 手 法 、 デ ー タ 、 結 果 等 に つい て の ま と め、 ま た は 、
す で に 公 表 し た 研 究 論 文 類 を と り ま と め 総 合的報告とした ものを 掲載する 。
本 紙 に 掲 載 され た 報 告 の 著 作 権 は 気 象 研究 所に帰 属する 。本紙に掲載された報告を 引用 する場合 は,出所
を 明 示 す れ ば 気 象 研 究 所 の 許 諾 を 必 要 と し な い 。 本 紙に 掲 載 さ れ た報 告 の 全 部 又は 一 部 を 複 製, 転 載 , 翻
訳 , あ る い は そ の 他 に 利 用 す る 場 合 は 気 象 研 究 所 の 許諾 を 得 な け れば な ら な い 。個 人 が 研 究 ,学 習 , 教 育
に 使 用 する場 合 は,出 所 を 明 示 す れ ば 気 象 研 究所の許諾を 必要と しない。
ONLINE ISSN 2189-8871
気
象
研
究
所
技
第
76
号
平成 27 年 10 月
編 集 兼
発 行 者
気
象
研
術
報
告
発行
究
所
〒305-0052 茨城県つくば市長峰1-1
TEL(029)853-8535
© Copyright 2026 Paperzz