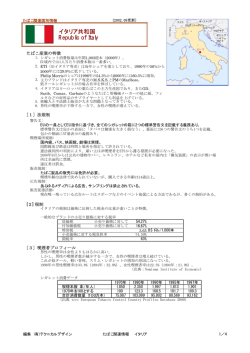
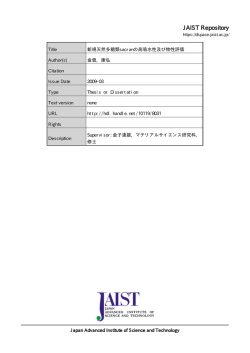
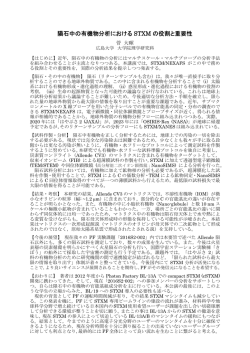
米地方公務員年金に関する調査研究
平成 26 年度 研究報告書
平成 27(2015)年 3 月
公益財団法人 年金シニアプラン総合研究機構
〒108-0074 東京都港区高輪 1 丁目 3 番 13 号 NBF 高輪ビル
TEL:03-5793-9411
FAX:03-5793-9413
URL:http://www.nensoken.or.jp
目
次
はじめに ............................................................................................................................... 1
第1章
米地方公務員年金の概要と制度改革
1
規模と概要 ..................................................................................................................3
2
米地方公務員年金の特徴.............................................................................................6
2.1
確定給付年金(DB プラン)が主流.....................................................................6
2.2
オルタナティブ投資へのシフト ...........................................................................7
2.3
投資対象資産クラスの拡大 ..................................................................................8
2.4
リスクを意識したアセットアロケーションへの試み ..........................................9
3
ファンディング比率 ..................................................................................................10
4
金融危機以降の制度改革...........................................................................................15
5
確定給付年金制度(DB プラン)からの移行...........................................................20
5.1
確定拠出年金(DC プラン) .............................................................................21
5.2
キャッシュバランス・プラン.............................................................................23
5.3
ハイブリッド・プラン .......................................................................................24
5.4
DB プラン/DC プラン/ハイブリッド・プラン選択型................................... 26
第2章
米地方公務員年金の資産運用
1
概要 ...........................................................................................................................28
2
アセットアロケーション...........................................................................................30
3
資産クラスとベンチマーク .......................................................................................33
4
3.1
株式 .....................................................................................................................34
3.2
債券 .....................................................................................................................35
3.3
実物資産(Real Assets) ...................................................................................36
3.4
実質リターン(Real Return) ..........................................................................37
3.5
インフレ対応資産クラス ....................................................................................38
リスク・ベースのアセットアロケーション .............................................................39
4.1
カリフォルニア州職員退職年金基金(CalPERS) ..............................................40
4.2
ミズーリ州職員退職年金(MOSERS) ...............................................................42
4.3
サンディエゴ・カウンティ職員退職基金(SDCERA) ...................................... 46
4.4
カリフォルニア州教職員退職年金基金(CalSTRS) ..........................................49
4.5
ハワイ州職員退職年金(HIERS) .......................................................................51
4.6
テキサス州教職員退職年金(TRS-TX) ................................................................55
4.7
ウィスコンシン州投資理事会(SWIB) ................................................................56
4.8
オハイオ警察&消防年金ファンド(OP&F) .........................................................57
4.9
ノースカロライナ州退職年金(NCRS)................................................................58
第3章
米地方公務員年金のオルタナティブ投資
1
概要 ...........................................................................................................................61
2
プライベート・エクイティ .......................................................................................65
3
不動産 ........................................................................................................................69
4
ヘッジファンド .........................................................................................................72
5
インフラストラクチャー...........................................................................................75
6
森林投資・農地投資 ..................................................................................................76
7
コモディティ .............................................................................................................78
8
リスク・パリティ .....................................................................................................79
9
グローバル・タクティカル・アセット・アロケーション(GTAA) ...................... 82
10 投資対象資産と組入資産クラス名称一覧 .................................................................83
第4章
主要米地方公務員年金概要データ
1
ターゲット・アロケーション ...................................................................................89
2
アセットアロケーション...........................................................................................94
3
パフォーマンス .........................................................................................................99
4
ファンディング比率 ................................................................................................ 106
5
その他 ...................................................................................................................... 115
参考文献 ........................................................................................................................ 123
調査研究体制
研究員
樺山 和也
主任研究員
白神 啓一郎 主任研究員
アドバイザー
長野 誠治
主任研究員
福山 圭一
専務理事
小野 暁史
審議役
はじめに
約 15 兆㌦の巨大市場となっている米国退職年金市場 1にあって、米地方公務員年金の確定給
付年金(DBプラン)は、約 25%のウェイトを持つ大きな存在である。
米地方公務員年金には、カリフォルニア州職員退職年金基金(CalPERS)やカリフォルニア州
教職員退職年金基金(CalSTRS)といった、日本でも名を知られた巨大年金から、市町村レベル
の行政区よりもさらに細かいタウンシップ(Township)や地域の学校区(School District)のみの
職員を対象とする極めて小規模な退職システムまで、多種多様なものが混在している。
米国務省国勢調査局(United States Census Bureau)の 2012 年のデータによれば、全米には
3,998 の地方公務員年金(State and Local Retirement System)が存在しており、合計の現職加
入者数は 1,437 万人、年金受給者数 901 万人とされている 2。
米国は連邦国家であることから、州ごとに州内の地方公務員年金制度を規定する法律が異な
るため、拠出や給付の制度や組織、ガバナンスや運用体制も様々である。州政府職員、郡(カ
ウンティ)や市町村職員、警察・消防職員、公立学校教員、学校職員、裁判所職員、議会職員
など、職種や職域によって細かく退職年金基金が分れている州 3もあれば、メイン州やハワイ
州のように州内の年金基金が一本化されている州もある。
ガバナンスに関しては、理事会方式を採用し一定の独立性を確保している年金基金が大半と
なっている。資産運用に関しては、運用の専門組織として州投資委員会(State Investment
Board)等、州内の公務員年金の資産運用の一部または全てを統合して運用する機関を設置して
いる州も多い。
米地方公務員年金 DB プランの財政状況は、2000 年代前半の IT バブル崩壊と金融危機の発
生という 2 度の資産運用パフォーマンス低迷期を受け悪化し、足元の比較的堅調なパフォーマ
ンスにより改善の方向にはあるものの引き続き厳しい状況におかれている。
年金財政悪化への米地方公務員年金の対応としては、①加入者拠出金の引き上げや給付・受
給資格の見直し等制度改正、②DB プランからの移行の検討、③リスクを意識した資産運用へ
の見直し等が実施されている。
加入者拠出率や給付条件・受給資格の見直し等は、金融危機後にほぼ全ての州において実施
されているが、多くの州において州憲法等の規定により地方公務員の既得権は保護されている
ことから、大半の州では今後の新規雇用者にのみ適用される制度改正となっており、既存加入
者をも対象とした制度改正の試みに対しては、いくつかの州では訴訟も起こされている。
確定給付年金(DB プラン)から他の制度への移行の検討も多くの州で実施されている。確
定拠出年金(DC プラン)への移行が大きく進んでいる米企業年金とは異なり、米地方公務員
Investment Company Institute (ICI)のデータによると 2014 年 9 月末の米国退職年金市場(IRA 勘定と
Annuity を除く)の資産残高は、14 兆 8,940 億ドルとなっている。
2
他に将来の年金受給資格を持つ非現職職員(Inactive Member)が 521 万人いる。
3
ペンシルバニア州には 1,580(州レベル 3、自治体レベル 1,577)地方公務員年金があり、イリノイ州(656)
やフロリダ州(472)なども多い。州レベルの地方公務員年金の数だけでみると、ルイジアナ州(14)、マサチュー
セッツ州(14)、ミズーリ州(10)、ジョージア州(10)などが多い。
1
1
年金では、DB プランが引き続き制度の主流となっているが、金融危機後の制度の見直しにお
いても DC プランへの移行はほとんど見られていない。
加入者に対して DB プランのみを提供する基金の数は着実に減少してきてはいるが、制度改
革の方向性は米企業年金とは異なり DC プランではなく、DB と DC を結合したハイブリッド・
プランやキャッシュバランス・プランの採用、あるいは加入者が DB プラン、DC プラン、ハ
イブリッド・プランの中から参加プランを選択する方式を導入する州が多い状況である。
DC プランへの移行としては、オクラホマ州が 2015 年 11 月以降の新規雇用者(カウンティ
職員等は除く)に対して DB プランを凍結して、DC プランに切り替えるのが例外的な存在と
なっている。また、過去に DC プランを導入したいくつかの州では、DC プランを凍結し、DB
プランやハイブリッド・プランへと戻す動きも見られている。
米地方公務員年金の資産運用では、金融危機後もオルタナティブ資産へのシフトの動きは変
わっておらず、インフラ投資、森林投資(Timber)、レバレッジド・ローン、MLP(Master Limited
Partnerships)など新しい資産クラスへの投資の拡大傾向も変わっていないように見える。
ただし、金融危機時に資産クラスの分散をどれだけ進めていても分散効果がほとんど得られ
なかった経験から、「資産」の分散ではなく、リスク・ファクターに注目し「リスク」の分散
を図っていこうという試みが多く見られている。
資産クラスという面では、従来の「株式」、「債券」、「オルタナティブ」といった区分から、
リスク・ファクターを意識した資産区分へと変更する動きが増加している。また、資産クラス
ではなく、リスク・ファクターに注目したアセットアロケーションを導入しようとする試みも
一部で見られている。リスク・ベースのアセットアロケーションをポートフォリオ全体に採用
するにあたっての最大の障壁は、理論上当然の帰結ではあるものの、ポートフォリオのリスク
を抑えることによって期待リターンも大きく低下してしまうことにある。期待リターンの大幅
引き下げは、法改正を必要とする雇用者/加入者の拠出率の大幅引き上げ等を伴うことになる
ため、基金独自の判断だけでは決断できないこと、一定の期待リターンを維持したままポート
フォリオ全体のリスクを低下させるためには、ポートフォリオにレバレッジを掛ける必要性が
生まれるが、レバレッジを適正なリスク管理の下で使いこなせるだけの経験を持つ年金基金は
少ないこと、レバレッジが持つネガティブなイメージから「投機的」との批判を浴びやすいこ
と等から実際に導入に踏み切った基金は極めて少ない状況にある。
本報告書は、米地方公務員年金の概要について、制度と資産運用の両面から調査したもので
ある。米地方公務員年金の制度及び資産運用改革は多様なものとなっており、方向性も様々で
制度や環境の違いもあることから、多くは、国内年金資金等にそのままあてはめることはでき
ないものと思われるが、本報告書が何らかの参考となれば幸甚である。
2
第1章
米地方公務員年金の概要と制度改革
1 規模と概要
カリフォルニア州職員退職年金基金(CalPERS)やカリフォルニア州教職員退職年金基金
(CalSTRS)などに代表される米地方公務員年金は、米公的年金とも表記されることもあるが、
日本の年金積立金管理運用独立行政法人(GPIF)やカナダの Canada Pension Plan Investment
Board(CPPIB)など、広く国民一般を対象とした公的年金制度ではない。企業年金等民間セク
ターの職員向け年金(Private Pension Plan)に対応する、公的セクター職員向け年金(Public
Pension Plan)である。
米国務省国勢調査局(United States Census Bureau)の 2012 年のデータによれば、全米には
3,998 の地方公務員年金(State and Local Retirement System)が存在しており、合計の現職加
入者数は 1,437 万人、年金受給者 901 万人、将来の年金受給資格を持つ退職者等の非現職加入
者(Inactive Member)521 万人となっている。
米国は連邦国家であることから、州ごとに州内の地方公務員年金制度を規定する法律が異な
るため、拠出や給付の制度や組織、ガバナンスや運用体制も様々である。州政府職員、郡(カ
ウンティ)や市町村職員、警察・消防職員、公立学校教員、学校職員、裁判所職員、議会職員
など、職種や職域によって細かく退職年金基金が分れている州もあれば、メイン州やハワイ州
のように州内の年金基金が一本化されている州もある。
また、カリフォルニア州職員退職年金基金(CalPERS)やカリフォルニア州教職員退職年金基
金(CalSTRS)といった、日本でも名を知られた巨大年金もあれば、市町村レベルの行政区より
もさらに細かいタウンシップ(Township)や地域の学校区(School District)のみの職員を対象と
する極めて小規模な退職システムまで、規模の面からみても極めて多様である。
[図表 1-1] 米国の地方公務員年金システムの概要
State and Type of Government
United States
State
Local
County
Municipality
Township
Special District
School District
Number of
systems
3,998
227
3,771
174
2,534
710
334
19
Total
19,587,970
17,544,912
2,043,058
561,808
1,217,193
44,419
146,411
73,227
Membership
Active
Inactive
Members
Members
14,374,391
5,213,579
12,643,450
4,901,462
1,730,941
312,117
473,523
88,285
1,031,784
185,409
37,437
6,982
128,889
17,522
59,308
13,919
Total beneficiaries
receiving periodic
benefit payments
9,012,347
7,622,748
1,389,599
320,720
901,367
26,092
94,801
46,619
出所:U.S. CENSUS BUREAU 4
U.S. CENSUS BUREAU (2013), “2012 Annual Survey of Public Pensions: State- and
Locally-Administered Defined Benefit Data”
4
3
Investment Company Institute (ICI)のデータによると 2014 年 9 月末の米国退職年金市場
(IRA 勘定と Annuity を除く)の資産残高は、14 兆 8,940 億ドルとなっている。
米国企業年金においては、確定給付年金(DB プラン)から確定拠出年金(DC プラン)へ
のシフトが進んでいることもあり、米地方公務員年金 DB プランは、DB プランの中では最大
の約 25%のウェイトを持ち、資産残高は 3 兆 7,260 億㌦となっている。
世界最大の年金とされる日本の年金積立金管理運用独立行政法人(GPIF)の 2014 年 9 月末の
運用資産額が 130 兆 8,846 億円であるため、米地方公務員年金は合計すれば GPIF の 3 倍を超
える運用資産残高を持っている。
また、米年金で最大の規模を持つのは連邦公務員向けの DC プランである Thrift Savings
Plan (TSP) であるが、上位 10 年金のうち 7 つを米地方公務員年金が占めている。
[図表 1-2] 米国退職年金市場の資産構成比 5
$16,000
$14,000
$12,000
$10,000
$8,000
$6,000
$4,000
2014:Q3
単位:10億㌦
Federal
DB
plans
9%
Federal DB plans
State and local gov DB plans
Private-sector DB plans
State
and
local
gov DB
plans
25%
DC plans
$2,000
1974
1976
1978
1980
1982
1984
1986
1988
1990
1992
1994
1996
1998
2000
2002
2004
2006
2008
2010
2012
2014:Q3
$0
DC
plans
45%
Privatesector
DB
plans
21%
出所:ICI より年金シニアプラン総合研究機構作成
[図表 1-3] 米年金 TOP10 (単位:百万㌦)
Federal Retirement Thrift
California Public Employees
California State Teaches
Assets
Total DB
Total DC
375,088
375,088
273,066
271,454
1,612
172,424
171,991
433
New York State Common
Florida State Board
164,008
146,266
164,008
138,002
8,264
New York City Retirement
Texas Teachers
Boeing
IBM
143,925
119,706
98,922
96,598
143,925
119,706
56,628
52,681
42,294
43,917
New York State Teachers
96,440
96,440
出所:Pensions & Investments 誌 2014 年 2 月 3 日号
5
ICI のデータから IRA 勘定と Annuity を除外している。
4
[図表 1-4] 州別の基金数・加入者数・受給者数
州
Alabama
Alaska
Arizona
Arkansas
California
Colorado
Connecticut
Delaware
District of Columbia
Florida
Georgia
Hawaii
Idaho
Illinois
Indiana
Iowa
Kansas
Kentucky
Louisiana
Maine
Maryland
Massachusetts
Michigan
Minnesota
Mississippi
Missouri
基金数
Membership
11
6
7
33
63
67
61
8
7
472
34
1
4
656
69
9
8
22
35
1
19
100
136
145
4
66
271,030
44,849
471,985
161,073
2,296,468
424,202
148,246
47,724
21,763
728,270
650,476
72,508
92,008
941,757
275,288
238,502
201,102
336,494
305,434
57,992
298,773
355,723
353,061
517,917
294,946
340,075
(Active
Members)
236,974
36,197
263,648
134,949
1,679,222
232,111
133,894
44,577
19,844
611,057
404,495
65,599
65,321
611,805
233,954
169,126
158,042
216,875
212,730
50,394
244,330
300,439
318,091
287,687
163,058
279,959
(Inactive
Members)
34,056
8,652
208,337
26,124
617,246
192,091
14,352
3,147
1,919
117,213
245,981
6,909
26,687
329,952
41,334
69,376
43,060
119,619
92,704
7,598
54,443
55,284
34,970
230,230
131,888
60,116
Total
州
beneficiaries
113,084
39,741
143,721
70,600
1,136,296
117,688
108,355
27,778
10,262
390,795
198,544
40,774
37,295
444,735
131,193
106,660
87,040
139,729
163,269
38,408
172,282
200,218
359,198
187,656
89,707
169,257
Montana
Nebraska
Nevada
New Hampshire
New Jersey
New Mexico
New York
North Carolina
North Dakota
Ohio
Oklahoma
Oregon
Pennsylvania
Rhode Island
South Carolina
South Dakota
Tennessee
Texas
Utah
Vermont
Virginia
Washington
West Virginia
Wisconsin
Wyoming
United States
出所:U.S. CENSUS BUREAU
5
基金数
9
13
2
4
10
5
8
8
11
6
12
6
1,580
14
6
4
15
132
9
5
19
26
41
3
6
3,998
Membership
76,278
97,780
111,213
60,631
629,223
156,216
1,389,155
658,637
41,823
1,264,148
172,394
215,988
692,440
45,774
384,837
54,228
282,253
1,738,847
143,801
33,835
521,636
286,860
95,756
437,931
48,620
19,587,970
(Active
Members)
53,217
70,735
98,551
52,638
404,446
114,670
1,186,893
503,793
32,760
666,598
155,972
173,356
539,559
37,533
214,762
39,300
242,865
1,441,047
106,512
25,958
398,978
236,840
75,978
285,257
41,795
14,374,391
(Inactive
Members)
23,061
27,045
12,662
7,993
224,777
41,546
202,262
154,844
9,063
597,550
16,422
42,632
152,881
8,241
170,075
14,928
39,388
297,800
37,289
7,877
122,658
50,020
19,778
152,674
6,825
5,213,579
Total
beneficiaries
34,967
29,738
50,258
29,001
282,971
68,444
852,966
237,486
15,952
429,782
101,444
124,550
448,408
33,171
129,469
23,426
146,789
575,809
48,728
14,954
202,223
147,337
57,007
180,016
23,166
9,012,347
2 米地方公務員年金の特徴
2.1
確定給付年金(DB プラン)が主流
米地方公務員年金の特徴の一つとして、現在も確定給付年金(DB プラン)が圧倒的に高
いウェイトを占めていることが挙げられる。
米地方公務員年金でも、IT バブルの崩壊とリーマンショック後の金融危機という、2 度
の年金資産利回りの低迷の時期を経てファンディング比率が低下したことを受け、確定給
付年金制度(DB プラン)を見直す動きは高まっているものの、企業年金とは異なり確定拠
出年金(DC プラン)へと移行する動きはほとんど見られず、キャッシュバランス・プラン
やハイブリッド・プランへの移行は一部で見られるものの、引き続き DB プランが主力制
度として高いウェイトを占めている。
[図表 1-5] 米地方公務員年金と米企業年金の比較
9,000
8,000
7,000
6,000
5,000
10億㌦
9,000
米地方公務員年金
8,000
7,000
DCプラン
6,000
DBプラン
5,000
4,000
3,000
3,000
2,000
2,000
1,000
1,000
0
0
米国企業年金
DCプラン
DBプラン
1995
1996
1997
1998
1999
2000
2001
2002
2003
2004
2005
2006
2007
2008
2009
2010
2011
2012
2013
2Q14
1995
1996
1997
1998
1999
2000
2001
2002
2003
2004
2005
2006
2007
2008
2009
2010
2011
2012
2013
2Q14
4,000
10億㌦
出所:FRB, Flow of Funds
米地方公務員年金で、新規雇用者に対して確定拠出年金(DC プラン)のみを提供してい
るのは、コロンビア特別州(警察、消防、教員を除く)、ミシガン州(公立学校職員を除く)
、
アラスカ州、オクラホマ州(2015 年 11 月から)とわずかな州にとどまっている。
2000 年以降の動きでは、確定拠出年金(DC プラン)を採用していた米地方公務員年金
が他の制度へと移行する動きも見られており、2003 年にネブラスカ州がキャッシュバラン
ス・プランに、2005 年にウェストバージニア州の教員退職年金が確定給付年金(DB プラ
ン)に、2010 年にミシガン州の公立学校職員がハイブリッド・プランへと、それぞれ DC
プランを取り止め、他の制度へと移行している。
6
2.2
オルタナティブ投資へのシフト
2014 年には、カリフォルニア州職員退職年金(CalPERS)がヘッジファンド投資からの撤
退を表明したが、米地方公務員年金全体としては、オルタナティブ投資の残高とウェイト
は引き続き拡大している。
Pensions & Investments 誌のデータでは、2003 年に 46.0%あった米国株式のウェイト
は 2013 年には 22.8%へと低下、
海外株式のウェイトは大きくは変わってはいないことから、
米国地方公務員年金のホームアセット・バイアスの修正は進んでいる。
米国債券も 2003 年の 27.0%から 20.8%へと減少している。
米企業年金では、
LDI(Liability
Driven Investment)の採用が急速に進んだことから、ALM 目的での長期債投資の増加によ
り米国債券の投資ウェイトは増加しているが、米公務員年金には LDI の導入ニーズは薄く
債券残高も減少し、オルタナティブ投資へと資金は向かっている。
オルタナティブ投資においては、プライベート・エクイティと不動産が主要投資対象と
なっており、ヘッジファンドのウェイトはさほど高くは無い。
[図表 1-6] 米地方公務員年金のアセットアロケーション推移
TOP 200 DB Public 2003
Private
Equity,
4.0%
Real Estate
equity,
4.2%
Cash, 1.4%
Global/Int'l
Fixed
Income,
1.1%
Other,
0.9%
TOP 200 DB Public 2008
Private
Equity,
7.9%
Real Estate
equity,
7.4%
Domestic
Fixed
Income,
27.1%
Domestic
Stock,
46.0%
Int'l Stock,
15.3%
Global/Int'l
Fixed
Income,
1.5%
Alternative
Investment
s, 4.5%
Real Estate
equity,
7.9%
Other,
4.1%
Domestic
Stock,
35.4%
Cash, 1.5%
TOP 200 DB Public2013
Domestic
Fixed
Income,
Int'l Stock,
24.7%
17.5%
Private
Equity,
9.4%
Domestic
Stock,
28.7%
Cash, 1.8%
Global/Int'l
Fixed
Income,
2.0%
Other,
1.6%
Domestic
Fixed
Income,
20.8%
Int'l Stock,
20.1%
Global
Equity,
3.2%
出所:Pensions & Investments 誌より年金シニアプラン総合研究機構作成
[図表 1-7] 米企業年金のアセットアロケーション推移
TOP 200 DB Corporate 2003
Private
Equity,
5.0%
Real Estate
equity,
3.7%
Other,
2.0%
TOP 200 DB Corporate 2008
Cash, 1.4%
Private
Equity,
5.0%
Real Estate
equity,
3.7%
Other,
2.0%
Cash, 1.4%
Global/Int'l
Fixed
Income,
1.4%
Domestic
Fixed
Income,
25.4%
Int'l Stock,
17.6%
Domestic
Stock,
43.5%
Global/Int'l
Fixed
Income,
1.4%
Domestic
Stock,
43.5%
Domestic
Fixed
Income,
25.4%
Int'l Stock,
17.6%
TOP 200 DB Corporate 2013
Real Estate
equity,
5.2%
Private
Equity,
7.2%
Global/Int'l
Fixed
Income,
2.3%
Other,
1.0%
Domestic
Stock,
22.8%
Cash, 2.4%
出所:Pensions & Investments 誌より年金シニアプラン総合研究機構作成
7
Alternative
Investment
s, 8.4%
Domestic
Fixed
Income,
32.4%
Int'l Stock,
15.8%
Global
Equity,
2.7%
2.3
投資対象資産クラスの拡大
米地方公務員年金では、州法でオルタナティブ投資に対して比較的厳しい制限を加えて
いたジョージア州やオクラホマ州の基金等を除き、大半の基金でプライベート・エクイティ
や不動産を中心にオルタナティブ投資が実施されており、エマージング株式やハイイール
ド債への投資も一般的なものとなってきている。また、投資対象資産クラス拡大の動きは
足下でも継続している。
当機構では、主要米地方公務員年金のなかで、アニュアルレポートやホームページなど
公開情報から一定の情報取得が可能であった 82 の年金基金または投資委員会を対象に、
2015 年 1 月にオルタナティブ投資の状況を調査したが、オルタナティブ投資を行っていな
いジョージア州公務員退職年金(ERS-GA)、ジョージア州教職員退職年金(TRS-GA)、オク
ラホマ州教職員退職年金(OKTRS)の 3 基金を除く 79 の基金すべてが不動産とプライベー
ト・エクイティを投資対象としていた。
このところ投資対象として採用する基金が目立っているのは、インフラストラクチャー
(Infrastructure)、森林投資(Timber)、農地投資(Farmland / Agriculture) 、天然資源/エ
ネルギー(Natural Resources / Energy)などリアル・アセット(Real Assets)と呼ばれる分野
である。
また、レバレッジド・ローン(バンク・ローン)やプライベート・デット、ディストレ
スト・デット等への投資も増加している。リスク・パリティやグローバル・タクティカル・
アセットアロケーション(GTAA)もまだ採用基金の比率としては低いものの、徐々に増加が
見られている。
[図表 1-8] 主要地方公務員年金における投資対象比率
0%
20%
40%
60%
80%
100%
Real Estate
96%
Private Equity
96%
Hedge Funds
66%
Infrastructure
49%
Commodities
40%
Timber
35%
Bank Loan
24%
Farmland / Agricuruture
18%
Risk Parity
GTAA
15%
11%
出所:年金シニアプラン総合研究機構
8
2.4
リスクを意識したアセットアロケーションへの試み
投資対象資産クラスの拡大が続く一方で、資産クラスの分散をどれだけ進めていても分
散効果が得られず、大きなマイナスリターンを被った金融危機時の反省から、資産クラス
ではなく、リスクの分散を主眼に置こうとする考え方も広まってきている。
ミズーリ州職員退職年金(MOSERS)など一部の基金では、経済成長(economic growth)と
物価上昇(inflation)の組み合わせによるそれぞれの経済局面に対応するためのリスク・ファ
クターと市場ベータを設定し、リスクを基準とすることによる安全資産のウェイト上昇に
伴う期待リターンの低下には、デリバティブを活用しレバレッジを掛けて対応するといっ
た手法の導入も見られる。
リスク・ベースのアセットアロケーションをポートフォリオ全体に適用するには、重要
なリスク・ファクターの特定、リスク・ファクターと実際に投資可能な資産との結びつけ、
リスクの配分手法等実務的な課題も多いこと、また、レバレッジの全面的な活用には抵抗
感も残ることから、ポートフォリオ全体にレバレッジを掛けるまで踏み込む米地方公務員
年金は極めて少数の基金にとどまっている。
ただし、資産クラスの枠組みのリスクを基準としたものへの組み替え、インフレ・リス
ク等に対応するための新たな資産クラスの設定、ポートフォリオの一部へのリスク・パリ
ティ・ファンドやグローバル・タクティカル・アセットアロケーション(GTAA)等の組み入
れなど、多くの米地方公務員年金で、「資産」ではなく「リスク」を意識したポートフォリ
オ構築への試みが見られている。
Rising
[図表 1-9] 経済局面と市場ベータのマトリクス
Equities ・ Commodities ・ Illiquids
Alternative Beta
TIPS ・ Commodities
INFLATION
Falling
GROWTH
Equities ・ Nominal Bonds ・ Illiquids
Alternative Beta
TIPS ・ Nominal Bonds
出所:MOSERS Comprehensive Annual Financial Report
9
3 ファンディング比率
金融危機の発生により大きく悪化した米公務員年金のファンディング比率は、ここ数年
の好調な資産運用状況によって改善基調にはあるものの、大半の米公務員年金が多額の未
積立債務を抱えていることには変わりは無く、引き続き厳しい状況に置かれている。
金融危機によって生じた資産運用における大きなマイナス利回りが、多くの米地方公務
員年金のファンディング構造の弱さを浮き彫りにした形であるが、等しく厳しい資産運用
状況に直面しながらも、州や基金によってファンディング比率に大きな格差があることに
も見られるように、資産運用利回りのみが米地方公務員年金における財政悪化の原因では
ない。
多額のファンディング不足に苦しむ州の大半は、2 桁台の資産運用利回りが続いた 1990
年代に、将来的にも期待収益率を上回る高い運用利回りが続くことをあてこんだ給付条件
の引き上げや、拠出の引き下げ、州の財政再建策の一環として未積立債務のアモチゼーショ
ン期間の延長等を行い州等雇用者(年金スポンサー)の拠出の先送りを行ったりしている
ことが大きな要因ともなっている。また、2000 年代に入ってからの急激なヘルスケア・コ
ストの上昇や長寿化の進展もファンディング状況の大きな要因である。従来は高い資産運
用利回りが覆い隠していたファンディング構造の弱さが、IT バブル崩壊後(2001-03 年)
と金融危機(2008-09 年)の資産運用利回りの悪化により、表面化しただけとも考えられる。
尚、年金財政の健全性を見るにはファンディング比率だけでは不十分であり、ファンディ
ング比率のトレンドや、ARC(Annual Required Contribution) 6に対する実際の拠出額の比
率、ARCのスポンサーの歳出額や加入者給与総額に占める比率、年金経理上の未積立債務
(UAAL : Unfunded Actuarial Accrued Liability)金額の加入者給与総額に対する比率等と
併せ、総合的に判断されるべきとされる。
地方公務員年金への拠出負担は、一般的には歳出に占める割合はさほど大きくは無いが、
財政の悪化した一部の州や地方自治体にとっては、重い負担となっているケースも見られ
ている。それぞれの地方公務員年金制度の基本は、各州の州法によって規定されているた
め、金融危機後においても 90%台のファンディング比率を維持している州もあれば、イリ
ノイ州などのように 50%を割り込んでしまっている州も見られる。
格付機関のS&Pは、2014 年のレポート 7で、年金債務の問題がイリノイ州、ケンタッキー
州、ニュージャージー州、ペンシルバニア州などにおいて、信用格付の引き下げや格付け
見通しをネガティブとする要因となっているとしている。ただし、因果関係としては、州
の財政悪化が年金スポンサーとしての地方公務員年金に対する州の拠出額引き下げ/先送
りを生み、ファンディング比率を悪化させたという側面の方が強いものと考えられる。
6
年金経理上必要とされるスポンサー拠出額、米地方公務員年金の場合、州法等に特段の規定がない限り
強制力はない。
7
S&P(2014), “U.S. State Pension Funding: Strong Investment Returns Could Lift Funded Ratios,
But Longer-Term Challenges Remain”
10
[図表 1-10] 米公務員年金のファンディング比率推移
75.8%
73.5%
FY11
FY12
85.1%
FY08
77.0%
86.3%
FY07
FY10
85.4%
FY06
79.8%
86.7%
FY05
FY09
88.4%
FY04
89.0%
FY98
91.4%
86.0%
FY96
FY03
85.0%
FY94
96.9%
82.0%
80%
FY92
90%
79.0%
100%
FY90
110%
96.0%
120%
110.9%
Average Funding Ratio
130%
70%
FY02
FY01
FY00
60%
出所:Public Fund Survey 8
[図表 1-11] 州別地方公務員年金ファンディング・レベル 9
フ ァンデ ィング・レベル・ト ップ 5州
トップ/ボトム 5
フ ァンデ ィング・レベル・ボト ム 5州
ウィスコンシン州
99.9%
イリノイ州
40.1%
ノースカロライナ州
95.4%
コネチカット州
49.1%
ワシントン州
95.1%
ケンタッキー州
49.9%
サウスダコタ州
92.6%
アラスカ州
54.7%
オレゴン州
92.5%
ルイジアナ州
55.9%
出所:S&P
[図表 1-12] 州別地方公務員年金ファンディング比率と S&P 格付
S&P格付 0
AAA
AA+
AA
AAA+
A
ABBB+
BBB
BBBBB+
ファンディング比率 (%)
40
60
80
20
100
120
イリノイ州
プエルトリコ
出所:S&P から年金シニアプラン総合研究機構作成
8
9
Public Fund Survey (2013), “Summary of Findings for FY 2012”
http://www.publicfundsurvey.org/publicfundsurvey/summaryoffindings.html 2015/1/8 閲覧
州がスポンサーとなっている地方公務員年金の数値を S&P が合算して計算している。
11
州レベルで見た場合のファンディング比率が最も低いイリノイ州の場合は、州法を制定
し ARC(Annual Required Contribution)には依らず独自の拠出額を定めたことにより、
2004 年以降年金経理上求められる拠出額より少ない金額しか拠出してこなかったことも大
きな要因となっている。
尚、イリノイ州では 2013 年 12 月に、1,600 億ドル規模の州年金改革法を成立させたが、
州公務員労働組合が、給付金を削減することを認めていない州憲法に違反するとして提訴、
2014 年 11 月にイリノイ州巡回裁判所は、州憲法違反との判断を下し、州司法長官が州最
高裁へと上訴している状況で年金改革はさほど進展していない。
[図表 1-13] イリノイ州職員退職年金基金のスポンサー拠出額とファンディング比率
2,000
Funding Ratio
US$, Bln
90%
1,500
80%
70%
1,000
60%
500
50%
40%
0
30%
20%
State Pension Fund
2013
2012
2011
2010
2009
2008
2007
2006
2005
2004
2003
州法
10%
0%
1996
1997
1998
1999
2000
2001
2002
2003
2004
2005
2006
2007
2008
2009
2010
2011
2012
2013
ARC
2002
2001
2000
1999
1998
-500
差額
出所:State Employees’ Retirement System
コンサルティング会社のWilshire Associatesのレポート 10によると、対象としている 134
の米地方公務員年金のうち、2013 財政年度の年金数理データを公表済の 111 基金のうち、
市場価格ベースでは 92%にあたる 102 基金が、年金数理(actuarial)ベースでは 95%にあた
る 105 基金がアンダーファンディングの状況にあると報告されている。また、資産運用に
おける株式のウェイトとファンディング比率には相関は見られないとしている。
また、ウィスコンシン州など、資産運用利回りの悪化にも関わらず高いファンディング
比率を維持している州の米公務員年金 DB プランは、市場環境に左右されにくいサステナ
ブルな給付デザイン、州や地方自治体などスポンサーの財政状態からの影響を受けにくい
適正な拠出のコミットメント、強固なガバナンス・プロセスの確立等によって支えられて
いるとコメントされている。
Wilshire Consulting(2014), “2014 Report on State Retirement Systems: Funding Levels and Asset
Allocation”
10
12
[図表 1-14] 米公務員年金のファンディング状況
2003
2004
2005
2006
2007
2008
2009
2010
2011
2012
2013
Total Pension Assets
Market Value
$1,799.6
$2,017.6
$2,181.4
$2,379.1
$2,695.4
$2,402.7
$2,015.7
$2,211.3
$2,493.4
$2,508.5
$2,117.7
Actuarial Value
$1,986.0
$2,053.5
$2,141.8
$2,280.1
$2,465.9
$2,516.8
$2,471.7
$2,499.7
$2,544.7
$2,581.4
$2,093.2
$2,221.9
$2,343.1
$2,486.8
$2,646.9
$2,833.2
$2,976.1
$3,132.7
$3,233.4
$3,348.2
$3,496.0
$2,897.4
Total Pension Liabilities
Difference
Market Value
($422.4)
($325.5)
($305.4)
($267.8)
($137.8)
($573.4) ($1,117.0) ($1,022.1)
($854.8)
($987.5)
($779.8)
Actuarial Value
($236.0)
($289.5)
($345.0)
($366.7)
($367.3)
($459.4)
($803.6)
($914.6)
($804.3)
($661.0)
($733.7)
Market Value of Assets as a % of Liabilities
All Plans (estimate)
81%
86%
88%
90%
95%
81%
64%
68%
74%
72%
75%
Reported Plans (actual)
81%
86%
88%
90%
95%
81%
64%
68%
74%
72%
73%
Actuarial Value of Assets as a % of Liabilities
All Plans (estimate)
89%
88%
86%
86%
87%
85%
79%
77%
76%
74%
73%
Reported Plans (actual)
89%
88%
86%
86%
87%
85%
79%
77%
76%
74%
72%
134
134
134
134
134
134
134
134
134
134
111
Total No. of Retirement Systems
出所:Wilshire
[図表 1-15] 2013 財政年度の米公務員年金ファンディング比率分布
30
25
20
Market Value
15
Actuarial Value
10
5
140-150%
130-140%
120-130%
110-120%
100-110%
90-100%
80-90%
70-80%
60-70%
50-60%
0-50%
0
出所:Wilshire
ウィスコンシン州の立法評議会(Wisconsin Legislative Council)では、1982 年以降、原則
2 年毎 11に全米 50 州の 87 の主要地方公務員年金制度 12を比較した報告書を作成している。
同報告書対象年金のファンディング比率をみると、2000 年調査ではDCプランと調査時点で
ファンディング比率が算出されていない基金を除く 42%の基金が 100%超、健全性の目安と
される 80%超の基金が 87%にまで達していたが、2012 年の調査では、ファンディング比率
が 100%超の基金は無く、80%超の基金も 33%にまで低下している。
1982 年以降原則偶数年に実施されているが、1998 年は実施が無い。
各州の州職員(State)、地方自治体職員(Local)、教員(Teacher)を対象とする代表的な地方公務員年金基
金を各州最大 3 基金と、
ウィスコンシン州内のミルウォーキー市とミルウォーキー郡の 2 つの基金を対象、
2006 年までは対象は 85 基金。
全米 50 州を網羅することと各州の基金数を最大 3 基金に絞っているため、
大型の基金でも対象となっていないものもある。
11
12
13
[図表 1-16] 主要米地方公務員年金のファンディング比率構成比推移
100%
100%
90%
90%
80%
Not determined
80%
70%
- 50%
70%
60%
50% - 60%
60%
50%
60% - 70%
50%
40%
70% - 80%
40%
30%
80% - 90%
30%
20%
90% - 100%
20%
10%
100% -
2012
2010
2008
2006
2004
2002
2000
1996
1990
1994
0%
2012
2010
2008
2006
2004
2002
2000
1996
1994
1992
1990
0%
80%超の基金の比率
1992
10%
100%超の基金の比率
出所:Wisconsin Legislative Council
同 調 査 の 対 象 と な っ た 87 基 金 の 現 職 加 入 者 (Active Member) 数 と 年 金 受 給 者
(Beneficiaries & Annuitants)数とその比率の推移をグラフ化したのが[図表 1-17]であるが、
2000 年代に入って公務員改革や、州や地方財政の逼迫に伴う新規雇用者数の減少により加
入者数が伸び悩んだのに対し、年金受給者数は米ベビーブーマー世代が退職年齢に差し掛
かってきていることから急速に増加し、年金基金の成熟化が進んできている。
[図表 1-17] 現職加入者数と年金受給者数の推移
16,000,000
14,000,000
3.00 2.95
3.50
2.83 2.89
2.52
12,000,000
2.38
10,000,000
3.00
2.24 2.14
2.00
2.50
1.87
8,000,000
1.70
2.00
1.50
6,000,000
1.00
4,000,000
Active Employee
Beneficiaries & Annuitants
出所:Wisconsin Legislative Council
14
2012
2010
2008
2006
2004
2002
2000
1996
0.00
1994
0
1992
0.50
1990
2,000,000
Ratio (右軸)
4 金融危機以降の制度改革
金融危機を受けてファンディング状況が悪化した米地方公務員年金制度スポンサーの制
度面での対応は、ひとつは加入者拠出額の引き上げや受給条件の厳格化であり、もう一つ
は確定給付年金(DB プラン)からの移行の検討であった。
National Conference of State Legislatures (NCSL)のレポート 13によると、金融危機後
の 2009 から 2011 年の 3 年間で、全米 50 州のうち 43 の州において州の公務員退職プラン
の大きな改定が行われたとされている。他の 7 州については、アラスカ、ケンタッキー、
オレゴンの 3 州は 2000 年代前半に大きな改革を実施済で、オハイオとサウスカロライナの
2 州は 2011 年末現在改革を検討中とされており、相対的に金融危機での影響が小さかった
アイダホとテネシーの 2 州を除くすべての州で、何らかの改革がなされたとしている。
[図表 1-18] 公務員年金の改革を実施した州の数
職員拠出額引
き上げ
受給年齢引き
上げ
2009年
2010年
6
12
5
11
給付額の物価
連動(COLA)の
縮小・凍結
3
8
2011年
17
17
10
Benefit計算フォーミュラ変更
平均給与計算
倍率縮小
期間長期化
1
1
8
4
8
早期退職者の
減額
再雇用者の条
件厳格化
3
9
9
10
6
7
出所:NCSL
前述のウィスコンシン州の立法評議会(Wisconsin Legislative Council)のレポートを時系
列に並べ、米地方公務員年金の制度改革の動向を項目別に見ていく。
≪通常退職≫
各制度における満額の年金受給資格を得られる「通常退職(Normal Retirement)」の基準
は、退職年齢と勤続年数の組み合わせで定められている。米国地方公務員年金では、
「55 歳
以上での退職で勤続○年以上」という基準か、“Rule of Y”という方式のどちらかで、通常退
職の基準が定められている。
“Rule of Y”という方式は、退職年齢と勤続年数の合計を“Y”として判定する方式で、例え
ば Rule of 75 であれば、60 歳で退職すれば勤続 15 年以上で、49 歳で退職しても勤続年数
が 26 年以上あれば、満額の年金受給資格を得られるという意味である。また、2012 年調
査では 87 基金のうち 79 の基金で、年率数%の割引で年金の前倒し受給が受けられる早期
退職(Early Retirement)の制度が定められている。
年金受給資格は、2008 年と 2010 年の比較では 21 の基金で、2010 年と 2012 年の比較
では 29 の基金で、条件の厳格化が行われている。ただし、ファンディング比率がピークを
過ぎた 2000 年以降でも、2000 年と 2004 年の比較では 9 基金、2004 年と 2006 年では 2
13
National Conference of State Legislatures (2012), “State Pension Reform, 2009-2011”
15
基金、2006 と 2008 年では 7 基金と、資産運用状況が好調だった 1990 年代からの受給資格
条件の緩和のトレンドは続いていた。
[図表 1-19] 満額の年金受給資格条件の推移
1988
35 years/age 55
1990
1992
1994
1996
2000
2002
2004
2006
2008
2010
2012
9
8
8
7
7
8
7
7
7
8
5
5
30 years/age 55
38
35
32
33
34
28
29
28
28
29
31
24
28 years/age 55
1
33 years/age 55
1
27 years/age 55
2
2
2
2
3
4
4
4
4
3
2
1
2
2
2
2
2
2
3
3
1
1
12
13
13
12
10
10
11
11
8
7
1
1
4
4
4
4
8
6
6
58
59
57
56
55
56
63
54
46
25 years/age 55
7
9
20 years/age 55
1
1
56
56
TOTAL
1988
1990
56
1992
1996
1994
2000
2002
2004
2006
2010
2008
Rule of 95
1
Rule of
Rule of
Rule of
Rule of
Rule of
Rule of
Rule of
TOTAL
0
4
1
2
1
2
1
3
1
4
1
5
1
6
1
6
1
3
1
4
1
1
1
4
2
1
10
3
4
1
11
3
2
1
11
3
4
1
13
5
6
1
18
6
6
1
20
5
5
1
18
5
5
1
15
9
7
2
23
92
90
88
87
85
80
75
7
2012
7
1
2
7
1
4
10
7
4
6
5
29
25
出所:Wisconsin Legislative Council
≪加入者拠出率・雇用者拠出率≫
加入者拠出率(Employee Contribution Rate)は、2004 年までは拠出率が低下するトレン
ドにあったが、2006 年以降拠出率引き上げに転じ、2010 年と 2012 年との比較では、加入
者拠出率の引き上げを実施した基金は 25 基金となり、加入者拠出率が 5%以下の基金数は
31 から 23 に減り、5%超の基金数が 48 から 53 へと増加している。
雇用者拠出率は、様々な条件により上下するため評価は困難であるが、2010 年と 2012
年との比較では、雇用者拠出率上昇が 29 基金に対して、拠出率低下が 41 基金となってい
る。雇用者拠出率の低下が、制度改革等の成果であるのか、州財政の悪化に伴う未積立年
金債務のアモチ期間の延長等による拠出先送りの結果なのか、それとも他の要因なのかは、
州法の改正内容等を含め詳細に見ないと判らないものとなっており評価は難しい。
[図表 1-20] 加入者拠出率の推移
1988
5% or less
More than 5%
Rate varies
Plan is noncontributory
TOTAL
1990
27
44
4
10
85
1992
25
43
5
12
85
1994
26
42
4
13
85
1996
29
37
8
11
85
2000
30
38
6
11
85
出所:Wisconsin Legislative Council
16
2002
34
35
6
10
85
2004
35
34
6
10
85
2006
35
34
6
10
85
2008
28
45
6
6
85
2010
30
46
5
6
87
2012
31
48
4
4
87
23
53
7
4
87
≪年金等受給権獲得所要年数≫
年金等何らかの受給権を獲得できる期間(Vesting Requirement)は、かつては過半を占め
ていた 10 年から 5 年以下への短縮のトレンドにあったが、2010 年調査以降は、長期化へ
と反転している。
[図表 1-21] 年金等受給権獲得所要年数推移
1986
Immediate vesting
1988
1
1990
1992
1994
1996
1
Vesting after 3 years
2000
2002
2004
2006
2008
2010
2012
1
2
2
2
2
2
2
1
5
3
3
3
3
6
6
6
6
7
7
Vesting after 4 years
4
4
5
5
5
5
5
5
5
5
4
4
5
Vesting after 5 years
29
33
35
36
38
38
42
47
49
50
51
45
45
1
3
1
Vesting after 8 years
3
4
3
3
4
4
4
4
4
4
4
3
3
Vesting after 10 years
46
40
35
33
31
30
25
20
18
17
17
21
26
Vesting after 20 years
1
1
1
1
Graded or varying
1
2
3
4
4
4
1
1
1
1
1
2
1
85
85
85
85
85
85
85
85
85
85
87
87
87
Vesting after 6 years
TOTAL
出所:Wisconsin Legislative Council
[図表 1-22] 加入者拠出率と受給権獲得所要年数の構成比推移
加入者拠出率
100%
受給権獲得所要年数
100%
80%
80%
60%
60%
40%
40%
20%
20%
5年以下
6~9年
2012
2008
10年以上
2010
2006
2004
2002
2000
1996
1994
2010
2012
即時
1992
Rate varies
1990
More than 5%
1988
5% or less
0%
1986
Plan is noncontributory
2008
2006
2004
2002
2000
1996
1994
1992
1990
1988
0%
変動
出所:Wisconsin Legislative Council
≪年金受給額≫
DB プランの年金給付額の算定式は以下のようになっている。
勤続年数
(Ye ars of Se rvic e )
×
支給倍率
(Formu la Mu ltiplie r)
×
最終平均給与
(Fin al Ave rage Salary)
ウィスコンシン州の立法評議会のレポートが対象とする 87 の基金のうち 17 基金は、米
国社会保障制度(Social Security)をカバーしておらず、残りの 70 基金は社会保障制度とコー
ディネートされている。社会保障制度を含まない基金については、一般に支給倍率が高く
17
設定されている。
社会保障を含まない 17 基金の 2002 年調査における支給倍率の平均は 2.1%、社会保障を
含む 70 基金の平均は 1.73%となっており、やや低下方向にある。
支給倍率は 2006 年までは引き上げ方向にあったが、2008 年以降は引き下げに反転して
いる。
[図表 1-23] 支給倍率平均および構成比の推移
2.6%
100%
2.4%
90%
Money purchase plan
80%
2.2%
plus money purchase
70%
2.0%
60%
1.8%
50%
1.6%
40%
Employer determines
Over 2.1%
Over 1.9% to 2.1%
Over 1.7% to 1.9%
30%
Over 1.3% to 1.5%
1.0% to 1.3%
2012
2010
2008
2006
2004
0%
2002
2000 2002 2004 2006 2008 2010 2012
10%
2000
1.0%
Over 1.5% to 1.7%
1996
SS covered
20%
1994
SS not covered
1.2%
1992
1.4%
出所:Wisconsin Legislative Council
最終平均給与(Final Average Salary : FAS)は、公務員の場合は年功序列賃金制度が維持
されていることが多いことから、一般には退職直前の年度ほど賃金水準が高いため、平均
対象年数を短くするほど年金給付額は高くなる傾向にある。2006 年まではわずかずつ短縮
される傾向にあったが、2008 年以降は大きく引き上げられている。
また、制度によっては、退職前の給与水準よりも高い年金額を受給する公務員が多数生
まれ、民間と比べて優遇され過ぎているとの批判が高まったため、年金給付額に上限を設
定している基金も見られている。限度額設定方式の多くは、最終平均給与(FAS)の○%とい
う設定方法となっている。
年金額に限度額を設けている基金の中では、限度額のパーセンテージを引き下げる動き
がでているが、限度額の設定の無い基金が引き続き過半数を占めている。ただし、限度額
設定の無い基金の中には、制度設計上、批判の対象となるような高額年金受給者が生まれ
にくい制度となっている基金も含まれるものと考えられる。
≪物価調整≫
年金給付額の物価変動調整に関しては、金融危機後調整率の引き下げや凍結の動きが強
まっており、CPI に連動させる(Cost-of-Living Adjustment : COLA)の場合でもキャップを
付ける基金やキャップの水準を引き下げる基金が増加している。
また、CPI に連動させず固定のパーセンテージで給付額を増加させる仕組みを取る基金
も増加しているが、古くから導入している基金では設定レートが現状のディス・インフレ
18
環境下では、実際のインフレ率を大きく上回るところもあり、批判の対象ともなっている。
カンザス州では 2014 年以降の退職者に対する COLA が廃止され、ロードアイランド州
では、ファンディング比率が 80%を超えるまで COLA が停止されている。
投資リターンが期待収益率を上回った場合にのみ COLA を実施する制度とした州も見ら
れている。
[図表 1-24] 年金給付限度額の設定状況と最終平均給与の計算期間の推移
FAS Limit
100%
FAS Period
100%
80%
Other
80%
60%
2 FAS Period
60%
8-year
40%
5-year
40%
20%
4-year
20%
3-year
2012
2010
2008
2006
2002
2004
Other
2000
0%
1996
FAS limit under 100%
2012
2010
2008
2006
2004
2002
2000
1996
100% FAS
3.5-year
1990
None
1994
1990
0%
2-year
出所:Wisconsin Legislative Council
[図表 1-25] 物価調整の仕組みの推移 14
100%
90%
80%
70%
60%
50%
40%
30%
20%
10%
0%
No increase
Ad hoc or money
purchase
Investment surplus
2012
2010
2008
2006
2004
2002
2000
1996
1994
1992
1990
1986
Automatic percentage
increase
Adjustments indexed to
CPI
出所:Wisconsin Legislative Council
14
Ad hoc は、COLA の実施には、法改正または意思決定委員会での承認が必要
19
5 確定給付年金制度(DB プラン)からの移行
米企業年金では、確定給付年金(DB プラン)から確定拠出年金(DC プラン)へのシフ
トが大きく進んでいるが、米地方公務員年金では、金融危機以降 DB プランの見直しの動
きは多くの州で見られているものの、DC プランへの移行への動きは極めて限定的なものに
とどまっている。
米地方公務員年金においても DB プランのみを加入者に提供している基金の数は減少傾
向にはあるが、DC プランのみを採用する基金数も増えてはおらず、ハイブリッド・プラン
やキャッシュバランス・プランへの移行や、DB プラン・DC プラン・ハイブリッド・プラ
ンのうちから加入者に参加プランを選択する権利を与えるタイプの制度への移行が主流と
なっている。
DC プランへの移行は、2015 年 11 月以降の新規雇用者(カウンティ[郡]職員等を除く)
が DC プランへと加入する制度としたオクラホマ州が例外的な存在で、従来 DC プランを
採用していた州や基金の中でも、DB プランやハイブリッド・プランへと戻す動きも見られ
ており、DC プランの採用数は増加傾向とはなっていない。
[図表 1-26] 主要米地方公務員年金の採用制度
1998
2000
2002
2006
2004
2008
2010
2012
DB, DC, ハイブリッドの中から選択
0
0
2
2
2
2
2
2
DCとハイブリッドのどちらかを選択
0
0
0
0
0
0
0
3
DBとハイブリッドのどちらかを選択
DBとDCのどちらかを選択
0
0
2
2
2
2
1
2
5
2
0
6
6
7
7
7
ハイブリッドのみ
4
4
4
5
7
7
8
8
DCのみ
6
6
6
5
5
6
6
5
DBのみ
<合計>
94
93
85
84
82
80
79
77
104
104
104
104
104
104
104
104
出所:Texas Pension Review Board
[図表 1-27] 米地方公務員年金と米企業年金の DB/DC 資産残高推移
9,000
8,000
7,000
6,000
5,000
4,000
3,000
2,000
1,000
0
米地方公務員年金
DCプラン
DBプラン
出所:FRB Flow of Funds
20
10億㌦
米国企業年金
DCプラン
DBプラン
1995
1996
1997
1998
1999
2000
2001
2002
2003
2004
2005
2006
2007
2008
2009
2010
2011
2012
2013
2Q14
10億㌦
1995
1996
1997
1998
1999
2000
2001
2002
2003
2004
2005
2006
2007
2008
2009
2010
2011
2012
2013
2Q14
9,000
8,000
7,000
6,000
5,000
4,000
3,000
2,000
1,000
0
5.1
確定拠出年金(DC プラン)
[図表 1-28] 米地方公務員年金における DC プランの採用状況
期間
州
基金
1966 ~ 1977
ノースダコタ州
PERS
1967 ~ 2002
ネブラスカ州
PERS
1987 ~
コロンビア特別州
1991 ~ 2005
ウェストバージニア州
TRS
1997 ~
ミシガン州
1997 ~ 2010
ミシガン州
PSERS
2006 ~
アラスカ州
PERS,TRS
2015 ~
オクラホマ州
PERS,
出所:各種資料から年金シニアプラン総合研究機構作成
備考
1977 DBプランに変更
2003/1~ キャッシュバランス・プラン
(警察、消防、教員等を除く)
2005/7~ DBプラン
2010/7~ ハイブリッド・プラン
(カウンティ職員を除く)
米企業年金では主流となっている確定拠出年金(DC プラン)であるが、米地方公務員年
金では、任意加入のオプションとしての DC プランの設定は多いものの、DC プランを強制
加入で中心的な退職年金システムとして位置付けている基金は少ない。
現状、主要な米地方公務員年金制度で、新規の雇用者が DC プランにのみ加入する制度
を持っているのは、アラスカ州、ミシガン州とコロンビア特別州に限られており、2015 年
11 月にオクラホマ州が加わるのみである。
アラスカ州では、州および地方自治体職員と教員が DC プランの対象であるが、ミシガン
州では、2010 年に公立学校職員は DC プランからハイブリッド・プランへと移行し、州職
員のみが DC プランの対象となっている。コロンビア特別州では、警察・消防・教員等を
除く州職員が DC プランの対象となっている。
また、米地方公務員年金では、DC プランから他の制度への移行も数多く見られている。
1966 年に DC プランを採用したノースダコタ州では、1977 年に DB プランへと移行、1967
年とこちらも古くから DC プランを採用していたネブラスカ州も 30 年以上経った 2003 年
1 月からキャッシュバランス・プランへと移行、1991 年に DC プランを採用したウェスト
バージニア州教員退職年金基金(TRS)は 2005 年 7 月に DB プランへと移行、1997 年に DC
プランとなったミシガン州でも、前述のように公立学校職員退職年金基金(PSERS)は 2010
年 7 月からハイブリッド・プランへと移行している。
DC プランからキャッシュバランス・プランに移行したネブラスカ州では、移行の理由を、
DC プランの管理コストの高さと、DB プランと比較した場合の DC の平均投資リターン及
び給付額の低さを理由として掲げている。ネブラスカ州によれば、2002 年までの 20 年間
の平均投資リターンが DB プランでは年率 11%であったのに対して、DC プランは、50%近
くの加入者がデフォルト設定の Stable Value ファンドに投資していたこともあり、年率 6
~7%のリターンにとどまっていたとしている。
2005 年に DC プランから DB プランへと移行したウェストバージニア州教員退職年金基
金(TRS)でも、DC プランの管理コストの高さと、DC プランの投資リターンの低さが理由
とされており、2010 年に DC からハイブリッドに移行したミシガン公立学校職員退職年金
基金(PSERS)でも DC プランの投資リターンの低さが指摘されている。
21
[図表 1-29] DBプランとDCプランのリターン比較 15
Yea r
2011
2010
2009
2008
2007
2006
2005
2004
2003
2002
2001
2000
1999
1998
1997
1996
1995
A v era g e
A v era g e l a s t 10 y ea rs
A v era g e l a s t 5 y ea rs
DB
2.74%
12.79%
15.46%
△23.44%
7.49%
13.07%
7.57%
10.94%
21.00%
△8.88%
△4.02%
△0.16%
13.23%
14.22%
18.80%
14.36%
20.99%
8.01%
5.87%
3.01%
DC
△0.22%
11.81%
20.86%
△26.12%
6.77%
11.89%
6.69%
9.78%
19.63%
△10.96%
△6.07%
△2.76%
14.41%
15.24%
19.65%
13.91%
18.72%
7.25%
5.01%
2.62%
DB - DC
2.96%
0.98%
△5.40%
2.68%
0.72%
1.18%
0.88%
1.16%
1.37%
2.08%
2.05%
2.60%
△1.18%
△1.02%
△0.85%
0.45%
2.27%
0.76%
0.86%
0.39%
出所:Towers Watson 16
米地方公務員年金の DC プラン移行が進まない理由としては、政治家や納税者としての
州民等ステークスホルダーの多さも指摘されることが多い。
DB プランの閉鎖方法としては、①新規加入は停止するが、既加入者の受給権はその後も
加算されている「ソフト・フリーズ」と、②新規加入の停止と共に現行加入者の受給権も
確定させてしまう「ハード・フリーズ」とがあるが、州憲法等で公務員の既得権が厚く保
護されている州が多いことから、米地方公務員年金では通常「ソフト・フリーズ」の手法
が利用されている。この場合は、DB プランを新規加入者に対して閉鎖しても、新規雇用者
分に対する追加的なリスクの削減にしかならず、閉鎖 DB プランは制度の成熟化が進みや
すいこともあり、運用面での難しさが増すという側面もみられている。
米企業の場合には、財務上の余裕がある場合には、DC プラン移行に伴う DB プラン凍結
時に資金を投入し過去の未積立債務の解消を図ることも行われているが、米地方公務員年
金の場合には、州や地方自治体等スポンサーが未積立債務を解消するためには、地方公務
員年金の加入者ではない一般の州民等の税金を原資として注入することになり、ハードル
は高くなっている。企業の場合、株主は一時的コストの計上があっても将来の企業利益の
拡大につながるものであれば通常問題とはされないが、州民にとっては、公務員年金の救
済のメリットは州民には感じられにくいため理解は得られづらい状況が通常である。
また、制度の移行には法律の改正が必要となるため、政治問題として政争の具となりや
すいという側面もある。
公務員組合の多くは DC プランの導入には反対姿勢をとっており、選挙等で相応の力を
15
16
Asset-weighted median rate of return
Towers Watson(2013), DB Versus DC Investment Returns: The 2009 – 2011 Update”
22
持つことの多い公務員組合の移行を無視してまで DC プランの導入を押し進めるよりは、
相対的には反対の力が弱いハイブリッド・プランやキャッシュバランス・プランへの移行
が選択しやすいものとなっているとの見方もあるようである。
新規の加入者がいなくなった閉鎖型 DB プランの管理と運用は難しく、閉鎖時点よりファ
ンディング比率が大きく悪化していくケースが多いことも、米地方公務員年金における DB
プランから他の制度に移行する際のネックとなっているとの指摘も見られる。
5.2
キャッシュバランス・プラン
キャッシュバランス・プラン
17は、確定給付型制度と確定拠出型制度の特性を併せ持つ
制度であり、確定給付制度の長所である一定の給付保証性を維持しつつ、確定拠出制度の
特徴である個人別残高を持つ仕組みである。プランスポンサーにとっては、運用リスク軽
減効果と退職給付債務の一定の安定効果が期待できるとされている。
米地方公務員年金におけるキャッシュバランス・プランの導入理由としては、将来の未
積立債務の大幅増加を防ぐことと、給付の短期・長期労働者への平準化を図るためとして
いる例がみられている。
[図表 1-30]
米地方公務員年金におけるキャッシュバランス・プランの採用状況
期間
1948 ~
1967 ~
州
テキサス州
テキサス州
基金
TMRS
TCDRS
1995 ~
カリフォルニア州
CalSTRS
2003 ~
2014 ~
2015 ~
ネブラスカ州
ケンタッキー州
カンザス州
PERS
RS
PERS
最低保証利率
5%
7%
T-Bondを基準
(2013-14は3%)
5%
4%
5.25% ⇒ 4.0%
備考
コミュニティ・カレッジのパートタイム・インストラク
ター向け
出所:各種資料から年金シニアプラン総合研究機構作成
キャッシュバランス・プランは、テキサス州の地方自治体職員を対象とする Texas
Municipal Retirement System (TMRS)が 1947 年に、同じくテキサス州のカウンティ(郡)
とディストリクト(地区)職員を対象とする Texas County & District Retirement System
(TCDRS)が 1967 年と、テキサス州の 2 つの地方公務員年金においては非常に早い時期から
採用されている。
これら 2 つの年金基金は保守的なファンディング方針を取っているため、キャッシュバ
ランス・プラン採用のみを理由とするものとは必ずしも言えないが、2013 年 12 月末のファ
ンディング比率は、TMRS が 84.1%、TCDRS が 89.4%と、共に健全な水準を維持してい
る。
カリフォルニア州教職員退職年金基金(CalSTRS)もキャッシュバランス・プランの採用基
17 キャッシュバランス・プランをハイブリッド・プランの一種とする考え方もあるが、本報告書では別個
の制度として取り扱っている
23
金として挙げられることもあるが、対象者はコミュニティ・カレッジのパートタイム・イ
ンストラクター向けに限定されており、比較的短期の雇用者が多く、伝統的な DB プラン
では不利となりやすい職種向けに採用しているものと考えられる。
金融危機後の動きとしては、ケンタッキー州の公務員年金(PERS)が 2014 年 1 月以降の
新規雇用者にキャッシュバランス・プランを採用した。最低保証利回りは 4.0%で、4%を超
える部分に対してはその 75%とするとされている。
カンザス州の公務員年金(PERS)は、2015 年 1 月以降の新規雇用者にキャッシュバラン
ス・プランを採用した。当初 2012 年に成立した法律では最低保証利率は 5.25%とされてい
たが、2014 年に成立した法律により 4.0%に引き下げられている。
尚、ルイジアナ州も 2013 年 7 月以降の新規雇用者にキャッシュバランス・プランを導入
する法律を成立させていたが、2013 年 1 月に、同法案を州議会の過半数の賛成で成立させ
たのは州憲法違反であり、3 分の 2 以上の賛成が必要であるとの司法判断が下り却下されて
いる。
5.3
ハイブリッド・プラン
「ハイブリッド・プラン」という用語は、様々なタイプの制度に対して使われているが、
本報告書では、確定給付年金(DB プラン)と確定拠出年金(DC プラン)が一体運営され
ており、加入者は DB と DC の双方に強制加入となる DB/DC 結合型のコンバインド・プラ
ン(Combined Plan)制度を、ハイブリッド・プランとしている。
[図表 1-31]
期間
1955
2003
2009
2010
2011
2013
2014
2014
未定
~
~
~
~
~
~
~
~
米地方公務員年金におけるハイブリッド・プランの採用状況
州
インディアナ州
オレゴン州
ジョージア州
ミシガン州
ユタ州
プエルトリコ
バージニア州
テネシー州
ロードアイランド州
基金
PERF/TRF
PERS/OPSRP
ERS
PSERS
RS
RS
RS
TCRS
ERS
備考
DCプランからの移行
ハイブリッド(DB/DC)とDCから選択
組合が訴訟提訴中
出所:各種資料から年金シニアプラン総合研究機構作成
インディアナ州では、
1955 年に Public Employees’ Retirement Fund (PERF)と Teachers’
Retirement Fund (TRF)の加入者に対して、DC プランである Annuity Saving Account
(ASA)を設定し、米地方公務員年金初のハイブリッド・プランとなっている。
ワシントン州では、1996 年 7 月に Teachers' Retirement System (TRS)に対して DB と
DC のハイブリッド・プランである Plan 3 を設置、2000 年 9 月には School Employees’
Retirement System (SERS)に、2002 年 3 月には Public Employees' Retirement System
24
(PERS)に、2002 年 9 月には地方自治体職員に対して、同様のハイブリッド・プランの提供
を行っているが、ワシントン州では新規雇用者に伝統的な DB プランとハイブリッド・プ
ランとの選択権を与えているため、[図表 1-31]には含めていない。
オレゴン州では、2003 年 8 月 29 日以降の新規雇用者は、新たに設立された DB と DC
のハイブリッド・プランである Oregon Public Service Retirement Plan (OPSRP)のメン
バーとなることとなった。ただし、大学教員等一部の加入者は、DC プランである Optional
Retirement Plan (ORP)を選択することが可能となっている。
ジョージア州の Employees’ Retirement System (ERS)は、2009 年からハイブリッド・
プランを導入した。ただし、ジョージア州 ERS のハイブリッド・プランでは、新規雇用者
は自動的に DC 部分にも加入させられるが、加入者には DC 部分から脱退するオプト・ア
ウト(Opt-out)の権利が与えられている。
ミシガン州の Michigan Public School Employees Retirement System (MPSERS)は、
DC プランからハイブリッド・プランへと移行した。2010 年 7 月以降の新規雇用者は、DB
と DC のハイブリッド・プランである Pension Plus Plan へと加入する。尚、2012 年 9 月
4 日以降の新規雇用者には、雇用後最初の給与支給日から 75 日以内に限り Pension Plus
Plan から DB プランへと移行するオプト・アウト(Opt-out)の権利が与えられている。
ユタ州では、2011 年 7 月以降の Utah Retirement Systems への新規加入者は、Tier2
Retirement System の加入者となり、ハイブリッド・プランと DC プランのどちらかを雇
用後 1 年以内に選択する制度となった。ハイブリッド・プランと DC プランの選択は変更
不能であり、新規加入者が選択権を行使しなかった場合には、ハイブリッド・プランの加
入者となることとしている。
ロードアイランド州では 2011 年に、ハイブリッド・プランへの移行を含む年金改革法案
が成立したが、公務員組合等が反対し訴訟を提訴、2013 年に和解案が提示されたものの、
警察組合が合意せず、年金改革は店晒しとなっている。2015 年 4 月に裁判所の審理が再開
される見込みと報道されている。
バージニア州では 2014 年 1 月以降の大半の新規雇用者が、テネシー州でも 2014 年 7 月
以降の新規雇用者が、ハイブリッド・プランの対象となっている。尚、テネシー州では、
地方自治体職員については、ハイブリッド・プランに参加するかどうかは、地方自治体毎
のスポンサーの判断にゆだねられている。
州ではないが、
プエルトリコでも 2013 年 7 月にハイブリッド・プランが導入されている。
プエルトリコでは、DB プランのファンディング比率が 10%以下にまで低下しており、プエ
ルトリコ政府自体がデフォルトの懸念を持たれる状況でもあったため、新規雇用者だけで
はなく、全職員がハイブリッド・プランへの移行の対象とされている。
25
[図表 1-32] ハイブリッド・プラン導入基金の制度概要
年金シ ステ ム 名
導入年
D C デ フ ォ ルト 投資フ ァンド
拠出率
D C-従業員
D C-雇用者
D B -従業員
D B -雇用者
Indiana PERS
1955
Guaranteed Fund
3%
-
-
○
Washington RS
1996
Target Date Fund
5~15%(加入者選択)
-
-
○
Ohio STRS
2001
Target Date Fund
10%
-
-
○
Ohio PERS
2002
Target Date Fund
10%
-
-
○
Oregon PERS
2003
DB Plan Fund
6%
-
-
○
Georgia ERS
2008
Lifecycle Fund
1~5%, 90d Optout
Max 3%
1.25%
○
Mississippi Public School
2010
Target Date Fund
2%
1%
Guradual
○
Optional
10%,
Public Safety 12%
10%,
Public Safety 12%
○
5%,
Muni P&F 3%
1%,
Muni P&F 3%
Teacher 3.75%,
Muni 1% or 2%,
Muni P&F 7%or8%
○
Utah RS
2010
Rhode Island ERS
2011
Medium Horizon Fund
Target Date Fund
Verginia RS
2012
Target Date Fund
1~5%
1~3.5%
4%
○
Tennessee CRS
2013
Target Date Fund
2% Optout
5%
5%
4%
出所:NASRA(2013)、“NASRA Issue Brief : State Hybrid Retirement Plans”
5.4
DB プラン/DC プラン/ハイブリッド・プラン選択型
バーモント州では、Vermont State Employees' Retirement System (VSERS)で 1999 年
から、Vermont Municipal Employees' Retirement System (VMERS)では 2007 年 7 月か
ら、DB プランと DC プランを加入者が選択できる制度となっている。ただし、2013 年 6
月末現在での DC プランの加入者は、VSERS で 419 名、VMERS で 289 名と少なく、資
産残高も VSERS で 4,910 万ドル、VMERS で 1,850 万ドルにとどまっている。
ノースダコタ州では 2001 年 1 月以降の新規雇用者の一部には、DB プランと DC プラン
の選択権を与えられている。また、2013 年 10 月から 2017 年 7 月までの間のすべての新規
雇用者にも DB プランと DC プランの選択権を与えられている。
DC プランの加入者は 2013
年 10 月現在 274 名、資産残高は 2013 年 6 月末現在 2,660 万ドルとなっている。
サウスカロライナ州では、
職域により 2001 年 7 月または 2002 年 7 月の新規雇用者から、
DC プランである State Optional Retirement Program (State ORP)への加入を選択できる
制度となっている。
オハイオ州では、State Teachers Retirement System of Ohio (STRS)では 2001 年から、
新規雇用者は、DB プラン、DC プラン、ハイブリッド・プランの 3 つの制度から選択する
ことが可能としている。また、Ohio Public Employees Retirement System (OPERS)でも
2003 年 1 月以降の新規雇用者は、DB プランである Traditional Pension Plan、DC プラン
である Member-Directed Plan、ハイブリッド・プランの Combined Plan の中から 1 つを
180 日以内に選択する仕組みとなっている。
モンタナ州の Public Employees’ Retirement System (PERS)では、2002 年 7 月以降の
新規雇用者は、DB プランと DC プランの選択が可能となった。新規雇用者は DB プランに
自動加入となるが、12 か月以内は DC プランへの移行が可能な制度となっている。2013 年
6 月現在の DC プランの資産額は 1 億 550 万㌦となっている。
26
コロラド州では、2006 年 1 月以降の新規雇用州政府職員、2008 年 1 月以降の特定のコ
ミュニティ・カレッジの新規職員は、DB プランと DC プランを選択可能となっている。
DC プランの選択者数は、2013 年末現在 4,719 名で、資産残高は 1 億 1,350 万ドルとなっ
ている。
[図表 1-33]
期間
1996
1999
2000
2000
2000
2001
2001
2002
2002
2003
2006
2011
~
~
~
~
~
~
~
~
~
~
~
~
州
ワシントン州
バーモント州
バーモント州
ワシントン州
ノースダコタ州
サウスカロライナ州
オハイオ州
ワシントン州
フロリダ州
オハイオ州
コロラド州
ユタ州
米地方公務員年金におけるプラン選択制度の採用状況
基金
TRS
SERS
MERS
SERS
PERS
RC
STRS
PERS
RS
PERS
PERA
RS
選択対象プラン
DB / - / Hybrid
DB / DC / DB / DC / DB / - / Hybrid
DB / DC / DB / DC / DB / DC / Hybrid
DB / - / Hybrid
DB / DC / Hybrid
DB / DC / Hybrid
DB / DC / - / DC / Hybrid
出所:各種資料から年金シニアプラン総合研究機構作成
27
備考
一部加入者のみ
一部加入者のみ
一部加入者のみ
第4章
主要米地方公務員年金概要データ
1 ターゲット・アロケーション 1……P89~P93
2 アセットアロケーション 2……P94~P98
3 パフォーマンス 3……P99~P105
4 ファンディング比率 4……P106~P114
5 その他(Web Site、加入者、投資残高)……P115~P122
1
各基金によって設定されている資産クラスの名称および区分は多岐に渡るため、資産クラスの区分及び
ウェイトは、当機構が最も近いとみなした区分に割り振っている。
2
同上。
3
運用利回りには手数料控除前の数値と控除後の数値が混在しており、開示方法の変更により同一基金でも
年度によって混在しているケースもある。
4
ファンディング比率の計算前提は各基金で異なっており、一概に横比較はできない。
88
[図表 4-1] 主要米地方公務員年金のターゲット・アロケーション
US
Equity
Non-US
Equity
名称
略称
州
Retirement Systems of
Alabama
(TRS, ERS,JRF)
RSA
アラバマ
Alaska Retirement
Management Board
(PERS, TRS)
ARMB
アラスカ
26%
25%
Arizona State Retirement
System
ASRS
アリゾナ
33%
17%
Public Safety Personnel
Retirement System
PSPRS
アリゾナ
17%
Arkansas Teacher
Retirement System
ATRS
アーカン
ソー
20%
EM
Equity
<Equity
Total>
国内株
外国株
上限 65% 上限 25%
Core
Fixed
Income
NonCore
Fixed
Income
<Fixed
Income
Total>
TIPS
Inflation
Real
Return
Private
Equiy
国内債
外国債
上限 50% 上限 10%
51%
6%
Real
Estate
Hedge Alternati
Real
Fund /
ve
Assets Absolute Investm
Return
ents
不動産
上限 15%
12%
56%
13%
12%
25%
14%
31%
8%
12%
30%
9%
4%
17%
8%
20%
10%
11%
50%
20%
10%
15%
12%
8%
カリフォル
ニア
51%
19%
6%
10%
California State Teachers’
Retirement System
CalSTRS
カリフォル
ニア
55%
17%
1%
13%
13%
Los Angeles City
Employees’ Retirement
System
LACERS
カリフォル
ニア
24%
29%
53%
19%
12%
5%
Orange County Employees
Retirement System
OCERS
カリフォル
ニア
15%
15%
6%
36%
5%
10%
San Diego City Employees’
Retirement System
SDCERS
カリフォル
ニア
21%
19%
1%
41%
27%
10%
11%
3%
Sacramento County
Employees’ Retirement
System
SCERS
カリフォル
ニア
22.5%
22.5%
45%
20%
10%
7%
6%
Contra Costa County
Employees’ Retirement
Association
CCCERA
カリフォル
ニア
46.6%
23.6%
5.0%
28.6%
San Diego County
Employees Retirement
Association
SDCERA
カリフォル
ニア
25%
40%
15%
55%
26%
10%
5.0%
Water and Power
Employees’ Retirement,
LADWP
Disability and Death Benefit
Insurance Plan
カリフォル
ニア
34%
21%
55%
25%
6%
Alameda County Employees’
ACERA
Retirement Association
カリフォル
ニア
32%
27%
59%
15%
5%
Los Angeles County
Employees Retirement
Association
カリフォル
ニア
24%
25%
49%
25%
LACERA
5%
<Alterna
tives
Total>
Cash
各資産の上限のみ設定
34%
4%
10%
47%
5%
2%
0%
5%
5%
13%
8%
10%
2%
6.0%
3%
枠外でGTAA10%、
不動産はInflation Linked Assetsの内
訳、
インフレーションの4%はコモディティ
0.8%
Credit Opportunities 12% (Fixed
Income)
30%
Opportunistic/Alternatives 5.0%,
Real Assets内訳(10% Real Estate,2%
Timber, 1% Agriculture, 2%
Infrastructure)
30%
Growth 61%(Public Equity 51%, Private
Equity 10%), Income 19%, Real Assets
12%, Inflation 6%, Liquidity 2%
27%
1%
Inflation sensitive 1%
27%
1%
Credit Opportunities 5%
38%
Diversified Credit 7%,
Int'l Fixed Income 3%,
Emerging Markets Debt 3%
32%
Emerging Markets Debt 5.0%,
Infrastructure 3.0%,
Opportunistic 8.0%
35%
Commodities 2.0%
24.3%
0.5%
Inflation Hedge 5.0%, High Yield 5.0%,
Opportunistic 0.8%, Alt Inv/ 6.0%
<Current Target>
<Market Exposure>
HF=Asset allocation Strategy 10% &
Relative Value Strategy 10%
4%
4%
5%
19%
6%
15%
26%
PEARLS 15%
3%
26%
Commodities 2.0%
2%
10%
2%
10%
10%
20%
備考
10%
11%
89
Others
3%
4%
12.5%
5%
Opportu
nity
19%
California Public Employees’ CalPERS
(PERF)
Retirement System
13%
GTAA
オルタナ
上限 10%
7%
13%
Risk
Parity
55%
1%
Covered Call 5%
US
Equity
Non-US
Equity
カリフォル
ニア
23.5%
23.5%
UCRP
カリフォル
ニア
23.25%
15.50%
Colorado Public Employees'
Retirement Association
COPERA
コロラド
Connecticut Teachers'
Retirement Board
CTTRB
コネチカット
Delaware Public Employees'
Retirement System
DPERS
デラウェア
District of Columbia
Retirement Board
DCRB
コロンビア
特別州
Florida Retirement System
FRS
フロリダ
Teachers Retirement
System of Georgia
TRS-GA
ジョージア
Employees' Retirement
System of Georgia
ERS-GA
ジョージア
Employees' Retirement
System of State of Hawaii
HIERS
ハワイ
名称
略称
州
San Francisco Employees’
Retirement System
SFERS
University of California
Retirement Plan
EM
Equity
<Equity
Total>
Core
Fixed
Income
NonCore
Fixed
Income
47%
6.75%
45.5%
18%
9%
48%
TIPS
Inflation
Real
Return
Private
Equiy
25%
12.0%
5.0%
56%
21%
<Fixed
Income
Total>
17.0%
16%
23%
Hedge Alternati
Real
Fund /
ve
Assets Absolute Investm
Return
ents
12%
5.5%
7.75%
25%
7%
Real
Estate
3%
11%
5.25%
Risk
Parity
GTAA
Opportu
nity
Others
16%
3.0%
6.0%
7%
7%
8%
3.5%
5%
37.5%
備考
0.0%
Opportunistic Equity 3.5%,
High Yield 2.5%, EM Debt 2.5%,
Cross-Asset Class Strategy 3.5%
19%
Opportunity Fund 5%
29%
Emerging Markets Debt 5.0%,
High Yield 5.0%,
Liquidity 6.0%
No Target Allocation,
Only Minimum / Maximum
21%
18%
9%
48%
27%
8%
52%
24%
5%
55-75%
25-45%
7%
10%
25%
7%
11%
23%
1%
Strategic Investment 11%
<Target Range>
NA
76%
12%
5%
7%
アイダホ
55%
15%
70%
Teachers’ Retirement
System of the State of
Illinois
イリノイ
23%
20%
43%
16%
Illinois Municipal Retirement
IMRF
Fund
イリノイ
38%
17%
55%
27%
Illinois State Board of
Investment
ISBI
イリノイ
30%
20%
50%
16%
5%
10%
5%
10%
4%
34%
Public School Teachers’
Pension and Retirement
Fund of Chicago
CTPF
イリノイ
31.3%
31.2%
62.5%
19.5%
3.0%
6.5%
2.0%
2.0%
2.5%
16%
County Employees’ and
Officers’ Annuity and
Benefit Fund of Cook
County
CCPF
イリノイ
25%
20%
45%
32%
6%
8%
9%
State Universities
Retirement System of
Illinois
ILSURS
イリノイ
6%
6%
5%
50%
30%
19%
Broad Growth 76%,
Principal Protection 12%,
Real Return 5%,
Real Estate 7%
12%
Public Employee Retirement
PERSI
System of Idaho
ILTRS
Cash
28%
6.5%
7%
<Alterna
tives
Total>
30%
3%
22%
10%
11%
13%
6%
8%
4%
90
9%
1%
6%
40%
1%
Interim Target
17%
1%
Agriculture/Timber 2%,
Hedge unds 2%,
Private Equity 5%
US Equity Hedge funds 10%,
Bank Loans 4%
2.0%
Public REIT 2.5%,
Infrastructure 2.0%
23%
Hedge Funds-of-Funds 9%
28%
Emerging Markets Debt 3.0%,
Opportunity Funf 1.0%,
Commodities 2.0%, REITa 4.0%
US
Equity
Non-US
Equity
EM
Equity
<Equity
Total>
Core
Fixed
Income
NonCore
Fixed
Income
Private
Equiy
Real
Estate
Hedge Alternati
Real
Fund /
ve
Assets Absolute Investm
Return
ents
Risk
Parity
10.0%
10.0%
7.5%
10.0%
10.0%
5%
13%
8%
<Fixed
Income
Total>
TIPS
22.0%
33%
Inflation
Real
Return
名称
略称
州
Indiana Public Retirement
System
INPRS
インディア
ナ
Iowa Public Employees'
Retirement System
IPERS
アイオワ
23%
15%
38%
Kansas Public Employee
Retirement System
KPERS
カンザス
29%
27%
56%
15%
Teachers’ Retirement
System of the State of
Kentucky
KTRS
ケンタッ
キー
45%
17%
62%
21%
Teachers’ Retirement
System of Louisiana
TRSL
ルイジアナ
31%
11%
8%
50%
12%
9%
21%
2%
Louisiana State Employees'
Retirement System
LASERS
ルイジアナ
27%
18%
12%
57%
4%
8%
12%
13%
Maine Public Employees
Retirement System
MEPERS
メイン
20%
20%
25%
10%
10%
Maryland State Retirement
and Pension System
MDSPRS
メリーランド
35%
10%
10%
20%
10%
10%
Massachusetts Pension
Reserves Investment
Management Board
MAPRIM
マサチュー
セッツ
40%
13%
10%
23%
10%
10%
Michigan Public School
Employees' Retirement
System
MPSERS
ミシガン
Michigan Municipal
Employees’ Retirement
System
MERS
ミシガン
Minnesota State Retirement
MSRS
System
ミネソタ
Public Employees'
Retirement System of
Mississippi
MSPERS
ミシシッピ
Public School and Public
Education Employee
Retirement Systems of
Missouri
PSRS/PE
ミズーリ
ERS
Missouri State Employees’
Retirement System
MOSERS
ミズーリ
Missouri Local Government
Employees Retirement
System
LAGERS
ミズーリ
22.5%
31%
45%
27%
16%
15%
15%
28%
5%
40%
47%
15%
57.5%
20.0%
60%
18%
61%
20%
42%
16%
12%
9%
14%
GTAA
Opportu
nity
Others
<Alterna
tives
Total>
8.0%
56%
2%
18%
30%
48.75%
24%
Private Equity / Debt 13%,
Core Plus Fixed Income 28%,
Credit Opportunities 5%
1%
<Interim Target>
Yield Driven 6.0%
4%
5%
6%
15%
2%
Additional Categories 6.0%
19%
29%
Corporate Finance 11%,
Mezzanine/distressed debt 6%,
Opportunistic Real Estate 3%
31%
High Yield 4%, Opportunistic Credit 2%,
Emerging Markets Debt 2%,
Real Assets/Inflation Protection Inv.
3%
35%
Infrastructure 10%,
Hard Assets 5%
4%
1%
3%
3%
8%
7%
10%
5%
10%
4%
44%
9%
9%
4%
16%
10%
10.5%
7.5%
6%
7.5%
6.5%
4%
20%
1%
Credit / Debt Strategies 10%
Core Fixed Income 10%,
Value-Add Fixed Income 10%,
Timber / National Resources 4%
37%
34%
10.0%
15%
91
1%
28%
8%
6.5%
28%
6%
20%
9%
Commodities 8.0%
4%
12.5%
4%
備考
9%
9%
28%
Cash
4%
23%
Real Estate and Infrastructure 9.0%
Diversified Strategies 10.0%
20%
2%
18%
1%
Debt Securities 20.0%
2%
30%
Public Credit 12%,
Private Credit 2%
Hedged Assets 6%
8%
73%
Illiuid Investments 20%,
Alternative Beta 15%,
Commodities 8%
2.75%
27.25%
Timber 4.0%,
Commodities 2.75%,
Other Real Assets 2.5%
名称
略称
州
Montana Public Employees
Retirement Administration
MPERA
モンタナ
Nebraska Investment
Council DB PLAN
NEIC
ネブラスカ
Public Employees’
Retirement System of
Nevada
NVPERS
New Hampshire Retirement
System
US
Equity
Non-US
Equity
EM
Equity
<Equity
Total>
Core
Fixed
Income
NonCore
Fixed
Income
<Fixed
Income
Total>
TIPS
Inflation
Real
Return
Private
Equiy
Real
Estate
Hedge Alternati
Real
Fund /
ve
Assets Absolute Investm
Return
ents
Risk
Parity
GTAA
Opportu
nity
Others
<Alterna
tives
Total>
Cash
備考
レンジのみ設定
29.0%
28.5%
57.5%
30.0%
ネバダ
42%
18%
60%
30%
NHRS
ニューハン
プシャー
30%
20%
50%
25%
New Jersey State
Investment Council
NJSIC
ニュー
ジャージー
25.9%
12.7%
6.5%
45.1%
12.2%
9.25%
21.45%
State of New Mexico
Educational Retirement
Board
NMERB
ニューメキ
シコ
22%
5%
10%
37%
7%
22%
29%
Public Employees
Retirement association New NMPERA
Mexico
ニューメキ
シコ
29%
20%
49%
26%
New York State and Local
Retirement System
NYSLRS
ニューヨー
ク
36.0%
15.5%
51.5%
21.0%
New York City Employees'
Retirement System
NYCERS
ニューヨー
ク
32.6%
16.9%
49.5%
33.5%
North Carolina Retirement
System Division
NCRS
ノースカロ
ライナ
School Employees
Retirement System of Ohio
OHSERS
オハイオ
22.5%
22.5%
45.0%
19.0%
Ohio Police & Fire Pension
Fund
OP&F
オハイオ
18.5%
18.5%
37.0%
State Teachers Retirement
System of Ohio
STRSOH
オハイオ
31%
26%
57%
Ohio Public Employees
Retirement System
OPERS
オハイオ
Oklahoma Teachers
Retirement System
OTRS
オクラホマ
40.0%
Oklahoma Public Employees
Retirement System
OKPERS
オクラホマ
44%
Oregon Public Employees
Retirement System
ORPERS
オレゴン
11.5%
15.0%
26.5%
5.0%
10.0%
13.5%
23.5%
17.5%
57.5%
17.5%
6.0%
23.5%
24%
68.0%
32%
37.5%
20.0%
12.5%
10%
10%
2.5%
7%
8.5%
15%
7.0%
3.2%
8%
5%
5%
3%
5%
7%
9.0%
6.0%
0.0%
3.0%
2.5%
12.25%
3%
10.0%
6.5%
1.0%
92
8.0%
12.0%
7%
10%
10.0%
10.0%
5.0%
20.0%
10%
5%
5%
1.0%
27.5%
6.0%
33%
1%
Absolute Return 4.5%, Equity Oriented
Hedge Funds 4.0%,Credit Oriented
Hedge Funds 3.75%
Inflation Linked Assets 7.0%,
Opportunistic Credit 20%,
Emerging Markets Debt 2%
20.0%
<Total 95%>
27.5%
<Current Interim Policy>
Opportunistic Funds 1.0%,
Bons, Cash & Mortgages 21.0%
17.0%
15.0%
10.0%
35.0%
5.0%
5.0%
36.5%
7%
6.0%
Private Markets 10%
25%
17.0%
18%
42.5%
7.5%
2.0%
2.0%
2.0%
24%
1.0%
34.0%
7.0%
7.0%
19%
12.5%
10.0%
42.5%
1.0%
Multi-Asset Strategies 10%
MLPs 5.0%,
Timber 5%
High Yield 15%
1%
Opportunistic / Diversified 7%
Emerging Markets Debt 3.0%,
Floating Rate Debt 1.0%,
Securitized Debt 1.0%
MLPs 7.0%
Alternative Equity 10%
US
Equity
Non-US
Equity
EM
Equity
<Equity
Total>
Core
Fixed
Income
NonCore
Fixed
Income
<Fixed
Income
Total>
名称
略称
州
Pennsylvania Public School
Employees’ Retirement
System
PAPSERS
ペンシルバ
ニア
18%
23%
Commonwealth of
Pennsylvania State
Employees’ Retirement
System
PA-SERS
ペンシルバ
ニア
38%
19%
Employees’ Retirement
System of Rhode Island
ERSRI
ロードアイ
ランド
South Carolina Public
Employee Benefit Authority
SCPEBA
South Dakota Retirement
Systems
Tennessee Consolidated
Retirement System
23.5%
18.0%
5.5%
47.0%
15.0%
5.1%
20.1%
サウスカロ
ライナ
31%
7%
18%
SDRS
サウスダコ
タ
56%
19%
7%
TCRS
テネシー
33%
17%
5%
55%
25%
Teacher Retirement System
TRSTX
of Texas
テキサス
20%
15%
10%
45%
13%
Texas Municipal Retirement
System
TMRS
テキサス
17.5%
17.5%
Texas County & District
Retirement System
TCDRS
テキサス
16.5%
12.5%
Employees Retirement
System of Texas
ERS-TX
Utah Retirement Systems
Inflation
Real
Return
Private
Equiy
Real
Estate
Hedge Alternati
Real
Fund /
ve
Assets Absolute Investm
Return
ents
Risk
Parity
14%
10%
5%
15%
3.7%
6.6%
25%
9%
5%
8%
26%
7%
8%
0%
4%
3%
7%
5%
11%
30.0%
10.0%
40.0%
38.0%
3.0%
8.0%
テキサス
45%
15%
10%
URS
ユタ
40%
Virginia Retirement System
VRS
バージニア
Washington State
Investment Board
WSIB
ワシントン
West Virginia Investment
Management Board
WVIMB
ウェスト
バージニア
25%
State of Wisconsin
Investment Board
SWIB
ウィスコン
シン
Wyoming Retirement System WYRS
ワイオミン
グ
4.0%
5.0%
13%
5.0%
10.0%
5.0%
11.0%
12.0%
3.0%
25.0%
25%
10%
7%
20%
5%
9%
13%
18%
27%
12.0%
15.0%
37%
20%
23%
15%
25%
50%
20%
10%
10%
24%
26%
50%
27%
7%
7%
26%
22%
16.5%
6.0%
9%
42.0%
57%
15.0%
9%
12.0%
15%
24%
8%
8%
出所:各基金アニュアルレポートまたはホームページより年金シニアプラン総合研究機構作成
93
Opportu
nity
10%
9%
4%
19.5%
21%
GTAA
13%
7.4%
35.0%
9.0%
TIPS
Others
<Alterna
tives
Total>
9%
59%
12%
40%
3%
7.8%
29.5%
3.4%
10%
42%
2%
Private Debt 7.0%,
Commodities 3.0%,
GTAA/Risk Parity 10.0%
1%
16%
2%
Arbitrage / Aggressive Absolute Return
0.0%,
Commodities 1.0%
5%
19%
1%
Strategic Lending 5%,
Canadian Equity 4%,
Short-Term Securities 1%
3%
41%
1%
Directional HF 5%,Stable Value HF 4%,
Enerfy & Natural Resources 3%,
Commodities 0%
Cash
備考
Commodities 6.0%,
Master Limited Partnerships 3.0%
Diversifying Assets 12.0%
<Tactical Asset Allocation>
Equity-Alternative 7.8%,
Infrastructure 0.0%
25%
5.0%
6.0%
51.0%
3%
29%
Opportunistic Credit 5%, Distresse Debt
3%, Direct Lending 2%,
REITs 2%, MLP 2%,
Commodities 2.0%
1%
Pubric Infrastructure 1%, Private
Infrstructure 3%, Public Real Estate 3%,
Special Situations 0 - 5%
1.0%
Emerging Debt 3%, Rate-Sensitive
Credit 4.5%, Non-Rate-Sensitive Credit
4.5%,Convertibles 3%,Public Real Assets
2.25%, Private Real assets 12.75%
40%
3.0%
5%
10%
5%
10%
30.0%
43%
Tangible Assets 5.0%
30%
<PERS>
Strategic Allocation
27%
<Core Fund Policy>
Total 104%
Multi-Asset 5%
Private Equity / Debt 7%
18%
2%
<Tactical Asset Allocation>
[図表 4-2]
主要米地方公務員年金のアセットアロケーション
Date
US
Equity
Non-US
Equity
EM
Equity
<Equity
Total>
Core
Fixed
Income
NonCore
Fixed
Income
<Fixed
Income
Total>
TIPS
Inflation
Real
Return
Private
Equiy
Real
Estate
アラバマ
↓
-
-
-
-
-
-
-
-
-
-
-
-
(Teachers’ Retirement System) <TRS>
<アラバマ>
Sep-13
51.1%
14.4%
65.5%
23.2%
(Employees’ Retirement
System)
<ERS>
<アラバマ>
Sep-13
50.7%
13.1%
63.8%
(Judicial Retirement Fund)
<JRF>
<アラバマ>
Sep-13
57.2%
15.6%
72.8%
Alaska Retirement
Management Board
ARMB
アラスカ
↓
-
-
(Public Employees’ Retirement
System)
<PERS>
<アラスカ>
Jun-14
27.1%
24.4%
51.5%
12.1%
(Teachers’ Retirement System) <TRS>
<アラスカ>
Jun-14
27.1%
24.4%
51.5%
Arizona State Retirement
System
ASRS
アリゾナ
Jun-14
31.6%
20.7%
Public Safety Personnel
Retirement System
PSPRS
アリゾナ
Jun-13
18.2%
Arkansas Teacher
Retirement System
ATRS
アーカン
ソー
Jun-13
27.1%
California Public Employees’ CalPERS
Retirement System
(PERF)
カリフォル
ニア
California State Teachers’
Retirement System
CalSTRS
Los Angeles City
Employees’ Retirement
System
名称
略称
州
Retirement Systems of
Alabama
RSA
-
-
GTAA
Opportu
nity
Others
<Alterna
tives
Total>
Cash /
Shortterm
備考
-
-
-
-
-
-
-
9.5%
9.5%
1.8%
22.7%
9.6%
9.6%
3.9%
23.8%
1.2%
1.2%
2.3%
-
-
16.8%
3.9%
4.3%
33.1%
3.3%
12.1%
8.2%
16.8%
3.9%
4.3%
33.1%
3.3%
52.3%
19.7%
6.2%
5.9%
0.3%
14.1%
32.3%
11.1%
11.3%
13.2%
6.4%
30.6%
57.7%
18.0%
9.3%
9.0%
Jun-14
53.1%
15.6%
3.3%
10.5%
カリフォル
ニア
Jun-14
57.3%
15.5%
0.7%
11.5%
11.7%
LACERS
カリフォル
ニア
Jun-13
38.8%
21.2%
60.0%
22.7%
10.0%
5.7%
Orange County Employees
Retirement System
OCERS
カリフォル
ニア
Jun-13
17.0%
18.0%
4.0%
39.0%
4.0%
9.0%
San Diego City Employees’
Retirement System
SDCERS
カリフォル
ニア
Jun-14
27.5%
22.7%
1.0%
51.2%
28.1%
5.5%
9.6%
Sacramento County
Employees’ Retirement
System
SCERS
カリフォル
ニア
Jun-14
24.2%
24.6%
48.8%
19.0%
3.8%
Contra Costa County
Employees’ Retirement
Association
CCCERA
カリフォル
ニア
Dec-13
4.8%
-
-
24.0%
26.7%
9.0%
4.9%
94
-
-
-
8.2%
21.9%
-
-
-
12.0%
-
-
-
12.0%
-
Risk
Parity
-
49.5%
-
Hedge Alternati
Real
Fund /
ve
Assets Absolute Investm
Return
ents
10.0%
2.2%
-
-
-
1.0%
23.1%
4.9%
Opportunistic Equity 1.0%,
Farmland & Timber 0.3%,
Pricate Debt 3.4%(FI)
8.6%
9.0%
54.8%
1.8%
Credit Opportunities 9.02%
5.4%
23.7%
0.6%
Other Alternatives 5.4%
3.0%
28.3%
3.0%
Liquidity 3.0%
24.7%
2.5%
16.5%
0.8%
Credit Opportunities 0.8%
35.0%
2.0%
Diversified Credit 6%,
Int'l Fixed Income 3%,
Emerging Markets Debt 3%
18.0%
2.7%
Emerging Markets Debt 4.9%,
Infrastructure 0.7%,
Opportunistic Fund 2.2%
30.2%
2.0%
Opportunities 2.0%,
Overlay 1.6%
23.4%
0.4%
Inflation Hedge 4.9%, High Yield 4.8%,
Opportunistic 0.5%, Alt Inv/ 6.3%
1.5%
0.0%
0.8%
13.0%
0.7%
2.2%
9.7%
1.0%
6.3%
-
9.7%
0.8%
14.1%
11.7%
4.1%
-
0.5%
1.6%
TIPS
21.0%
20.0%
2.0%
22.0%
59.0%
24.0%
5.0%
36.5%
31.1%
67.6%
15.3%
3.9%
Jun-14
26.1%
25.7%
51.8%
21.0%
カリフォル
ニア
Jun-13
28.0%
24.3%
52.3%
25.1%
UCRP
カリフォル
ニア
Jun-14
50.0%
23.0%
Colorado Public Employees'
Retirement Association
COPERA
コロラド
Dec-13
58.4%
23.4%
Connecticut Teachers'
Retirement Board
CTTRB
コネチカット Jun-14
24.2%
21.8%
Delaware Public Employees'
Retirement System
DPERS
デラウェア
Jun-14
39.5%
7.0%
District of Columbia
Retirement Board
DCRB
コロンビア
特別州
Sep-13
23.0%
20.0%
Florida Retirement System
FRS
フロリダ
Teachers Retirement
System of Georgia
TRS-GA
Employees' Retirement
System of Georgia
Employees' Retirement
System of State of Hawaii
略称
州
San Diego County
Employees Retirement
Association
SDCERA
カリフォル
ニア
Jun-14
Water and Power
Employees’ Retirement,
LADWP
Disability and Death Benefit
Insurance Plan
カリフォル
ニア
Jun-13
37.0%
Alameda County Employees’
ACERA
Retirement Association
カリフォル
ニア
Dec-13
Los Angeles County
Employees Retirement
Association
LACERA
カリフォル
ニア
San Francisco Employees’
Retirement System
SFERS
University of California
Retirement Plan
Non-US
Equity
EM
Equity
9.2%
55.2%
7.2%
15.0%
22.2%
46.5%
20.9%
7.4%
28.3%
Inflation
Real
Return
<Alterna
tives
Total>
1.0%
3.0%
59.0%
3.0%
5.0%
15.0%
2.0%
Covered Call 5%
6.4%
6.6%
16.9%
0.1%
PEARLS 6.6%
4.4%
23.9%
3.3%
Commodities 4.4%
21.4%
1.2%
9.0%
10.0%
2.0%
11.0%
10.2%
23.0%
7.0%
3.1%
10.1%
7.0%
Jun-13
59.1%
22.0%
5.2%
ジョージア
Jun-14
72.4%
27.6%
ERS-GA
ジョージア
Jun-13
55.6%
37.2%
HIERS
ハワイ
Jun-13
63.9%
21.5%
Public Employee Retirement
PERSI
System of Idaho
アイダホ
Jun-14
42.0%
21.9%
63.9%
23.1%
Teachers’ Retirement
System of the State of
Illinois
イリノイ
Jun-14
20.8%
22.0%
42.8%
17.1%
Illinois Municipal Retirement
IMRF
Fund
イリノイ
Dec-13
45%
20%
65%
26.0%
Illinois State Board of
Investment
イリノイ
Jun-14
30.0%
16.0%
46.0%
16.0%
Risk
Parity
GTAA
1.1%
9.2%
28.0%
ISBI
Others
Real
Estate
8.2%
Hedge Alternati
Real
Fund /
ve
Assets Absolute Investm
Return
ents
Opportu
nity
Private
Equiy
53.0%
ILTRS
10.0%
<Equity
Total>
Core
Fixed
Income
NonCore
Fixed
Income
<Fixed
Income
Total>
Date
US
Equity
名称
12.2%
6.0%
14.0%
備考
High Yield 5%, EM Debt 9%,
Global Macro /CTA 17%,
Relative Value 6%
27.0%
7.1%
7.8%
5.0%
4.4%
22.6%
19.0%
19.0%
6.2%
18.0%
1.0%
18.0%
0.9%
Strategic Investment 5.1%
1.5%
Mutual and Common Collective Trust
Funds and Separate Accounts 5.7%
6.0%
2.5%
Cash /
Shortterm
17.4%
5.0%
7.7%
5.1%
0.8%
Opportunity Fund 5%
Emerging Markets Debt 5.0%,
High Yield 5.0%,
Liquidity 6.0%
Domestic Fixed Income 20.9%,
International Fixed Income 7.4%
0.0%
5.7%
9.5%
9.0%
7.1%
3.0%
11.1%
12.4%
5.1%
4.0%
95
10.0%
14.7%
5.8%
3.3%
3.7%
3.0%
10.0%
5.7%
10.0%
10.1%
2.9%
38.3%
1.8%
7.0%
2.4%
Timber and Agriculture 0.7%
37.0%
1.0%
Commingled Funds 5%,
Bank Loans 5%,
US Equity Hedge Funds 10%
Date
US
Equity
Non-US
Equity
イリノイ
Jun-14
32.0%
27.0%
59.0%
CCPF
イリノイ
Dec-13
32.0%
20.0%
State Universities
Retirement System of
Illinois
ILSURS
イリノイ
Indiana Public Retirement
System
INPRS
Iowa Public Employees'
Retirement System
<Fixed
Income
Total>
18.3%
2.7%
7.4%
52.0%
24.0%
1.0%
8.0%
Jun-14
62.9%
19.2%
3.9%
6.1%
7.5%
インディア
ナ
Jun-14
23.6%
22.2%
9.4%
12.7%
5.4%
IPERS
アイオワ
Jun-14
26.3%
15.8%
42.2%
32.3%
4.3%
11.0%
7.8%
Kansas Public Employee
Retirement System
KPERS
カンザス
Jun-14
30.2%
28.2%
58.4%
14.7%
Teachers’ Retirement
System of the State of
Kentucky
KTRS
ケンタッ
キー
Jun-13
46.5%
16.7%
63.2%
21.3%
2.1%
4.0%
Teachers’ Retirement
System of Louisiana
TRSL
ルイジアナ
Jun-14
29.7%
21.1%
50.8%
19.6%
14.5%
7.9%
Louisiana State Employees'
Retirement System
LASERS
ルイジアナ
Jun-14
25.7%
29.2%
54.9%
13.7%
12.8%
Maine Public Employees
Retirement System
MEPERS
メイン
Jun-14
31.8%
26.1%
57.9%
23.5%
2.9%
7.3%
Maryland State Retirement
and Pension System
MDSPRS
メリーランド
Jun-14
38.9%
14.8%
10.0%
24.8%
7.0%
6.8%
Massachusetts Pension
Reserves Investment
Management Board
MAPRIM
マサチュー
セッツ
Jun-14
43.1%
13.9%
8.5%
22.4%
11.1%
8.9%
Michigan Public School
Employees' Retirement
System
MPSERS
ミシガン
Sep-13
27.0%
14.8%
41.8%
12.1%
Michigan Municipal
Employees’ Retirement
System
MERS
ミシガン
Dec-13
36.4%
12.6%
49.0%
28.5%
Minnesota State Retirement
MSRS
System
ミネソタ
Jun-14
45.8%
15.6%
61.4%
23.4%
Public Employees'
Retirement System of
Mississippi
MSPERS
ミシシッピ
Jun-14
66.0%
20.0%
Public School and Public
Education Employee
Retirement Systems of
Missouri
PSRS/PE
ミズーリ
ERS
Jun-14
Missouri State Employees’
Retirement System
MOSERS
Jun-14
州
Public School Teachers’
Pension and Retirement
Fund of Chicago
CTPF
County Employees’ and
Officers’ Annuity and
Benefit Fund of Cook
County
ミズーリ
32.8%
15.4%
<Equity
Total>
NonCore
Fixed
Income
Real
Estate
略称
EM
Equity
Core
Fixed
Income
Private
Equiy
名称
48.2%
9.0%
27.2%
11.0%
5.1%
7.7%
TIPS
Inflation
Real
Return
8.4%
12.0%
Hedge Alternati
Real
Fund /
ve
Assets Absolute Investm
Return
ents
2.2%
7.1%
GTAA
Opportu
nity
0.3%
Others
<Alterna
tives
Total>
Cash /
Shortterm
1.8%
14.3%
8.4%
Public REUT 1.78%,
Infrastructure 2.20%
18.0%
6.0%
Hedge Funds-of-Funds 9%
9.0%
0.4%
8.7%
10.2%
7.8%
2.9%
1.2%
1.3%
7.9%
Private Equity / Debt 10.99%,
Core Plus FI 27.19%,
Credit Opportunities 5.12%
5.7%
24.9%
2.0%
Yield Driven 5.7%
5.8%
13.1%
2.4%
Additional Categories 5.8%,
Timberland 1.2%
2.2%
24.6%
5.0%
Mezzanine financing 2.2%
28.5%
2.9%
Private Placements 12.8%
18.5%
0.2%
Infrastructure 3.3%,
Hard Assets 0.0%,
Other 5.0%
35.2%
1.1%
Credit / Debt Strategies 10%
5.0%
9.6%
10.5%
1.0%
19.4%
4.3%
18.7%
1.4%
17.0%
29.0%
9.0%
7.0%
7.0%
5.4%
Real Estate and Infrastructure 10.8%
16.7%
5.8%
Commodities 4.4%,
Overlay 0.9%
12.6%
2.6%
13.0%
1.0%
Debt Securities 20.0%
1.0%
29.9%
2.9%
Public Credit 7.7%,
Private Credit 1.0%,
Hedged Assets 13.5%
8.0%
74.0%
5.3%
13.5%
15.0%
96
22.0%
Timber / National Resources 3.9%
Portable Alpha Wind Down 0.1%,
Oberlay 0.9%
34.5%
40.7%
12.6%
4.0%
Commodities 7.8%
0.8%
9.4%
3.9%
54.2%
24.8%
6.5%
3.3%
備考
17.9%
1.7%
7.9%
10.8%
Risk
Parity
Illiuid Investments 22%,
Alternative Beta 15%,
Commodities 8%
Date
US
Equity
名称
略称
州
Missouri Local Government
Employees Retirement
System
LAGERS
ミズーリ
Jun-14
Montana Public Employees
Retirement Administration
MPERA
モンタナ
Jun-13
38.3%
Nebraska Investment
Council DB PLAN
NEIC
ネブラスカ
Jun-14
Public Employees’
Retirement System of
Nevada
NVPERS
ネバダ
New Hampshire Retirement
System
NHRS
New Jersey State
Investment Council
State of New Mexico
Educational Retirement
Board
Non-US
Equity
EM
Equity
<Equity
Total>
Core
Fixed
Income
NonCore
Fixed
Income
<Fixed
Income
Total>
TIPS
Inflation
Real
Return
Private
Equiy
Real
Estate
Hedge Alternati
Real
Fund /
ve
Assets Absolute Investm
Return
ents
GTAA
Opportu
nity
<Alterna
tives
Total>
3.1%
27.9%
Timber 2.6%,
Commodities 3.1%,
Other Real Assets 3.0%
0.0%
21.7%
Structured Investment Vehicles 0.03%
24.0%
7.7%
7.9%
16.6%
54.9%
23.4%
12.5%
9.2%
36.2%
28.0%
64.2%
27.6%
3.8%
4.4%
8.2%
Jun-14
43.5%
18.3%
61.8%
28.1%
3.2%
3.9%
7.1%
ニューハン
プシャー
Jun-14
42.4%
20.6%
63.0%
21.5%
NJSIC
ニュー
ジャージー
Jun-14
26.4%
12.3%
6.4%
45.2%
12.6%
5.9%
18.5%
NMERB
ニューメキ
シコ
Jun-14
22.8%
5.3%
10.1%
38.2%
9.5%
23.1%
32.6%
Public Employees
Retirement association New NMPERA
Mexico
ニューメキ
シコ
Jun-13
27.2%
25.3%
52.5%
20.9%
New York State and Local
Retirement System
NYSLRS
ニューヨー
ク
Mar-14
37.7%
16.8%
54.5%
21.4%
5.8%
7.9%
New York City Employees'
Retirement System
NYCERS
ニューヨー
ク
Jun-14
33.0%
15.1%
48.1%
20.5%
2.5%
12.8%
North Carolina Retirement
System Division
NCRS
ノースカロ
ライナ
Jun-13
46.4%
33.8%
School Employees
Retirement System of Ohio
OHSERS
オハイオ
Jun-14
25.0%
24.7%
49.7%
14.9%
Ohio Police & Fire Pension
Fund
OP&F
オハイオ
Dec-13
26.6%
24.3%
50.9%
22.7%
State Teachers Retirement
System of Ohio
STRSOH
オハイオ
Jun-14
29.6%
23.9%
53.5%
20.5%
Ohio Public Employees
Retirement System
OPERS
オハイオ
Dec-13
21.1%
23.3%
44.4%
24.6%
9.4%
8.7%
Oklahoma Teachers
Retirement System
OTRS
オクラホマ
Jun-14
45.7%
16.6%
62.3%
20.4%
2.6%
4.4%
Oklahoma Public Employees
Retirement System
OKPERS
オクラホマ
Jun-14
45.5%
24.7%
70.2%
29.5%
Oregon Public Employees
Retirement System
ORPERS
オレゴン
Jun-14
40.6%
21.0%
5.5%
3.6%
Others
48.1%
14.9%
5.6%
Risk
Parity
9.0%
2.0%
2.0%
9.3%
3.6%
7.5%
5.4%
6.5%
2.6%
18.7%
2.9%
4.3%
4.5%
5.1%
3.2%
8.1%
9.5%
2.3%
1.0%
4.9%
2.1%
6.9%
5.8%
0.3%
3.0%
29.1%
7.7%
Risk Mitigation 4.15%, Liquidity 9.73%,
Income 22.35%, Real Return 6.17%,
Global Growth 56.61%, Others 0.99%
28.1%
1.2%
Inflation Linked Assets 2.0%,
Opportunistic Credit 21.3%,
Emerging Markets Debt 1.8%
26.7%
Opportunistic Funds 0.3%,
Bons, Cash & Mortgages 21.4%
24.1%
9.3%
27.6%
0.3%
4.1%
19.7%
12.5%
32.9%
2.5%
Multi-Asset Strategies 12.5%,
Opportunistic Investyments 0.3%
4.8%
21.7%
4.6%
MLPs 4.77%,
Timber 1.07%
23.1%
2.9%
0.0%
27.2%
3.8%
8.8%
17.0%
0.3%
0.3%
1.1%
11.2%
11.8%
9.2%
1.2%
3.8%
Collateral from Securities Lending
9.3%,
Mortgages 0.7%
3.0%
10.6%
9.2%
備考
15.5%
10.7%
3.2%
Cash /
Shortterm
Credit Strategies 4.1%
MLPs 8.8%,
Opportunistic 1.2%
0.3%
20.8%
97
10.4%
1.2%
1.4%
33.8%
4.6%
Alternative Equity 10%,
Opportunity Portfolio 1.2%
Date
US
Equity
Non-US
Equity
ペンシルバ
ニア
Jun-14
9.5%
10.1%
PA-SERS
ペンシルバ
ニア
Dec-13
Employees’ Retirement
System of Rhode Island
ERSRI
ロードアイ
ランド
Jun-14
South Carolina Public
Employee Benefit Authority
SCPEBA
サウスカロ
ライナ
South Dakota Retirement
Systems
SDRS
Tennessee Consolidated
Retirement System
TCRS
名称
略称
州
Pennsylvania Public School
Employees’ Retirement
System
PAPSERS
Commonwealth of
Pennsylvania State
Employees’ Retirement
System
24.6%
18.8%
EM
Equity
5.9%
<Equity
Total>
Core
Fixed
Income
NonCore
Fixed
Income
<Fixed
Income
Total>
19.6%
19.3%
35.7%
14.7%
49.3%
14.1%
5.1%
19.2%
Jun-14
30.8%
8.7%
14.4%
サウスダコ
タ
Jun-14
テネシー
Jun-14
35.6%
18.3%
Teacher Retirement System
TRSTX
of Texas
テキサス
Aug-14
22.7%
14.9%
Texas Municipal Retirement
System
TMRS
テキサス
Dec-13
24.6%
20.9%
Texas County & District
Retirement System
TCDRS
テキサス
Employees Retirement
System of Texas
ERS-TX
Utah Retirement Systems
Real
Estate
Hedge Alternati
Real
Fund /
ve
Assets Absolute Investm
Return
ents
Risk
Parity
18.5%
14.2%
9.8%
4.1%
15.6%
8.9%
3.6%
8.3%
43.6%
19.3%
9.0%
14.3%
1.0%
4.3%
58.2%
27.1%
5.7%
1.4%
5.3%
11.8%
49.4%
8.8%
4.8%
11.8%
4.9%
テキサス
Aug-14
52.2%
URS
ユタ
Dec-13
37.6%
Virginia Retirement System
VRS
バージニア
Jun-14
Washington State
Investment Board
WSIB
ワシントン
Jun-14
West Virginia Investment
Management Board
WVIMB
ウェスト
バージニア
Jun-13
State of Wisconsin
Investment Board
SWIB
Core
Fund
ウィスコン
シン
Dec-14
48.8%
23.7%
Wyoming Retirement System WYRS
ワイオミン
グ
Dec-13
54.0%
26.3%
5.5%
43.6%
18.5%
39.3%
4.9%
14.4%
38.0%
51.1%
6.5%
3.5%
12.1%
9.8%
4.0%
1.5%
23.2%
9.0%
5.2%
15.9%
11.0%
12.2%
32.9%
7.8%
25.1%
22.3%
12.4%
9.7%
8.2%
7.9%
6.8%
1.9%
6.8%
10.6%
10.3%
24.6%
0.8%
8.3%
4.4%
Others
<Alterna
tives
Total>
Cash /
Shortterm
7.8%
56.8%
4.3%
Private Debt 2.4%,
Commodities 4.0%,
Master Limited Partnerships 3.8%
6.9%
44.9%
4.8%
Diversifying Assets 12.0%
8.3%
28.0%
3.8%
Equity-Alternative 8.3%,
Infrastructure 0.0%
7.8%
39.2%
6.7%
Private Debt 5.7%,
Commodities 2.1%,
GTAA/Risk Parity 10.6%
24.3%
12.8%
1.4%
13.8%
0.9%
Strategic Lending 1.4%
2.0%
40.5%
1.3%
Directional HF 4.9%,Stable Value HF
3.8%,, absolute return 1.6%
Energy & Natural Resources 1.9%,
Commodities 0.1%
7.2%
8.0%
6.4%
48.6%
0.5%
Opportunistic Credit 8.3%, Distresse
Debt 2.5%, Direct Lending 0.9%,
REITs 2.9%, MLP 2.0%,
Commodities 1.5%
3.8%
23.2%
1.5%
Public Real Estate 2.59%,
Private Fixed Income 0.19%,
Directional Growth 1.02%
39.9%
6.6%
3.7%
22.6%
0.9%
Emerging Market Debt 3.7%, Credit
10.7%, Convertibles 3.7%,
Strategic Opportunities 0.6%
0.4%
36.7%
0.2%
Tangible Assets 1.63%,
Innovation 0.44%
30.0%
0.3%
<PERS>
26.7%
0.8%
<Core Fund>
Multi-Asset 5.3%
18.0%
1.8%
16.7%
10.5%
0.6%
1.6%
10.2%
5.3%
8.4%
出所:各基金アニュアルレポートまたはホームページより年金シニアプラン総合研究機構作成
98
Opportu
nity
3.2%
7.6%
18.6%
0.2%
11.6%
2.4%
GTAA
22.4%
23.1%
41.1%
25.7%
Private
Equiy
6.4%
Dec-13
25.4%
Real
Return
3.1%
39.3%
17.2%
Inflation
6.7%
45.5%
20.9%
TIPS
9.6%
備考
Arbitrage / Aggressive Absolute Return
1.0%,
Commodities 0.0%
[図表 4-3]
名称
略称
州
R eti rement Sy s tems of A l a ba ma
R SA
アラバマ
(Teachers’ Retirement System)
<TR S>
<アラバマ>
(Employees’ Retirement System)
<ER S>
(Judicial Retirement Fund)
主要米地方公務員年金のパフォーマンス
決算月
F Y 2008
F Y 2009
F Y 2010
F Y 2011
F Y 2012
F Y 2013
3-Yea rs
5-Yea rs
10-Yea rs
F Y2014
3-Yea rs
5-Yea rs
10-Yea rs
↓
-
-
-
-
-
-
-
-
-
-
-
-
-
9月
△7.94%
8.42%
1.81%
18.30%
14.93%
11.45%
6.68%
6.29%
<アラバマ>
9月
△10.03%
8.47%
2.21%
18.01%
14.60%
11.40%
6.17%
5.97%
<J R F >
<アラバマ>
9月
0.69%
10.73%
0.45%
19.01%
14.05%
10.89%
8.74%
7.06%
A l a s k a R eti rement Ma na g ement
B oa rd
( PE R S, TR S)
A R MB
アラスカ
↓
-
-
-
-
-
-
-
-
-
-
-
-
-
(Public Employees’ Retirement System)
<PER S>
<アラスカ>
6月
△3.05%
△20.62%
11.58%
21.40%
0.51%
12.59%
11.15%
3.98%
-
18.56%
10.25%
12.58%
-
(Teachers’ Retirement System)
<TR S>
<アラスカ>
6月
△3.06%
△20.49%
11.39%
21.22%
0.46%
12.50%
11.05%
3.92%
-
18.46%
10.26%
12.66%
-
A ri zona Sta te R eti rement Sy s tem
A SR S
アリゾナ
6月
△7.60%
△18.10%
14.90%
24.60%
1.30%
13.10%
12.60%
5.90%
7.40%
18.60%
10.80%
14.20%
7.50%
Publ i c Sa f ety Pers onnel R eti rement
Sy s tem
PSPR S
アリゾナ
6月
△7.27%
△17.73%
13.47%
17.37%
△0.79%
10.64%
8.82%
3.75%
5.89%
A rk a ns a s Tea cher R eti rement
Sy s tem
A TR S
アーカンソー
6月
△3.70%
△18.00%
13.50%
22.30%
△0.90%
14.30%
11.50%
5.20%
-
Ca l i f orni a Publ i c E mpl oy ees ’
R eti rement Sy s tem
Ca l PE R S
カリフォルニア
6月
△5.10%
△24.00%
13.30%
21.80%
0.10%
13.20%
11.30%
3.50%
7.10%
18.40%
10.40%
12.50%
7.20%
Ca l i f orni a Sta te Tea chers ’
R eti rement Sy s tem
Ca l STR S
カリフォルニア
6月
△3.69%
△25.03%
12.20%
23.10%
1.84%
13.80%
12.57%
3.72%
7.53%
18.66%
11.21%
13.69%
7.65%
Los A ng el es Ci ty E mpl oy ees ’
R eti rement Sy s tem
LA CE R S
カリフォルニア
6月
△5.70%
△19.60%
12.90%
20.20%
1.10%
14.30%
12.30%
5.20%
-
Ora ng e County E mpl oy ees
R eti rement Sy s tem
OCE R S
カリフォルニア
12月
△20.71%
18.52%
11.70%
0.74%
12.26%
11.14%
7.93%
10.72%
-
99
決算月
F Y 2008
F Y 2009
F Y 2010
F Y 2011
F Y 2012
F Y 2013
3-Yea rs
5-Yea rs
10-Yea rs
F Y2014
3-Yea rs
5-Yea rs
10-Yea rs
カリフォルニア
6月
△4.66%
△19.20%
13.40%
24.20%
0.90%
13.60%
12.50%
5.50%
8.10%
16.80%
10.20%
13.50%
7.80%
SCE R S
カリフォルニア
6月
△4.80%
△22.10%
13.50%
22.30%
0.50%
13.20%
11.90%
4.30%
-
16.10%
9.50%
12.70%
-
Contra Cos ta County E mpl oy ees ’
R eti rement A s s oci a ti on
CCCE R A
カリフォルニア
12月
△26.50%
21.90%
14.00%
2.70%
14.10%
16.50%
11.00%
13.70%
8.10%
Sa n D i eg o County E mpl oy ees
R eti rement A s s oci a ti on
SD CE R A
カリフォルニア
6月
0.70%
△24.40%
13.00%
20.70%
5.89%
7.73%
11.25%
3.27%
7.95%
13.44%
8.97%
12.05%
7.18%
Wa ter a nd Pow er E mpl oy ees ’
R eti rement, D i s a bi l i ty a nd D ea th
B enef i t Ins ura nce Pl a n
LA D WP
カリフォルニア
6月
△4.20%
△15.10%
12.20%
19.51%
0.43%
12.83%
10.64%
5.22%
-
A l a meda County E mpl oy ees ’
R eti rement A s s oci a ti on
A CE R A
カリフォルニア
12月
△38.80%
26.60%
18.60%
△0.40%
15.00%
20.20%
11.30%
14.80%
-
Los A ng el es County E mpl oy ees
R eti rement A s s oci a ti on
LA CE R A
カリフォルニア
6月
△1.50%
△18.30%
11.60%
20.20%
0.10%
11.90%
10.40%
4.20%
-
16.83%
9.50%
12.07%
7.89%
Sa n F ra nci s co E mpl oy ees ’
R eti rement Sy s tem
SF E R S
カリフォルニア
6月
△3.13%
△21.98%
12.55%
21.84%
1.67%
13.01%
11.87%
4.19%
7.69%
U ni v ers i ty of Ca l i f orni a R eti rement
Pl a n
U CR P
カリフォルニア
6月
△18.81%
12.72%
22.45%
0.37%
11.71%
-
4.67%
6.62%
17.42%
9.60%
12.69%
6.91%
Col ora do Publ i c E mpl oy ees '
R eti rement A s s oci a ti on
COPE R A
コロラド
Connecti cut Tea chers ' R eti rement
B oa rd
CTTR B
D el a w a re Publ i c E mpl oy ees '
R eti rement Sy s tem
名称
略称
州
Sa n D i eg o Ci ty E mpl oy ees ’
R eti rement Sy s tem
SD CE R S
Sa cra mento County E mpl oy ees ’
R eti rement Sy s tem
12月
△26.00%
17.40%
14.00%
1.90%
12.90%
15.60%
9.90%
12.20%
7.60%
コネチカット
6月
△4.77%
△17.14%
12.87%
20.77%
△0.96%
11.83%
10.18%
4.58%
7.04%
15.67%
8.60%
11.79%
7.07%
D PE R S
デラウェア
6月
△1.30%
△15.50%
14.40%
24.30%
2.00%
11.10%
12.10%
6.40%
8.40%
17.50%
10.00%
13.60%
8.50%
D i s tri ct of Col umbi a R eti rement
B oa rd
D CR B
コロンビア特別
州
9月
△16.90%
△2.20%
10.30%
2.90%
14.50%
11.30%
9.50%
7.20%
6.80%
F l ori da R eti rement Sy s tem
FRS
フロリダ
6月
△4.42%
△19.03%
14.03%
22.09%
0.29%
13.12%
11.47%
5.04%
7.45%
100
決算月
F Y 2008
F Y 2009
F Y 2010
F Y 2011
F Y 2012
F Y 2013
3-Yea rs
5-Yea rs
10-Yea rs
F Y2014
3-Yea rs
5-Yea rs
10-Yea rs
△13.06%
11.09%
21.27%
2.16%
13.28%
11.96%
6.27%
6.55%
17.17%
10.69%
12.81%
7.24%
21.29%
2.19%
13.33%
12.00%
6.30%
6.56%
11.96%
21.25%
△0.14%
11.98%
10.68%
4.59%
-
△16.00%
12.40%
20.70%
1.60%
9.10%
10.20%
4.80%
7.80%
17.20%
9.10%
12.00%
7.80%
△5.00%
△22.70%
12.90%
23.60%
0.80%
12.80%
12.00%
4.20%
7.20%
17.40%
10.10%
13.20%
7.30%
名称
略称
州
Tea chers R eti rement Sy s tem of
Georg i a
TR S-GA
ジョージア
6月
E mpl oy ees ' R eti rement Sy s tem of
Georg i a
E R S-GA
ジョージア
6月
E mpl oy ees ' R eti rement Sy s tem of
Sta te of H a w a i i
H IE R S
ハワイ
6月
△3.51%
△17.54%
Publ i c E mpl oy ee R eti rement Sy s tem
PE R SI
of Ida ho
アイダホ
6月
△4.20%
Tea chers ’ R eti rement Sy s tem of the
ILTR S
Sta te of Il l i noi s
イリノイ
6月
Il l i noi s Muni ci pa l R eti rement F und
IMR F
イリノイ
12月
△24.97%
24.28%
13.36%
△0.50%
13.51%
19.99%
10.68%
13.82%
-
Il l i noi s Sta te B oa rd of Inv es tment
ISB I
イリノイ
6月
△1.33%
△16.27%
13.82%
19.91%
3.73%
10.12%
11.06%
5.48%
7.78%
17.90%
10.40%
12.30%
6.70%
Publ i c School Tea chers ’ Pens i on
a nd R eti rement F und of Chi ca g o
CTPF
イリノイ
6月
△5.30%
△22.00%
13.60%
24.80%
0.60%
13.30%
12.40%
4.60%
7.00%
18.40%
10.50%
13.80%
7.30%
County E mpl oy ees ’ a nd Of f i cers ’
A nnui ty a nd B enef i t F und of Cook
County
CCPF
イリノイ
12月
18.00%
12.40%
1.20%
12.50%
15.10%
9.40%
11.70%
-
Sta te U ni v ers i ti es R eti rement
Sy s tem of Il l i noi s
ILSU R S
イリノイ
6月
△4.50%
△19.70%
15.00%
23.80%
0.50%
12.50%
11.80%
5.30%
7.70%
18.20%
10.10%
13.70%
7.80%
Indi a na Publ i c R eti rement Sy s tem
IN PR S
インディアナ
6月
△7.60%
△20.60%
13.90%
19.90%
0.70%
6.00%
8.40%
3.00%
-
13.70%
6.70%
10.50%
-
Iow a Publ i c E mpl oy ees ' R eti rement
Sy s tem
IPE R S
アイオワ
6月
△1.33%
△16.27%
13.82%
19.91%
3.73%
10.12%
11.06%
5.48%
7.78%
15.88%
9.80%
12.56%
7.93%
Ka ns a s Publ i c E mpl oy ee R eti rement
KPE R S
Sy s tem
カンザス
6月
△4.40%
△19.40%
14.90%
22.60%
1.00%
14.00%
12.20%
5.50%
7.90%
18.40%
10.90%
14.00%
8.20%
Tea chers ’ R eti rement Sy s tem of the
KTR S
Sta te of Kentuck y
ケンタッキー
6月
△5.70%
△14.30%
13.10%
21.60%
2.40%
14.10%
12.40%
6.60%
6.40%
Tea chers ’ R eti rement Sy s tem of
Loui s i a na
ルイジアナ
6月
△4.80%
△22.30%
12.60%
26.80%
0.10%
13.90%
13.10%
4.80%
-
19.90%
11.00%
14.30%
8.20%
TR SL
101
決算月
F Y 2008
F Y 2009
F Y 2010
F Y 2011
F Y 2012
F Y 2013
3-Yea rs
5-Yea rs
10-Yea rs
F Y2014
3-Yea rs
5-Yea rs
10-Yea rs
ルイジアナ
6月
△3.80%
△19.10%
16.10%
24.30%
0.20%
12.60%
11.90%
5.70%
8.20%
18.80%
10.20%
14.10%
8.30%
Ma i ne Publ i c E mpl oy ees R eti rement
ME PE R S
Sy s tem
メイン
6月
△3.10%
△18.80%
11.10%
22.40%
0.60%
11.10%
11.00%
4.30%
6.90%
16.70%
9.30%
12.10%
6.90%
Ma ry l a nd Sta te R eti rement a nd
Pens i on Sy s tem
MD SPR S
メリーランド
6月
△5.40%
△20.00%
14.03%
20.04%
0.36%
10.57%
10.03%
3.97%
6.62%
14.37%
8.26%
11.67%
6.45%
Ma s s a chus etts Pens i on R es erv es
Inv es tment Ma na g ement B oa rd
MA PR IM
マサチューセッ
ツ
6月
△1.81%
△23.87%
12.86%
22.30%
△0.08%
12.73%
11.30%
3.43%
8.12%
17.60%
9.83%
12.85%
7.94%
Mi chi g a n Publ i c School E mpl oy ees '
R eti rement Sy s tem
MPSE R S
ミシガン
9月
△12.30%
△6.10%
8.80%
6.60%
13.50%
12.50%
10.80%
6.80%
7.40%
Mi chi g a n Muni ci pa l E mpl oy ees ’
R eti rement Sy s tem
ME R S
ミシガン
12月
17.31%
14.43%
2.30%
11.39%
15.00%
9.43%
11.96%
7.19%
Mi nnes ota Sta te R eti rement Sy s tem MSR S
ミネソタ
6月
△5.00%
△19.60%
15.20%
23.30%
2.40%
14.20%
13.00%
6.20%
8.20%
18.60%
11.50%
14.50%
8.40%
Publ i c E mpl oy ees ' R eti rement
Sy s tem of Mi s s i s s i ppi
MSPE R S
ミシシッピ
6月
△8.20%
△19.40%
14.10%
25.40%
0.60%
13.40%
12.70%
5.60%
-
18.60%
10.60%
14.10%
-
Publ i c School a nd Publ i c E duca ti on
E mpl oy ee R eti rement Sy s tems of
Mi s s ouri
PSR S
/PE E R S
ミズーリ
↓
-
-
-
-
-
-
-
-
-
16.90%
10.30%
13.10%
7.10%
(Public School Retirement Systems of
Missouri)
PSR S
<ミズーリ>
6月
△4.60%
△19.30%
13.00%
21.80%
1.90%
12.64%
11.80%
5.00%
6.70%
(Public Education Employee Retirement
Systems of Missouri)
PEER S
<ミズーリ>
6月
△4.60%
△18.90%
12.70%
21.40%
1.60%
12.30%
11.50%
4.80%
6.60%
Mi s s ouri Sta te E mpl oy ees ’
R eti rement Sy s tem
MOSE R S
ミズーリ
6月
1.60%
△19.10%
14.30%
21.00%
2.20%
10.40%
10.90%
4.80%
8.40%
19.20%
10.40%
13.20%
8.60%
Mi s s ouri Loca l Gov ernment
E mpl oy ees R eti rement Sy s tem
LA GE R S
ミズーリ
6月
16.20%
23.20%
3.58%
14.54%
13.48%
6.56%
8.44%
19.04%
12.20%
15.01%
8.68%
名称
略称
州
Loui s i a na Sta te E mpl oy ees '
R eti rement Sy s tem
LA SE R S
102
名称
略称
州
Monta na Publ i c E mpl oy ees
R eti rement A dmi ni s tra ti on
MPE R A
モンタナ
( Publ i c Empl oy ees ’ R eti rement
Sy s tem-Def i ned B enef i t Pl a n)
PER S-DB R P <モンタナ>
N ebra s k a Inv es tment Counci l D B
PLA N
N E IC
ネブラスカ
Publ i c E mpl oy ees ’ R eti rement
Sy s tem of N ev a da
N V PE R S
N ew H a mps hi re R eti rement Sy s tem
決算月
F Y 2008
F Y 2009
F Y 2010
F Y 2011
F Y 2012
F Y 2013
3-Yea rs
5-Yea rs
10-Yea rs
F Y2014
3-Yea rs
5-Yea rs
10-Yea rs
↓
-
-
-
-
-
-
-
-
-
-
-
-
-
21.79%
2.41%
13.04%
6月
12月
△27.80%
22.10%
13.40%
0.00%
12.90%
18.30%
10.30%
13.20%
7.10%
ネバダ
6月
△3.20%
△15.60%
11.00%
21.10%
3.10%
12.40%
11.90%
5.60%
6.90%
NHRS
ニューハンプ
シャー
6月
△4.60%
△17.90%
13.20%
23.00%
0.90%
14.50%
12.40%
5.60%
7.20%
17.60%
10.70%
13.50%
7.50%
N ew J ers ey Sta te Inv es tment
Counci l
N J SIC
ニュージャー
ジー
6月
△2.61%
△15.48%
13.35%
18.03%
2.52%
11.78%
10.59%
5.32%
7.26%
16.87%
10.23%
12.37%
7.51%
Sta te of N ew Mex i co E duca ti ona l
R eti rement B oa rd
N ME R B
ニューメキシコ
6月
△6.20%
△17.30%
18.20%
18.30%
2.00%
11.00%
10.70%
5.80%
7.60%
14.60%
9.10%
12.90%
7.50%
Publ i c E mpl oy ees R eti rement
a s s oci a ti on N ew Mex i co
N MPE R A
ニューメキシコ
6月
△7.40%
△24.11%
15.02%
22.50%
△0.38%
13.26%
11.39%
3.82%
-
N ew York Sta te a nd Loca l
R eti rement Sy s tem
N YSLR S
ニューヨーク
3月
2.56%
△26.38%
26.87%
14.57%
5.96%
10.38%
9.75%
13.78%
7.26%
13.02%
9.75%
13.78%
7.26%
N ew York Ci ty E mpl oy ees '
R eti rement Sy s tem
N YCE R S
ニューヨーク
6月
△4.96%
△18.18%
14.09%
23.12%
1.32%
12.24%
11.87%
5.50%
7.45%
17.04%
10.00%
13.33%
7.52%
N orth Ca rol i na R eti rement Sy s tem
D i v i s i on
N CR S
ノースカロライ
ナ
6月
△2.10%
△14.20%
12.00%
18.50%
2.21%
9.50%
9.90%
5.00%
6.60%
School E mpl oy ees R eti rement
Sy s tem of Ohi o
OH SE R S
オハイオ
6月
△5.70%
△22.40%
11.50%
19.90%
0.10%
12.90%
10.70%
3.30%
6.60%
17.30%
9.90%
12.10%
6.70%
Ohi o Pol i ce & F i re Pens i on F und
OP&F
オハイオ
12月
△28.06%
20.73%
15.83%
2.56%
14.89%
16.94%
11.45%
14.13%
-
103
名称
略称
州
決算月
F Y 2008
F Y 2009
F Y 2010
F Y 2011
F Y 2012
F Y 2013
3-Yea rs
5-Yea rs
10-Yea rs
F Y2014
3-Yea rs
5-Yea rs
10-Yea rs
Sta te Tea chers R eti rement Sy s tem
of Ohi o
STR SOH
オハイオ
6月
△5.44%
△21.66%
13.54%
22.59%
2.34%
13.66%
-
4.87%
7.60%
16.83%
10.77%
13.60%
7.60%
Ohi o Publ i c E mpl oy ees R eti rement
Sy s tem
OPE R S
オハイオ
12月
19.09%
13.98%
0.36%
14.54%
14.38%
9.55%
12.28%
-
14.00%
9.33%
12.31%
7.14%
Ok l a homa Tea chers R eti rement
Sy s tem
OTR S
オクラホマ
6月
△7.20%
△15.54%
16.60%
23.50%
1.80%
17.80%
14.00%
7.70%
-
22.40%
13.60%
16.10%
-
Ok l a homa Publ i c E mpl oy ees
R eti rement Sy s tem
OKPE R S
オクラホマ
6月
△4.17%
△15.40%
13.81%
21.20%
2.44%
12.00%
11.60%
6.00%
-
18.00%
10.64%
13.32%
-
Oreg on Publ i c E mpl oy ees
R eti rement Sy s tem
OR PE R S
オレゴン
6月
△3.80%
△22.30%
17.00%
22.30%
1.60%
12.70%
11.90%
5.00%
-
16.60%
10.10%
13.80%
-
Penns y l v a ni a Publ i c School
E mpl oy ees ’ R eti rement Sy s tem
PA -PSE R S
ペンシルバニア
6月
△2.82%
△26.54%
14.59%
20.37%
3.43%
7.96%
10.36%
2.50%
7.72%
14.91%
8.66%
12.09%
7.28%
Commonw ea l th of Penns y l v a ni a
Sta te E mpl oy ees ’ R eti rement
Sy s tem
PA -SE R S
ペンシルバニア
12月
△28.70%
9.10%
11.90%
2.70%
12.00%
13.60%
9.30%
9.80%
7.40%
E mpl oy ees ’ R eti rement Sy s tem of
R hode Is l a nd
E R SR I
ロードアイランド
6月
△19.20%
13.50%
20.40%
5.30%
11.07%
10.64%
4.34%
7.42%
15.12%
9.05%
12.05%
7.00%
South Ca rol i na Publ i c E mpl oy ee
B enef i t A uthori ty
SCPE B A
サウスカロライ
ナ
6月
△2.56%
△19.60%
14.62%
18.59%
0.61%
9.99%
9.30%
3.76%
-
15.29%
8.37%
11.48%
-
South D a k ota R eti rement Sy s tems
SD R S
サウスダコタ
6月
△9.00%
△20.89%
17.99%
25.18%
1.45%
19.02%
14.76%
7.12%
8.73%
18.90%
Tennes s ee Cons ol i da ted R eti rement
TCR S
Sy s tem
テネシー
6月
△1.21%
△15.27%
10.24%
19.59%
5.61%
9.92%
11.56%
5.33%
-
16.65%
10.64%
12.29%
-
Tea cher R eti rement Sy s tem of
Tex a s
テキサス
8月
△2.10%
△21.90%
15.60%
22.20%
2.70%
10.20%
11.40%
4.60%
7.20%
16.30%
9.60%
13.20%
7.30%
Tex a s Muni ci pa l R eti rement Sy s tem TMR S
テキサス
12月
△1.30%
10.20%
9.00%
2.41%
10.11%
9.86%
7.40%
8.29%
7.14%
Tex a s County & D i s tri ct R eti rement
TCD R S
Sy s tem
テキサス
12月
12.80%
△1.00%
12.60%
16.40%
9.00%
13.10%
6.90%
E mpl oy ees R eti rement Sy s tem of
Tex a s
テキサス
8月
6.65%
12.58%
8.22%
10.07%
10.28%
5.96%
-
14.70%
10.96%
10.41%
-
TR STX
E R S-TX
△4.58%
△6.60%
104
名称
略称
州
U ta h R eti rement Sy s tems
URS
ユタ
V i rg i ni a R eti rement Sy s tem
VRS
バージニア
6月
Wa s hi ng ton Sta te Inv es tment B oa rd
WSIB
ワシントン
6月
Wes t V i rg i ni a Inv es tment
Ma na g ement B oa rd
WV IMB
ウェストバージ
ニア
↓
Public Employees’ Retirement System
<PER S>
<ウェストバージ
ニア>
6月
Sta te of Wi s cons i n Inv es tment
B oa rd
SWIB
Core F und
ウィスコンシン
6月
△4.50%
△17.70%
13.30%
Wy omi ng R eti rement Sy s tem
WYR S
ワイオミング
12月
△29.63%
23.80%
13.50%
決算月
F Y 2008
12月
△4.40%
-
F Y 2009
F Y 2010
F Y 2011
F Y 2012
F Y 2013
3-Yea rs
5-Yea rs
10-Yea rs
F Y2014
3-Yea rs
5-Yea rs
10-Yea rs
12.88%
13.73%
2.89%
13.10%
14.89%
10.13%
11.33%
7.38%
△21.10%
14.10%
19.10%
1.40%
11.80%
10.50%
4.00%
-
15.70%
9.50%
12.30%
-
△22.84%
13.22%
21.14%
1.40%
12.36%
11.33%
3.81%
-
17.06%
10.07%
12.83%
8.35%
-
-
-
-
-
-
-
-
-
-
-
-
1.10%
13.10%
11.30%
6.20%
7.60%
22.90%
1.30%
11.10%
-
5.20%
7.80%
△1.20%
13.70%
13.20%
8.40%
12.20%
6.00%
出所:各基金アニュアルレポートまたはホームページより年金シニアプラン総合研究機構作成
105
[図表 4-4] 主要米地方公務員年金のファンディング比率推移
名称
略称
州
R eti rement Sy s tems of A l a ba ma
R SA
アラバマ
(Teachers’ Retirement System)
<TR S>
(Employees’ Retirement System)
F Y 2001
F Y 2002
F Y 2003
F Y 2004
F Y 2005
F Y 2006
F Y 2007
F Y 2008
F Y 2009
F Y 2010
F Y 2011
F Y 2012
F Y 2013
F Y 2014
-
-
-
-
-
-
-
-
-
-
-
-
-
-
<アラバマ>
89.6%
83.6%
82.8%
79.5%
77.6%
74.7%
71.1%
67.5%
66.5%
<ER S>
<アラバマ>
89.7%
84.0%
81.1%
79.0%
75.7%
72.2%
68.2%
65.8%
65.7%
A l a s k a R eti rement Ma na g ement
B oa rd
( PE R S, TR S)
A R MB
アラスカ
-
(Public Employees’ Retirement System)
<PER S>
(Teachers’ Retirement System)
-
-
-
-
-
-
-
-
-
-
-
-
-
<アラスカ>
75.2%
72.8%
70.2%
65.7%
62.8%
68.0%
69.5%
61.8%
61.5%
63.0%
61.3%
60.8%
<TR S>
<アラスカ>
68.2%
64.3%
62.8%
60.9%
57.3%
61.5%
64.8%
57.0%
53.6%
54.1%
52.1%
51.9%
A ri zona Sta te R eti rement Sy s tem
A SR S
アリゾナ
106.4%
98.4%
92.5%
86.1%
84.3%
83.3%
82.1%
79.0%
76.4%
75.5%
75.3%
75.4%
76.3%
Publ i c Sa f ety Pers onnel R eti rement
Sy s tem
PSPR S
アリゾナ
126.9%
113.0%
100.9%
92.4%
81.3%
76.7%
65.2%
68.8%
70.0%
67.7%
63.7%
60.2%
58.7%
49.2%
A rk a ns a s Tea cher R eti rement
Sy s tem
A TR S
アーカンソー
95.4%
91.9%
85.9%
83.8%
80.4%
80.3%
85.3%
84.9%
75.7%
73.8%
71.8%
71.2%
73.3%
Ca l i f orni a Publ i c E mpl oy ees ’
R eti rement Sy s tem
Ca l PE R S
カリフォルニア
111.9%
95.2%
87.7%
87.3%
87.3%
87.2%
87.2%
86.9%
83.3%
83.4%
82.6%
83.1%
75.2%
Ca l i f orni a Sta te Tea chers ’
R eti rement Sy s tem
Ca l STR S
カリフォルニア
98.0%
84.8%
84.7%
85.7%
87.0%
87.6%
87.3%
78.2%
71.5%
69.1%
67.0%
66.9%
Los A ng el es Ci ty E mpl oy ees ’
R eti rement Sy s tem
LA CE R S
カリフォルニア
91.4%
82.5%
77.2%
77.8%
81.7%
84.4%
79.5%
75.9%
72.4%
69.0%
68.7%
Ora ng e County E mpl oy ees
R eti rement Sy s tem
OCE R S
カリフォルニア
78.5%
70.9%
71.5%
73.8%
74.1%
71.3%
68.8%
69.8%
67.0%
62.5%
66.0%
106
名称
略称
州
F Y 2001
F Y 2002
F Y 2003
F Y 2004
F Y 2005
F Y 2006
F Y 2007
F Y 2008
F Y 2009
F Y 2010
F Y 2011
F Y 2012
F Y 2013
F Y 2014
Sa n D i eg o Ci ty E mpl oy ees ’
R eti rement Sy s tem
SD CE R S
カリフォルニア
-
-
-
-
-
-
-
-
-
-
-
-
-
-
(City of San Diego)
<Ci ty >
<カリフォルニア>
67.2%
65.8%
68.2%
79.9%
78.8%
78.1%
66.5%
67.1%
68.5%
68.6%
70.4%
(Unified Port District)
<Port>
<カリフォルニア>
80.3%
80.6%
82.6%
92.1%
93.5%
92.0%
77.5%
75.3%
73.1%
72.7%
73.7%
(Airport Authority)
<A i rport>
<カリフォルニア>
68.4%
68.8%
87.6%
111.7%
109.0%
102.3%
86.9%
96.0%
102.7%
98.5%
93.4%
Sa cra mento County E mpl oy ees ’
R eti rement Sy s tem
SCE R S
カリフォルニア
94.1%
93.3%
93.2%
93.0%
93.4%
93.2%
86.0%
87.7%
87.0%
83.3%
82.8%
85.2%
Contra Cos ta County E mpl oy ees ’
R eti rement A s s oci a ti on
CCCE R A
カリフォルニア
85.4%
82.0%
84.8%
84.3%
89.9%
88.5%
83.8%
80.3%
78.5%
70.6%
Sa n D i eg o County E mpl oy ees
R eti rement A s s oci a ti on
SD CE R A
カリフォルニア
75.5%
81.1%
80.3%
83.6%
89.7%
94.4%
91.5%
84.3%
81.5%
78.7%
79.0%
80.9%
Wa ter a nd Pow er E mpl oy ees ’
R eti rement, D i s a bi l i ty a nd D ea th
B enef i t Ins ura nce Pl a n
LA D WP
カリフォルニア
93.6%
91.5%
91.9%
95.1%
90.0%
81.5%
80.3%
78.1%
78.8%
80.9%
A l a meda County E mpl oy ees ’
R eti rement A s s oci a ti on
A CE R A
カリフォルニア
Los A ng el es County E mpl oy ees
R eti rement A s s oci a ti on
LA CE R A
カリフォルニア
Sa n F ra nci s co E mpl oy ees ’
R eti rement Sy s tem
SF E R S
U ni v ers i ty of Ca l i f orni a R eti rement
Pl a n
89.6%
92.5%
86.9%
82.1%
83.2%
85.5%
89.2%
83.9%
81.2%
77.5%
76.6%
73.9%
75.9%
99.4%
87.2%
82.8%
85.8%
90.5%
93.8%
94.5%
88.9%
83.3%
80.6%
76.8%
75.0%
カリフォルニア
103.8%
97.0%
91.1%
87.7%
82.6%
80.6%
U CR P
カリフォルニア
104.8%
103.0%
94.8%
86.7%
82.5%
78.7%
Col ora do Publ i c E mpl oy ees '
R eti rement A s s oci a ti on
COPE R A
コロラド
69.8%
68.9%
66.1%
61.2%
63.2%
61.5%
Connecti cut Tea chers ' R eti rement
B oa rd
CTTR B
コネチカット
79.4%
73.3%
66.9%
59.7%
53.9%
49.5%
51.5%
D el a w a re Publ i c E mpl oy ees '
R eti rement Sy s tem
D PE R S
デラウェア
103.1%
98.8%
96.0%
94.0%
91.5%
91.1%
95.8%
100.0%
98.6%
112.4%
88.3%
109.6%
75.6%
106.9%
70.6%
103.0%
73.3%
101.6%
107
74.1%
101.7%
75.1%
103.7%
名称
略称
州
F Y 2001
F Y 2002
F Y 2003
F Y 2004
F Y 2005
F Y 2006
F Y 2007
F Y 2008
F Y 2009
F Y 2010
F Y 2011
F Y 2012
F Y 2013
F Y 2014
D i s tri ct of Col umbi a R eti rement
B oa rd
D CR B
コロンビア特別
州
-
-
-
-
-
-
-
-
-
-
-
-
-
-
(District of Columbia Teachers’
Retirement Fund)
<TR F >
<コロンビア特別
州>
111.2%
111.6%
108.2%
110.8%
118.3%
101.9%
94.4%
(District of Columbia Police Officers and
Firefighters’ Retirement Fund)
<POF R F >
<コロンビア特別
州>
91.6%
101.0%
99.8%
100.7%
108.0%
108.6%
110.1%
F l ori da R eti rement Sy s tem
FRS
フロリダ
Tea chers R eti rement Sy s tem of
Georg i a
TR S-GA
ジョージア
E mpl oy ees ' R eti rement Sy s tem of
Georg i a
E R S-GA
ジョージア
E mpl oy ees ' R eti rement Sy s tem of
Sta te of H a w a i i
H IE R S
ハワイ
117.9%
115.0%
114.2%
112.1%
107.3%
105.6%
105.7%
105.4%
87.1%
86.6%
86.9%
86.4%
85.4%
102.0%
101.1%
100.9%
98.0%
96.5%
94.7%
91.9%
89.9%
85.7%
84.0%
82.3%
81.1%
97.2%
94.5%
93.0%
89.4%
85.7%
80.1%
76.0%
73.1%
75.9%
71.7%
68.6%
65.0%
67.5%
68.8%
64.6%
61.4%
59.4%
59.2%
60.0%
Publ i c E mpl oy ee R eti rement Sy s tem
PE R SI
of Ida ho
アイダホ
97.2%
84.9%
83.8%
91.7%
94.2%
95.2%
105.5%
93.3%
74.1%
78.9%
90.2%
84.7%
85.3%
Tea chers ’ R eti rement Sy s tem of the
ILTR S
Sta te of Il l i noi s
イリノイ
59.5%
52.0%
49.3%
61.9%
60.8%
62.0%
63.8%
56.0%
52.1%
48.4%
46.5%
42.1%
40.6%
Il l i noi s Muni ci pa l R eti rement F und
IMR F
イリノイ
106.4%
101.5%
97.6%
94.3%
94.6%
95.3%
96.1%
84.3%
83.2%
83.3%
83.0%
84.3%
87.6%
Il l i noi s Sta te B oa rd of Inv es tment
ISB I
イリノイ
-
-
-
-
-
-
-
-
-
-
-
-
-
-
(State Employees’ Retirement System of
Illinois)
<ILSER S>
<イリノイ>
65.8%
53.7%
42.6%
54.2%
54.4%
52.2%
54.2%
46.1%
43.5%
37.4%
35.6%
34.7%
34.2%
33.7%
Publ i c School Tea chers ’ Pens i on
a nd R eti rement F und of Chi ca g o
CTPF
イリノイ
92.0%
85.9%
79.0%
78.0%
80.1%
79.4%
73.3%
66.9%
59.7%
53.9%
49.5%
51.5%
County E mpl oy ees ’ a nd Of f i cers ’
A nnui ty a nd B enef i t F und of Cook
County
CCPF
イリノイ
70.9%
75.8%
84.6%
85.9%
79.6%
69.2%
66.4%
62.5%
61.5%
108
40.6%
名称
略称
州
Sta te U ni v ers i ti es R eti rement
Sy s tem of Il l i noi s
ILSU R S
イリノイ
Indi a na Publ i c R eti rement Sy s tem
IN PR S
インディアナ
( Publ i c Empl oy ees ’ R eti rement
F und)
<PER F >
<インディアナ>
Iow a Publ i c E mpl oy ees ' R eti rement
Sy s tem
IPE R S
アイオワ
Ka ns a s Publ i c E mpl oy ee R eti rement
KPE R S
Sy s tem
カンザス
Tea chers ’ R eti rement Sy s tem of the
KTR S
Sta te of Kentuck y
Tea chers ’ R eti rement Sy s tem of
Loui s i a na
Loui s i a na Sta te E mpl oy ees '
R eti rement Sy s tem
F Y 2001
F Y 2002
F Y 2003
F Y 2004
F Y 2005
F Y 2006
F Y 2007
F Y 2008
F Y 2009
F Y 2010
F Y 2011
F Y 2012
F Y 2013
F Y 2014
72.1%
58.9%
53.9%
66.0%
65.6%
65.4%
68.4%
58.5%
54.3%
46.4%
44.3%
42.1%
41.5%
42.3%
-
-
-
-
-
-
-
-
-
-
-
-
-
-
99.2%
102.9%
100.1%
96.4%
97.6%
98.2%
97.5%
93.1%
85.2%
80.5%
76.6%
80.2%
84.3%
81.4%
79.9%
79.9%
81.0%
82.7%
68.8%
69.4%
70.8%
58.8%
63.7%
62.2%
59.2%
56.4%
ケンタッキー
86.3%
73.1%
71.9%
68.2%
63.6%
61.0%
57.4%
54.5%
51.9%
TR SL
ルイジアナ
64.6%
67.5%
71.3%
70.2%
59.1%
54.4%
55.1%
55.4%
56.4%
57.4%
LA SE R S
ルイジアナ
74.2%
70.2%
66.2%
59.6%
61.5%
64.3%
67.2%
67.6%
60.8%
57.7%
57.6%
55.9%
60.2%
59.3%
Ma i ne Publ i c E mpl oy ees R eti rement
ME PE R S
Sy s tem
メイン
76.0%
74.7%
74.4%
74.7%
76.0%
77.1%
79.7%
79.7%
72.6%
70.4%
80.2%
79.1%
79.6%
83.2%
Ma ry l a nd Sta te R eti rement a nd
Pens i on Sy s tem
MD SPR S
メリーランド
98.3%
94.7%
93.3%
92.2%
88.2%
82.8%
80.4%
78.6%
65.0%
64.1%
64.7%
64.4%
65.5%
68.7%
Ma s s a chus etts Pens i on R es erv es
Inv es tment Ma na g ement B oa rd
MA PR IM
マサチューセッ
ツ
82.1%
81.1%
68.9%
73.9%
72.3%
71.5%
75.2%
78.6%
62.7%
67.5%
71.1%
65.1%
60.6%
61.2%
Mi chi g a n Publ i c School E mpl oy ees '
R eti rement Sy s tem
MPSE R S
ミシガン
96.5%
91.5%
86.5%
83.7%
79.3%
87.5%
88.7%
83.6%
78.9%
71.1%
64.7%
61.3%
Mi chi g a n Muni ci pa l E mpl oy ees ’
R eti rement Sy s tem
ME R S
ミシガン
95.4%
90.3%
93.9%
75.2%
69.8%
109
名称
略称
州
Mi nnes ota Sta te R eti rement Sy s tem MSR S
ミネソタ
( Sta te Empl oy ees R eti rement F und)
<SER F >
<ミネソタ>
Publ i c E mpl oy ees ' R eti rement
Sy s tem of Mi s s i s s i ppi
MSPE R S
ミシシッピ
F Y 2001
F Y 2002
F Y 2003
F Y 2004
F Y 2005
F Y 2006
F Y 2007
F Y 2008
F Y 2009
F Y 2010
F Y 2011
F Y 2012
F Y 2013
F Y 2014
-
-
-
-
-
-
-
-
-
-
-
-
-
-
90.2%
85.9%
87.3%
86.3%
82.7%
82.0%
83.0%
-
-
-
-
-
-
-
-
-
-
-
-
-
-
87.5%
83.4%
79.0%
74.9%
72.4%
73.5%
73.7%
72.9%
67.3%
64.2%
62.2%
58.0%
57.7%
61.0%
-
-
-
-
-
-
-
-
-
-
-
-
-
-
(Public Employees’ Retirement System of
<PER S>
Mississippi)
<ミシシッピ>
Publ i c School a nd Publ i c E duca ti on
E mpl oy ee R eti rement Sy s tems of
Mi s s ouri
PSR S
/PE E R S
ミズーリ
(Public School Retirement Systems of
Missouri)
PSR S
<ミズーリ>
95.3%
81.1%
82.0%
82.7%
82.6%
83.5%
83.4%
79.9%
77.7%
85.5%
81.5%
80.1%
(Public Education Employee Retirement
Systems of Missouri)
PEER S
<ミズーリ>
97.6%
81.9%
82.7%
83.3%
80.5%
83.2%
82.5%
80.7%
79.1%
85.3%
82.5%
81.6%
Mi s s ouri Sta te E mpl oy ees ’
R eti rement Sy s tem
MOSE R S
ミズーリ
95.9%
90.9%
84.6%
84.9%
85.3%
86.8%
85.9%
83.0%
80.4%
79.2%
73.2%
72.7%
75.1%
Mi s s ouri Loca l Gov ernment
E mpl oy ees R eti rement Sy s tem
LA GE R S
ミズーリ
95.1%
95.3%
96.1%
97.5%
80.0%
81.0%
81.6%
83.5%
86.5%
91.7%
Monta na Publ i c E mpl oy ees
R eti rement A dmi ni s tra ti on
MPE R A
モンタナ
-
-
-
-
-
-
-
-
-
-
-
86.7%
85.5%
88.3%
91.1%
90.3%
83.5%
74.2%
70.3%
67.4%
80.2%
97.0%
-
-
-
( Publ i c Empl oy ees ’ R eti rement
<PER SSy s tem-Def i ned B enef i t R eti rement
DB R P>
Pl a n)
<モンタナ>
N ebra s k a Inv es tment Counci l D B
PLA N
ネブラスカ
9.3%
87.7%
86.0%
87.6%
90.9%
90.9%
86.9%
82.7%
80.7%
76.9%
77.3%
(School Retirement System of the State of
<School >
Nebraska)
<ネブラスカ>
90.6%
87.2%
85.6%
87.2%
90.5%
90.6%
82.0%
82.4%
80.4%
76.6%
77.1%
(Nebraska State Patrol Retirement
System)
<Pa trol >
<ネブラスカ>
101.9%
97.3%
93.2%
94.7%
95.9%
93.5%
89.8%
84.8%
82.3%
78.2%
76.0%
(Nebraska Judges’ Retirement System)
<J udg es >
<ネブラスカ>
108.2%
95.8%
96.0%
99.0%
106.7%
105.3%
101.7%
100.0%
97.7%
92.0%
87.8%
N E IC
110
F Y 2012
F Y 2013
F Y 2014
71.0%
69.3%
71.5%
-
-
-
-
58.8%
54.3%
49.1%
71.2%
77.3%
77.0%
74.5%
70.8%
63.8%
67.1%
62.8%
59.3%
70.5%
71.5%
67.5%
65.7%
63.0%
60.7%
60.1%
92.1%
92.8%
93.3%
84.2%
78.5%
70.5%
65.3%
72.9%
-
-
-
-
-
-
-
-
-
<ニューヨーク>
102.8%
104.1%
105.8%
107.3%
101.0%
93.9%
90.2%
87.2%
88.5%
(New York State and Local Police and Fire
<PF R S>
Retirement System)
<ニューヨーク>
104.8%
105.2%
106.5%
108.0%
103.8%
96.7%
91.9%
87.9%
89.5%
N ew York Ci ty E mpl oy ees '
R eti rement Sy s tem
ニューヨーク
82.3%
79.0%
79.7%
78.6%
64.2%
65.0%
66.3%
68.4%
F Y 2007
F Y 2008
F Y 2009
F Y 2010
Publ i c E mpl oy ees ’ R eti rement
Sy s tem of N ev a da
N V PE R S
ネバダ
N ew H a mps hi re R eti rement Sy s tem
NHRS
ニューハンプ
シャー
N ew J ers ey Sta te Inv es tment
Counci l
N J SIC
ニュージャー
ジー
-
-
-
-
-
-
-
-
-
-
(Public Employees' Retirement System
<STATE>)
<STA TE>
<ニュージャー
ジー>
112.5%
102.9%
90.7%
84.7%
79.1%
72.1%
68.8%
65.6%
56.4%
(Public Employees' Retirement System
<LOCAL>)
<LOCA L>
<ニュージャー
ジー>
120.3%
110.5%
103.3%
96.1%
89.9%
82.4%
81.3%
78.6%
(Teachers' Pension and Annuity Fund)
<TEA CH ER >
<ニュージャー
ジー>
108.0%
100.0%
92.7%
85.6%
79.1%
76.3%
74.7%
Sta te of N ew Mex i co E duca ti ona l
R eti rement B oa rd
N ME R B
ニューメキシコ
81.1%
75.4%
70.4%
68.3%
Publ i c E mpl oy ees R eti rement
a s s oci a ti on N ew Mex i co
N MPE R A
ニューメキシコ
97.3%
93.0%
91.6%
N ew York Sta te a nd Loca l
R eti rement Sy s tem
N YSLR S
ニューヨーク
-
-
(New York State and Local Employees’
Retirement System)
<ER S>
-
F Y 2003
F Y 2006
州
-
F Y 2002
F Y 2005
略称
N YCE R S
F Y 2001
F Y 2004
名称
111
F Y 2011
-
名称
略称
州
F Y 2001
F Y 2002
F Y 2003
F Y 2004
F Y 2005
F Y 2006
F Y 2007
F Y 2008
F Y 2009
F Y 2010
F Y 2011
F Y 2012
F Y 2013
F Y 2014
N orth Ca rol i na R eti rement Sy s tem
D i v i s i on
N CR S
ノースカロライ
ナ
-
-
-
-
-
-
-
-
-
-
-
-
-
-
Teachers’ and State Employees’
Retirement System of North Carolina
<Tea cher>
<ノースカロライ
ナ>
111.6%
108.4%
108.1%
108.1%
106.5%
106.1%
104.7%
99.3%
95.9%
95.4%
94.0%
94.2%
Local Governmental Employees’
Retirement System of North Carolina
<Loca l >
<ノースカロライ
ナ>
99.3%
99.3%
99.4%
99.3%
99.4%
99.5%
99.5%
99.6%
99.5%
99.6%
99.8%
99.8%
Consolidated Judicial Retirement System
of North Carolina
<J udi ca l >
<ノースカロライ
ナ>
108.9%
107.4%
107.6%
108.6%
107.6%
107.3%
102.9%
98.1%
92.6%
91.6%
89.9%
91.2%
School E mpl oy ees R eti rement
Sy s tem of Ohi o
OH SE R S
オハイオ
83.6%
78.1%
75.3%
76.4%
80.8%
82.0%
68.4%
72.6%
65.2%
62.8%
65.3%
Ohi o Pol i ce & F i re Pens i on F und
OP&F
オハイオ
82.6%
86.5%
80.9%
78.3%
78.2%
81.7%
65.1%
72.8%
69.4%
63.1%
64.2%
Sta te Tea chers R eti rement Sy s tem
of Ohi o
STR SOH
オハイオ
74.2%
74.8%
72.8%
75.0%
82.2%
79.1%
60.0%
59.1%
58.8%
56.0%
66.3%
Ohi o Publ i c E mpl oy ees R eti rement
Sy s tem
OPE R S
オハイオ
102.6%
85.9%
85.3%
87.6%
87.2%
92.6%
96.3%
75.3%
75.3%
79.1%
77.4%
80.9%
Ok l a homa Tea chers R eti rement
Sy s tem
OTR S
オクラホマ
51.4%
51.4%
54.0%
47.3%
49.5%
49.3%
52.6%
50.5%
49.8%
47.9%
56.7%
54.8%
57.2%
63.2%
Ok l a homa Publ i c E mpl oy ees
R eti rement Sy s tem
OKPE R S
オクラホマ
82.6%
79.8%
76.8%
76.1%
72.0%
71.4%
72.6%
73.0%
66.8%
66.0%
80.7%
80.2%
81.6%
88.6%
Oreg on Publ i c E mpl oy ees
R eti rement Sy s tem
OR PE R S
オレゴン
106.7%
91.0%
97.0%
96.2%
104.2%
110.5%
112.2%
80.2%
85.8%
86.9%
82.0%
90.7%
95.9%
Penns y l v a ni a Publ i c School
E mpl oy ees ’ R eti rement Sy s tem
PA -PSE R S
ペンシルバニア
104.8%
97.2%
91.2%
83.6%
81.2%
85.8%
86.0%
79.2%
75.1%
69.1%
66.3%
63.8%
Commonw ea l th of Penns y l v a ni a
Sta te E mpl oy ees ’ R eti rement
Sy s tem
PA -SE R S
ペンシルバニア
107.2%
104.9%
96.1%
92.9%
92.7%
97.1%
89.0%
84.4%
75.2%
65.3%
58.8%
59.2%
89.4%
116.3%
92.8%
112
名称
略称
州
F Y 2001
F Y 2002
F Y 2003
F Y 2004
F Y 2005
F Y 2006
F Y 2007
F Y 2008
F Y 2009
F Y 2010
F Y 2011
F Y 2012
F Y 2013
F Y 2014
E mpl oy ees ’ R eti rement Sy s tem of
R hode Is l a nd
E R SR I
ロードアイランド
-
-
-
-
-
-
-
-
-
-
-
-
-
-
(State Employees)
<Sta te>
<ロードアイラン
ド>
71.7%
64.5%
59.6%
56.3%
54.6%
57.5%
62.3%
59.0%
59.8%
57.4%
56.3%
(Teachers)
<Tea cher>
<ロードアイラン
ド>
73.2%
64.2%
59.3%
55.4%
52.7%
55.4%
61.0%
58.1%
61.8%
59.7%
58.8%
South Ca rol i na Publ i c E mpl oy ee
B enef i t A uthori ty
SCPE B A
サウスカロライ
ナ
-
-
-
-
-
-
-
-
-
-
-
-
-
(The South Carolina Retirement System)
<SCR S>
<サウスカロライ
ナ>
86.0%
82.8%
80.3%
71.6%
69.6%
69.7%
69.3%
67.8%
65.5%
67.4%
64.7%
62.5%
South D a k ota R eti rement Sy s tems
SD R S
サウスダコタ
97.2%
97.7%
96.6%
96.7%
97.1%
97.2%
91.8%
96.3%
96.4%
92.6%
100.0%
100.0%
-
-
-
-
-
-
-
-
-
-
-
-
80.2%
-
Tennes s ee Cons ol i da ted R eti rement
TCR S
Sy s tem
テネシー
(the State Employees, Teachers, Higher
Education Employees Pension Plan)
<SETH EEPP
>
<テネシー>
99.6%
99.8%
99.8%
96.2%
90.6%
92.1%
(Political Subdivision Pension Plan)
<PSPP>
<テネシー>
90.4%
91.9%
92.7%
89.5%
86.3%
89.2%
Tea cher R eti rement Sy s tem of
Tex a s
TR STX
テキサス
102.5%
Tex a s Muni ci pa l R eti rement Sy s tem TMR S
テキサス
Tex a s County & D i s tri ct R eti rement
TCD R S
Sy s tem
テキサス
E mpl oy ees R eti rement Sy s tem of
Tex a s
E R S-TX
テキサス
U ta h R eti rement Sy s tems
URS
ユタ
V i rg i ni a R eti rement Sy s tem
VRS
バージニア
-
104.3%
-
96.3%
102.8%
94.5%
91.8%
87.1%
87.3%
89.2%
90.5%
83.1%
82.9%
82.7%
81.9%
80.8%
82.6%
82.8%
82.7%
82.1%
73.7%
74.4%
75.8%
82.9%
85.1%
87.2%
84.1%
91.4%
94.3%
94.3%
88.6%
9.8%
89.4%
88.8%
88.2%
89.4%
92.2%
97.3%
94.8%
95.2%
95.6%
92.6%
87.4%
83.2%
82.6%
81.0%
77.4%
77.2%
94.4%
92.3%
93.2%
95.8%
95.1%
86.5%
85.7%
82.7%
79.0%
76.4%
79.6%
90.3%
81.3%
80.8%
82.3%
84.0%
80.2%
72.4%
69.9%
65.8%
65.9%
113
名称
略称
州
F Y 2001
F Y 2002
F Y 2003
F Y 2004
F Y 2005
F Y 2006
F Y 2007
F Y 2008
F Y 2009
F Y 2010
F Y 2011
F Y 2012
F Y 2013
F Y 2014
Wa s hi ng ton Sta te Inv es tment B oa rd
WSIB
ワシントン
-
-
-
-
-
-
-
-
-
-
-
-
-
-
(Public Employees’ Retirement System
Plan1)
PER S Pl a n1
<ワシントン>
70.9%
69.9%
74.1%
70.7%
68.9%
(Public Employees’ Retirement System
Plan2/3)
PER S
Pl a n2/3
<ワシントン>
101.1%
99.3%
97.2%
97.1%
99.4%
Wes t V i rg i ni a Inv es tment
Ma na g ement B oa rd
WV IMB
ウェストバージ
ニア
-
-
-
-
-
-
-
-
-
-
-
-
-
-
(Public Employees’ Retirement System)
<WV PER S>
<ウェストバージ
ニア>
84.4%
75.4%
73.1%
80.0%
83.6%
86.6%
97.0%
84.2%
79.7%
74.6%
78.4%
77.6%
(Teachers' Retirement System)
<WV TR S>
<ウェストバージ
ニア>
21.0%
19.2%
19.1%
22.2%
24.6%
31.6%
51.3%
50.0%
41.3%
46.5%
53.7%
53.0%
Sta te of Wi s cons i n Inv es tment
B oa rd
SWIB
ウィスコンシン
96.5%
97.1%
99.2%
99.4%
99.5%
99.6%
99.6%
99.7%
99.8%
99.8%
99.9%
99.9%
99.9%
Wy omi ng R eti rement Sy s tem
WYR S
ワイオミング
92.2%
91.7%
85.0%
95.1%
94.4%
94.0%
78.6%
87.5%
84.6%
81.9%
78.6%
出所:各基金アニュアルレポートまたはホームページより年金シニアプラン総合研究機構作成
114
77.6%
[図表 4-5] 主要米地方公務員年金のその他情報
T o t al
T o t al
In ve st m e n t
Be n e fic iar ie s
(0 0 0 )
(In ac t ive
M e m be r )
(Ac t ive
M e m be r )
名称
略称
州
Web Si te
R eti rement Sy s tems of A l a ba ma
R SA
アラバマ
http://www.rsa-al.gov/
(Teachers’ Retirement System)
<TR S>
<アラバマ>
101,374
82,806
18,568
133,791
20,570,766
(Employees’ Retirement System)
<ER S>
<アラバマ>
53,651
43,097
10,554
84,169
9,976,495
(Judicial Retirement Fund)
<J R F >
<アラバマ>
392
347
45
337
253,002
A l a s k a R eti rement Ma na g ement
B oa rd
A R MB
アラスカ
(Public Employees’ Retirement System)
<PER S>
<アラスカ>
40,347
20,955
19,392
29,865
155,432,460
(Teachers’ Retirement System)
<TR S>
<アラスカ>
10,272
6,845
3,427
11,301
11,565,438
A ri zona Sta te R eti rement Sy s tem
A SR S
アリゾナ
https://www.azasrs.gov/
418,526
203,201
215,325
126,255
35,451,114
Publ i c Sa f ety Pers onnel R eti rement
Sy s tem
PSPR S
アリゾナ
http://www.psprs.com/
21,648
18,526
3,122
10,524
5,392,261
A rk a ns a s Tea cher R eti rement
Sy s tem
A TR S
アーカンソー
https://www.artrs.gov/
88,024
70,660
17,364
36,254
12,780,633
Ca l i f orni a Publ i c E mpl oy ees ’
R eti rement Sy s tem
Ca l PE R S
カリフォルニア
http://www.calpers.ca.gov/
1,129,014
776,429
352,585
586,959
301,483,905
Ca l i f orni a Sta te Tea chers ’
R eti rement Sy s tem
Ca l STR S
カリフォルニア
http://www.calstrs.com/
603,702
420,887
182,815
275,627
189,080,000
Los A ng el es Ci ty E mpl oy ees ’
R eti rement Sy s tem
LA CE R S
カリフォルニア
http://www.lacers.org/
25,272
24,411
861
13,592
12,781,114
M e m be r sh ip
http://doa.alaska.gov/drb/
115
(Ac t ive
M e m be r )
T o t al
T o t al
In ve st m e n t
Be n e fic iar ie s
(0 0 0 )
(In ac t ive
M e m be r )
名称
略称
州
Web Si te
Ora ng e County E mpl oy ees
R eti rement Sy s tem
OCE R S
カリフォルニア
http://www.ocers.org/
25,981
21,368
4,613
14,505
10,537,305
Sa n D i eg o Ci ty E mpl oy ees ’
R eti rement Sy s tem
SD CE R S
カリフォルニア
https://www.sdcers.org/
12,442
8,016
4,426
8,407
6,768,783
Sa cra mento County E mpl oy ees ’
R eti rement Sy s tem
SCE R S
カリフォルニア
http://www.retirement.saccounty.net/
25,299
12,049
13,250
10,049
7,810,001
Contra Cos ta County E mpl oy ees ’
R eti rement A s s oci a ti on
CCCE R A
カリフォルニア
http://www.cccera.org/
10,928
8,640
2,288
6,375
6,837,749
Sa n D i eg o County E mpl oy ees
R eti rement A s s oci a ti on
SD CE R A
カリフォルニア
https://www.sdcers.org/
21,891
16,891
5,000
15,820
10,185,438
Wa ter a nd Pow er E mpl oy ees ’
R eti rement, D i s a bi l i ty a nd D ea th
B enef i t Ins ura nce Pl a n
LA D WP
カリフォルニア
http://retirement.ladwp.com/
10,444
8,960
1,484
8,739
8,254,000
A l a meda County E mpl oy ees ’
R eti rement A s s oci a ti on
A CE R A
カリフォルニア
http://www.acera.org/
12,778
10,867
1,911
8,576
6,611,994
Los A ng el es County E mpl oy ees
R eti rement A s s oci a ti on
LA CE R A
カリフォルニア
http://www.lacera.com/
100,556
92,466
8,090
59,223
49,033,365
Sa n F ra nci s co E mpl oy ees ’
R eti rement Sy s tem
SF E R S
カリフォルニア
http://sfers.org/
34,762
28,789
5,973
26,034
16,880,177
U ni v ers i ty of Ca l i f orni a R eti rement
Pl a n
U CR P
カリフォルニア
http://ucnet.universityofcalifornia.edu/compensation-andbenefits/retirement-benefits/ucrp/
198,797
120,568
78,229
64,191
52,783,867
Col ora do Publ i c E mpl oy ees '
R eti rement A s s oci a ti on
COPE R A
コロラド
https://www.copera.org/
408,393
200,183
208,210
104,021
44,114,647
Connecti cut Tea chers ' R eti rement
B oa rd
CTTR B
コネチカット
http://www.ct.gov/trb/
35,472
30,654
4,818
27,722
11,189,300
M e m be r sh ip
116
名称
略称
州
Web Si te
D el a w a re Publ i c E mpl oy ees '
R eti rement Sy s tem
D PE R S
デラウェア
http://www.delawarepensions.com/pensionPlan.shtml
D i s tri ct of Col umbi a R eti rement
B oa rd
D CR B
コロンビア特別
州
http://dcrb.dc.gov/
F l ori da R eti rement Sy s tem
FRS
フロリダ
Tea chers R eti rement Sy s tem of
Georg i a
TR S-GA
E mpl oy ees ' R eti rement Sy s tem of
Georg i a
E mpl oy ees ' R eti rement Sy s tem of
Sta te of H a w a i i
M e m be r sh ip
(Ac t ive
M e m be r )
T o t al
T o t al
In ve st m e n t
Be n e fic iar ie s
(0 0 0 )
(In ac t ive
M e m be r )
46,420
43,061
9,889
9,889
https://www.myfrs.com/
769,346
621,774
ジョージア
http://www.trsga.com/
304,604
209,855
E R S-GA
ジョージア
http://georgia.gov/agencies/employees-retirement-systemgeorgia
H IE R S
ハワイ
http://ers.ehawaii.gov/
73,538
66,226
7,312
41,812
12,210,349
Publ i c E mpl oy ee R eti rement Sy s tem
PE R SI
of Ida ho
アイダホ
http://www.persi.idaho.gov/
77,727
66,223
11,504
40,776
14,231,337
Tea chers ’ R eti rement Sy s tem of the
ILTR S
Sta te of Il l i noi s
イリノイ
http://trs.illinois.gov/
282,802
159,838
122,964
112,333
45,435,578
Il l i noi s Muni ci pa l R eti rement F und
IMR F
イリノイ
https://www.imrf.org/
291,860
173,826
118,034
107,732
33,248,000
Il l i noi s Sta te B oa rd of Inv es tment
ISB I
イリノイ
https://www.illinois.gov/isbi/
(State Employees’ Retirement System of
Illinois)
ILSER S
<イリノイ>
https://www.srs.illinois.gov/SERS/home_sers.htm
67,022
62,844
4,178
66,609
15,109,375
Publ i c School Tea chers ’ Pens i on
a nd R eti rement F und of Chi ca g o
CTPF
イリノイ
http://www.ctpf.org/
44,972
30,653
14,319
18,171
11,189,300
County E mpl oy ees ’ a nd Of f i cers ’
A nnui ty a nd B enef i t F und of Cook
County
CCPF
イリノイ
http://www.cookcountypension.com/
34,034
21,287
12,747
16,677
8,703,779
117
3,359
26,180
9,232,500
5,631
5,775,078
147,572
346,678
132,382,915
94,749
108,100
17,590,894
63,942
12,191,096
名称
略称
州
Web Si te
Sta te U ni v ers i ti es R eti rement
Sy s tem of Il l i noi s
ILSU R S
イリノイ
http://www.surs.com/
Indi a na Publ i c R eti rement Sy s tem
IN PR S
インディアナ
Iow a Publ i c E mpl oy ees ' R eti rement
Sy s tem
IPE R S
M e m be r sh ip
(Ac t ive
M e m be r )
T o t al
T o t al
In ve st m e n t
Be n e fic iar ie s
(0 0 0 )
(In ac t ive
M e m be r )
19,401
11,409
7,992
381
17,297,172
http://www.in.gov/inprs/
317,056
222,497
94,559
133,128
24,550,700
アイオワ
https://www.ipers.org/
248,128
175,861
72,267
98,285
27,976,000
Ka ns a s Publ i c E mpl oy ee R eti rement
KPE R S
Sy s tem
カンザス
http://www.kpers.org/
194,053
147,957
46,096
82,742
6,568,692
Tea chers ’ R eti rement Sy s tem of the
KTR S
Sta te of Kentuck y
ケンタッキー
http://ktrs.ky.gov/
82,025
74,831
7,194
47,406
16,149,837
Tea chers ’ R eti rement Sy s tem of
Loui s i a na
TR SL
ルイジアナ
http://www.trsl.org/
107,796
82,886
24,910
75,486
17,512,657
Loui s i a na Sta te E mpl oy ees '
R eti rement Sy s tem
LA SE R S
ルイジアナ
http://www.lasersonline.org/
96,921
40,321
56,600
46,940
11,506,396
Ma i ne Publ i c E mpl oy ees R eti rement
ME PE R S
Sy s tem
メイン
http://www.mainepers.org/
47,481
39,910
7,571
32,611
13,179,748
Ma ry l a nd Sta te R eti rement a nd
Pens i on Sy s tem
MD SPR S
メリーランド
http://www.sra.state.md.us/
245,655
193,522
52,133
142,887
45,415,551
Ma s s a chus etts Pens i on R es erv es
Inv es tment Ma na g ement B oa rd
MA PR IM
マサチューセッ
ツ
http://www.mapension.com/
88,156
88,156
56,327
62,501,717
Mi chi g a n Publ i c School E mpl oy ees '
R eti rement Sy s tem
MPSE R S
ミシガン
http://www.michigan.gov/orsschools
231,141
214,906
200,952
43,220,774
Mi chi g a n Muni ci pa l E mpl oy ees ’
R eti rement Sy s tem
ME R S
ミシガン
http://www.mersofmich.com/
34,187
34,187
29,739
8,374,774
118
16,235
名称
略称
州
Web Si te
Mi nnes ota Sta te R eti rement Sy s tem MSR S
ミネソタ
https://www.msrs.state.mn.us/
Publ i c E mpl oy ees ' R eti rement
Sy s tem of Mi s s i s s i ppi
ミシシッピ
http://www.pers.ms.gov/
MSPE R S
M e m be r sh ip
79,411
(Ac t ive
M e m be r )
55,365
T o t al
T o t al
In ve st m e n t
Be n e fic iar ie s
(0 0 0 )
(In ac t ive
M e m be r )
24,046
38,941
11,187,051
24,921,062
(Public Employees’ Retirement System of
<PER S>
Mississippi)
<ミシシッピ>
Publ i c School a nd Publ i c E duca ti on
E mpl oy ee R eti rement Sy s tems of
Mi s s ouri
PSR S
/PE E R S
ミズーリ
(Public School Retirement Systems of
Missouri)
<PSR S>
<ミズーリ>
89,619
75,168
14,451
54,486
36,968,599
(Public Education Employee Retirement
Systems of Missouri)
<PEER S>
<ミズーリ>
61,804
45,589
16,215
25,029
4,131,186
Mi s s ouri Sta te E mpl oy ees ’
R eti rement Sy s tem
MOSE R S
ミズーリ
https://www.mosers.org/
70,750
50,621
20,129
41,000
9,254,978
Mi s s ouri Loca l Gov ernment
E mpl oy ees R eti rement Sy s tem
LA GE R S
ミズーリ
http://www.molagers.org/
39,349
33,383
5,966
18,872
6,271,177
Monta na Publ i c E mpl oy ees
R eti rement A dmi ni s tra ti on
MPE R A
モンタナ
http://mpera.mt.gov/
(Public Employees’ Retirement SystemDefined Benefit Retirement Plan)
<PER SDB R P>
<モンタナ>
37,799
28,401
9,398
19,451
4,290,306
N ebra s k a Inv es tment Counci l D B
PLA N
N E IC
ネブラスカ
http://www.nic.ne.gov/
61,298
40,872
20,426
20,332
Publ i c E mpl oy ees ’ R eti rement
Sy s tem of N ev a da
N V PE R S
ネバダ
https://www.nvpers.org/
N ew H a mps hi re R eti rement Sy s tem
NHRS
ニューハンプ
シャー
http://www.nhrs.org/
57,706
48,307
9,399
31,054
293,913
161,360
132,553
93,504
https://www.psrs-peers.org/
41,099,786
119
7,334,000
(Ac t ive
M e m be r )
T o t al
T o t al
In ve st m e n t
Be n e fic iar ie s
(0 0 0 )
(In ac t ive
M e m be r )
名称
略称
州
Web Si te
N ew J ers ey Sta te Inv es tment
Counci l
N J SIC
ニュージャー
ジー
http://www.nj.gov/treasury/doinvest/sicreg.shtml
(Teachers’ Pension and Annuity Fund)
<TPA F >
<ニュージャー
ジー>
150,592
150,200
392
89,308
(Public Employees’ Retirement System)
<PER S>
<ニュージャー
ジー>
281,190
280,158
1,032
152,593
Sta te of N ew Mex i co E duca ti ona l
R eti rement B oa rd
N ME R B
ニューメキシコ
http://www.nmerb.org/
97,762
61,173
36,589
42,246
11,274,476
Publ i c E mpl oy ees R eti rement
a s s oci a ti on N ew Mex i co
N MPE R A
ニューメキシコ
http://www.pera.state.nm.us/
57,750
50,012
7,738
33,023
13,175,417
N ew York Sta te a nd Loca l
R eti rement Sy s tem
N YSLR S
ニューヨーク
http://www.osc.state.ny.us/retire/
(New York State and Local Employees’
Retirement System)
<ER S>
<ニューヨーク>
609,565
493,209
116,356
389,288
(New York State and Local Police and Fire
<PF R S>
Retirement System)
<ニューヨーク>
34,094
31,218
2,876
33,117
N ew York Ci ty E mpl oy ees '
R eti rement Sy s tem
N YCE R S
ニューヨーク
https://www.nycers.org/
212,347
187,114
25,233
137,987
60,761,863
N orth Ca rol i na R eti rement Sy s tem
D i v i s i on
N CR S
ノースカロライ
ナ
https://www.nctreasurer.com/
437,488
319,999
117,489
179,908
79,994,105
School E mpl oy ees R eti rement
Sy s tem of Ohi o
OH SE R S
オハイオ
http://www.ohsers.org/
121,251
121,251
72,605
11,905,578
Ohi o Pol i ce & F i re Pens i on F und
OP&F
オハイオ
https://www.op-f.org/
27,444
27,444
27,380
14,148,212
Sta te Tea chers R eti rement Sy s tem
of Ohi o
STR SOH
オハイオ
https://www.strsoh.org/
186,413
169,945
12,745
76,548,278
M e m be r sh ip
81,219,960
176,835,136
120
16,468
(Ac t ive
M e m be r )
T o t al
T o t al
In ve st m e n t
Be n e fic iar ie s
(0 0 0 )
(In ac t ive
M e m be r )
名称
略称
州
Web Si te
Ohi o Publ i c E mpl oy ees R eti rement
Sy s tem
OPE R S
オハイオ
https://www.opers.org/
831,248
347,727
483,521
196,594
74,599,002
Ok l a homa Tea chers R eti rement
Sy s tem
OTR S
オクラホマ
http://www.ok.gov/TRS/
100,274
89,570
10,704
56,389
88,470,993
Ok l a homa Publ i c E mpl oy ees
R eti rement Sy s tem
OKPE R S
オクラホマ
http://www.opers.ok.gov/
49,618
43,947
5,671
31,833
9,267,702
Oreg on Publ i c E mpl oy ees
R eti rement Sy s tem
OR PE R S
オレゴン
http://www.oregon.gov/PERS/
208,620
164,974
43,646
129,138
70,627,606
Penns y l v a ni a Publ i c School
E mpl oy ees ’ R eti rement Sy s tem
PA -PSE R S
ペンシルバニア
http://www.psers.state.pa.us/
286,339
267,428
18,911
209,204
52,676,605
Commonw ea l th of Penns y l v a ni a
Sta te E mpl oy ees ’ R eti rement
Sy s tem
PA -SE R S
ペンシルバニア
http://sers.pa.gov/
111,581
105,186
6,395
120,052
27,389,700
E mpl oy ees ’ R eti rement Sy s tem of
R hode Is l a nd
E R SR I
ロードアイランド
http://content.ersri.org/
29,861
24,378
5,483
21,822
8,215,449
South Ca rol i na Publ i c E mpl oy ee
B enef i t A uthori ty
SCPE B A
サウスカロライ
ナ
https://www.retirement.sc.gov/
(The South Carolina Retirement System)
<SCR S>
<サウスカロライ
ナ>
South D a k ota R eti rement Sy s tems
SD R S
サウスダコタ
http://www.sdrs.sd.gov/
Tennes s ee Cons ol i da ted R eti rement
TCR S
Sy s tem
テネシー
http://treasury.tn.gov/tcrs/
Tea cher R eti rement Sy s tem of
Tex a s
テキサス
http://www.trs.state.tx.us/
テキサス
http://www.tmrs.org/
TR STX
Tex a s Muni ci pa l R eti rement Sy s tem TMR S
M e m be r sh ip
29,578,595
121
340,921
184,690
156,231
127,696
25,540,648
54,943
38,951
15,992
24,562
10,602,389
297,822
214,060
83,762
133,290
42,643,140
1,051,425
991,971
59,454
363,182
132,216,000
152,907
145,448
7,459
45,580
23,868,363
名称
略称
(Ac t ive
M e m be r )
(In ac t ive
M e m be r )
T o t al
T o t al
In ve st m e n t
Be n e fic iar ie s
(0 0 0 )
州
Web Si te
Tex a s County & D i s tri ct R eti rement
TCD R S
Sy s tem
テキサス
https://www.tcdrs.org/
197,985
124,525
73,460
49,820
23,067,359
E mpl oy ees R eti rement Sy s tem of
Tex a s
E R S-TX
テキサス
http://www.ers.state.tx.us/
230,239
133,844
96,395
95,128
27,255,028
U ta h R eti rement Sy s tems
URS
ユタ
https://www.urs.org/
113,787
76,845
36,942
43,107
25,765,142
V i rg i ni a R eti rement Sy s tem
VRS
バージニア
http://www.varetire.org/
341,500
341,500
177,126
67,181,623
Wa s hi ng ton Sta te Inv es tment B oa rd
WSIB
ワシントン
www.sib.wa.gov/
(Public Employees’ Retirement System
Plan1)
PER S Pl a n1
<ワシントン>
6,635
6,635
52,672
(Public Employees’ Retirement System
Plan2)
PER S Pl a n2
<ワシントン>
115,877
115,877
27,820
(Public Employees’ Retirement System
Plan3)
PER S Pl a n3
<ワシントン>
28,078
28,078
1,750
Wes t V i rg i ni a Inv es tment
Ma na g ement B oa rd
WV IMB
ウェストバージ
ニア
http://www.wvimb.org/
West Virginia Consolidated Public
Retirement Board
<WV CPR B >
<ウェストバージ
ニア>
https://www.wvretirement.com/
36,573
36,573
23,460
4,848,377
Sta te of Wi s cons i n Inv es tment
B oa rd
SWIB
ウィスコンシン
http://www.swib.state.wi.us/
414,549
256,788
157,761
180,056
88,700,000
Wy omi ng R eti rement Sy s tem
WYR S
ワイオミング
http://retirement.state.wy.us/
61,127
36,354
24,773
22,731
7,536,046
M e m be r sh ip
88,208,531
出所:各基金アニュアルレポートまたはホームページより年金シニアプラン総合研究機構作成
122
参考文献
–
遠山勲(2014)
「米公務員年金の改革動向」みずほ年金レポート 2014 夏季号
–
企業年金連合会(2014)
「企業年金資産運用実態調査結果結果(2013 年度)の概要」
–
年金シニアプラン総合研究機構(2013)「インフラ投資に関する調査研究」
–
――――(2014)
「ヘッジファンド投資に関する調査研究」
–
Brown and Mclnnes(2014)“Shifting Public sector DB Plans to DC”
–
CalPERS(2010)“Roles of Asset Classes in Strategic Allocation”
–
―――― (2014)“CalPERS 2014-16 Business Plan”
–
CalSTRS(2014)“Investment Policy and Management Plan”
–
CEM Benchmarking(2014)“Asset Allocation and Fund Performance of Defined
Benefit Pension Funds in the United States between 1998-2011”
–
Center for Retirement Research(2006)“Why are Healthy Employers Freezing Their
Pensions?”
–
―――― (2011)“A Role for Defined Contribution Plans in the Public Sector”
–
― ― ― ― ( 2013 ) “State and Local Pension Costs: Pre-Crisis, Post-Crisis, and
Post-Reform”
–
―――― (2014)“Defined Contribution Plans in the Public Sector: an Update”
–
―――― (2014)“State Hybrid Plans in the United States”
–
Cliffwater(2011)“Allocations to Alternative Investments 2011 Survey”
–
―――― (2014)“Cliffwater 2014 Report on State Pension Asset Allocation and
Performance”
–
Investment Company Institute(2014)“2014 Investment Company Fact Book”
–
Milliman(2014)“2014 Public Pension Funding Study”
–
Missouri State Auditor(2014)“Survey of Public Employee Retirement Systems in
Missouri”
–
NASRA(2013)“State Hybrid Retirement Plans”
–
―――― (2014)“Shared-Risk in Public Retirement Plans “
–
National Conference of State Legislatures(2010)“State Defined Contribution and
Hybrid Pension Plans”
–
―――― (2011)“State Pension Reform, in 2010 and 2011”
–
―――― (2012)“State Pension Reform, 2009-2011”
–
Public Fund Survey(2013)“ Summary of Findings for FY 2012”
123
–
S&P(2014)“U.S. State Pension Funding: Strong Investment Returns Could Lift
Funded Ratios, But Longer-Term Challenges Remain”
–
Texas Pension Review Board ( 2012 ) “A Review of Defined Benefit, Defined
Contribution, and Alternative Retirement Plans”
–
Towers Watson(2013)“DB Versus DC Investment Returns: The 2009 – 2011 Update”
–
U.S. CENSUS BUREAU(2013)“2012 Annual Survey of Public Pensions: State- and
Locally-Administered Defined Benefit Data”
–
Utah Retirement System(2007)“Conversion from Defined Benefit Plan to Defined
Contribution Plan”
–
Wilshire Consulting (2014)“2014 Report on State Retirement Systems: Funding
Levels and Asset Allocation”
–
Wisconsin Legislative Council, “Comparative Study of Major Public Employee
Retirement Systems” 1998-2012
–
Wurts Associates(2013)“General Investment Consultant Finalist Presentation - San
Diego County Employees Retirement Association”
–
―――― (2014)“Risk Parity assessment - San Diego County Employees Retirement
Association”
124
「米地方公務員年金に関する調査研究」 (H26-2)
平成 27 年 3 月
(編集・発行)公益財団法人 年金シニアプラン総合研究機構
〒108-0074
東京都港区高輪 1 丁目 3 番 13 号
NBF 高輪ビル 4 階
電話 :
03-5793-9411 (年金シニアプラン総合研究機構 総務企画部 代表)
FAX :
03-5793-9413
URL :
http://www.nensoken.or.jp/
本書の全部または一部の複写・複製・転訳載および磁気または光記録媒体への入力等を禁じます。
これらの許諾につきましては年金シニアプラン総合研究機構までご照会ください。
© Copyright 2026 Paperzz